Back to Journals » Journal of Pain Research » Volume 15
Pain and Analgesic Utilization in Medically Underserved Areas: Five-Year Prevalence Study from the Rochester Epidemiology Project
Authors D'Souza RS ![]() , Eller J, Hoffmann C
, Eller J, Hoffmann C ![]()
Received 31 January 2022
Accepted for publication 23 April 2022
Published 3 May 2022 Volume 2022:15 Pages 1297—1304
DOI https://doi.org/10.2147/JPR.S360645
Checked for plagiarism Yes
Review by Single anonymous peer review
Peer reviewer comments 2
Editor who approved publication: Dr Robert Twillman
Ryan S D’Souza, Jennifer Eller, Chelsey Hoffmann
Department of Anesthesiology and Perioperative Medicine, Mayo Clinic, Rochester, MN, USA
Correspondence: Ryan S D’Souza, Department of Anesthesiology and Perioperative Medicine, Mayo Clinic, 200 First St SW, Rochester, MN, USA, Email [email protected]
Purpose: There is a paucity of data on pain diagnoses and analgesic utilization in medically underserved areas (MUAs). This study compared the prevalence of pain diagnoses and analgesic medication use between MUAs and non-medically underserved areas (N-MUAs) in Southern Minnesota and Western Wisconsin using the Rochester Epidemiology Project (REP) database.
Methods: Five-year prevalence per 100 people (January 1, 2011 to January 1, 2016) was extracted from the REP database for multiple pain diagnosis variables and analgesic medications. Primary outcomes included comparison of five-year prevalence of each pain diagnosis and analgesic between MUA and N-MUA; and association between index of medical underservice (IMU) score and five-year prevalence for each pain diagnosis and analgesic. Linear regression models were performed to assess associations and significance thresholds were adjusted per the Bonferroni approach to account for multiplicity.
Results: The prevalence per 100 people for a diagnosis of chronic pain was similar between MUAs and N-MUAs (13.8 ± 2.5 vs 14.6 ± 2.0, P = 0.543). Similarly, prevalence per 100 people for other specific pain diagnoses including nonspecific chest pain, abdominal pain, lumbago, somatoform disorder, and painful respiration did not differ based on MUA status. In terms of analgesic use, prevalence per 100 people for use of opioids, non-opioid analgesics, salicylates, and NSAIDs did not differ based on MUA status. An association between higher IMU scores and lower prevalence of painful respiration was identified, although this was not significant after significance threshold adjustment per the Bonferroni method.
Conclusion: Our data suggest that there are no differences in several pain diagnoses and analgesic utilization between MUAs versus N-MUAs, and that the IMU score did not predict changes in prevalence of pain diagnoses or analgesic utilization. Future powered and national database studies are warranted to increase validity of findings to other populations outside of Southern Minnesota and Western Wisconsin.
Keywords: medically underserved area, vulnerable populations, chronic pain, opioid, analgesia, pain management
Corrigendum for this paper has been published
Introduction
Chronic pain continues to place a significant burden on the United States’ healthcare system1 with a prevalence ranging between 11% and 40%.1 The Global Burden of Disease Study (2017) reported that low back pain and headache disorders are the prevailing etiologies of non-fatal health loss over the last three decades,2 contributing to morbidity, disability, and increasing demands on the healthcare system. Accompanying high chronic pain prevalence, studies also highlight that inadequate and ineffective pain management pose a serious public health crisis particularly in this era of the opioid epidemic.3 Thus, there has been an increasing emphasis on multimodal analgesia4–6 with use of non-opioid analgesics in addition to implementing personalized approaches to treating pain based on type, location, severity, and chronicity.4 Obstacles to effective pain management may include provider level of education and comfort with prescribing analgesics, cultural barriers in pain assessment, stringency and inconsistency across state prescription drug monitoring programs, and importantly lack of healthcare access.7–10
While it is undeniable that pain is ubiquitous and access to pain management may be challenging, these factors may impose a differential burden to different populations. There is strong evidence from the social determinants of health (SDOH) framework demonstrating an association between healthcare outcomes and social domains of economic stability, education quality, healthcare access and quality, neighborhood environment, and community context.10 In the context of pain, substantial disparities in pain prevalence and under-treatment exist across vulnerable populations such as older adults,11 children,12 patients with mental health problems,12 and ethnic minorities.13 Similarly, delivery of pain care may be disproportionately and inexplicably poor if a geographical area carries a designation of “medically underserved area” (MUA). It is known that patients who reside in MUAs are disadvantaged in terms of affordability, accessibility, and availability when seeking healthcare, yet there remains a paucity of data on prevalence of pain and analgesic utilization in MUAs.14
The primary aim of this study was to compare the prevalence of pain diagnoses and analgesic medication usage between MUAs and non-medically underserved areas (N-MUAs) in southern Minnesota and western Wisconsin using the Rochester Epidemiology Project (REP) database.15 This database captures summary-level information for approximately 680,000 individuals and related health conditions that have been addressed at participating healthcare providers for 27 counties in those respective regions.16 As aforementioned, evidence from the SDOH framework highlights that certain disadvantaged, vulnerable, and financially deprived subpopulations live in more degraded environments and experience a higher exposure of risk factors for adverse healthcare outcomes.17 Thus, we hypothesized that there would be an association between MUA status and higher prevalence of pain disorders and lower rates of analgesic prescriptions.
Methods
Ethics
The project was approved by the Mayo Clinic Institutional Review Board and conformed to principles per the Declaration of Helsinki. All patients who are part of the REP provided written informed consent for use of their medical records.
Source of Data
The REP database has been previously utilized to perform population-level epidemiological studies.15 The REP is a collaboration of clinics, hospitals, and other healthcare systems in Southern Minnesota and Western Wisconsin consisting of approximately 680,000 individuals across 27 counties. The database abstracts information including demographics, diagnostic and procedure codes, health services data, drug prescriptions, laboratory tests, imaging reports, and other clinical variables. The population comprising the REP database is representative of a large segment of the United States population based on demographic, racial, ethnic, and socioeconomic composition.16 We accessed the database using the REP data exploration portal (REP-DEP) which is publicly accessible on the following website: https://www.rochesterproject.org/portal/.18
Data Extraction
The authors queried the REP-DEP and abstracted data on September 9, 2021. At the time of data abstraction, the latest five-year period data available on the REP-DEP was from January 1, 2011 to January 1, 2016. Five-year prevalence per 100 people (January 1, 2011 to January 1, 2016) were extracted for the following “pain diagnosis” variables: chronic pain, nonspecific chest pain, abdominal pain, lumbago, somatoform disorder, and painful respiration. Similarly, five-year prevalence per 100 people (January 1, 2011 to January 1, 2016) were extracted for the following “analgesic use” variables: opioid, non-opioid analgesic, salicylate, and non-steroidal anti-inflammatory drug (NSAID). For the secondary subgroup analysis, five-year prevalence per 100 people (January 1, 2011 to January 1, 2016) were extracted for the following “pain diagnosis” variables related to spine-related pain only: lumbago, spondylosis, intervertebral disc disorder, cervical radiculitis, lumbar spinal stenosis, sciatica, thoracic/lumbosacral radiculitis, and backache.
The authors queried Health Resources and Services Administration (HRSA) website (https://data.hrsa.gov/tools/shortage-area/mua-find) by searching each of the 27 counties that comprise the REP database. The Index of Medical Underservice (IMU) was abstracted for each of the 27 counties from the HRSA website. The IMU scale ranges from 0 to 100, where 0 signifies “completely underserved” while 100 signifies “least underserved” or “best served.” The IMU score incorporates the following weighted variables into its calculation: ratio of primary medical care physicians per 1000 persons, infant mortality rate, percent of population with incomes below poverty level, and percent of population age 65 or older. An IMU score threshold of 62.0 or less was used to designate MUA status (MUA status if IMU score ≤62, N-MUA status if IMU score >62). Based on established criteria, the HRSA specified this IMU threshold of 62.0 to designate MUA status.19
Primary Outcomes of Interest
The primary outcome of interest was comparison of five-year prevalence of pain diagnoses and analgesic use between MUA and N-MUA. Another primary outcome of interest was to determine if there was any association between IMU score and five-year prevalence for pain diagnoses and analgesic use.
Secondary Outcomes of Interest
A subgroup analysis, which was planned a priori, was also performed for pain diagnoses specific to spine-related issues. The motivation for this secondary analysis stems from the high prevalence and morbidity from back and neck pain. Low back pain is the most common musculoskeletal problem globally.20 The Global Burden of Disease Study reported that back and neck pain were ranked the fourth leading cause of disability-adjusted life years (DALYs) globally following ischemic heart disease, cerebrovascular disease, and lower respiratory infection.21 Specifically, one secondary outcome was comparison of five-year prevalence of spine-related pain diagnoses between MUA and N-MUA. Another secondary outcome was association between IMU score and five-year prevalence for spine-related pain diagnoses.
Statistical Analysis
Mean and standard deviations are provided for all continuous variables and stratified based on MUA status. Linear regression analysis was performed to compare outcomes based on MUA status. Linear regression analysis was also performed to identify the association between the IMU score and variables related to pain symptoms and analgesic use. Beta-coefficient (β) and 95% C.I. (confidence interval) are reported for each association. A p<0.05 was considered the threshold for statistical significance. Given that multiple comparisons and statistical tests were performed, we adjusted significance thresholds based on the Bonferroni method.22 All analyses were performed using SPSS (IBM SPSS Statistics for Windows, Version 21.0; Armonk, NY: IBM Corp.).
Results
Study Cohorts Based on MUA Status
Based on the pre-specified threshold to define MUA status from the IMU score (≤62), we stratified the 27 counties from the REP database (Figure 1) to those that are N-MUA (5 counties: Le Sueur, Steele, Goodhue, Olmsted, La Crosse) and those that are MUA (22 counties: Brown, Watonwan, Martin, Nicollet, Blue Earth, Faribault, Waseca, Freeborn, Rise, Dodge, Mower, Wabasha, Fillmore, Winona, Houston, Barron, Dunn, Pepin, Buffalo, Trempealeau, Chippewa, and Eau Claire). Descriptive statistics for the overall study population are displayed in Table 1. The mean IMU score for MUA counties was 55.6 ± 8.6 (range 30.3–62.0). The HRSA database does not provide IMU scores for N-MUA counties.
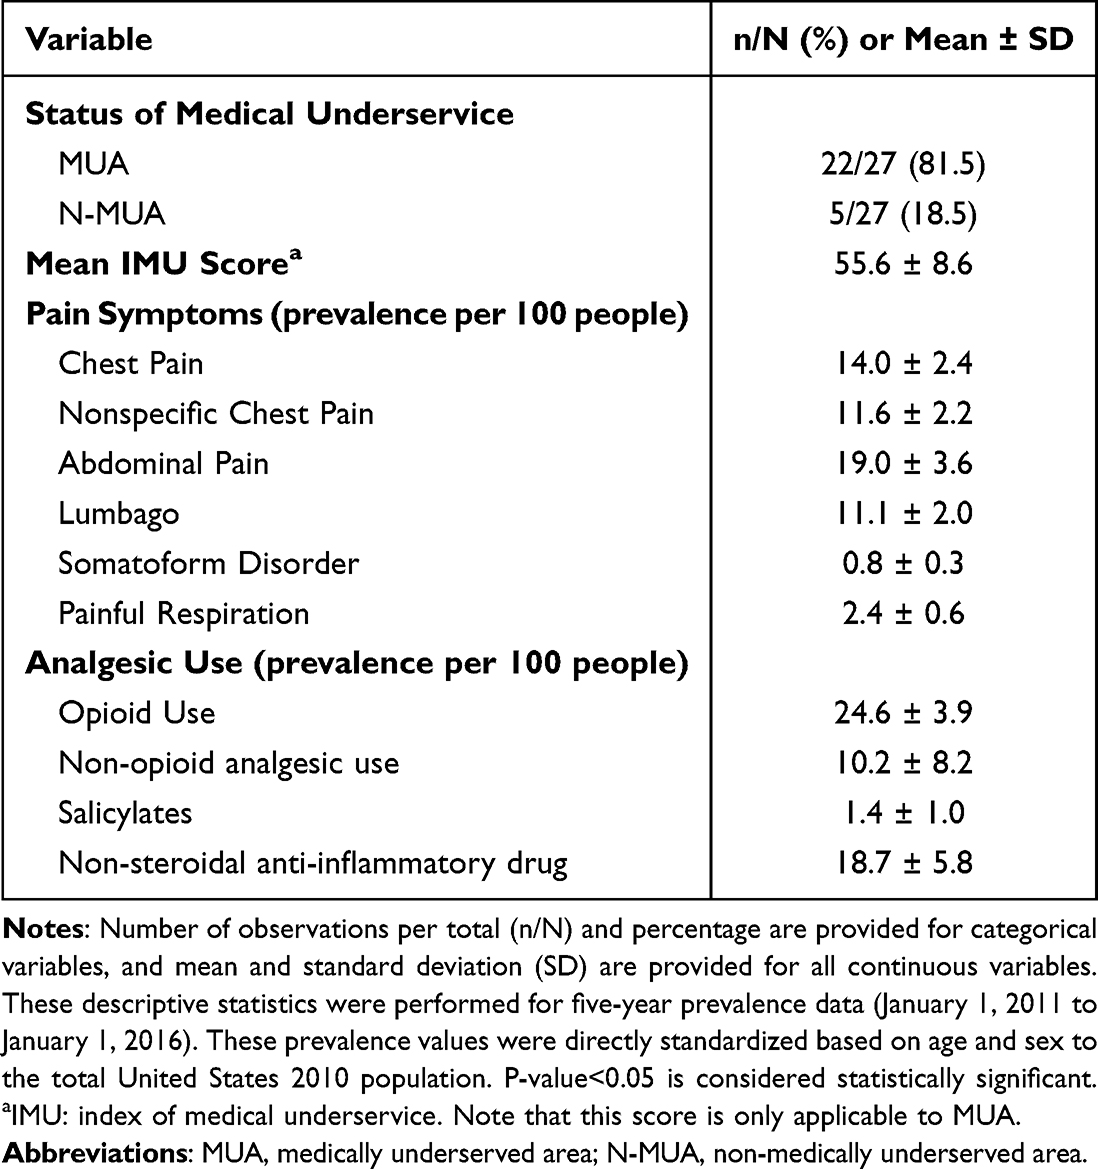 |
Table 1 Baseline Variables of Overall Study Population |
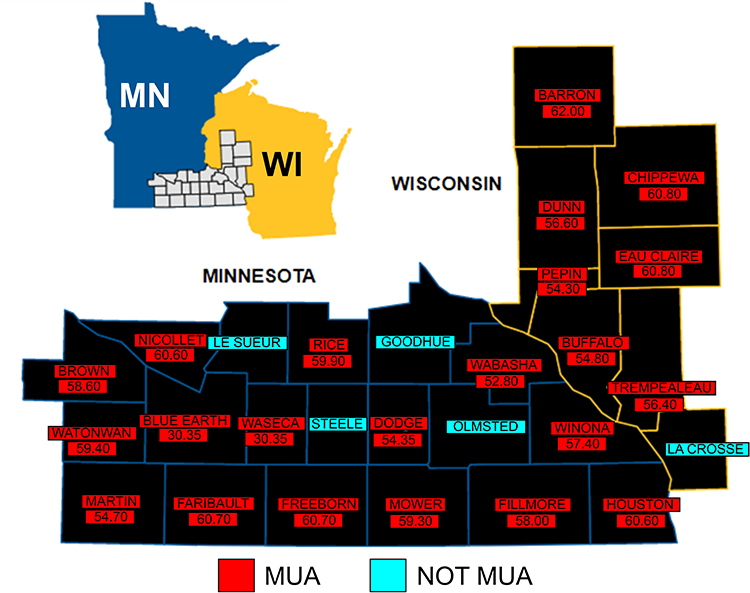 |
Figure 1 Medically Underserved Area Status of All Counties in the Rochester Epidemiology Project (REP) Database. Medically underserved area was indicated by red color, and non-medically underserved area was indicated by blue color. Index of Medical Underservice (IMU) scores are provided for all counties with MUA status. The Health Resources and Services Administration (HRSA) database does not provide IMU scores for non-medically underserved areas. Map was amended from the Rochester Epidemiology Project Data Exploration Portal with permission. April 2019, version 3.0. [Accessed 9 September 2021]: https://www.rochesterproject.org/portal/.27 Abbreviation: MUA, medically underserved area. |
Primary Outcomes
The prevalence per 100 people for a diagnosis of chronic pain was similar between MUAs and N-MUAs (13.8±2.5 vs 14.6±2.0, P=0.543; Table 2). Similarly, prevalence per 100 people for other specific diagnoses of pain including nonspecific chest pain, abdominal pain, lumbago, somatoform disorder, and painful respiration did not differ based on MUA status. In terms of analgesic use, prevalence per 100 people for use of opioids, non-opioid analgesics, salicylates, and NSAIDs did not differ based on MUA status (Table 2).
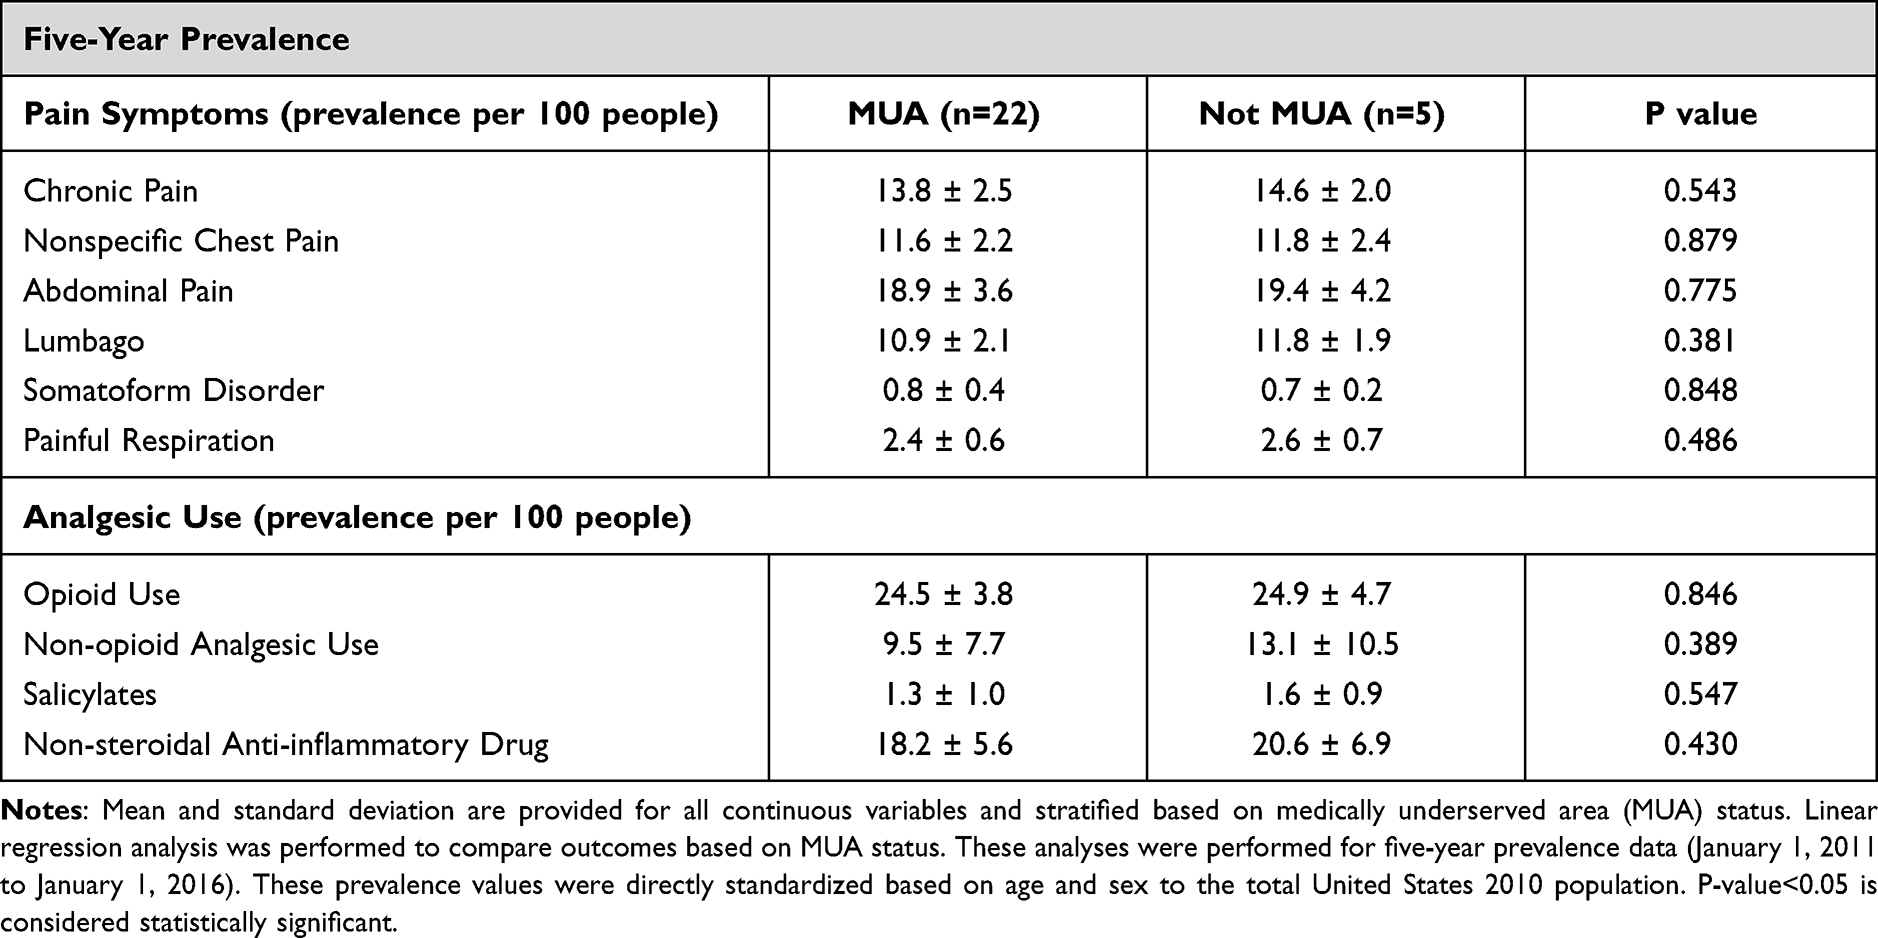 |
Table 2 Comparison of Pain Prevalence and Analgesic Use Between Underserved and Non-Underserved Counties |
The associations between prevalence of variables and IMU score are presented in Table 3. A significant association between higher IMU scores and lower prevalence of painful respiration was identified, although this association was no longer significant when the significance threshold was adjusted per the Bonferroni method.22
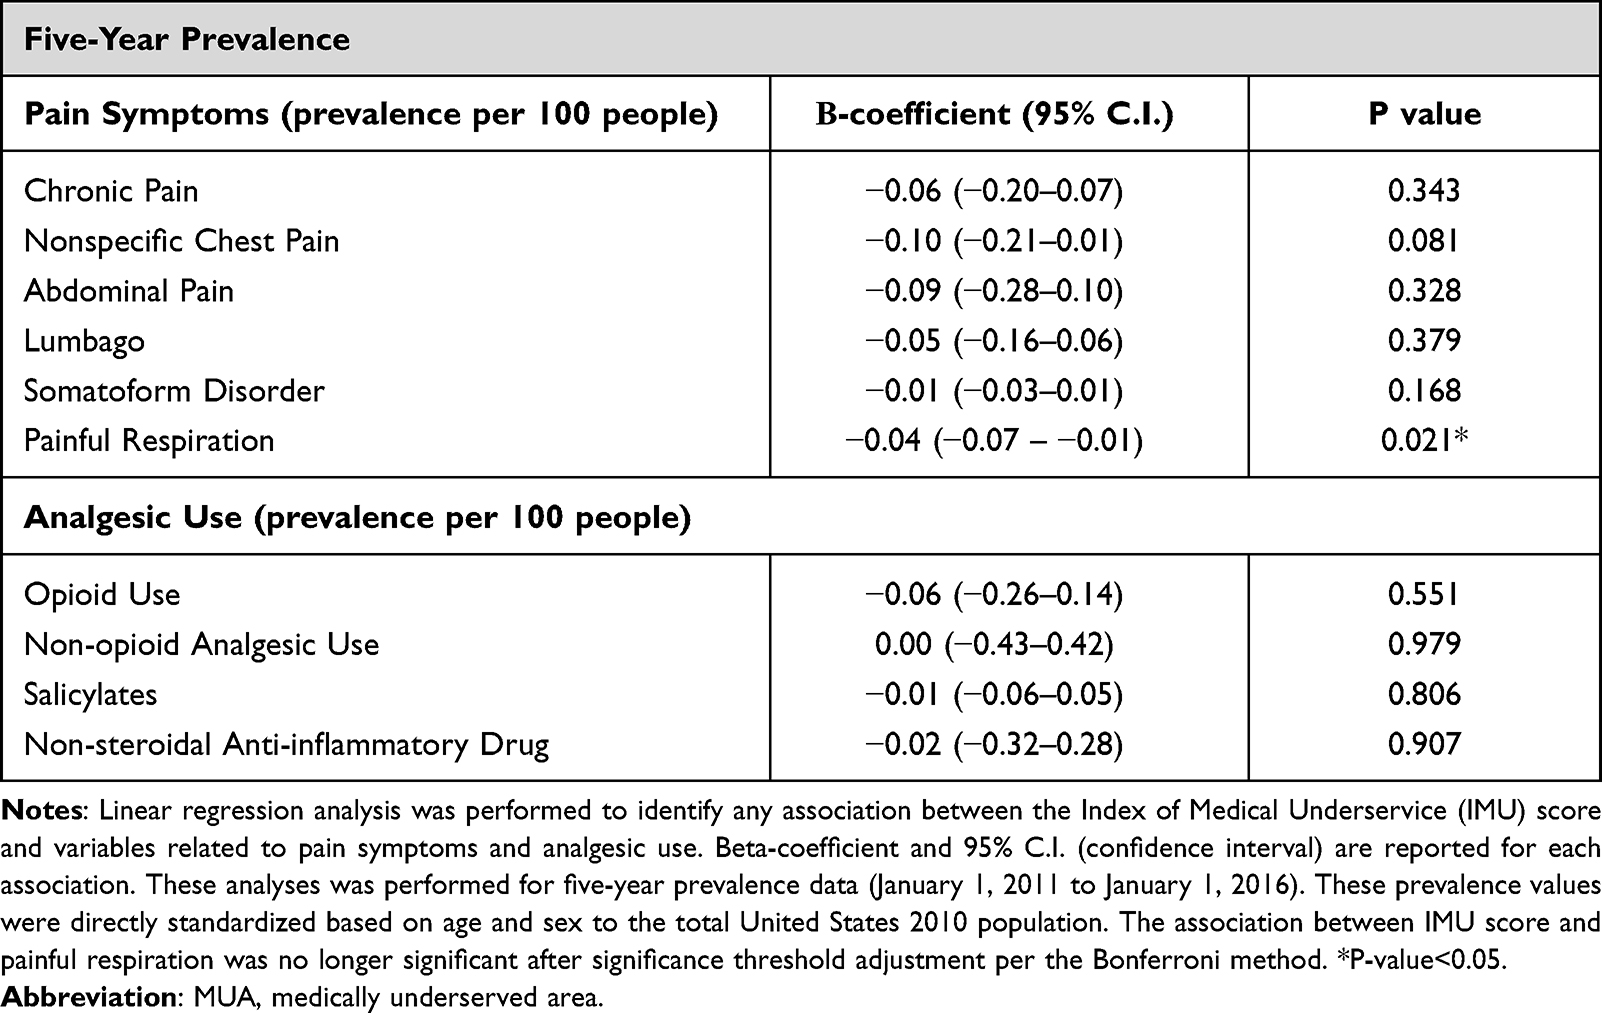 |
Table 3 Association Between IMU Score and Outcomes of Pain Prevalence and Analgesic Use |
Secondary Outcomes
There was no statistical difference in prevalence of spine-related pain disorders based on MUA status (Supplemental Table 1). Similarly, no significant associations between IMU score and prevalence of spine-related pain disorders were identified (Supplemental Table 2).
Discussion
In this REP database study comparing five-year prevalence data, we highlighted that there was no difference in several pain diagnoses and analgesic utilization between MUAs versus N-MUAs. Furthermore, the IMU score did not predict changes in prevalence of pain diagnoses or analgesic utilization. This was unexpected as the authors hypothesized that while the prevalence of pain diagnoses may be similar, MUAs would have lower prevalence of analgesic medication use due to reduced accessibility to healthcare. For instance, studies have highlighted that patients who reside in MUAs face health professional shortages and are less likely to receive medications to treat cardiovascular disease, such as statins and warfarin.23 In the field of pain medicine, severe chronic pain may disproportionately impact medically underserved patients, particularly those with low socioeconomic status and educational level.24 Studies have further highlighted that patients in underserved areas may face increased vulnerability to chronic pain and experience poor quality of life as a result of limited access to treatment, misunderstanding of pain presentation, and misaligned or unrealistic outcome expectations between healthcare professionals and patients.24
The authors propose several potential reasons for the absence of differences between MUA and N-MUA in this study. The prevalence for opioid misuse is higher in rural and underserved areas, suggesting that there may be less surveillance from healthcare authorities and monitoring programs.25 Healthcare professionals in MUAs may be more willing to prescribe analgesics, particularly opioid analgesics which in turn may increase risk for chronic opioid use. The absence of significant differences may also reflect limited external validity to MUAs in other states. For instance, while the vast majority of counties in the REP database were assigned MUA status, a major quaternary referral center that attracts patients from distant states and countries is located in Olmsted county which is centrally located within surrounding REP counties with MUA status. The most distant county from Olmsted county was only 132 miles (Brown County, MN) suggesting feasibility of accessing analgesic medication prescriptions and having chronic pain complaints addressed by a specialized healthcare professional.
While the prevalence of pain diagnoses or analgesic medications are similar across MUA and N-MUA, this does not necessarily imply similar quality of healthcare delivery. This concept is particularly imperative to elucidate in the field of pain medicine, which has experienced an increasing shift and emphasis on procedural options that may provide substantial pain relief compared to pharmacologic options. For instance, neuromodulation options may offer substantial analgesia for a wide array of pain indications that are superior in efficacy compared to standard medical therapy with pharmacological agents.26 Thus, quality of healthcare delivery overall is a hard metric to capture from large database studies.
This study has several notable limitations. Given that there were only 5 N-MUAs and 22 MUAs, our study may lack the statistical power to detect true differences. The HRSA database does not provide IMU scores for N-MUA countries and thus it is not possible to determine how close IMU scores were between MUA and N-MUA. The REP database provides aggregate data and thus patient-level covariates were unable to be adjusted in our regression analysis models. The REP database categorizes pain disorders into generic categories which lack specificity and may not be similar across patients with the same designation. For instance, a diagnosis of “chronic pain” does not capture the duration, severity, or type of pain. Similarly, categories of analgesic use do not quantify dosage or number of prescriptions. While Olmsted County has a coverage rate of 99.9% in the REP database, the expanded REP that included a total of 27 counties has about a 60% overall coverage rate. Thus, the possibility of selection bias is real and a study performed with the entire cohort may differ significantly in age, race, insurance availability, and other unknown attributes. Lastly, the data on the REP-DEP are not static. These data are updated every year and data from a previous version do not remain accessible.
Future studies should investigate pain diagnosis and management in MUAs from national databases to establish more generalizable findings. Health authority agencies such as the Centers for Disease Control and Prevention should utilize resources to reach out to vulnerable and underserved populations to disseminate information about prevention and self-management strategies in pain medicine. While rural versus urban status does not distinguish MUA status, studies should assess if these variables mediate any associations. Data should also be abstracted on dosage and number of analgesic prescriptions filled. It would also be informative to assess if prevalence of various pain procedures (eg, spinal cord stimulators, peripheral nerve stimulators, fluoroscopic or ultrasound-guided injections for pain) differ based on MUA status.
Conclusion
We identified no differences in several pain diagnoses and analgesic utilization based on MUA status. Furthermore, there was no association between IMU score and prevalence of pain diagnoses or analgesic utilization. Future-powered studies in other locations are warranted to increase external validity of findings to other populations not captured by the REP database.
Contributor Statement
All authors made a significant contribution to the work reported, whether that is in the conception, study design, execution, acquisition of data, analysis and interpretation, or in all these areas; took part in drafting, revising or critically reviewing the article; gave final approval of the version to be published; have agreed on the journal to which the article has been submitted; and agree to be accountable for all aspects of the work.
Disclosure
The authors report no conflicts of interest in this work.
References
1. Cohen SP, Vase L, Hooten WM. Chronic pain: an update on burden, best practices, and new advances. Lancet. 2021;397(10289):2082–2097. doi:10.1016/S0140-6736(21)00393-7
2. Collaborators GDaIIaP. Global, regional, and national incidence, prevalence, and years lived with disability for 354 diseases and injuries for 195 countries and territories, 1990–2017: a systematic analysis for the Global Burden of Disease Study 2017. Lancet. 2018;392(10159):1789–1858. doi:10.1016/S0140-6736(18)32279-7
3. Lyden J, Binswanger IA. The United States opioid epidemic. Semin Perinatol. 2019;43(3):123–131. doi:10.1053/j.semperi.2019.01.001
4. D’Souza RS, Langford B, Wilson RE, et al. The state-of-the-art pharmacotherapeutic options for the treatment of chronic non-cancer pain. Expert Opin Pharmacother. 2022:1–15. doi:10.1080/14656566.2022.2060741
5. Cuomo A, Bimonte S, Forte CA, Botti G, Cascella M. Multimodal approaches and tailored therapies for pain management: the trolley analgesic model. J Pain Res. 2019;12:711–714. doi:10.2147/JPR.S178910
6. D’Souza RS, Gurrieri C, Johnson RL, Warner N, Wittwer E. Intraoperative methadone administration and postoperative pain control: a systematic review and meta-analysis. Pain. 2020;161(2):237–243. doi:10.1097/j.pain.0000000000001717
7. Meadowcroft D, Whitacre B. Do prescription drug monitoring programs encourage prescription - or illicit - opioid abuse? Subst Abus. 2021;42(1):65–75. doi:10.1080/08897077.2019.1695707
8. D’Souza RS, Lang M, Eldrige JS. Prescription Drug Monitoring Program. StatPearls Publishing Copyright © 2022, StatPearls Publishing LLC.; 2022.
9. Akbar N, Teo SP, Artini Hj-Abdul-Rahman HN, Hj-Husaini HA, Venkatasalu MR. Barriers and solutions for improving pain management practices in acute hospital settings: perspectives of healthcare practitioners for a pain-free hospital initiative. Ann Geriatr Med Res. 2019;23(4):190–196. doi:10.4235/agmr.19.0037
10. Walker RJ, Strom Williams J, Egede LE. Influence of race, ethnicity and social determinants of health on diabetes outcomes. Am J Med Sci. 2016;351(4):366–373. doi:10.1016/j.amjms.2016.01.008
11. Suntai Z, Won CR, Noh H. Access barrier in rural older adults’ use of pain management and palliative care services: a systematic review. Am J Hosp Palliat Care. 2021;38(5):494–502. doi:10.1177/1049909120959634
12. Al-Mahrezi A. Towards effective pain management: breaking the barriers. Oman Med J. 2017;32(5):357–358. doi:10.5001/omj.2017.69
13. Campbell CM, Edwards RR. Ethnic differences in pain and pain management. Pain Manag. 2012;2(3):219–230. doi:10.2217/pmt.12.7
14. Cyr ME, Etchin AG, Guthrie BJ, Benneyan JC. Access to specialty healthcare in urban versus rural US populations: a systematic literature review. BMC Health Serv Res. 2019;19(1):974. doi:10.1186/s12913-019-4815-5
15. St Sauver JL, Grossardt BR, Yawn BP, Melton LJ, Rocca WA. Use of a medical records linkage system to enumerate a dynamic population over time: the Rochester epidemiology project. Am J Epidemiol. 2011;173(9):1059–1068. doi:10.1093/aje/kwq482
16. Rocca WA, Grossardt BR, Brue SM, et al. Data resource profile: Expansion of the Rochester Epidemiology Project medical records-linkage system (E-REP). Int J Epidemiol. 2018;47(2):368–368j. doi:10.1093/ije/dyx268
17. Andermann A, Collaboration C. Taking action on the social determinants of health in clinical practice: a framework for health professionals. CMAJ. 2016;188(17–18):E474–E483. doi:10.1503/cmaj.160177
18. St Sauver JL, Grossardt BR, Finney Rutten LJ, et al. Rochester epidemiology project data exploration portal. Prev Chronic Dis. 2018;15:E42. doi:10.5888/pcd15.170242
19. Scoring Shortage Designations. HRSA health workforce. Available from: https://bhw.hrsa.gov/workforce-shortage-areas/shortage-designation/scoring.
20. Wu A, March L, Zheng X, et al. Global low back pain prevalence and years lived with disability from 1990 to 2017: estimates from the Global Burden of Disease Study 2017. Ann Transl Med. 2020;8(6):299. doi:10.21037/atm.2020.02.175
21. Hurwitz EL, Randhawa K, Yu H, Côté P, Haldeman S. The global spine care initiative: a summary of the global burden of low back and neck pain studies. Eur Spine J. 2018;27(Suppl 6):796–801. doi:10.1007/s00586-017-5432-9
22. Bland JM, Altman DG. Multiple significance tests: the Bonferroni method. BMJ. 1995;310(6973):170. doi:10.1136/bmj.310.6973.170
23. Brown TM, Parmar G, Durant RW, et al. Health professional shortage areas, insurance status, and cardiovascular disease prevention in the Reasons for Geographic and Racial Differences in Stroke (REGARDS) Study. J Health Care Poor Underserved. 2011;22(4):1179–1189. doi:10.1353/hpu.2011.0127
24. Bifulco L, Anderson DR, Blankson ML, et al. Evaluation of a chronic pain screening program implemented in primary care. JAMA Netw Open. 2021;4(7):e2118495. doi:10.1001/jamanetworkopen.2021.18495
25. Okie S. A flood of opioids, a rising tide of deaths. N Engl J Med. 2010;363(21):1981–1985. doi:10.1056/NEJMp1011512
26. Hagedorn JM, Pittelkow TP, Hunt CL, D’Souza RS, Lamer TJ. Current perspectives on spinal cord stimulation for the treatment of cancer pain. J Pain Res. 2020;13:3295–3305. doi:10.2147/JPR.S263857
27. The Rochester Epidemiology Project Data Exploration Portal. Geography. Available from: https://www.rochesterproject.org/portal/. Accessed September 09, 2021
 © 2022 The Author(s). This work is published and licensed by Dove Medical Press Limited. The
full terms of this license are available at https://www.dovepress.com/terms
and incorporate the Creative Commons Attribution
- Non Commercial (unported, 3.0) License.
By accessing the work you hereby accept the Terms. Non-commercial uses of the work are permitted
without any further permission from Dove Medical Press Limited, provided the work is properly
attributed. For permission for commercial use of this work, please see paragraphs 4.2 and 5 of our Terms.
© 2022 The Author(s). This work is published and licensed by Dove Medical Press Limited. The
full terms of this license are available at https://www.dovepress.com/terms
and incorporate the Creative Commons Attribution
- Non Commercial (unported, 3.0) License.
By accessing the work you hereby accept the Terms. Non-commercial uses of the work are permitted
without any further permission from Dove Medical Press Limited, provided the work is properly
attributed. For permission for commercial use of this work, please see paragraphs 4.2 and 5 of our Terms.