")
Back to Journals » Cancer Management and Research » Volume 11
Overexpression of COL5A1 promotes tumor progression and metastasis and correlates with poor survival of patients with clear cell renal cell carcinoma
Authors Feng G , Ma HM, Huang HB, Li YW, Zhang P , Huang JJ, Cheng L, Li GR
Received 20 September 2018
Accepted for publication 13 January 2019
Published 7 February 2019 Volume 2019:11 Pages 1263—1274
DOI https://doi.org/10.2147/CMAR.S188216
Checked for plagiarism Yes
Review by Single anonymous peer review
Peer reviewer comments 3
Editor who approved publication: Professor Harikrishna Nakshatri
Gang Feng,1,2 Hui-Min Ma,1 Hou-Bao Huang,3 Ya-Wei Li,3 Peng Zhang,1 Jian-Jun Huang,1 Long Cheng,1,2 Guo-Rong Li4
1Clinical Laboratory, The First Affiliated Hospital of Wannan Medical College, Wuhu 241001, Anhui, China; 2Anhui Province Key Laboratory of Active Biological Macro-molecules Research, Wannan Medical College, Wuhu 241002, Anhui, China; 3Department of Urology, The First Affiliated Hospital of Wannan Medical College, Wuhu 241001, Anhui, China; 4Department of Urology, North Hospital, CHU of Saint-Etienne, Saint-Etienne 42055, France
Background and aims: COL5A1 has been identified to be involved in metastasis of clear cell renal cell carcinoma (ccRCC) by bioinformatic analysis. This study aimed to investigate COL5A1 expression and its clinical significance in ccRCC. The function of COL5A1 in ccRCC was further investigated.
Methods: COL5A1 expression was examined in 256 ccRCC tissues and paired adjacent normal renal tissues by immunohistochemistry and real-time quantitative PCR. The clinical significance of COL5A1 expression was evaluated. Downregulation of COL5A1 was achieved using siRNA. The effects of COL5A1 silencing on cell proliferation, apoptosis, migration, invasion in vitro, and tumor growth in vivo were investigated.
Results: COL5A1 expression was upregulated in the majority of the ccRCC tissues at both protein and mRNA levels. COL5A1 expression was significantly correlated with tumor diameter, tumor stage, tumor grade, distant metastasis, recurrence, necrosis, and sarcomatoid (all P<0.05). COL5A1 expression was also significantly associated with overall survival of ccRCC patients (HR 1.876; P=0.027) and recurrence-free survival of localized ccRCC patients (HR 4.751; P<0.001). The accuracy of TNM, University of California Los Angeles Integrated Staging System, and Mayo clinic stage, size, grade, and necrosis prognostic models was improved when COL5A1 expression was added.
Conclusion: COL5A1 knockdown significantly inhibited cell proliferation, induced cell apoptosis, inhibited cell migration and invasion in vitro, and inhibited tumor growth in vivo. Therefore, COL5A1 may be a novel prognostic biomarker and a promising therapeutic target for ccRCC.
Keywords: clear cell renal cell carcinoma, COL5A1, biomarkers, prognosis
Introduction
Clear cell renal cell carcinoma (ccRCC) represents the most common and aggressive malignant subtype of renal cell carcinoma.1 Although more ccRCCs at an early stage are detected with imaging examination, about 30% of patients present with metastasis at the time of diagnosis.2 Nephrectomy is the mainstay of treatment for early and localized ccRCC; however, ~20% of patients who undergo surgery will develop metastasis.3 Despite the implementation of targeted therapies, patients with metastatic ccRCC have a 5-year survival rate of <10%.4 Some existing prognostic systems and algorithms, such as TNM, University of California Los Angeles Integrated Staging System (UISS), and Mayo clinic stage, size, grade, and necrosis (SSIGN), are used in current clinical practice; however, they still need to be improved for prognostic evaluation of ccRCC.5,6 In addition, the only method for diagnosing metastatic ccRCC is based on imaging techniques, because of the lack of molecular markers that could be used for reliable detection of metastatic ccRCC.7 Therefore, identifying novel molecular factors associated with invasion and/or metastasis of ccRCC is of great importance, and could help guide the therapeutic intervention and follow-up strategies.
Previous studies showed that invasion of the basement membrane (BM) and extracellular matrix (ECM) might be an essential event in metastasis of renal cell carcinoma.8–10 As a collagen family protein, COL5A1 is involved in ECM formation.11 Bioinformatic identification showed that COL5A1 might be a key factor in many types of cancers including breast cancer, gastric cancer, papillary thyroid carcinoma, ovarian cancer, oral squamous cell carcinoma, and lung adenocarcinoma.12–17 Importantly, high expression of COL5A1 is independently significantly associated with poor survival according to survival analysis of The Cancer Genome Atlas (TCGA) data from renal cell carcinoma samples.18
However, the clinical significance and the function of COL5A1 in ccRCC remain unknown. In this study, the association between clinicopathological characteristics and COL5A1 expression was assessed in the ccRCC clinical tissue specimens. The prognostic value of COL5A1 was evaluated in ccRCC patients. In addition, the biological function of COL5A1 was investigated using ccRCC cell line and xenograft model.
Materials and methods
Patients and samples
A total of 256 matched pairs of ccRCC tissues (T) and adjacent normal tissues (N) were obtained from patients who underwent nephrectomy (radical or partial) without any neoadjuvant treatment between April 2012 and April 2018 at the First Affiliated Hospital of Wannan Medical College. All tumors were staged according to the 2010 American Joint Committee on Cancer TNM classification and graded according to the Fuhrman grading system by two senior pathologists. The information including age, gender, tumor diameter, TNM stage, Fuhrman grade, distant metastasis, recurrence, histological tumor necrosis, histological sarcomatoid, and Eastern Cooperative Oncology Group performance status (ECOG PS) was collected from each patient. All procedures performed in studies involving human participants were reviewed and approved by the Ethic Committee of Wannan Medical College and conducted in accordance with the 1964 Declaration of Helsinki and its later amendments or comparable ethical standards. Written informed consent was obtained from all individual participants included in the study.
Cell lines
Human renal proximal tubule epithelial cell line HK-2 and human ccRCC cell lines 786-O and Caki-1 were purchased from the Chinese Academy of Sciences (Shanghai, China). HK-2 cells were cultured in K-SFM medium (Thermo Fisher Scientific, Waltham, MA, USA), and other cells were cultured in RPMI-1640 medium (Thermo Fisher Scientific) supplemented with 10% FBS (TransGen Biotech, Beijing, China), 100 U/mL penicillin, and 100 µg/mL streptomycin (Solarbio, Beijing, China). Cells were maintained in a humidified incubator at 37°C with a mixture of 95% air and 5% CO2.
Protein isolation and Western blot assay
Tissues and cells were lysed in RIPA buffer with protease inhibitors (Solarbio). The protein concentration was then quantified using BCA Protein Assay Kit (Beyotime, Jiangsu, China), and 200 µg of protein was separated by SDS-PAGE (Promoton, Shanghai, China) and transferred onto a polyvinylidene fluoride membrane (EMD Millipore, Billerica, MA, USA). The membranes were blocked and incubated overnight with primary antibody against COL5A1 (monoclonal antibody #ab112551; Abcam). The membranes were then washed and incubated with horse radish peroxidase-conjugated secondary antibody. The relative band density was determined with the ECL Western Blotting Substrate Kit (EMD Millipore) using Tanon 5200 Multifunctional Imaging System (Beijing, China). GAPDH was used as the internal control for protein loading.
RNA isolation and real-time quantitative PCR
Total RNA was isolated from tissues and cells with the Trizol reagent (Thermo Fisher Scientific). Extracted RNA was reverse-transcribed into cDNA using SuperScript® III First-Strand Synthesis Kit (Thermo Fisher Scientific). COL5A1 transcript levels were measured by real-time quantitative PCR using Light Cycler 480-II (Roche Applied Science, Penzberg, Germany) in a 96-well plate. PPIA served as the reference gene.19 PCR amplification was performed using gene-specific TaqMan Gene Expression Assays (COL5A1: Hs00609133_m1; PPIA: Hs99999904_m1) and the TaqMan Gene Expression Master Mix according to the manufacturer’s instructions. Relative COL5A1 expression level was calculated by normalization to PPIA. Fold expression was then determined as the ratio of the relative COL5A1 expression level in ccRCC tissue to paired adjacent normal tissue.
Histochemistry
Formalin-fixed, paraffin-embedded human ccRCC and adjacent normal tissue sections (4 µm thick) were stained using standard immunohistochemical methods. Sections were deparaffinized and incubated with 3% H2O2 in methanol. Then, sections were blocked with normal goat serum. After blocking, sections were incubated with anti-COL5A1 monoclonal antibody (#ab112551; Abcam) overnight at 4°C, followed by secondary antibody. Sections were visualized with diaminobenzidine solution and hematoxylin counterstain. Images were acquired with a microscope (Nikon Eclipse E200).
Two pathologists blinded to the clinical data independently scored the tissue staining. The percentage of staining was evaluated and scored as follows: 0, <1% staining; 1, 1%–24% staining; 2, 25%–49% staining; 3, 50%–74% staining; and 4, >74% staining. The intensity of staining was defined as follows: 0, no signal; 1, weak; 2, moderate; and 3, strong. The total score was finally calculated and graded as follows: negative (–), score: 0; weak (1+), score: 1–4; moderate (2+), score: 5–8; and strong (3+), score: 9–12.
RNAi knockdown
Three siRNA oligonucleotides (designated #1, #2, #3) and mismatch siRNA control oligonucleotides were synthesized by Shanghai Genepharma Co. Ltd. (Shanghai, China). The sequences of best inhibited siRNA (designated #2) were as follows: siRNA-COL5A1, 5′-AAGGAGAGGGUGAGACCUAUUA-3′ and siRNA-control, 5′-CAGAGGGAGUGGGAGCCAAUAAUUA-3′.20 Cells were transfected with siRNA-COL5A1 or siRNA-control using Lipofectamine 3000 reagent (Thermo Fisher Scientific) following the manufacturer’s instructions.
Cell proliferation and apoptosis assay
For MTT assay, cells were plated in 96-well culture plates at about 5,000 cells per well. At 0, 24, 48, 72, and 96 hours, MTT was added to each well and cells were treated for 4 hours, respectively. After removal of the supernatant, dimethyl sulfoxide (100 µL/well) was added and cells were treated for 15 minutes. Absorbance values at 490 nm were measured using a microplate reader (BioTek Instruments, Winooski, VT, USA). For colony formation assay, cells transfected with siRNAs were plated in six-well plates at 1,000 cells per well and then cultured for 2 weeks. The cells were fixed and stained for 30 minutes in 35% methanol solution with 1% crystal violet, and then the number of foci >100 cells was counted. For apoptosis analyses, Annexin V/propidium iodide staining of cells was carried out. At 48 hours after transfection, cells were harvested, washed, stained with FITC Annexin V Apoptosis Detection kit (Beyotime). The number of apoptotic cells was determined by a flow cytometer (Guava easyCyte HT; Millipore). All assays were performed in triplicate.
Cell migration and invasion assays
Cells were plated in six-well plates and allowed to grow until 100% confluency. Then, cell layer was scratched through the central axis using a sterile plastic tip and loose cells were washed. The widths of the initial gaps (0 and 24 hours) were calculated using a microscope (Nikon Eclipse E200). Cell invasion assay was carried out using Transwell chambers (Corning Incorporated, Corning, NY, USA) with a pore size of 8 µm. The melted Matrigel (BD Biosciences, San Jose, CA, USA) was diluted with medium, 30 mL of which was added to the upper chamber of transwell, and then 5,000 cells in serum-free medium were added to the upper chamber. After 24-hour incubation at 37°C and 5% CO2, cells invaded to the lower surface of the membrane were fixed with 4% paraformaldehyde, stained with 10% crystal violet, and counted. All assays were performed in triplicate.
Animal experiments
All applicable national and institutional guidelines for the care and use of animals were followed. The animal protocol of this study was approved by the Animal Research Committee of Wannan Medical College. A total of 10 male BALB/c nude mice (4 weeks, weight 20–23 g) were obtained from the Experimental Animal Research Center of Wannan Medical College and kept in the specific pathogen-free condition. Cells (1×10⁶) were injected subcutaneously into the neck of nude mice. After 2 weeks, all nude mice with tumor were randomly divided into two groups (n=5 for each group) to receive intratumoral injection of siRNA-COL5A1 or siRNA-control every 5 days.21 The length (L) and width (W) of the tumor were measured before every intratumoral injection. Tumor volume was calculated according to the formula: L×W2/2. After five injections, all mice were killed humanely and the resected tumors were weighed.
Statistical analyses
SPSS version 13.0, GraphPad 5.0 software, and R programming language version 3.4.3 were used to perform statistical analysis in this study. Numerical data were analyzed by Student’s t-test, Mann–Whitney U test, or Kruskal–Wallis test as appropriate. Categorical data were analyzed by chi-squared test. Survival curves were generated using Kaplan–Meier method, and the difference was analyzed by log-rank test. Univariate and multivariate Cox regression analyses (forward stepwise: likelihood ratio) were performed to identify prognostic factors for overall survival (OS) and recurrence-free survival (RFS). Harrell concordance index (C-index) and Akaike information criteria (AIC) analysis were applied to investigate the accuracy of the prognostic models. A two-sided P-value of <0.05 was considered statistically significant.
Results
COL5A1 is upregulated in ccRCC tissues and ccRCC cell lines
COL5A1 protein was almost negatively expressed in the adjacent normal renal tissue and positively expressed in the majority of ccRCC tissue (Figure 1A). The rate of positive expression of COL5A1 protein in ccRCC tissue was 93.75% (240/256), which was significantly higher than that in the adjacent normal renal tissue (7.4%) (P<0.001; Table 1). COL5A1 mRNA expression was also significantly higher (1.74-fold) in ccRCC tissue than that in the adjacent normal tissue (P<0.001). Western blot analysis revealed that COL5A1 protein expression was upregulated in ccRCC cell lines 786-O and Caki-1, as compared with nonmalignant HK-2 cells (Figure 1B). As shown in Figure 1C, COL5A1 mRNA expression was significantly higher in ccRCC cell lines 786-O (1.67-fold) and Caki-1 (3.87-fold) compared to HK-2 cells.
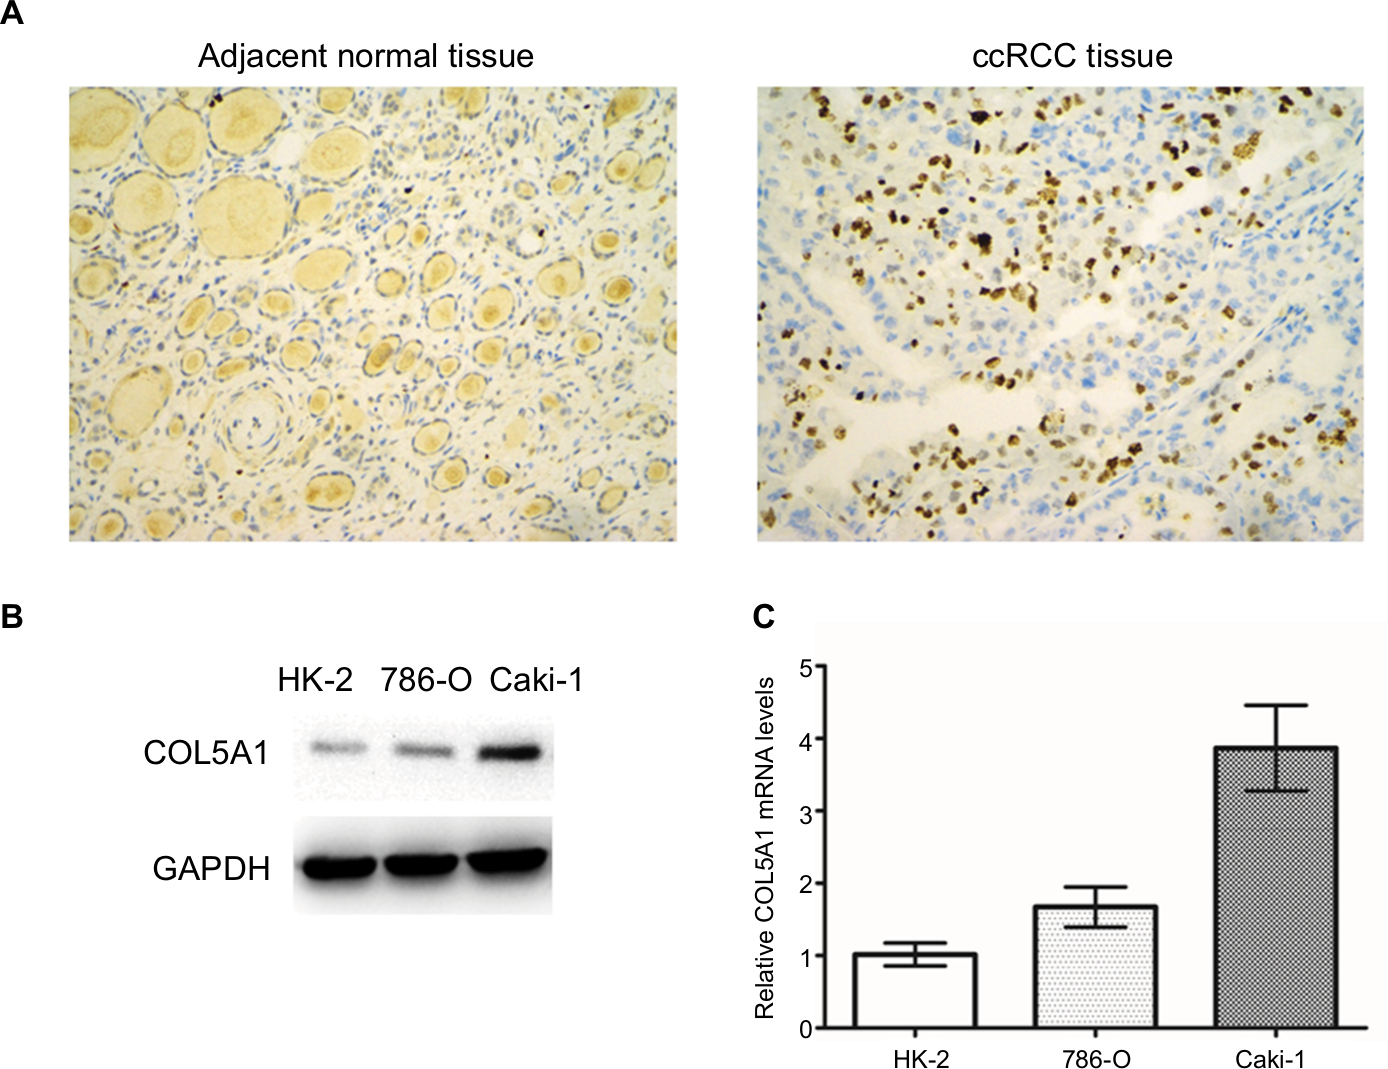 | Figure 1 Expression of COL5A1 in tissue and cell lines. Notes: (A) Representative COL5A1 immunohistochemical images (200×) in adjacent normal tissue and ccRCC tissue. COL5A1 protein expression in the ccRCC tissue was significantly higher than that in the adjacent normal tissue. (B) Western blot detection of COL5A1 protein expression in HK-2, 786-O, and Caki-1 cells. COL5A1 protein was upregulated in ccRCC cell lines in comparison with HK-2 cells. GAPDH was used as loading control. (C) COL5A1 mRNA expression in HK-2, 786-O, and Caki-1 cells. The ccRCC cell lines showed a significantly higher COL5A1 mRNA expression in comparison with HK-2 (all P<0.05). Abbreviation: ccRCC, clear cell renal cell carcinoma. |
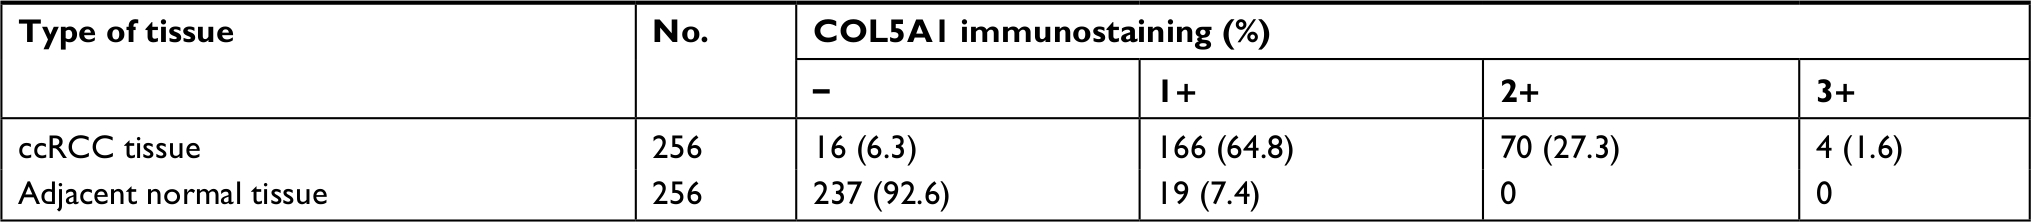 | Table 1 The expression of COL5A1 protein in ccRCC tissue and paired adjacent normal tissue Abbreviation: ccRCC, clear cell renal cell carcinoma. |
COL5A1 is correlated with clinicopathological characteristics
A total of 256 ccRCC patients (151 male and 105 female), with a mean age of 57.6 years (range, 24–85 years), and tumor diameter ranging from 1.2 to 18.0 cm (mean 4.8 cm), were included. The number of patients with TNM stages I, II, III, and IV was 168, 32, 36, and 20, respectively (65.6%, 12.5%, 14.1%, and 7.8%), whereas the number of patients with Fuhrman grades 1, 2, 3, and 4 was 91, 74, 73, and 18, respectively (35.5%, 28.9%, 28.5%, and 7.0%). Moreover, lymph node metastasis and/or distant metastasis were presented in 57 patients at the time of diagnosis. Histological tumor necrosis was observed in 71 (27.7%) patients, and histological sarcomatoid was observed in 83 (32.4%) patients. Forty-eight (18.8%) patients were assessed with ECOG PS ≥1.
As shown in Table 2, COL5A1 expression at protein and mRNA levels was significantly associated with tumor diameter (P=0.001 and P<0.001), TNM stage (P<0.001 and P<0.001), Fuhrman grade (P<0.001 and P<0.001), distant metastasis (P<0.001 and P<0.001), histological tumor necrosis (P<0.001 and P<0.001), histological sarcomatoid (P=0.001 and P<0.001), UISS category (P=0.002 and P<0.001), and SSIGN score (P<0.001 and P<0.001).
 | Table 2 The relationship of COL5A1 with the clinicopathological characteristics of patients with ccRCC Abbreviations: ccRCC, clear cell renal cell carcinoma; ECOG PS, Eastern Cooperative Oncology Group performance status; N, adjacent normal tissue; SSIGN, Mayo clinic stage, size, grade, and necrosis; T, ccRCC tissue; UISS, University of California Los Angeles Integrated Staging System. |
COL5A1 is correlated with OS of patients with ccRCC
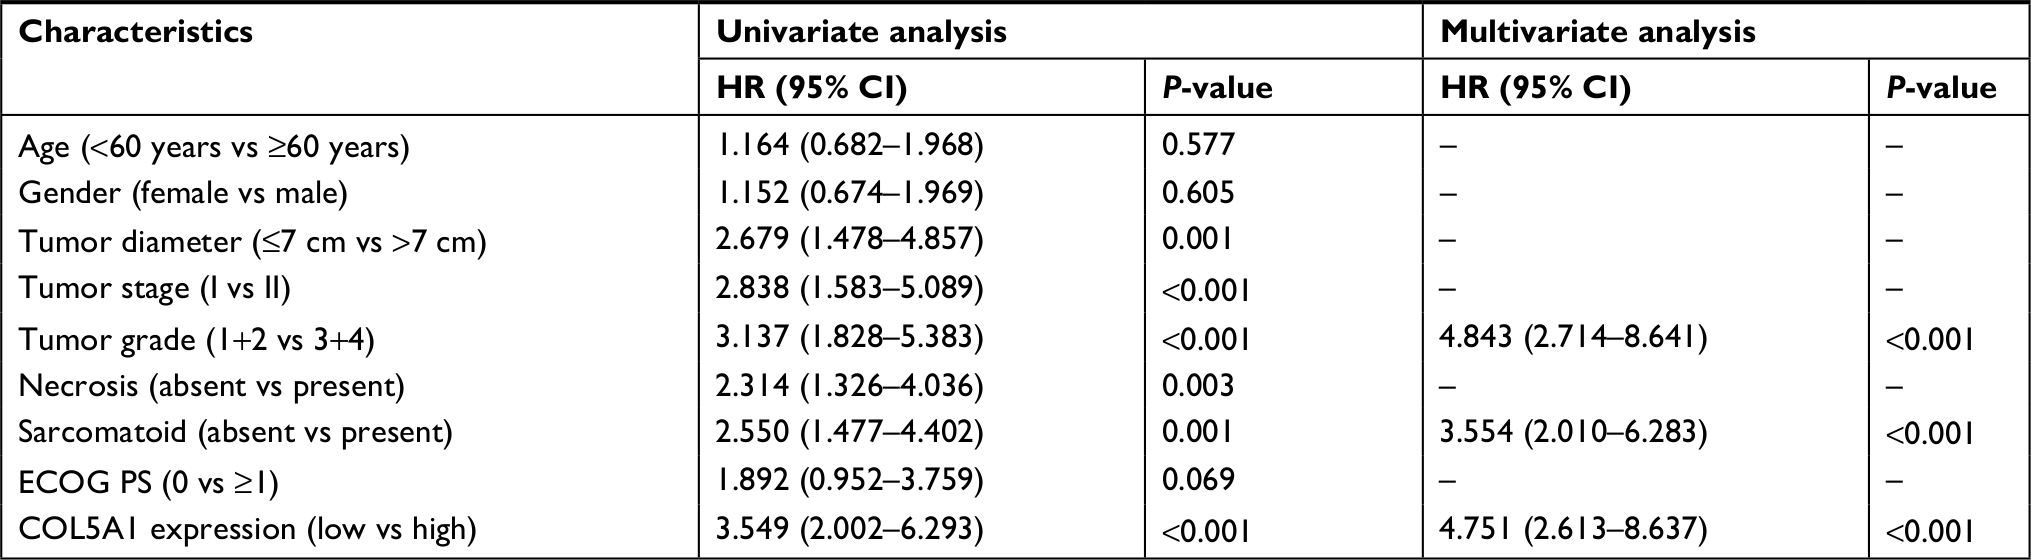
The COL5A1 mRNA expression in patients with metastatic ccRCC was significantly higher compared to patients with localized ccRCC (P<0.001; Figure 2A). Based on the median level of COL5A1 mRNA (1.70-fold) in ccRCC tissue, all patients were divided into two groups. Kaplan–Meier analysis demonstrated that ccRCC patients with high COL5A1 expression had a significantly worse OS probability than those with low COL5A1 expression (log-rank test, P<0.001; Figure 2B). As presented in Table 3, univariate analysis indicated that tumor stage, tumor grade, distant metastasis, necrosis, sarcomatoid, and COL5A1 expression (all P<0.001) were statistically significant and correlated with OS of patients with ccRCC. Multivariate analysis showed that COL5A1 expression (HR 1.876; 95% CI: 1.073–3.279; P=0.027), tumor stage (P=0.029), necrosis (P=0.001), and sarcomatoid (P=0.015) were significantly correlated with OS of patients with ccRCC after nephrectomy.
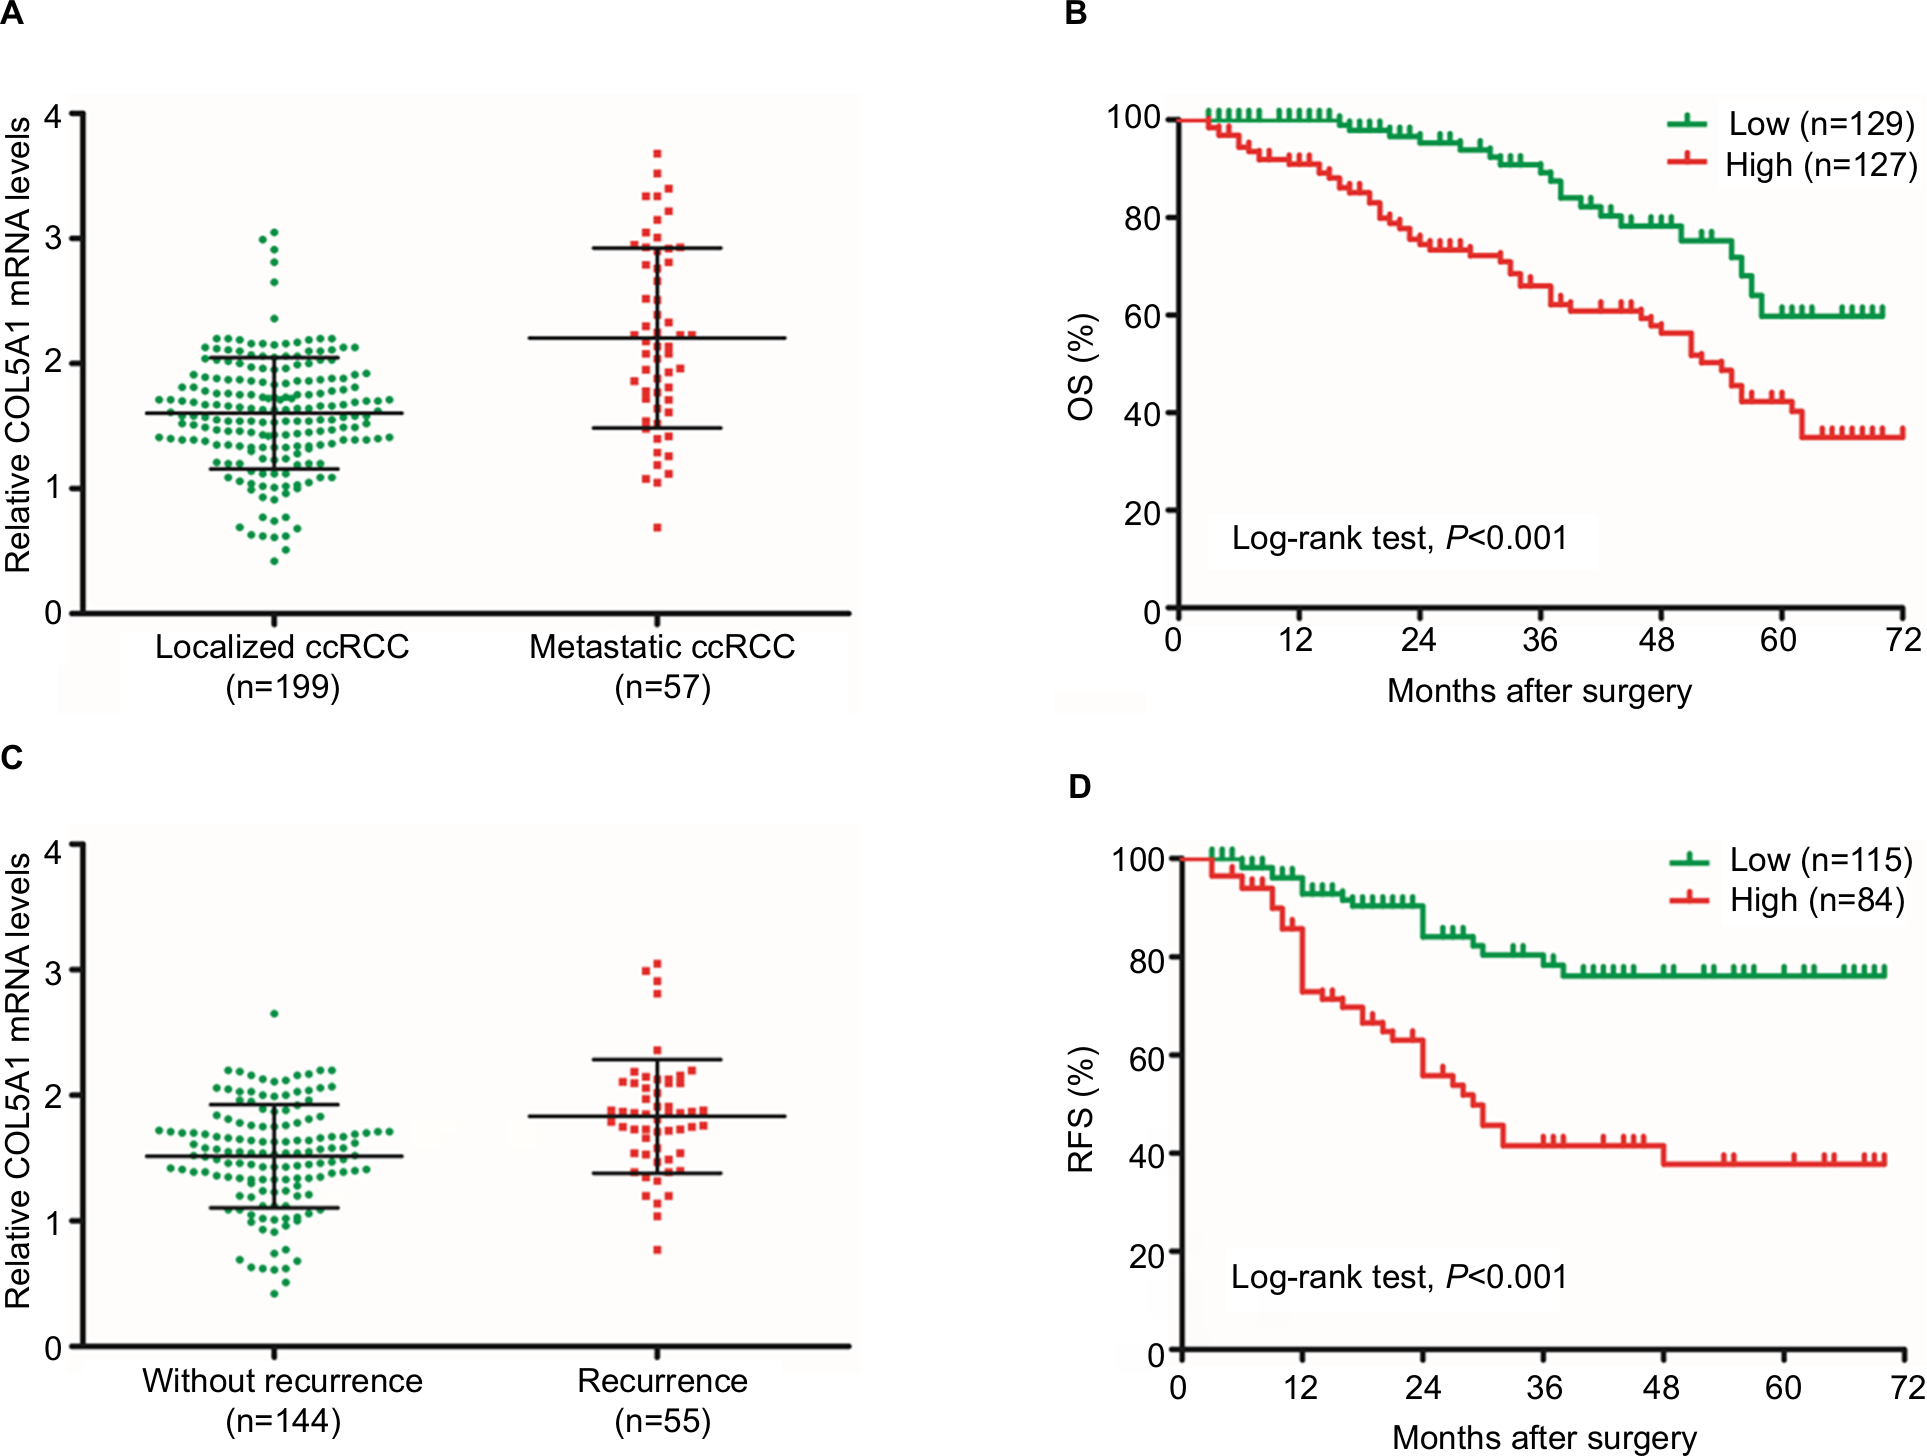 | Figure 2 COL5A1 mRNA is correlated with survival of ccRCC patients. Notes: (A) COL5A1 mRNA expression in patients with localized and metastatic ccRCC. Patients with metastatic ccRCC had significantly higher COL5A1 mRNA expression compared to patients with localized ccRCC (P<0.05). (B) Kaplan–Meier curves for OS after surgery. Patients with high COL5A1 mRNA expression had poor OS (log-rank test, P<0.001). (C) COL5A1 mRNA expression in ccRCC patients with and without recurrence. Patients with recurrence had significantly higher COL5A1 mRNA expression compared to patients without recurrence (P<0.05). (D) Kaplan–Meier curves for RFS after surgery. Patients with high COL5A1 mRNA expression had poor RFS (log-rank test, P<0.001). Abbreviations: ccRCC, clear cell renal cell carcinoma; OS, overall survival; RFS, recurrence-free survival. |
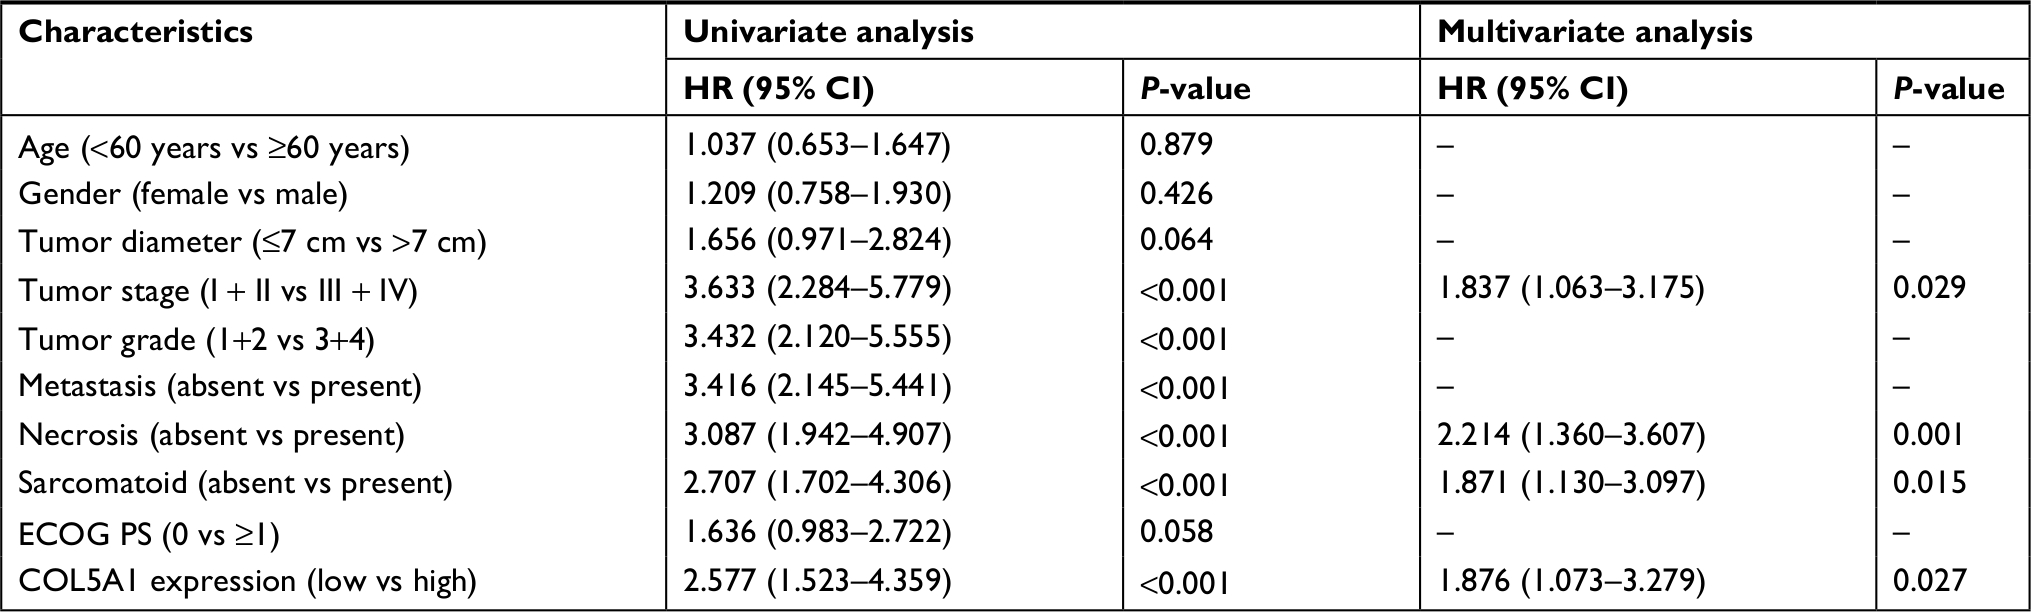 | Table 3 Univariate and multivariate analyses for predicting overall survival of patients with ccRCC (n=256) Abbreviations: ccRCC, clear cell renal cell carcinoma; ECOG PS, Eastern Cooperative Oncology Group performance status. |
The C-indices were 0.664, 0.689, and 0.715, respectively, when the OS was assessed with TNM, UISS, and SSIGN outcome algorithms alone. Interestingly, C-indices of these prognostic models were improved to 0.715, 0.736, and 0.742 with inclusion of COL5A1 expression. Furthermore, all combined models had lower AIC values compared to their conventional model alone (Table 4).
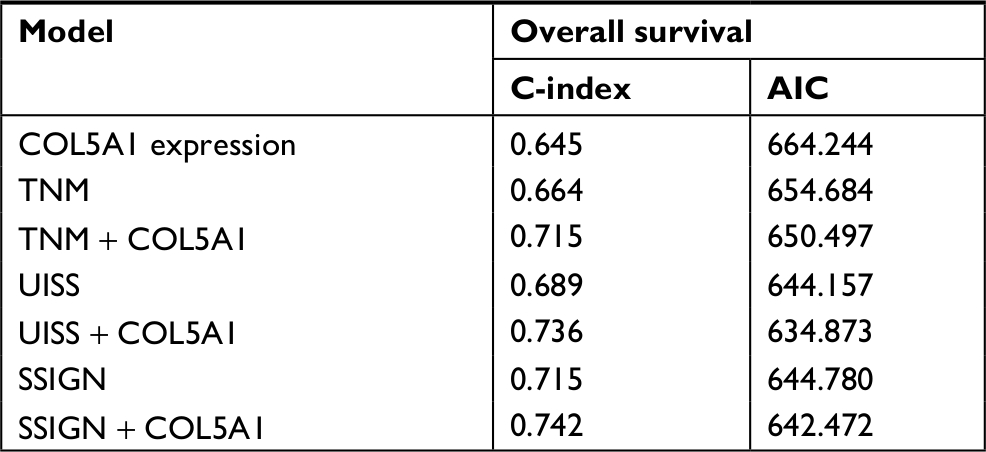 | Table 4 Comparison of the prognostic accuracy of the prognostic models and COL5A1 expression for predicting overall survival of patients with ccRCC Abbreviations: AIC, Akaike information criteria; ccRCC, clear cell renal cell carcinoma; SSIGN, Mayo clinic stage, size, grade, and necrosis; UISS, University of California Los Angeles Integrated Staging System. |
COL5A1 is correlated with RFS of patients with localized ccRCC
Among 199 patients with localized ccRCC, 55 had recurrence after nephrectomy in follow-up. There was a significant difference in COL5A1 mRNA expression between the patients with and without recurrence (P<0.001; Figure 2C). The RFS curve indicated that the group with high COL5A1 expression had a significantly higher recurrence rate compared to the group with low COL5A1 expression (log-rank test, P<0.001; Figure 2D). The results of univariate and multivariate analyses for RFS are shown in Table 5. Univariate analysis indicated that tumor diameter, tumor stage, tumor grade, necrosis, sarcomatoid, and COL5A1 expression (all P<0.001) were significantly associated with RFS. Multivariate analysis showed that COL5A1 expression (HR 4.751; 95% CI: 2.613–8.637; P<0.001), tumor grade (P<0.001), and sarcomatoid (P<0.001) could be recognized as independent indicators of RFS in patients with localized ccRCC after nephrectomy.
 | Table 5 Univariate and multivariate analyses for predicting recurrence-free survival of patients with localized ccRCC (n=199) Abbreviations: ccRCC, clear cell renal cell carcinoma; ECOG PS, Eastern Cooperative Oncology Group performance status. |
The C-indices were 0.609, 0.656, and 0.673, respectively, when RFS was assessed with TNM, UISS, and SSIGN outcome algorithms alone. Interestingly, C-indices of these prognostic models were improved to 0.709, 0.739, and 0.740 with inclusion of COL5A1 expression. Furthermore, all combined models had lower AIC values compared to their conventional model alone (Table 6).
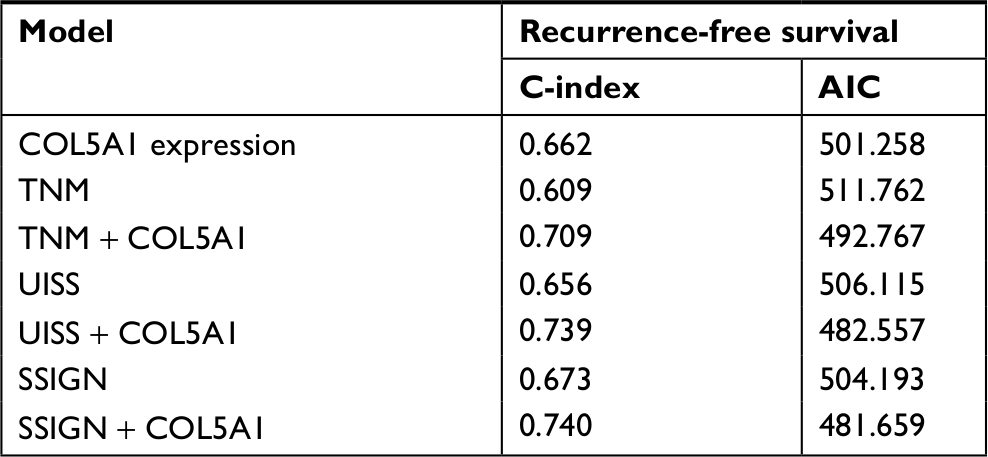 | Table 6 Comparison of the prognostic accuracy of the prognostic models and COL5A1 expression for predicting recurrence-free survival of patients with localized ccRCC Abbreviations: AIC, Akaike information criteria; ccRCC, clear cell renal cell carcinoma; SSIGN, Mayo clinic stage, size, grade, and necrosis; UISS, University of California Los Angeles Integrated Staging System. |
COL5A1 knockdown inhibits ccRCC cell proliferation and induces apoptosis in vitro
The cell line Caki-1 (highest level of COL5A1 expression; Figure 1B and C) was selected to examine whether COL5A1 knockdown could affect the growth of ccRCC cells. After transfection with COL5A1 siRNA, significant reductions of COL5A1 expression at protein and mRNA levels were observed in Caki-1 cells (Figure 3A). MTT assay showed that COL5A1 knockdown inhibited cell growth in a time-dependent manner compared with controls (Figure 3B). Colony formation assay showed that knockdown of COL5A1 caused significant reduction in colony numbers (Figure 3C). Apoptosis analysis revealed that knockdown of COL5A1 significantly increased apoptosis of Caki-1 cells (Figure 3D).
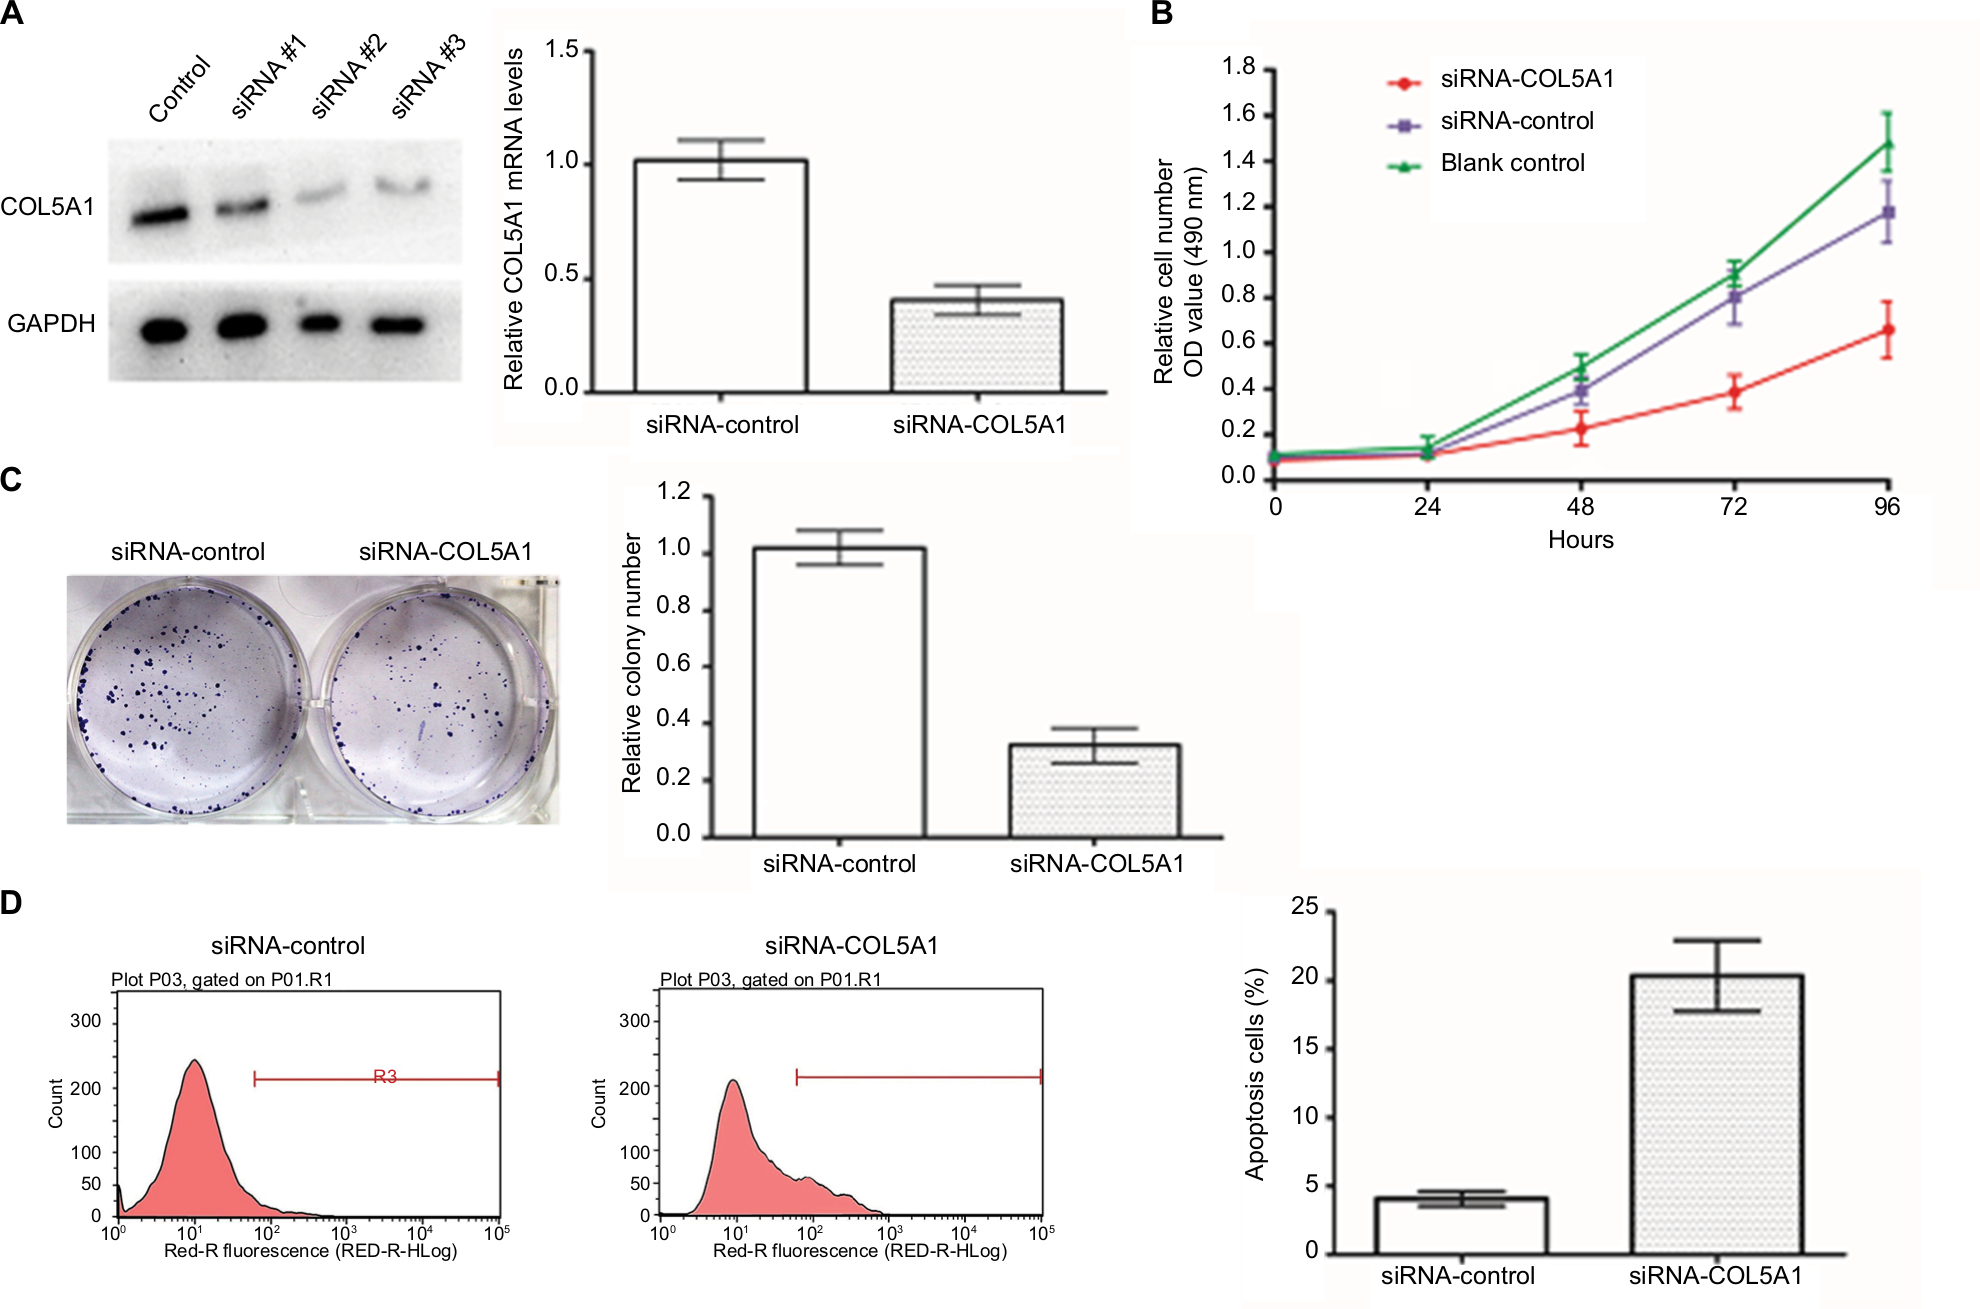 | Figure 3 Effect of COL5A1 knockdown on cell proliferation and apoptosis in vitro. Notes: (A) Effect of COL5A1 knockdown in Caki-1 cells was determined by real-time PCR and Western blot analysis. (B) Cell viability was assessed by MTT assay at 0, 24, 48, 72, and 96 hours after treatment with siRNA. Knockdown of COL5A1 inhibited Caki-1 cells proliferation. (C) Effect of COL5A1 on colony formation of Caki-1 cells. Knockdown of COL5A1 caused significant reduction of colony number (P<0.05). (D) Apoptosis assay with Caki-1 was done 48 hours post-siRNA transfection by flow cytometric analyses. Knockdown of COL5A1 significantly increased Caki-1 cells apoptosis (P<0.05). |
COL5A1 knockdown inhibits ccRCC cell migration and invasion in vitro
Compared with controls, wound healing was significantly inhibited by COL5A1 siRNA in Caki-1 cells (Figure 4A). Furthermore, Matrigel invasion assay demonstrated that the number of invading cells was significantly decreased in COL5A1 siRNA transfectants compared with their control counterparts (Figure 4B).
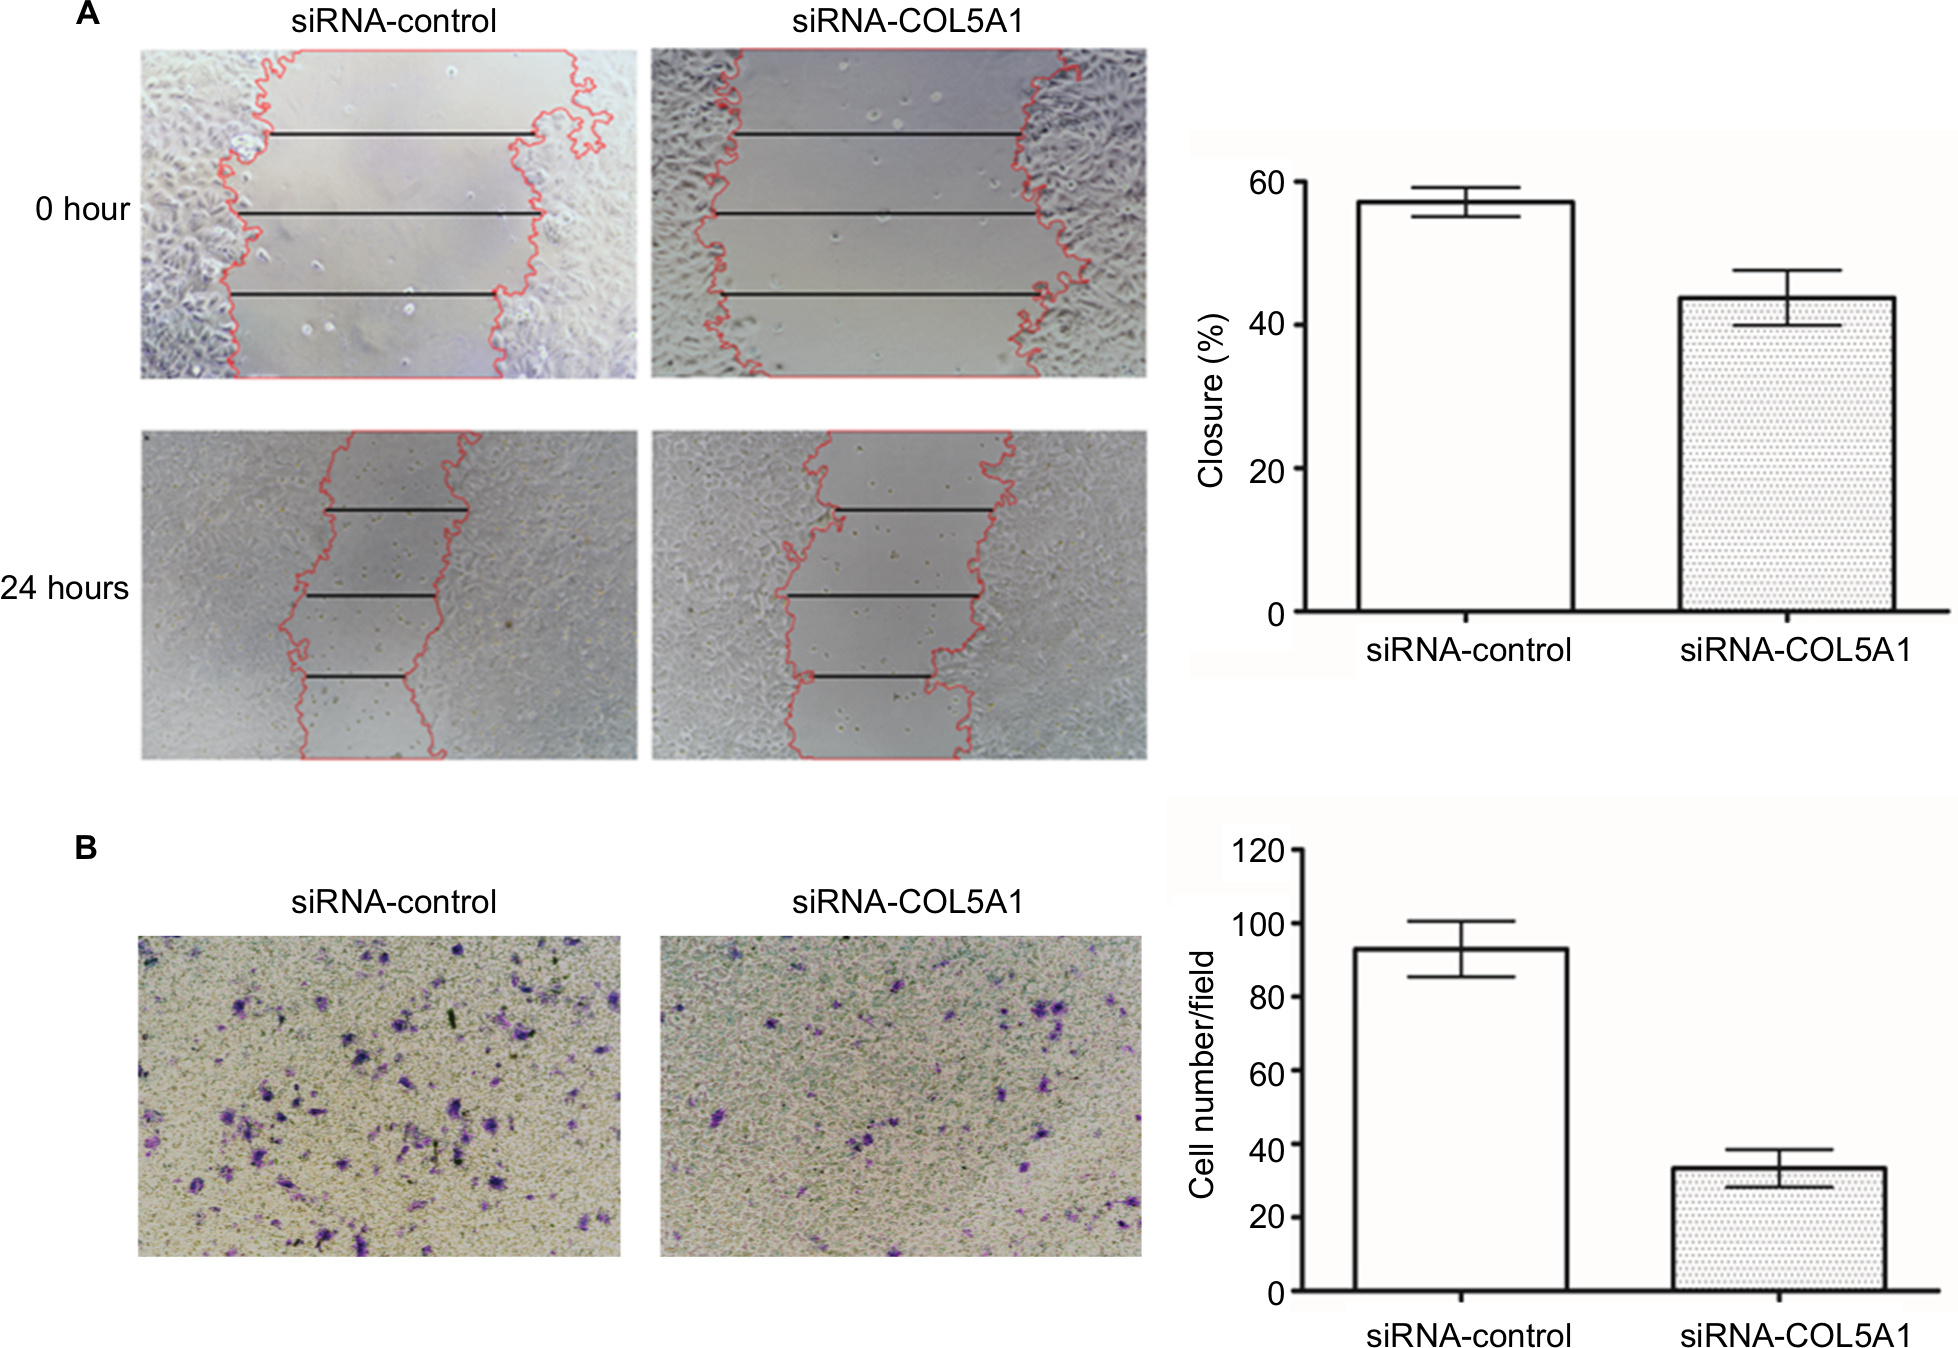 | Figure 4 Effect of COL5A1 knockdown on cell migration and invasion in vitro. Notes: (A) Representative images of wound healing assay. Knockdown of COL5A1 significantly inhibited Caki-1 cells migration. (B) Representative images of crystal violet-stained migrated cells. Knockdown of COL5A1 significantly inhibited Caki-1 cells invasion. |
COL5A1 knockdown inhibits the tumorigenicity in vivo
To investigate whether COL5A1 knockdown had the effect of inhibition of tumor growth in vivo, a nude mice xenograft model of ccRCC cell line Caki-1 was established, and intratumoral injection with siRNA-COL5A1 or siRNA-control in the nude mice with tumor burden was performed. As shown in Figure 5A, the tumor was significantly smaller in mice which received siRNA-COL5A1 intratumoral injection than in mice which received siRNA-control intratumoral injection. COL5A1 protein expression in siRNA-COL5A1 group was also decreased significantly (Figure 5B). Furthermore, COL5A1 siRNA resulted in a significant decrease in the tumor volume and weight when compared with control siRNA (all P<0.05; Figure 5C and D).
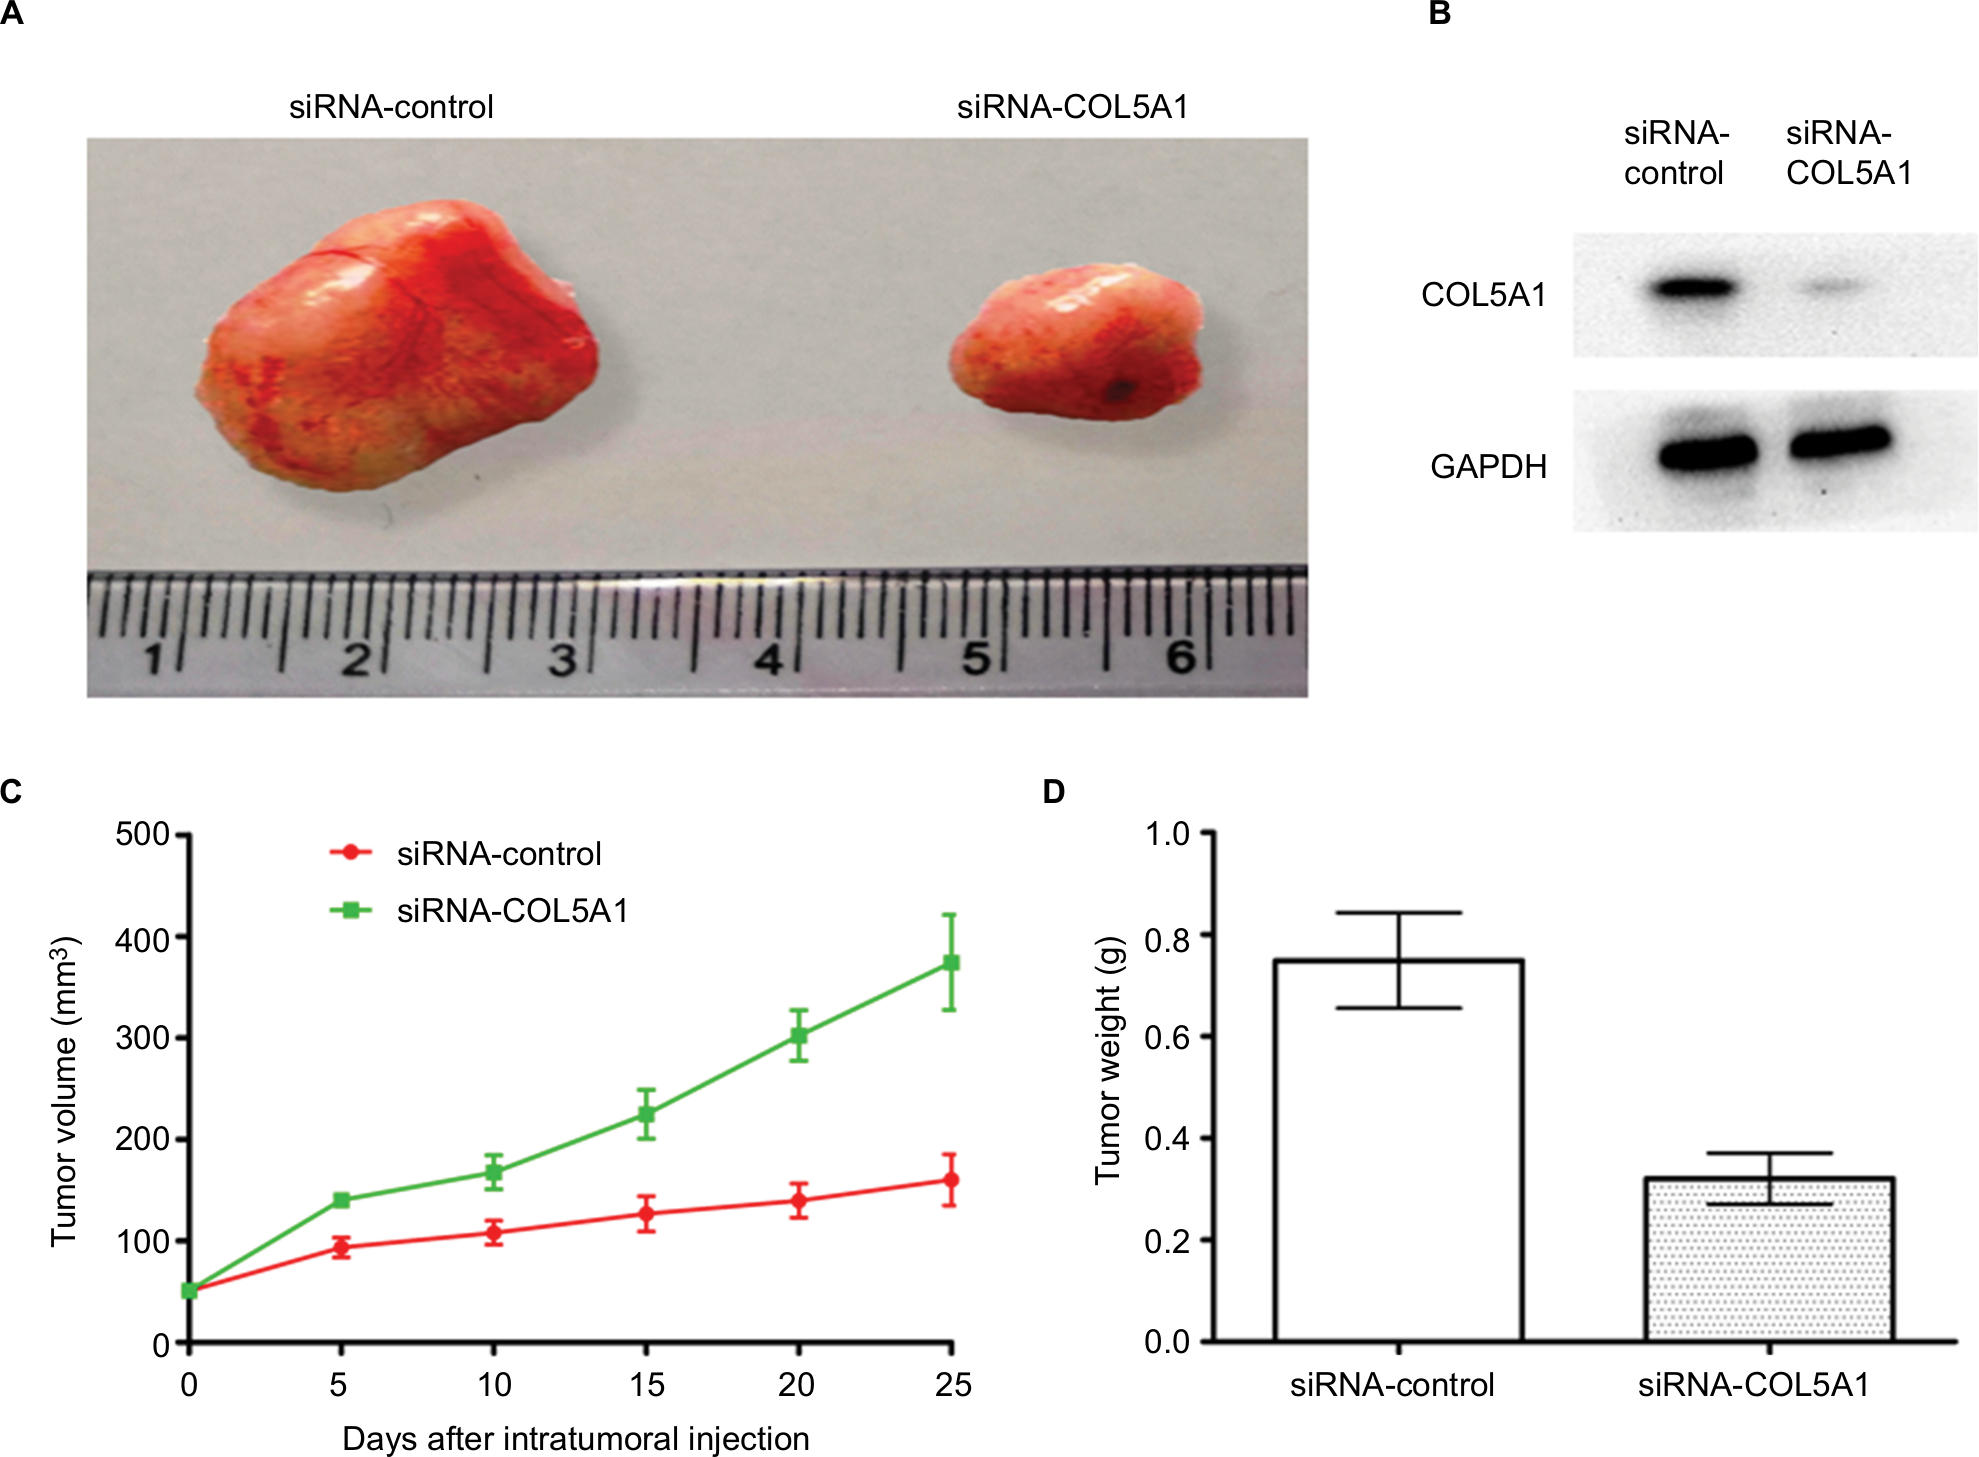 | Figure 5 Effect of COL5A1 knockdown on tumor growth in vivo. Notes: (A) Knockdown of COL5A1 by siRNA inhibited the growth of Caki-1-derived xenografts in nude mice. (B) Knockdown of COL5A1 inhibited COL5A1 protein expression in vivo. (C) The tumor growth curves of the tumor xenografts. (D) The tumor weight of siRNA-control group and siRNA-COL5A1 group (P<0.05). |
Discussion
The abnormal change of BM or ECM could lead to detachment of tumor cells, which is the first stage of tumor metastasis.22 Collagen type V (COL5) is classified as a regulatory fibril-forming collagen, and is formed by the combinations of three different chains, namely COL5A1, COL5A2, and COL5A3.23,24 COL5 presents in most connective tissue matrices and plays a functional role in some cancers including breast cancer, colon cancer, and pancreatic ductal adenocarcinoma.25–27 Furthermore, bioinformatic analysis has indicated that COL5A1 is a key factor in breast cancer, gastric cancer, papillary thyroid carcinoma, ovarian cancer, oral squamous cell carcinoma, and lung adenocarcinoma.12–17 Ren et al reported that COL5A1 expression was associated with distant metastasis-free survival in patients with breast cancer.28 Additionally, Boguslawska et al evaluated the prognostic significance of COL5A1 using TCGA data and indicated that high COL5A1 expression correlated with poor survival of ccRCC patients.18
In this study, overexpression of COL5A1 was observed in ccRCC tissue compared with the paired adjacent normal renal tissue. COL5A1 expression significantly increased with the increase of tumor diameter and tumor stage. This finding can be explained by the effect of COL5A1 on tumor cell growth. High COL5A1 expression was also associated with higher Fuhrman grade, suggesting that COL5A1 might be correlated with differentiation of ccRCC. Moreover, COL5A1 mRNA expression in patients with metastatic ccRCC was significantly higher than those with localized ccRCC, suggesting overexpression of COL5A1 could promote metastasis of ccRCC. Among 199 patients with localized ccRCC at the time of diagnosis, 55 had recurrence after nephrectomy. Compared to the patients without recurrence in follow-up, the patients with recurrence had significantly higher COL5A1 mRNA expression, suggesting that COL5A1 might correlate with recurrence of ccRCC.
Although the outcome metric of OS might be impacted by noncancer factors such as patient comorbidity status, ccRCC patients with higher COL5A1 expression had worse OS in our study, which was in agreement with the previous report by Boguslawska et al.18 In addition, multivariate analysis clearly demonstrated the ability of COL5A1 expression to predict OS probability after surgery. In order to further confirm the prognostic power of COL5A1 expression, COL5A1 expression was integrated into conventional prognostic models such as TNM, UISS, and SSIGN, respectively. We found that the accuracies of all prognostic models were improved for OS when COL5A1 expression was added.
Because recurrence after surgery is a major cause of death in patients with localized ccRCC, the association between COL5A1 expression and RFS was also investigated. The RFS curve indicated that the group with high COL5A1 expression had a significantly higher recurrence rate than the group with low COL5A1 expression. Furthermore, multivariate analysis indicated that COL5A1 expression was significantly associated with RFS of patients with localized ccRCC. Furthermore, when COL5A1 expression was integrated into the conventional prognostic models, their accuracies for RFS of ccRCC were improved. Therefore, COL5A1 expression seems to have the potential to predict localized ccRCC patients’ outcome.
To further confirm the function of COL5A1 in ccRCC, COL5A1 expression was investigated firstly in cell lines HK-2 (nonmalignant), 786-O (nonmetastatic), and Caki-1 (metastatic). Intriguingly, we found a significantly increased trend of COL5A1 expression among Caki-1 cells compared to 786-O cells and 786-O cells compared to HK-2 cells. Our finding suggests that COL5A1 might relate to metastatic potentiality of ccRCC cells. We observed that a transient knockdown of COL5A1 significantly inhibited cell proliferation and induced cell apoptosis in vitro. Moreover, deletion of COL5A1 expression significantly inhibited tumor growth in vivo using siRNA technique. Thus, COL5A1 might be an important factor for the proliferation of ccRCC. In addition, COL5A1 knockdown also significantly inhibited cell migration and invasion in vitro, suggesting that COL5A1 is involved in malignancy of ccRCC. Several limitations of this study should be acknowledged. First, a single cohort seems to be inadequate to reach greater reliability. Multicentric and large-scale validation studies are required in order to confirm our present findings. Second, the molecular mechanism of COL5A1 in ccRCC needs to be further elucidated.
Conclusion
The present study first showed that COL5A1 expression was upregulated in the majority of the ccRCC clinical tissue specimens. Overexpression of COL5A1 was positively correlated with the aggressive phenotype of ccRCC, and predicted poor survival. COL5A1 knockdown using siRNA inhibited cell proliferation, induced cell apoptosis, inhibited cell migration and invasion in vitro, and inhibited tumor growth in vivo. Therefore, COL5A1 may be a novel prognostic biomarker and a promising therapeutic target for ccRCC.
Acknowledgment
This study was funded by the Natural Science Foundation of Anhui Province (1508085MH157).
Disclosure
The authors report no conflicts of interest in this work.
References
Hsieh JJ, Purdue MP, Signoretti S, et al. Renal cell carcinoma. Nat Rev Dis Primers. 2017;3:17009. | ||
Wang Y, Li G, Wan F, Dai B, Ye D. Prognostic value of D-lactate dehydrogenase in patients with clear cell renal cell carcinoma. Oncol Lett. 2018;16(1):866–874. | ||
Feng G, Jiang F, Pan C, Pu C, Huang H, Li G. Quantification of peripheral blood CD133 mRNA in identifying metastasis and in predicting recurrence of patients with clear cell renal cell carcinoma. Urol Oncol: Semin Origin Invest. 2014;32(1):44.e9–14. | ||
Mitsui Y, Shiina H, Kato T, et al. Versican promotes tumor progression, metastasis and predicts poor prognosis in renal carcinoma. Mol Cancer Res. 2017;15(7):884–895. | ||
Kawano Y, Takahashi W, Eto M, et al. Prognosis of metastatic renal cell carcinoma with first-line interferon-α therapy in the era of molecular-targeted therapy. Cancer Sci. 2016;107(7):1013–1017. | ||
López JI, Errarte P, Erramuzpe A, et al. Fibroblast activation protein predicts prognosis in clear cell renal cell carcinoma. Hum Pathol. 2016;54:100–105. | ||
Ni D, Ma X, Li HZ, et al. Downregulation of FOXO3a promotes tumor metastasis and is associated with metastasis-free survival of patients with clear cell renal cell carcinoma. Clin Cancer Res. 2014;20(7):1779–1790. | ||
Mikami S, Oya M, Mizuno R, Kosaka T, Katsube K, Okada Y. Invasion and metastasis of renal cell carcinoma. Med Mol Morphol. 2014;47(2):63–67. | ||
Ho TH, Serie DJ, Parasramka M, et al. Differential gene expression profiling of matched primary renal cell carcinoma and metastases reveals upregulation of extracellular matrix genes. Ann Oncol. 2017;28(3):604–610. | ||
Gupta V, Bassi DE, Simons JD, et al. Elevated expression of stromal palladin predicts poor clinical outcome in renal cell carcinoma. PLoS One. 2011;6(6):e21494. | ||
Zhang JJ, Yano H, Sasaki T, Matsuo N, Yoshioka H. The pro-α1(V) collagen gene (Col5a1) is coordinately regulated by miR-29b with core promoter in cultured cells. Connect Tissue Res. 2018;59(3):263–273. | ||
Chai F, Liang Y, Zhang F, Wang M, Zhong L, Jiang J. Systematically identify key genes in inflammatory and non-inflammatory breast cancer. Gene. 2016;575(2 Pt 3):600–614. | ||
Zhao X, Cai H, Wang X, Ma L. Discovery of signature genes in gastric cancer associated with prognosis. Neoplasma. 2016;63(2):239–245. | ||
Qiu J, Zhang W, Xia Q, et al. RNA sequencing identifies crucial genes in papillary thyroid carcinoma (PTC) progression. Exp Mol Pathol. 2016;100(1):151–159. | ||
Sun Q, Zhao H, Zhang C, et al. Gene co-expression network reveals shared modules predictive of stage and grade in serous ovarian cancers. Oncotarget. 2017;8(26):42983–42996. | ||
Li G, Li X, Yang M, Xu L, Deng S, Ran L. Prediction of biomarkers of oral squamous cell carcinoma using microarray technology. Sci Rep. 2017;7(1):42105. | ||
Liu W, Wei H, Gao Z, et al. COL5A1 may contribute the metastasis of lung adenocarcinoma. Gene. 2018;665:57–66. | ||
Boguslawska J, Kedzierska H, Poplawski P, Rybicka B, Tanski Z, Piekielko-Witkowska A. Expression of genes involved in cellular adhesion and extracellular matrix remodeling correlates with poor survival of patients with renal cancer. J Urol. 2016;195(6):1892–1902. | ||
Jung M, Ramankulov A, Roigas J, et al. In search of suitable reference genes for gene expression studies of human renal cell carcinoma by real-time PCR. BMC Mol Biol. 2007;8(1):47. | ||
Moriya K, Bae E, Honda K, et al. A fibronectin-independent mechanism of collagen fibrillogenesis in adult liver remodeling. Gastroenterology. 2011;140(5):1653–1663. | ||
Xue Y, Wu G, Liao Y, et al. GOLPH3 is a novel marker of poor prognosis and a potential therapeutic target in human renal cell carcinoma. Br J Cancer. 2014;110(9):2250–2260. | ||
Yu M, Lu B, Liu Y, Me Y, Wang L, Li H. Interference with Tim-3 protein expression attenuates the invasion of clear cell renal cell carcinoma and aggravates anoikis. Mol Med Rep. 2017;15(3):1103–1108. | ||
Mak KM, Png CYM, Lee DJ. Type V collagen in health, disease, and fibrosis. Anat Rec. 2016;299(5):613–629. | ||
Nardo T, Micalizzi G, Vicinanza R, De Iuliis F, Taglieri L, Scarpa S. Adhesion to type V collagen enhances staurosporine-induced apoptosis of adrenocortical cancer cells. Tumor Biol. 2014;35(10):9949–9955. | ||
Barsky SH, Rao CN, Grotendorst GR, Liotta LA. Increased content of type V collagen in desmoplasia of human breast carcinoma. Am J Pathol. 1982;108(3):276–283. | ||
Fischer H, Stenling R, Rubio C, Lindblom A. Colorectal carcinogenesis is associated with stromal expression of COL11A1 and COL5A2. Carcinogenesis. 2001;22(6):875–878. | ||
Berchtold S, Grünwald B, Krüger A, et al. Collagen type V promotes the malignant phenotype of pancreatic ductal adenocarcinoma. Cancer Lett. 2015;356(2 Pt B):721–732. | ||
Ren W, Zhang Y, Zhang L, Lin Q, Zhang J, Xu G. Overexpression of collagen type V α1 chain in human breast invasive ductal carcinoma is mediated by TGF-β1. Int J Oncol. 2018;52(5):1694–1704. |
 © 2019 The Author(s). This work is published and licensed by Dove Medical Press Limited. The full terms of this license are available at https://www.dovepress.com/terms.php and incorporate the Creative Commons Attribution - Non Commercial (unported, v3.0) License.
By accessing the work you hereby accept the Terms. Non-commercial uses of the work are permitted without any further permission from Dove Medical Press Limited, provided the work is properly attributed. For permission for commercial use of this work, please see paragraphs 4.2 and 5 of our Terms.
© 2019 The Author(s). This work is published and licensed by Dove Medical Press Limited. The full terms of this license are available at https://www.dovepress.com/terms.php and incorporate the Creative Commons Attribution - Non Commercial (unported, v3.0) License.
By accessing the work you hereby accept the Terms. Non-commercial uses of the work are permitted without any further permission from Dove Medical Press Limited, provided the work is properly attributed. For permission for commercial use of this work, please see paragraphs 4.2 and 5 of our Terms.