Back to Journals » Drug Design, Development and Therapy » Volume 20
Optimizing Flumatinib Therapy in Chinese Chronic-Phase Chronic Myeloid Leukemia Based on Therapeutic Drug Monitoring
Authors Cheng F, Wang F, Cui Z, Li Q, Liu X, Li W
Received 26 March 2026
Accepted for publication 6 June 2026
Published 18 June 2026 Volume 2026:20 612207
DOI https://doi.org/10.2147/DDDT.S612207
Checked for plagiarism Yes
Review by Single anonymous peer review
Peer reviewer comments 3
Editor who approved publication: Professor Anastasios Lymperopoulos
Fang Cheng,1,2,* Fan Wang,3,* Zheng Cui,2 Qiang Li,2 Xin Liu,1 Weiming Li4
1Department of Biomedical Engineering, College of Life Science and Technology, Huazhong University of Science and Technology, Wuhan, 430074, Hubei, People’s Republic of China; 2Department of Pharmacy, Union Hospital, Tongji Medical College, Huazhong University of Science and Technology, Wuhan, 430022, People’s Republic of China; 3Department of Hematology, Suizhou Hospital, Hubei University of Medicine, Suizhou, 441300, Hubei, People’s Republic of China; 4Department of Hematology, Union Hospital, Tongji Medical College, Huazhong University of Science and Technology, Wuhan, 430022, People’s Republic of China
*These authors contributed equally to this work
Correspondence: Xin Liu, Email [email protected] Weiming Li, Email [email protected]
Background: The quantitative exposure-response-toxicity relationships for flumatinib have yet to be established in chronic-phase chronic myeloid leukemia (CML-CP) patients.
Methods: We investigated associations between steady-state flumatinib plasma concentrations and clinical efficacy/adverse events in CML-CP patients.
Results: Flumatinib exposure exhibited dose-dependent pharmacokinetics. In first-line patients, responders achieving major molecular response (MMR) exhibited significantly higher Cmax_2h (2-hour post-dose concentration) than non-responders (Non-MMR) (127.75± 60.40 vs. 58.29± 30.47 ng/mL; p< 0.001). Similarly, deep molecular response (DMR) responders showed higher Cmax_2h than Non-DMR patients (134.63± 66.45 vs. 88.87± 47.89 ng/mL; p< 0.001). Receiver operating characteristic analysis identified an optimal Cmax_2h threshold of > 87.75 ng/mL for MMR (AUC=0.87, 95% CI: 0.78– 0.96) and > 132.0 ng/mL for DMR (AUC=0.79, 95% CI: 0.68– 0.89). In the later-line, the effective treatment group also achieved substantially higher mean Cmax_2h than the failure group (133.75± 39.02 vs 88.69± 65.07 ng/mL; p< 0.01). Furthermore, the results identified an association between diarrhea and a Cmin (trough concentration)> 49 ng/mL, as well as between nausea and vomiting and a Cmax_2h> 126.5 ng/mL.
Conclusion: Flumatinib demonstrates exposure-efficacy-toxicity relationships in Chinese patients with CML-CP. These exploratory findings suggest potential concentration thresholds that may inform future therapeutic drug monitoring strategies, pending prospective validation.
Keywords: chromic myeloid leukemia, flumatinib, therapeutic drug monitoring, exposure-efficacy, exposure-toxicity
Introduction
Chronic myeloid leukemia (CML) is a clonal myeloproliferative disorder originating from hematopoietic stem cells, pathologically characterized by the formation of the Philadelphia chromosome, which generates the BCR::ABL1 fusion gene.1,2 This oncogene encodes a constitutively active tyrosine kinase that drives uncontrolled proliferation of myeloid cells. The advent of BCR::ABL1 tyrosine kinase inhibitors (TKIs) has revolutionized the therapeutic landscape of CML, transforming it from a lethal condition into a manageable chronic disease.3,4 Consequently, the life expectancy of CML patients now approaches that of the general population. Nevertheless, achieving and sustaining deep molecular response (DMR) remains a critical therapeutic objective to prevent disease progression and enable treatment-free remission (TFR).5
Flumatinib, a second-generation potent TKI independently developed in China,6 exhibits significantly enhanced inhibitory activity against BCR::ABL1 kinase compared to imatinib,7 while demonstrating comparable efficacy to dasatinib and nilotinib.8,9 This agent has been approved in China for first-line treatment of chronic-phase CML (CML-CP). Phase III clinical trials have demonstrated that flumatinib significantly improves both cytogenetic response (CCyR) and molecular response rates, with a favorable safety profile.10 Nevertheless, substantial interpatient heterogeneity persists in both therapeutic outcomes and adverse events (AEs) rates, suggesting that pharmacokinetic variability may play a critical role in clinical performance.
Therapeutic drug monitoring (TDM) is essential for optimizing antineoplastic agents with narrow therapeutic windows.11–13 In the realm of BCR::ABL1 TKIs, imatinib boasts the most extensive evidence base. Based on published literature regarding the utility of TDM in imatinib therapy, the European Society for Medical Oncology (ESMO) has issued TDM guidelines for imatinib.14 Concurrently, emerging evidence also suggests the potential role of TDM in the treatment of other BCR::ABL1 TKIs (such as dasatinib, nilotinib, and bosutinib).15–17 However, quantitative exposure-response-toxicity relationships for flumatinib remain undefined. This study therefore investigates associations between steady-state flumatinib plasma concentrations and clinical efficacy/AEs in CML-CP patients, aiming to establish an evidence-based target concentration window that maximizes therapeutic benefit-to-risk ratios, which enable precision dosing strategies to advance personalized CML management.
Materials and Methods
Patient Selection
Patients with CML receiving flumatinib were enrolled at Union Hospital, Tongji Medical College, Huazhong University of Science and Technology between January 2020 and December 2024. Eligibility criteria comprised: ① diagnosed as CML-CP; ② ≥1 year of flumatinib treatment; ③ age ≥18 years; and ④ documented compliance. Patients transitioning to flumatinib within one month of initiating first-line TKI therapy were categorized as first-line recipients. Exclusion criteria included accelerated/blast-phase, concurrent use of flumatinib-interacting medications, or incomplete clinical data. Ethical approval was granted by the Institutional Ethics Committee of Tongji Medical College ([2021] 0784), in accordance with the Declaration of Helsinki. Demographic data, comorbidities, medications, laboratory results, AEs, and clinical parameters were collected prospectively during routine outpatient follow-ups.
Drug Administration
In first-line therapy, flumatinib treatment decisions were made collaboratively with patients through shared decision-making. For subsequent-line therapy, clinicians determined flumatinib eligibility based on rigorous assessment of the patient’s treatment history, disease progression profile, pharmacodynamics, and socioeconomic factors. In this study, all patients initially received a fixed oral daily dose of 600 mg administered once daily (standard dose). Implement dose reductions (400 mg or 200 mg daily) after achieving DMR to manage AEs, reduce financial burden, or prepare for therapy discontinuation. Patients meeting TFR eligibility criteria became candidates for TFR discontinuation attempts.
Therapeutic Drug Monitoring
Flumatinib reached its maximum plasma concentration at a median time of 2 hours after single-dose administration, followed by gradual elimination with a mean apparent terminal half-life (t1/2) ranging from 16.0 to 16.9 hours.18 Blood samples for flumatinib concentration measurement were collected and processed according to standardized operating procedures. After 7–10 days of continuous dosing, Cmin samples were collected within half an hour (±5 min) before pre-dose and Cmax samples at 2 hours (±15 min) post-dose (Cmax_2h). This fixed-time sampling strategy was selected based on the flumatinib rapid and consistent absorption profile, analogous to TDM practices for dasatinib.16 Patients undergoing dose reduction contributed paired pre- and post-reduction concentration measurements when blood sampling adhered to protocol-defined timing. Valid flumatinib concentration data totaled 110 measurements at 600 mg daily, 32 at 400 mg daily, and 6 at 200 mg daily. All samples consisted of 3–5 mL of whole blood collected in EDTA anticoagulant tubes and were immediately centrifuged at 10,625 ×g for 10 minutes at 4°C. The plasma was then transferred to polypropylene tubes and stored at −80°C within 2 hours of collection until batch analysis. Flumatinib concentrations in plasma were determined using liquid chromatography-tandem mass spectrometry (LC-MS/MS).19 Prior to sample analysis, our laboratory had fully validated this method in accordance with the FDA bioanalytical method validation guidance. The validation covered selectivity, matrix effects, recovery, stability, and dilution integrity, with all results meeting the acceptance criteria.
Response Assessment
CML-CP was defined as <10% blasts in peripheral blood or bone marrow without extramedullary involvement. Patient response was monitored via serial cytogenetic and molecular analyses measuring BCR::ABL1 mRNA levels on the international scale (IS). CCyR corresponded to 0% Philadelphia chromosome-positive metaphases in bone marrow. Major molecular response (MMR) was defined as BCR::ABL1IS ≤ 0.1%, and DMR as BCR::ABL1IS≤ 0.01%.20 In the later-line of flumatinib therapy, treatment efficacy is defined as achieving at least a 1-log reduction in molecular response. Maintenance of molecular response levels or instances of only minor fluctuations, marginal decline, or an elevation in BCR::ABL1 transcripts are uniformly classified as treatment failure.
Adverse Events
Standard hematological and biochemical assessments were performed at every follow-up visit. AEs were documented, including hematological toxicities (neutropenia, anemia, and thrombocytopenia), gastrointestinal AEs (nausea, vomiting, and diarrhea), fatigue, rash, musculoskeletal pain, and alterations in hepatic or renal function.
Statistical Analysis
Categorical variables are summarized as frequencies and percentages. Normally distributed continuous data are expressed as mean ± standard deviation, non-normally distributed data are presented as median and interquartile range (IQR). Receiver operating characteristic (ROC) curves identified optimal cut-off values. Categorical variable comparisons employed Fisher’s exact or χ2-tests. Continuous variable analyses used Mann–Whitney U or Kruskal–Wallis tests, as appropriate. Survival probabilities were estimated using Kaplan-Meier method with Log rank testing. To minimize treatment resistance confounding, the association between clinical response and concentration analyses were restricted to first-line patients analyzed with standard dose (all patients reduced their dosage after reaching DMR). In addition, we also restricted the exposure-toxicity analysis to standard dose. Multivariable logistic regression models were constructed to evaluate the independent predictive value of Cmax_2h for MMR and DMR, while controlling for potential confounding factors. Candidate covariates included age at diagnosis, sex, and flumatinib therapy duration. Statistical significance was defined as p < 0.05.
Results
Patient Characteristics
A total of 110 patients met the inclusion criteria following exclusions which comprised: 8 patients diagnosed in accelerated/blastic phase, 44 with non-compliant pharmacokinetic sampling times, 32 with incomplete data, 26 treated with flumatinib for <1 year, and 20 lost to follow-up. The study flowchart was shown in Figure 1. The cohort included 68 (61.8%) males with a median diagnosis age of 38 years (IQR 30–52). Patients received TKIs for a median of 4.06 years (IQR 1.82–5.48), including flumatinib for a median of 2.69 years (IQR 1.54–4.10). According to the EUTOS long-term survival (ELTS) score, 50.9% were low-risk, 19.1% intermediate-risk, 2.7% high-risk, and 27.3% unclassified. Flumatinib was administered as first-line therapy in 68 (61.8%) patients, second-line in 26 (23.6%), and third-line or above in 16 (14.5%). More clinical information are shown in Table 1.
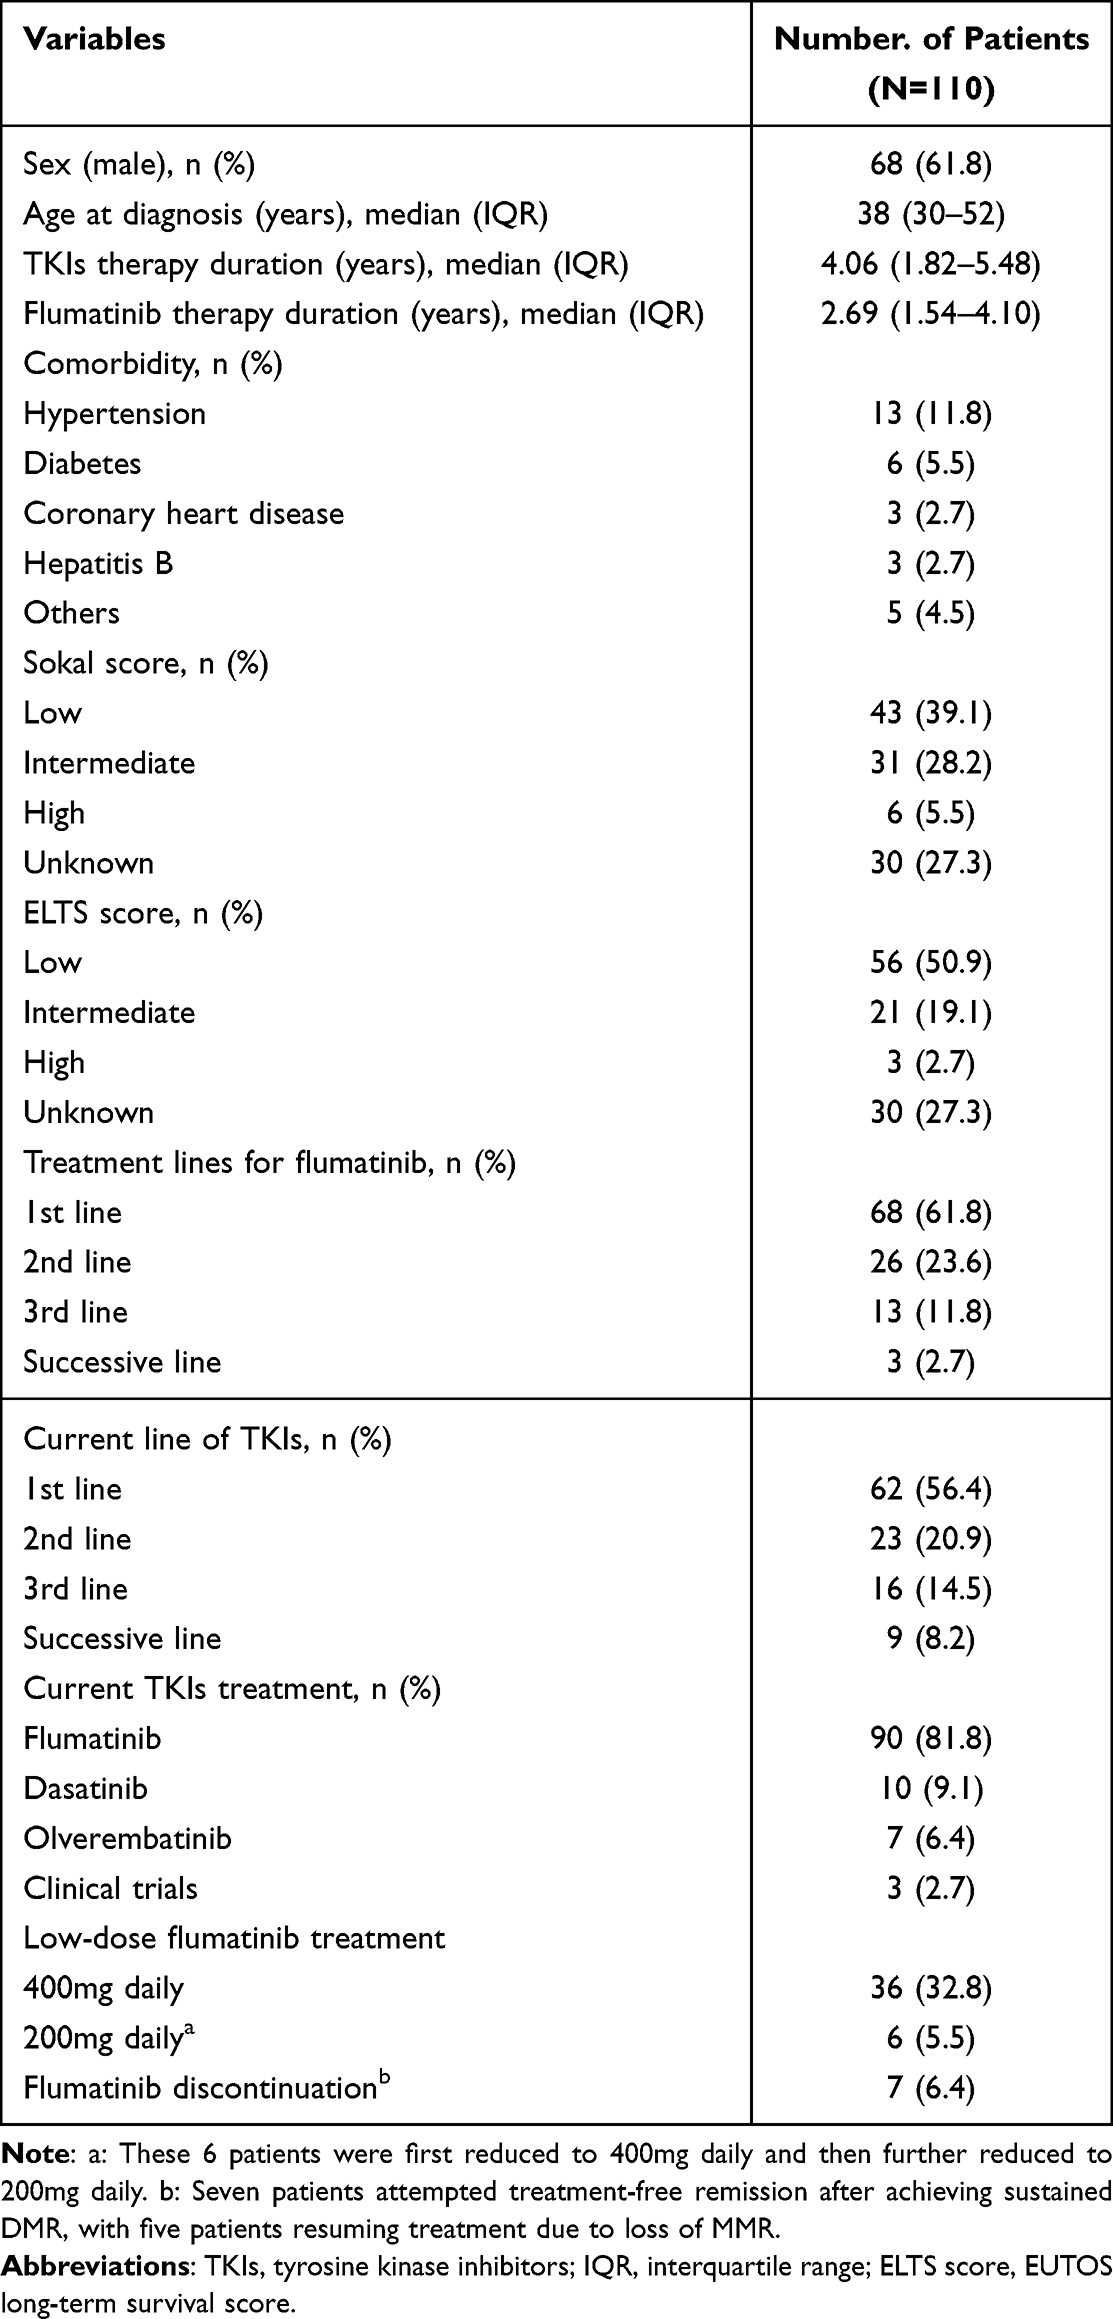 |
Table 1 Demographic and Clinical Characteristics of Patients with Chronic Myeloid Leukemia |
 |
Figure 1 The study flowchart. |
Relationship Between Flumatinib Concentration and Clinical Response
Flumatinib exposure demonstrated dose dependency across the 200 mg, 400 mg, and 600 mg daily dose groups (Table 2). Mean Cmin increased with ascending dose (p<0.001): 12.64±8.28 ng/mL (200 mg), 28.10±18.67 ng/mL (400 mg), and 44.61±29.22 ng/mL (600 mg). Mean Cmax_2h similarly rose with dose (p<0.001): 35.33±10.11 ng/mL (200 mg), 73.83±35.64 ng/mL (400 mg), and 113.31±65.47 ng/mL (600 mg).
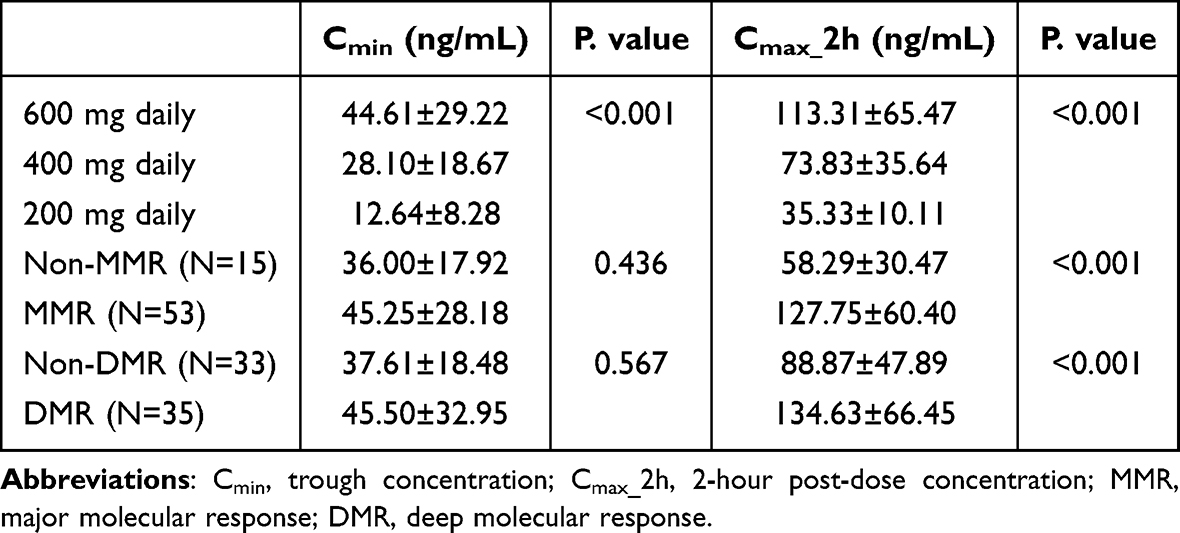 |
Table 2 The Relationship Between Flumatinib Concentration and Clinical Response in First-Line Therapy |
In first-line patients, responders achieving MMR (n=53) exhibited significantly higher Cmax_2h than non-responders (Non-MMR, n=15) (127.75±60.40 vs. 58.29±30.47 ng/mL; p<0.001). Similarly, DMR responders (n=35) showed higher Cmax_2h than Non-DMR patients (n=33) (134.63±66.45 vs. 88.87±47.89 ng/mL; p<0.001). No significant differences were observed in Cmin between responders and non-responders for either endpoint (Table 2). Multivariable logistic regression analysis showed that (Table S1), after adjusting for potential confounding factors such as age, sex, and flumatinib therapy duration, Cmax_2h remained a significant independent predictor of both MMR (OR=0.971, p=0.022) and DMR (OR=0.981, p=0.010).
Receiver operating characteristic analysis identified an optimal Cmax_2h threshold of >87.75 ng/mL for MMR (AUC=0.87, 95% CI: 0.78–0.96; sensitivity 77.4%, specificity 86.7%; Figure 2A) and >132.0 ng/mL for DMR (AUC=0.79, 95% CI: 0.68–0.89; sensitivity 51.4%, specificity 93.5%; Figure 2B). Patients with Cmax_2h exceeding these thresholds demonstrated significantly higher cumulative incidence of MMR (p=0.002; Figure 2C) and DMR (p<0.001; Figure 2D).
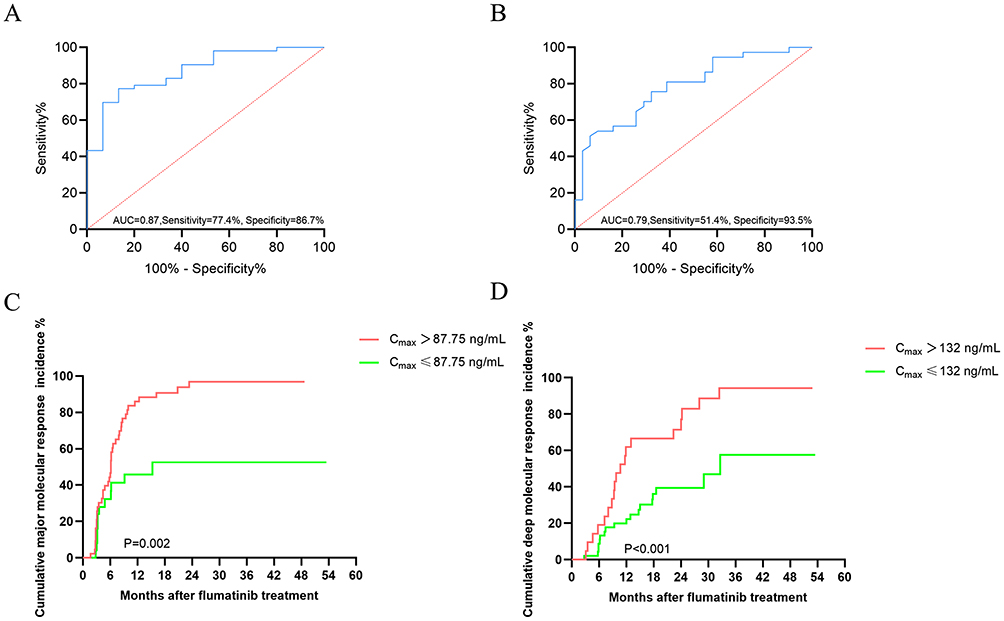 |
Figure 2 The relationship between flumatinib concentration and molecular response. (A) Receiver operator curve analysis for major molecular response; (B) Receiver operator curve analysis for deep molecular response; (C) Cumulative major molecular response stratified by concentration; (D) Cumulative deep molecular response stratified by concentration. |
Flumatinib Concentration and Later-Line Treatment
Among 42 patients receiving later-line flumatinib therapy, median treatment duration was comparable between cohorts: 46.4 months (IQR 23.1–54.2) versus 48.5 months (IQR 34.1–58.0), respectively, with both groups demonstrating similarly poor baseline molecular response prior to flumatinib initiation. 34.6% (9/26) and 26.9% (7/26) achieved MMR and DMR in the second-line group, versus 18.8% (3/16) and 25.0% (4/16) in the third-line group (Table S2). Pharmacokinetic analysis revealed patients receiving 600mg daily exhibited significantly higher exposures than those on 400mg (Cmin: 46.39±31.26 vs. 24.32±12.60 ng/mL, p=0.019; Cmax_2h: 107.37±59.57 vs. 72.33±43.86 ng/mL, p=0.048). Clinically, the effective treatment group achieved substantially higher mean Cmax_2h than the failure group (133.75±39.02 vs 88.69±65.07 ng/mL; p=0.003, Table 3).
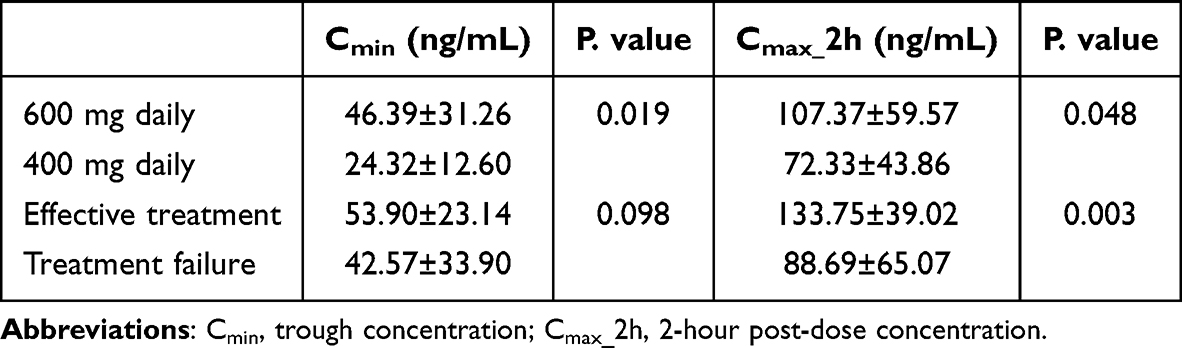 |
Table 3 The Relationship Between Flumatinib Concentration and Clinical Response in Later-Line Therapy |
Correlation of Flumatinib Concentration with AEs
The most common AEs associated with flumatinib were diarrhea (36.4%), hyperuricemia (20.0%), thrombocytopenia (18.2%), and hepatobiliary dysfunction (15.5%). Patients experiencing diarrhea demonstrated significantly higher concentrations than unaffected individuals (Cmax_2h: 136.28±75.09 vs. 99.39±54.94 ng/mL; p=0.006; Cmin: 56.07±36.10 vs. 37.66±21.63 ng/mL; p=0.002). Similarly, those with nausea and vomiting exhibited elevated Cmin (61.75±38.92 vs. 42.41±27.24 ng/mL; p=0.034). Cmax_2h showed stronger differentiation: nausea and vomiting patients had substantially higher Cmax_2h versus controls (151.05±68.81 vs. 108.49±63.81 ng/mL; p=0.016; Table 4 and Table S3). ROC analysis confirmed discriminatory capacity for both AEs: for diarrhea, a Cmin >49.0 ng/mL yielded AUC=0.68 (95% CI: 0.58–0.79), sensitivity 62.5%, and specificity 74.2%. For nausea/vomiting, Cmax_2h >126.5 ng/mL achieved AUC=0.72 (95% CI: 0.56–0.87), sensitivity 75.0%, and specificity 70.2% (Figure S1).
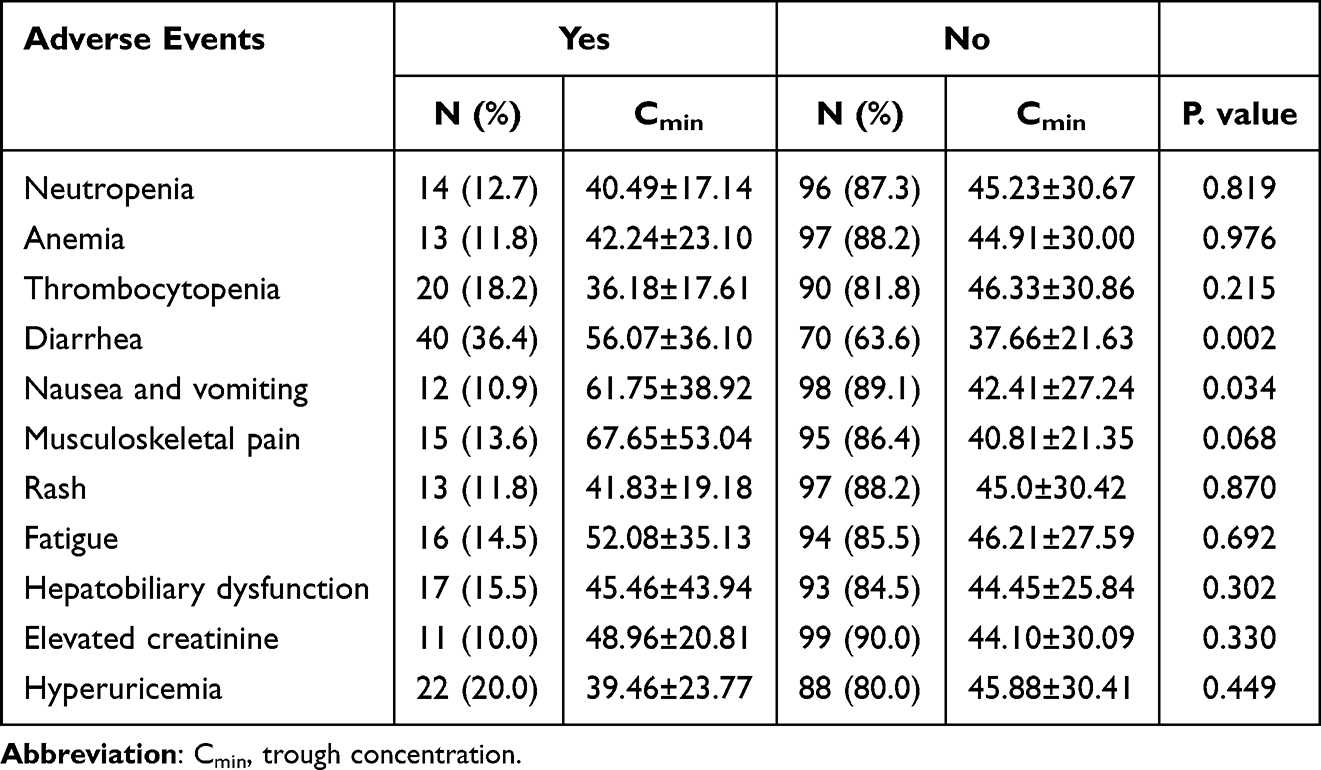 |
Table 4 The Correlation Between Adverse Events and Flumatinib Trough Concentrations |
Correlation of Flumatinib Concentration with Age
Flumatinib concentrations demonstrated an age-dependent relationship (Table S4). Cmin increased progressively with advancing age (p=0.008): 30.96±16.90 ng/mL (<35 years), 46.07±20.81 ng/mL (35–56 years), and 56.18±43.74 ng/mL (>56 years). Similarly, Cmax_2h showed elevated values in older patients (143.84±62.10 ng/mL for >56 years vs. 108.59±51.44 ng/mL for 35–56 years vs. 90.81±43.67 ng/mL for <35 years), though these differences did not reach statistical significance (p=0.087). Notably, elderly patients exhibited greater inter-individual variability, particularly in Cmin.
Low-Dose Therapy
Among first-line patients, 24 underwent dose reduction to 400 mg daily, of these, 3 subsequently reduced to 200 mg daily. For later-line therapy, 12 patients reduced to 400 mg daily, with 3 further reducing to 200 mg daily. The reasons for reduction included AEs (n=16, 44.4%), preparation for treatment discontinuation (n=14, 38.9%), and economic factors (n=6, 16.7%). Among 36 patients who achieved DMR before dose reduction, 2 (91.9%) patients lost the MMR, and 4 patients lost the DMR. Patients who maintained MMR after dose reduction had significantly higher Cmax_2h at the time of reduction compared to those who subsequently lost MMR (77.03 ± 34.35 vs. 25.80 ± 15.27 ng/mL; p=0.024). Similarly, patients who maintained DMR had significantly higher Cmax_2h than those who lost DMR (79.94 ± 33.63 vs. 31.05 ± 12.54 ng/mL; p=0.002). Cmin did not differ significantly between response maintenance and loss groups (Table S5).
Discussion
This study presents a systematic characterization of the multidimensional relationship between exposure, efficacy, and toxicity of flumatinib in Chinese patients with CML-CP, identifying preliminary concentration thresholds that may inform future therapeutic drug monitoring strategies. The integrated findings suggest that flumatinib plasma concentrations are associated with both molecular response and gastrointestinal AEs in a dose-dependent manner. These exploratory associations warrant prospective validation to establish causal relationships.
Jiang et al18 characterized the pharmacokinetic profile of flumatinib at doses of 400 mg and 600 mg, finding approximately dose-proportional increases in Cmax and area under the curve (AUC0-t) between these doses. Specifically, steady-state concentrations for the 600 mg daily dosage were Cmax: 129.0±75.8 ng/mL compared to 96.2±25.0 ng/mL for the 400 mg daily dosage, and Cmin: 33.1±14.3 ng/mL versus 29.5±12.4 ng/mL, respectively. In our study, we observed comparable concentrations for the 600 mg and 400 mg daily doses: Cmax_2h was 113.31±65.47 ng/mL versus 73.83±35.64 ng/mL, and Cmin was 44.61±29.22 ng/mL versus 28.10±18.67 ng/mL.
Numerous studies have established a significant correlation between the plasma concentration of various TKIs and both their clinical efficacy and toxicity profiles. For example, a Cmin of imatinib greater than 1000 ng/mL is associated with a reduced risk of treatment failure.21,22 Dasatinib Cmax >50 ng/mL is associated with better clinical responses, while a Cmin <2.5 ng/mL significantly reduces the incidence of pleural effusion.16,23 Higher nilotinib Cmin in the MMR group compared with the non-MMR group, identifying an efficacy threshold of 636.99 ng/mL.24 In the present study, the observation that Cmax_2h was significantly associated with both MMR and DMR, whereas Cmin did not reach statistical significance in this cohort, suggests that Cmax_2h may be a more informative predictor of molecular response than trough exposure for flumatinib. However, this finding should be interpreted cautiously, intensive pharmacokinetic profiling would be required to definitively characterize the relative contributions of exposures to flumatinib efficacy. ROC analysis identified a proposed MMR threshold at a Cmax_2h>87.75 ng/mL, suggesting potentially useful discriminatory performance. The relatively wide confidence interval and the retrospective derivation of this threshold underscore the need for external validation before clinical application. For DMR, while the threshold of 132.0 ng/mL achieved high specificity (93.5%), sensitivity remained limited at 51.4%. This indicates that higher exposure may be associated with DMR, but ultra-high exposure is not sufficient for achieving DMR.
If validated in prospective studies, these exploratory findings could potentially inform clinical management strategies. For example, patients who do not achieve MMR on the standard 600 mg daily dose and exhibit Cmax_2h≤87.75 ng/mL might be candidates for dose escalation studies to evaluate whether enhanced exposure improves molecular response, provided tolerability is maintained. Similarly, patients with Cmax_2h exceeding 132 ng/mL who fail to attain DMR could be prioritized for adherence assessments, drug-drug interaction screening, and BCR::ABL1 kinase domain mutation testing in future interventional trials. However, these are hypothetical applications derived from retrospective observational data and should not be interpreted as current clinical recommendations.
In patients receiving later-line therapy who exhibited elevated tumor burden and complex histories of prior TKI exposure, the effective treatment group demonstrated a significantly higher mean Cmax_2h compared to the failure group (133.8 ng/mL versus 88.7 ng/mL; p<0.01). This finding indicates that insufficient flumatinib exposure continues to contribute to treatment failure, even among high-risk, treatment-experienced populations. Importantly, the mean Cmax_2h in the effective later-line group was higher than in the failure group, and the concentration distributions appeared to shift toward higher values compared to first-line settings. This observation raises the hypothesis that higher exposure targets may be needed in later-line therapy. In addition, higher Cmax_2h were more likely to maintain MMR or DMR after dose reduction. It is important to emphasize that these findings need to be validated in prospective studies with larger cohorts and intensive pharmacokinetic monitoring.
Gastrointestinal AEs are the most common treatment-emergent toxicities associated with flumatinib. Our study observed associations between diarrhea and Cmin>49 ng/mL, and between nausea/vomiting and Cmax_2h>126.5 ng/mL. These findings are consistent with flumatinib’s pharmacokinetic profile, which is characterized by rapid absorption and predominant hepatobiliary elimination, leading to re-exposure in the intestine. Additionally, patients over the age of 56 displayed elevated plasma concentration with substantial interindividual variability. This variability may be attributed to age-related reductions in hepatic blood flow, diminished CYP3A4 activity, and decreased body mass.25
This study has several important limitations that constrain the interpretation and generalizability of our findings. First, the single-center retrospective design, and limited sample size render these findings hypothesis-generating rather than definitive. Patient exclusions due to non-compliant sampling and incomplete data may have introduced selection bias, though the objective nature of these criteria may partially mitigate this concern. Second, sparse sampling and asynchronous assessments may obscure temporal relationships, while the lack of intensive pharmacokinetic profiling limits the characterization of the “Cmax_2h-driven” hypothesis. Third, the proposed thresholds derived from ROC analysis lack independent validation, and the non-significant Cmin findings may reflect insufficient power. Finally, the short follow-up precluded long-term survival analysis, and the inability to evaluate dose-exposure interactions limits the distinction between concentration-driven and dose-dependent effects. Future prospective studies with larger cohorts, standardized TDM protocols, and dose-adjusted analyses are warranted to validate the exposure thresholds and clarify their impact on long-term clinical outcomes.
Conclusion
This study identifies preliminary exposure-efficacy-toxicity relationships for flumatinib in Chinese patients with CML-CP. In this retrospective cohort, a Cmax_2h of 87.75 ng/mL was associated with MMR achievement, though this threshold requires prospective validation before clinical application. These exploratory findings suggest that therapeutic drug monitoring may have potential utility in flumatinib treatment, pending confirmation in larger, multicenter studies with standardized pharmacokinetic sampling protocols.
Data Sharing Statement
The original contributions presented in the study are included in the article and supplementary materials.
Ethics Approval and Consent to Participate
This study has been approved by the institutional ethics committee of Tongji Medical College, Huazhong University of Science and Technology (Wuhan, China) ([2021] 0784). Written informed consent was obtained from all the participants prior to the study.
Funding
This work was supported by 2025 Chinese Medical Association Clinical Pharmacy Special Research Fund (NO. Z-2021-46-2503).
Disclosure
The authors have no relevant affiliations or financial involvement with any organization or entity with a financial interest in or financial conflict with the subject matter or materials discussed in the manuscript.
References
1. Shah NP, Bhatia R, Altman JK, et al. Chronic Myeloid Leukemia, Version 2.2024, NCCN Clinical Practice Guidelines in Oncology. J Natl Compr Canc Netw. 2024;22(1):43–10. doi:10.6004/jnccn.2024.0007
2. Jabbour E, Kantarjian H. Chronic myeloid leukemia: a review. JAMA. 2025;333(18):1618–1629. doi:10.1001/jama.2025.0220
3. Guru Murthy GS. How I Manage Patients with Chronic Myeloid Leukemia (CML): perspectives from Clinical Practice. Blood Lymphat Cancer. 2022;12:1–6. doi:10.2147/BLCTT.S219160
4. Senapati J, Sasaki K, Issa GC, et al. Management of chronic myeloid leukemia in 2023 - common ground and common sense. Blood Cancer J. 2023;13(1):58. doi:10.1038/s41408-023-00823-9
5. Shah NP. NCCN guidelines updates: discontinuing tki therapy in the treatment of chronic myeloid leukemia. J Natl Compr Canc Netw. 2019;17(5.5):611–613. doi:10.6004/jnccn.2019.5013
6. Luo H, Quan H, Xie C, Xu Y, Fu L, Lou L. HH-GV-678, a novel selective inhibitor of Bcr-Abl, outperforms imatinib and effectively overrides imatinib resistance. Leukemia. 2010;24(10):1807–1809.
7. Zhao J, Quan H, Xu Y, Kong X, Jin L, Lou L. Flumatinib, a selective inhibitor of BCR-ABL/PDGFR/KIT, effectively overcomes drug resistance of certain KIT mutants. Cancer Sci. 2014;105(1):117–125. doi:10.1111/cas.12320
8. Lei Y, Zhao X, Qiao C, et al. Real-world comparison of flumatinib and nilotinib as first-line therapy for patients with chronic phase chronic myeloid leukemia: a multicenter retrospective study. Ther Adv Med Oncol. 2025;17:17588359251335905. doi:10.1177/17588359251335905
9. Müller MC. New drug for chronic myeloid leukemia might stimulate the market. Clin Cancer Res. 2021;27(1):3–4. doi:10.1158/1078-0432.CCR-20-3684
10. Zhang L, Meng L, Liu B, et al. Flumatinib versus imatinib for newly diagnosed chronic phase chronic myeloid leukemia: a phase iii, randomized, open-label, multi-center festnd study. Clin Cancer Res. 2021;27(1):70–77. doi:10.1158/1078-0432.CCR-20-1600
11. Fang Z, Zhang H, Guo J, Guo J. Overview of therapeutic drug monitoring and clinical practice. Talanta. 2024;266(Pt 1):124996. doi:10.1016/j.talanta.2023.124996
12. Irving PM, Gecse KB. Optimizing therapies using therapeutic drug monitoring: current strategies and future perspectives. Gastroenterology. 2022;162(5):1512–1524. doi:10.1053/j.gastro.2022.02.014
13. van der Kleij MBA, Guchelaar NAD, Mathijssen NAD, et al. Therapeutic drug monitoring of kinase inhibitors in oncology. Clin Pharmacokinet. 2023;62(10):1333–1364. doi:10.1007/s40262-023-01293-9
14. Clarke WA, Chatelut E, Fotoohi AK, et al. Therapeutic drug monitoring in oncology: international association of therapeutic drug monitoring and clinical toxicology consensus guidelines for imatinib therapy. Eur J Cancer. 2021;157:428–440. doi:10.1016/j.ejca.2021.08.033
15. Mita A, Abumiya M, Miura M, et al. Correlation of plasma concentration and adverse effects of bosutinib: standard dose or dose-escalation regimens of bosutinib treatment for patients with chronic myeloid leukemia. Exp Hematol Oncol. 2018;7:9. doi:10.1186/s40164-018-0101-1
16. Cheng F, Cui Z, Li Q, Wang L, Zhang Y, Li W. Dasatinib dose optimization based on therapeutic drug monitoring in patients with chronic-phase chronic myeloid leukemia. Drug Des Devel Ther. 2025;19:4311–4320. doi:10.2147/DDDT.S521260
17. García-Ferrer M, Wojnicz A, Mejía G, Koller D, Zubiaur P, Abad-Santos F. Utility of therapeutic drug monitoring of imatinib, nilotinib, and dasatinib in chronic myeloid leukemia: a systematic review and meta-analysis. Clin Ther. 2019;41(12):2558–2570.e2557. doi:10.1016/j.clinthera.2019.10.009
18. Jiang B, Qi J, Sun M, et al. Pharmacokinetics of single- and multiple-dose flumatinib in patients with chronic phase chronic myeloid leukemia. Front Oncol. 2023;13:1101738. doi:10.3389/fonc.2023.1101738
19. Yang Y, Liu K, Zhong D, Chen X. Simultaneous determination of flumatinib and its two major metabolites in plasma of chronic myelogenous leukemia patients by liquid chromatography–tandem mass spectrometry. J Chromatogr B Analyt Technol Biomed Life Sci. 2012;895-896:25–30. doi:10.1016/j.jchromb.2012.03.008
20. Apperley JF, Milojkovic D, Cross NCP, et al. European LeukemiaNet recommendations for the management of chronic myeloid leukemia. Leukemia. 2025;39(8):1797–1813. doi:10.1038/s41375-025-02664-w
21. Cheng F, Zeng F, Li Q, et al. Imatinib dose optimization based on therapeutic drug monitoring in Chinese patients with chronic-phase chronic myeloid leukemia. Cancer. 2022;128(22):3951–3958. doi:10.1002/cncr.34478
22. Cortes JE, Egorin MJ, Guilhot F, Molimard M, Mahon FX. Pharmacokinetic/pharmacodynamic correlation and blood-level testing in imatinib therapy for chronic myeloid leukemia. Leukemia. 2009;23(9):1537–1544. doi:10.1038/leu.2009.88
23. Rousselot P, Mollica L, Guilhot J, et al. Dasatinib dose optimisation based on therapeutic drug monitoring reduces pleural effusion rates in chronic myeloid leukaemia patients. Br J Haematol. 2021;194(2):393–402. doi:10.1111/bjh.17654
24. Liu Y, Lin T, Zhao B, Li Y, Zheng P. Correlation analysis between plasma concentration of nilotinib and clinical efficacy and safety in patients with chronic myeloid leukemia: a single-center retrospective cohort study. Front Pharmacol. 2025;16:1676800. doi:10.3389/fphar.2025.1676800
25. Stempel JM, Shallis RM, Wong R, Podoltsev NA. Challenges in management of older patients with chronic myeloid leukemia. Leuk Lymphoma. 2024;65(9):1219–1232. doi:10.1080/10428194.2024.2342559
 © 2026 The Author(s). This work is published and licensed by Dove Medical Press Limited. The
full terms of this license are available at https://www.dovepress.com/terms
and incorporate the Creative Commons Attribution
- Non Commercial (unported, 4.0) License.
By accessing the work you hereby accept the Terms. Non-commercial uses of the work are permitted
without any further permission from Dove Medical Press Limited, provided the work is properly
attributed. For permission for commercial use of this work, please see paragraphs 4.2 and 5 of our Terms.
© 2026 The Author(s). This work is published and licensed by Dove Medical Press Limited. The
full terms of this license are available at https://www.dovepress.com/terms
and incorporate the Creative Commons Attribution
- Non Commercial (unported, 4.0) License.
By accessing the work you hereby accept the Terms. Non-commercial uses of the work are permitted
without any further permission from Dove Medical Press Limited, provided the work is properly
attributed. For permission for commercial use of this work, please see paragraphs 4.2 and 5 of our Terms.
Recommended articles
Dasatinib Dose Optimization Based on Therapeutic Drug Monitoring in Patients with Chronic-Phase Chronic Myeloid Leukemia
Cheng F, Cui Z, Li Q, Wang L, Zhang Y, Li W
Drug Design, Development and Therapy 2025, 19:4311-4320
Published Date: 23 May 2025
Dose Optimization of Tyrosine Kinase Inhibitors for Chronic Myeloid Leukemia
Chen J, Zhu Y, Zhao Y, Guo N, Yao Y, Luo X, Huang L
Clinical Pharmacology: Advances and Applications 2025, 17:211-225
Published Date: 30 July 2025
Safety and Efficacy of Flumatinib in Patients with Chronic Phase Chronic Myeloid Leukemia: A Real-Life Cohort Observational Study
Cheng F, Cui Z, Li Q, Wang L, Li W
Blood and Lymphatic Cancer: Targets and Therapy 2026, 16:573070
Published Date: 22 January 2026