")
Back to Journals » Nature and Science of Sleep » Volume 14
Obstructive Sleep Apnea Detection Based on Sleep Sounds via Deep Learning
Authors Wang B, Tang X, Ai H, Li Y, Xu W, Wang X, Han D
Received 4 May 2022
Accepted for publication 12 October 2022
Published 8 November 2022 Volume 2022:14 Pages 2033—2045
DOI https://doi.org/10.2147/NSS.S373367
Checked for plagiarism Yes
Review by Single anonymous peer review
Peer reviewer comments 3
Editor who approved publication: Prof. Dr. Ahmed BaHammam
Bochun Wang1,2 *, Xianwen Tang3 *, Hao Ai,3 Yanru Li,1,4,5 Wen Xu,1,4,5 Xingjun Wang,3 Demin Han1,4,5
1Department of Otolaryngology Head and Neck Surgery, Beijing Tongren Hospital, Capital Medical University, Beijing, 100730, People’s Republic of China; 2Department of Otolaryngology Head and Neck Surgery, Beijing Friendship Hospital, Capital Medical University, Beijing, 100050, People’s Republic of China; 3Department of Electronic Engineering, Tsinghua Shenzhen International Graduate School, Tsinghua University, Shenzhen, People’s Republic of China; 4Obstructive Sleep Apnea-Hypopnea Syndrome Clinical Diagnosis and Therapy and Research Centre, Capital Medical University, Beijing, 100730, People’s Republic of China; 5Key Laboratory of Otolaryngology Head and Neck Surgery, Ministry of Education, Capital Medical University, Beijing, 100730, People’s Republic of China
*These authors contributed equally to this work
Correspondence: Demin Han; Xingjun Wang, Email [email protected]; [email protected]
Purpose: This study aimed to propose a novel deep-learning method for automatic sleep apneic event detection and thus to estimate the apnea hypopnea index (AHI) and identify obstructive sleep apnea (OSA) in an event-by-event manner solely based on sleep sounds obtained by a noncontact audio recorder.
Methods: We conducted a cross-sectional study of participants with habitual snoring or heavy breathing sounds during sleep to train and test a deep convolutional neural network named OSAnet for the detection of OSA based on sleep sounds. Polysomnography (PSG) was conducted, and sleep sounds were recorded simultaneously in a regular room without noise attenuation. The study was conducted in two phases. In phase one, eligible participants were enrolled and randomly allocated into training and validation groups for deep learning algorithm development. In phase two, eligible patients were enrolled in a test group for algorithm assessment. Sensitivity, specificity, accuracy, unweighted Cohen kappa coefficient (κ) and the area under the curve (AUC) were calculated using PSG as the reference standard.
Results: A total of 135 participants were randomly divided into a training group (n, 116) and a validation group (n, 19). An independent test group of 59 participants was subsequently enrolled. Our algorithm achieved a precision of 0.81 and sensitivity of 0.78 in the test group for overall sleep event detection. The algorithm exhibited robust diagnostic performance to identify severe cases with a sensitivity of 95.6% and specificity of 91.6%.
Conclusion: Our results showed that a deep learning algorithm based on sleep sounds recorded by a noncontact voice recorder served as a feasible tool for apneic event detection and OSA identification. This technique may hold promise for OSA assessment in the community in a relatively comfortable and low-cost manner. Further studies to develop a tool based on a home-based setting are warranted.
Keywords: obstructive sleep apnea, sleep sounds, deep learning
Introduction
As one of the most prevalent chronic sleep disorders, obstructive sleep apnea (OSA), resulting from repetitive episodes of partial or complete airflow restriction of the upper airway during sleep, causes repeated breathing pauses and leads to a spectrum of medical conditions such as metabolic syndromes,1 hypertension,2 neurovascular diseases3 and cardiovascular diseases.4 Research estimated that the number of patients with OSA reaches nearly 1 billion in adults aged 30–69 years, and 425 million of them suffer from moderate to severe OSA.5
The current gold standard assessment for OSA is full-night polysomnography (PSG). The apnea hypopnea index (AHI) acquired from PSG, is used clinically to assess the severity of sleep apnea. Nevertheless, due to high costs and insufficient facilities, many cases remain undiagnosed,6 and providing subjects at risk of OSA with proper examination at an opportune moment remains a challenge.7 There is a need for the substitution of PSG with portable sleep apnea monitoring devices. To address this issue, many works have proposed using home sleep apnea tests (HSATs) with low-cost and readily available sensors to record a reduced number of signal channels and apply automated methods to assist sleep technicians.8,9 These tests include several PSG related signals such as nasal airflow, oxygen saturation, actigraphy, heart rate variability and thoracoabdominal effort.10 However, most signals are recorded from contact sensors, which may still cause inconvenience and attachment error in community-based populations.
Snoring originates from the vibration of soft tissues in the upper airway (eg, the tongue, soft palate and pharyngeal wall), which may collapse during respiratory events.11 This characteristic suggests that sleep sounds, including snoring and respiratory sounds, may contain essential information on the upper airway.12,13 Moreover, unlike other substitutes, sleep sound recording can be conducted conveniently in various types of devices, allowing the physiological demonstration of OSA occurrence without disturbing the process of sleep. Earlier studies have investigated several acoustic features to capture the characteristics of respiratory events in overnight sleep sounds and have adopted statistical models to predict the presence of OSA. Ben-Israel et al differentiated subjects with and without OSA for AHI thresholds of 10 and 20 events/h based on five acoustic features extracted from snoring signals.14 Kim et al15 explored an acoustic biomarker consisting of several audio features to predict the severity of OSA. These methods extracted a set of human-engineered acoustic features and manifested different diagnostic capacities. Nevertheless, the best combination of acoustic features remains to be exploited. In addition, some studies validated the performance by comparing the overall estimated AHI with the AHI from PSG, neglecting the detection of every individual respiratory events.
As one of the fundamental computer vision problems, object detection has provided valuable information for the semantic understanding of images and videos and has undergone an expansion of its application space in biomedical image processing.16 The capability of locating targets is of great value not only in identifying lesions in CT or magnetic resonance imaging (MRI), but also in one-dimensional biological signal event detection. For example, if the onset and end of the respiratory event can be located in the sleep sound signal, estimating the AHI of patients will be more accurate and convenient.
In this work, we proposed a novel deep-learning method entitled OSAnet for automatic apneic event detection and thus identified OSA in an event-by-event manner solely based on ambient sleep sounds obtained by a noncontact audio recorder. The algorithm, which was derived from object detection, a popular deep-learning technique used in computer vision, proved to be a robust predictive tool for portable apneic event detection.
Methods
Study Design
We conducted a cross-sectional study. Data were collected at the sleep center of Beijing Tongren Hospital. This study was approved by the institutional review board of Beijing Tongren Hospital (TRECKY2017–032).
Study Setting
The study was conducted in two phases. In phase one, eligible participants were enrolled and partitioned randomly into training and validation groups for algorithm development. In phase two, eligible patients were consecutively enrolled in a test group.
Participants
We consecutively recruited 194 participants >18 years of age. Participants were referred for PSG due to a medical history suggestive of habitual snoring or heavy breathing sound during sleep with or without the following symptoms: restless sleep, pauses in breathing during sleep, morning headaches, excessive daytime sleepiness, cognitive impairment, or depression. Full-night polysomnography was conducted at the sleep center of Beijing Tongren Hospital. The PSG study was conducted in a regular room without any noise attenuation equipment to simulate a real-world situation in which participants recorded their own sleep sounds at home. The mean background noise level in the room was LAeq=35.1 dB(A), measured by a high accuracy class 2 digital sound pressure level meter (DT-8851, Ruby Electronics, Saratoga, CA), similar to those reported in the home environment.17 The Epworth Sleepiness Scale (ESS) was used to evaluate daytime sleepiness.18
Data Collection
Polysomnography (Alice 6, Philips Respironics, USA) consisted of electroencephalography, two-channel electrooculography, bilateral anterior tibial and chin electromyography, electrocardiography, nasal pressure transducer, oronasal thermistor, thoracic and abdominal respiratory inductive plethysmography, and pulse oximetry. The American Academy of Sleep Medicine (AASM) 2012 scoring criteria were used for sleep staging and respiratory analyses19 and each recording was scored by two technicians. The apnea hypopnea index (AHI) was calculated as the number of apneas and hypopneas per hour of sleep.
The overnight ambient sleep sounds were recorded simultaneously with PSG in a time-synchronization manner using a noncontact digital voice recorder (PCM- D10, Sony, Japan) with a sampling frequency of 44,100 Hz and 16-bit quantizing precision. The voice recorder was placed one meter away from the head of the participants.20 The audio recordings were annotated with apnea and hypopnea labels according to the simultaneous PSG data. Each participant was asked to write down the time of sleep onset and sleep ending as estimated sleep time. The audio-derived AHI (AHI-audio) was calculated as the apneas and hypopneas divided by estimated sleep time.
Development of the Model
In this study, the prediction model was based on the recorded ambient sleep sounds, which might include moaning, talking or background noises. The deep convolutional neural networks named OSAnet were constructed to train the algorithm for apneic event detection. A flow chart of our method is presented in Figure 1. Once the PSG and audio data of each subject were collected, the corresponding audio data was preprocessed and transformed into Mel spectrogram as the input. Then, the convolutional neural network, OSAnet was constructed (Supplementary Methods, Table S1 and Figure S1), in which numerous prior bounding boxes were generated for ground truth matching at the training stage (Supplementary Methods, Figure S2). The model was initially fit on the training group, and then the validation group provided an unbiased evaluation of the model fit on the training group while tuning the model’s hyperparameters. Finally, when performing inference, the Detecting while Slicing method was utilized before the model was assessed in a separate test group (Supplementary Methods, Algorithm S1 and S2). The prediction error was calculated by comparing audio-detected events with the PSG-detected events scored by the sleep technicians, and the parameters were adjusted accordingly to decrease the error. The model was trained using stochastic gradient descent (SGD) for 100 epochs with a base learning rate of 10−3, batch size 32, momentum 0.9, and weight decay 0.0005. The learning rate is multiplied by 0.1 after the 20th and 25th epochs.
 |
Figure 1 Study flow chart. Flow chart of the proposed method. Abbreviations: PSG, polysomnography; LEOG, left electrooculography; REOG, right electrooculography; EMG, chin electromyography; OT, oronasal thermistor; NPT, nasal pressure transducer; THO, ABO, thoracic and abdominal respiratory inductive plethysmography. |
Evaluating the Models
As OSAnet identified apneic events with the concept of the object detection problem, true negative items did not exist. The overall performance of event detection was evaluated by sensitivity, precision and F1 score as

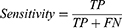

where true positive (TP) represents the number of events detected correctly by the algorithm (intersection over union between PSG-detected and audio-detected events greater than 0.5), false positive (FP) represents the number of segments without apneic events detected as apneic events and false negative (FN) represents the number of apneic events overlooked. Since OSAnet detected apneic events in an event-by-event manner, Bland‒Altman limits of agreement were also employed to assess the differences between the durations of audio-detected events and PSG-detected events. We assessed the correlation between the AHI-audio and the simultaneous AHI-PSG with Pearson correlation coefficient and evaluated the average error between them with Bland‒Altman limits of agreement.21 The prediction performance of supine and non-supine events was assessed as well.
To assess the ability of our algorithm to distinguish between the presence and absence of OSA, we calculated sensitivity, specificity, positive predictive value (PPV), negative predictive value (NPV), accuracy, unweighted Cohen kappa coefficient (κ)22 and the area under the curve (AUC) for receiver operating characteristics curves (ROC) according to various AHI diagnostic cutoffs of: ≥5, 10 and 15 events/h, which are the cutoffs that most jurisdictions use. For severe OSA detection, a higher cutoff of ≥30 events/h was also evaluated.
Statistical Analysis
Data are presented as the mean ± standard deviation or median (interquartile range) where appropriate. The Mann–Whitney U-test was used to compare anthropometric, demographic and sleep studies between the training group against the validation group and between the training group against the test group. Exact 95% confidence intervals(CIs) were calculated for AUC. All comparisons were two-sided, with statistical significance defined as P < 0.05. Analyses were calculated using IBM SPSS Statistics version 26 (IBM Corp.).
Results
Study Population
Between October 2018 and January 2020, 162 participants who met the criteria for inclusion were enrolled. Twenty-seven participants were excluded because they did not complete PSG, or the total sleep time was less than 5 hours. Among the remaining 135 participants, we randomly divided 116 into the training group and 19 into the validation group. The characteristics were similar in the two groups (Table 1). Between February 2020 and December 2020, 59 participants with qualified PSG recordings were enrolled for inclusion in the test group. No significant differences between the training and test groups were noted in anthropometry, demographics and sleep architecture except for N3, which covered a higher proportion in the test group (Table 1).
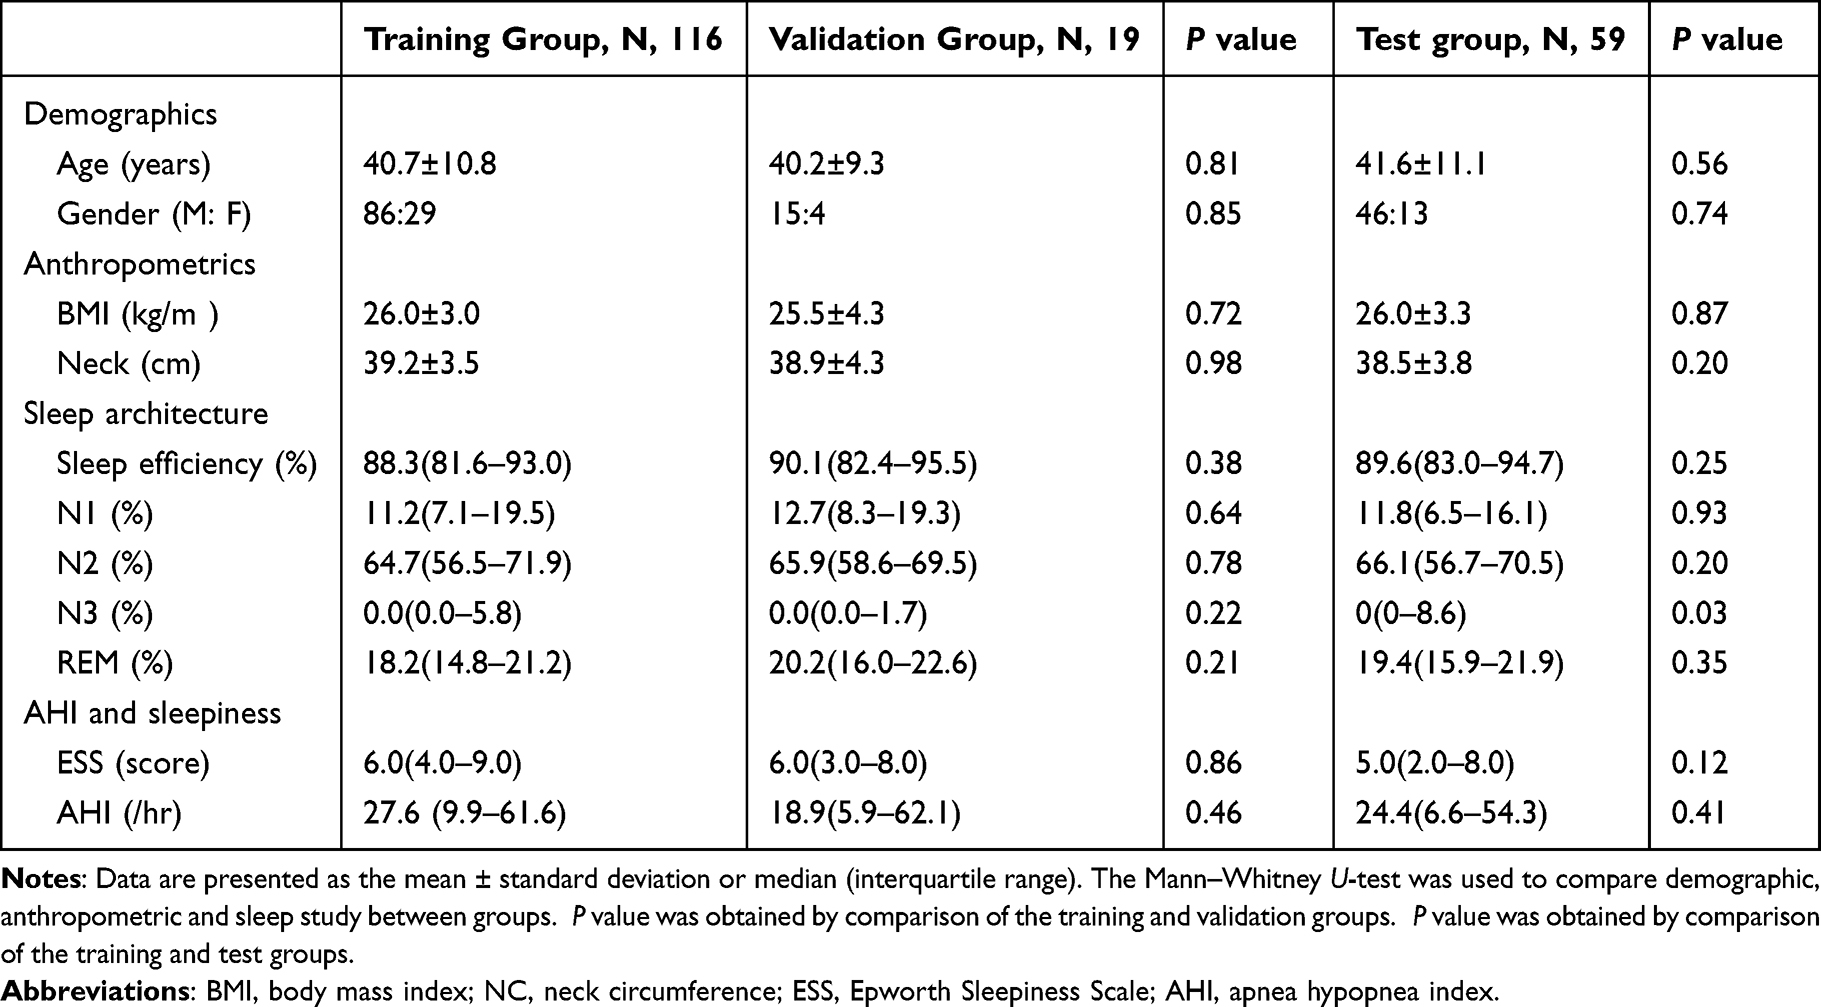 |
Table 1 Participant Characteristics |
Model Performance
The performance of the algorithm is presented in Table 2. The model achieved a precision of 0.81 in the test group for sleep event detection when taking all events into consideration. These results corresponded to a sensitivity of 0.78. The model gained a precision of 0.83 and a sensitivity of 0.79 for supine event detection. In addition, OSAnet was able to calculate the durations of each event. Using the Bland‒Altman limits of agreement depicted in Figure 2, the differences between durations of audio-detected and PSG-detected events were 0.52±18.38 seconds, which indicated that the algorithm might overestimate the durations of apneic events. A linear regression analysis of the differences produced a positive slope of 0.06 (P<0.0001). However, OSAnet was not able to distinguish between apneic and hypopneic events (data not shown), and both of them were regarded as apneic events in the study.
 |
Table 2 Performance of the Model for Detecting Sleep Apneic Events |
 |
Figure 2 Bland‒Altman plots showing observations of the differences between durations of audio-detected and PSG-detected events. Abbreviation: SD, standard deviation. |
Agreement Between AHI-Audio and AHI-PSG
A strong correlation was identified between AHI-audio and AHI-PSG, with a rho of 0.99 in the validation group and 0.98 in the test group (Figure 3). The Bland‒Altman plots were calculated to assess agreement between AHI-PSG and AHI-audio (Figure 4). No consistent bias was found in the Bland‒Altman plot, and the bias and limits of agreement were 1.15±12.00 and −0.24±12.81 events/h in the validation and test groups, respectively. The scatter plots fit the lines well across the entire range of OSA severities for both groups. The comparison between AHI-audio and AHI-PSG in the test group is shown in Figure 5, which shows that most cases have been correctly classified into the corresponding severity group, and the detection performance proves better in subjects with more severe OSA. Moreover, the bias and limits of agreement were −3.03±12.62 and 0.47±15.88 events/h for supine AHI and non-supine AHI, respectively (Figure 6).
 |
Figure 3 Correlation between AHI-PSG and AHI-audio. Scatter plots of AHI-PSG versus AHI-audio in the validation group (A) and test group (B). Magenta lines are fit with the two variables (A) rho, 0.99, P value<0.01; (B), rho, 0.98, P value<0.01). |
 |
Figure 4 Bland‒Altman plots showing observations of the difference between AHI-audio and AHI-PSG falling within limits of agreement in the validation group (A) and the test group (B). Abbreviations: SD, standard deviation. |
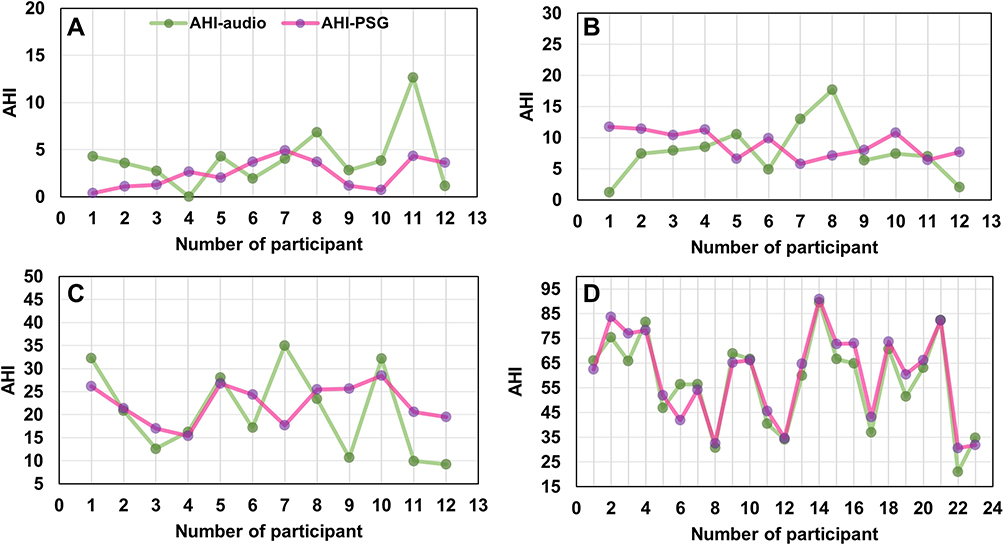 |
Figure 5 Comparison between AHI-audio and AHI-PSG according to OSA severity in the test group. (A) AHI-audio versus AHI-PSG in non-OSA subjects; (B) AHI-audio versus AHI-PSG in mild OSA subjects; (C) AHI-audio versus AHI-PSG in moderate OSA subjects; (D) AHI-audio versus AHI-PSG in severe OSA subjects. |
 |
Figure 6 Bland‒Altman plots showing observations of the differences in supine AHI (A) and non-supine AHI (B). Abbreviation: SD, standard deviation. |
Diagnostic Performance
OSA is diagnosed if the AHI exceeds a certain threshold, ranging between 5 and 15, depending on the criteria of certain medical organizations, jurisdictions, or the individual practitioner. The diagnostic performance was evaluated in the test group at the aforementioned cutoffs and a higher threshold (viz. 30 events/h) for severe case differentiation (Table 3). The algorithm exhibited robust diagnostic performance to identify severe cases with a sensitivity of 95.6% and specificity of 91.6%. These results corresponded to a PPV of 88.0%, NPV of 97.0% and accuracy of 93.2%. The AUCs for ROCs of AHI-PSG ≥ 5, 10, 15, and 30 were 0.941 (95% CI, 0.877–1.000), 0.935 (95% CI, 0.873–0.997), 0.981 (95% CI, 0.955–1.00), and 0.987 (95% CI, 0.969–1.00), respectively (Figure 7). According to our criteria, a diagnosis of OSA is made if the AHI ≥ 5. Investigating the ROC of AHI-PSG ≥ 5, we obtained the optimum performance (accuracy) by setting the AHI-audio diagnostic threshold at 7 events/h, which yielded a sensitivity of 89.3% and specificity of 91.6%. To optimize sensitivity for screening, the cutoff point of AHI-audio, 4.5 was selected with a sensitivity of 95.7% and specificity of 83.3%.
 |
Table 3 Diagnostic Performance at Four Cutoffs |
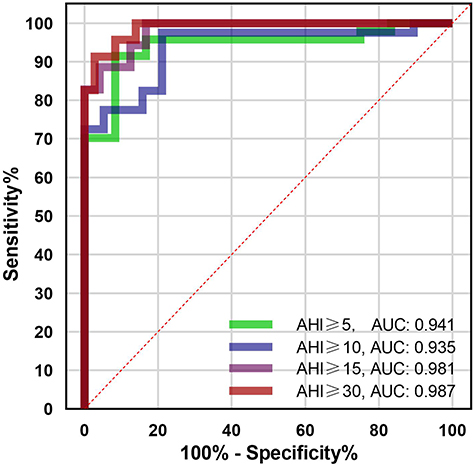 |
Figure 7 Receiver operating characteristic (ROC) curves depicting the diagnostic power of AHI-audio at four cutoffs: AHI-PSG ≥ 5, 10, 15 and 30. |
Discussion
This study explored a novel approach to OSA detection solely based on sleep sounds by a noncontact voice recorder. The proposed algorithm originated from the object detection problem, a well-known method in the field of computer vision. The correlation between AHI-audio and AHI-PSG was strong, suggesting that the deep-learning proposal could address the needs of OSA screening and diagnosis in an event-by-event manner.
Prior studies have attempted to utilize snoring sound to diagnose OSA, but a standard framework to compare different techniques is lacking. Different studies selected various acoustic parameters for their proposal, such as pitch, formant frequencies, sound intensity, power spectrum, and Mel-frequency cepstral coefficients.14,15,23,24 These human-engineered acoustic features showed dissimilar diagnostic capacity and the best combination of acoustic features was not fully exploited. Instead of extracting acoustic features, we permitted the neural networks to capture the characteristics of apneic events.
Deep learning has enabled many practical applications of machine learning in recent years, promoting reliable and valid analyses of image and speech data. The deep learning techniques utilized in OSA diagnosis included recurrent neural networks for ECG classification25 and convolutional neural networks for EEG identification.26 Due to its capacity to learn feature representations from raw data, convolutional neural networks were able to capture the characteristics of a large number of apneic events in the corresponding audio samples we created. Some studies enrolled a relatively small number of participants without including a separate test group for the validation study.15,27–29 Since deep learning is often driven by big data, one of the merits of our study lies in the ability to estimate AHI across a wide range of OSA severities and the validation of the method in an independent test group using blind design, thus indicating reliability and validity of the algorithm. A meta-analysis study carried out by Jin illustrated that the AUC of the acoustic analysis of snoring in the diagnosis of OSA was 0.93.30 However, a universal rule to compare different techniques is lacking. For example, one study enrolled validated the performance by comparing the overall estimated AHI with AHI from PSG, neglecting the detection of individual respiratory event.14 Other research has adopted custom-built audio recording devices which might cause inconvenience and attachment error.31
Moreover, the results indicated that OSAnet was comparable to several other HSAT devices using automated scoring. Zhang et al demonstrated that WatchPAT achieved an agreement of 2.5(−24.0 to 28.9) compared with PSG.8 They achieved a sensitivity of 0.86 and specificity of 0.88 at the AHI-PSG cutoff of 30 events/h. Using input signals from peripheral blood oxygen saturation, thermistor airflow, nasal pressure airflow, and thorax respiratory effort, Nikkonen showed that AHI calculated from the automated scoring was close to the manually determined AHI with a mean absolute error of 3.0 events/hour.9 In our study, the Bland‒Altman plot of OSAnet showed that the bias and limits of agreement were −0.24±12.81 in the test group, which implicated sleep sounds as promising in OSA screening.
We noticed that the algorithm illustrated stronger diagnostic power in participants with severe OSA (Figure 3). When setting the AHI threshold at 30 events/h, we obtained a sensitivity of 95.6%, specificity of 91.6%, and AUC of 0.987 (Figure 4), which outperformed any other proposal to date. The results suggest that the probability of severe OSA is high in individuals with an AHI-audio ≥ 30, and we highly recommend that they be referred for timely OSA assessment and proper treatment. We can speculate that the improvement in more severe cases may be associated with differences in the upper airway in terms of structure and function. Lee et al showed that the soft palate alone is the most common obstructed structure in mild OSA, and the combination of soft palate and tongue base obstruction is more frequent in severe OSA.32 This difference warrants further study with anatomical stratification concerning different snoring sound excitation locations.
Some studies divided OSA detection into two steps: snore detection and OSA classification.14,23,31,33 The former part was applied to isolate snore events and served as an important component of OSA detection. Nonetheless, a definition to permit an objectively measurable distinction between snoring and loud breathing has not been established.34,35 As snore detection was inevitably trained using snore events manually labeled by the investigating authors themselves based on subjective judgement, the detection might have been biased by the human observer’s perception. Furthermore, the procedure was influenced by the number and diversity of snore events as well as the type of machine learning algorithm used. On the contrary, a one-step deep learning algorithm with straightforward process of sleep apnea detection was deployed in our study, where manually labeled apneic events according to AASM guidelines were more objective and robust compared with human-classified snore labels.
Body posture during sleep have effects on the acoustic characteristics of snores.36 The position of recording devices relative to the mouth of the participant may change during trunk rotation, leading to alterations in any acoustic features with reference to snoring intensity, sound pressure level, and magnitude spectrum etc. To eliminate the interference of body posture, earlier studies adopted microphones attached to the body (neck or face) or matched pairs of microphones for data collection. Sowho et al conducted a study in a closed sound-attenuated laboratory with a digital sound pressure level meter and sound level calibrator.37 They used regression models to determine the relationship between objective measure of snoring and OSA. However, these methods required the careful setup and calibration of the recording situation. Our approach has the advantage in that it proves plausible regardless of body posture. Unlike the common practice described in Xu et al29 and Alshaer et al28 a non-contact voice recorder placed beside the subjects at a distance of 1 m was used in our study, which approximates the real-world circumstance when subjects are able to conduct the sound recording at home by themselves without interfering with the sleep process. Such a recording setting is more convenient and less sensitive to unwanted background sound such as duvets, beds, and body movements (compared with body attached devices). This feature tends to yield more robust results when used in real life applications, where microphone positions and room conditions might not be precisely controllable. Furthermore, the Bland‒Altman plots illustrated that the differences in supine AHI and non-supine AHI predicted by OSAnet fell within limits of agreement, indicating that our model was robust to identify patients with OSA, irrespective of whether they possessed posture-dependent apneic events or not.
Limitations
A few limitations should be noted when interpreting our results. First, our approach was dependent on sleep sounds. Although most OSA patients do snore or produce heavy breathing sound during sleep,38 a very small percentage of patients with OSA produce breathing sound weaker than the background noise in the home environment,27 making OSAnet unsuitable for them, since the latter might be a confounding factor. Second, night-to-night variability in sleep sounds may introduce inaccuracies in our model in a single night. Third, the study was conducted at one center. The algorithm requires further external validation based on community populations in a home-based setting to better meet the needs of real-world applications.
Conclusions
In summary, sleep sounds recorded by a noncontact voice recorder served as a feasible tool for apneic event detection and OSA screening. With the assistance of the novel deep-learning technique entitled OSAnet, sleep sounds supported a potential step to pinpoint the location and procure the duration of each individual event. This effort could be useful for home-based assessments and OSA screening in the community, which may help to guide further diagnostic testing or medical visits.
Data Sharing Statement
All data and code that support the findings of this study are available from the corresponding author upon reasonable request.
Ethics Approval
All procedures performed in studies involving human participants were in accordance with the ethical standards of the institutional and/or national research committee and with the 1964 Helsinki declaration and its later amendments or comparable ethical standards.
Consent to Participate
All participants provided written informed consent.
Acknowledgments
The authors thank the technicians at the Sleep Medical Center in Beijing Tongren Hospital and the participants involved in the study.
Funding
This research was supported by Shenzhen Municipal Natural Science Foundation and Shenzhen Science and Technology Innovation Committee (KCXFZ202002011010487), Shenzhen Municipal Natural Science Foundation (WDZC20200818121348001), National Natural Science Foundation of China (81970866).
Disclosure
The authors declare that they have no conflicts of interest in this work.
References
1. Koo DL, Kim H-R, Nam H. Moderate to severe obstructive sleep apnea during REM sleep as a predictor of metabolic syndrome in a Korean population. Sleep Breath. 2020;24:1–8.
2. Nieto FJ, Young TB, Lind BK, et al. Association of sleep-disordered breathing, sleep apnea, and hypertension in a large community-based study. SLEEP Heart Health Study Jama. 2000;283:1829.
3. Arzt M, Young T, Finn L, Skatrud JB, Bradley TD. Association of sleep-disordered breathing and the occurrence of stroke. Am J Respir Crit Care Med. 2005;172:1447–1451. doi:10.1164/rccm.200505-702OC
4. Tarasiuk A, Greenberg-Dotan S, Simon T, Tal A, Oksenberg A, Reuveni H. Low socioeconomic status is a risk factor for cardiovascular disease among adult obstructive sleep apnea syndrome patients requiring treatment. Chest. 2006;130:766–773. doi:10.1378/chest.130.3.766
5. Benjafield AV, Ayas NT, Eastwood PR, et al. Estimation of the global prevalence and burden of obstructive sleep apnoea: a literature-based analysis. Lancet Respir Med. 2019;7:687–698. doi:10.1016/S2213-2600(19)30198-5
6. Motamedi KK, McClary AC, Amedee RG. Obstructive sleep apnea: a growing problem. Ochsner J. 2009;9:149–153.
7. Simpson L, Hillman DR, Cooper MN, et al. High prevalence of undiagnosed obstructive sleep apnoea in the general population and methods for screening for representative controls. Sleep Breath Schlaf Atmung. 2013;17:967–973. doi:10.1007/s11325-012-0785-0
8. Zhang ZG, Sowho M, Otvos T, et al. A comparison of automated and manual sleep staging and respiratory event recognition in a portable sleep diagnostic device with in-lab sleep study. Clin Sleep Med. 2020;16:563–573. doi:10.5664/jcsm.8278
9. Nikkonen S, Korkalainen H, Leino A, et al. Automatic respiratory event scoring in obstructive sleep apnea using a long short-term memory neural network. IEEE J Biomed Health Inform. 2021;25:2917–2927. doi:10.1109/JBHI.2021.3064694
10. Roebuck A, Monasterio V, Gederi E, et al. A review of signals used in sleep analysis. Physiol Meas. 2014;35:R1–57. doi:10.1088/0967-3334/35/1/R1
11. Dalmasso F, Prota R. Snoring: analysis, measurement, clinical implications and applications. Eur Respir J. 1996;9:146–159. doi:10.1183/09031936.96.09010146
12. Qian K, Janott C, Pandit V, et al. Classification of the excitation location of snore sounds in the upper airway by acoustic multifeature analysis. IEEE Trans Biomed Eng. 2017;64:1731–1741. doi:10.1109/TBME.2016.2619675
13. Sebastian A, Cistulli PA, Cohen G, de Chazal P. Association of snoring characteristics with predominant site of collapse of upper airway in obstructive sleep apnea patients. Sleep. 2021;44. doi:10.1093/sleep/zsab176
14. Ben-Israel N, Tarasiuk A, Zigel Y. Obstructive apnea hypopnea index estimation by analysis of nocturnal snoring signals in adults. Sleep. 2012;35:1299–305c. doi:10.5665/sleep.2092
15. Kim T, Kim JW, Lee K. Detection of sleep disordered breathing severity using acoustic biomarker and machine learning techniques. Biomed Eng Online. 2018;17:16. doi:10.1186/s12938-018-0448-x
16. Zhao Z-Q, Zheng P, Xu ST, Wu X. Object detection with deep learning: a review. IEEE Trans Neural Netw Learn Syst. 2019;30:3212–3232. doi:10.1109/TNNLS.2018.2876865
17. Doherty R, Salskov E, Corriveau PJ, Sorenson P, Gabel D, Beltman WM. Background noise levels in PC home environments. J Acoust Soc Am. 2005;118:1867. doi:10.1121/1.4779085
18. Johns MW. A new method for measuring daytime sleepiness: the Epworth sleepiness scale. Sleep. 1991;14:540. doi:10.1093/sleep/14.6.540
19. Berry RB, Brooks R, Gamaldo CE, et al. The AASM Manual for the Scoring of Sleep and Associated Events: Rules, Terminology and Technical Specifications: Version 2.3. American Academy of Sleep Medicine; 2016.
20. Chuang HH, Liu CH, Wang CY, et al. Snoring sound characteristics are associated with common carotid artery profiles in patients with obstructive sleep apnea. Nat Sci Sleep. 2021;13:1243–1255. doi:10.2147/NSS.S311125
21. Bland JM, Altman DG. Statistical methods for assessing agreement between two methods of clinical measurement. Lancet. 1986;1:307–310. doi:10.1016/S0140-6736(86)90837-8
22. Landis JR, Koch GG. The measurement of observer agreement for categorical data. Biometrics. 1977;33:159–174. doi:10.2307/2529310
23. Fiz JA, Jane R, Sola-Soler J, Abad J, Garcia MA, Morera J. Continuous analysis and monitoring of snores and their relationship to the apnea-hypopnea index. Laryngoscope. 2010;120:854–862. doi:10.1002/lary.20815
24. Ng AK, Koh TS, Abeyratne UR, Puvanendran K. Investigation of obstructive sleep apnea using nonlinear mode interactions in nonstationary snore signals. Ann Biomed Eng. 2009;37:1796. doi:10.1007/s10439-009-9744-8
25. Cheng M, Sori WJ, Jiang F, Khan A, Liu S. Recurrent Neural Network Based Classification of ECG Signal Features for Obstruction of Sleep Apnea Detection. In: 2017 IEEE International Conference on Computational Science and Engineering (CSE) and IEEE International Conference on Embedded and Ubiquitous Computing (EUC). IEEE; 2017:199–202.
26. Zhang X, Xu M, Li Y, et al. Automated multi-model deep neural network for sleep stage scoring with unfiltered clinical data. Sleep Breath Schlaf Atmung. 2020;24:581–590. doi:10.1007/s11325-019-02008-w
27. Alshaer H, Fernie GR, Maki E, Bradley TD. Validation of an automated algorithm for detecting apneas and hypopneas by acoustic analysis of breath sounds. Sleep Med. 2013;14:562–571. doi:10.1016/j.sleep.2012.12.015
28. Alshaer H, Fernie GR, Tseng WH, Bradley TD. Comparison of in-laboratory and home diagnosis of sleep apnea using a cordless portable acoustic device. Sleep Med. 2016;22:91–96. doi:10.1016/j.sleep.2015.11.003
29. Xu H, Song W, Yi H, et al. Nocturnal snoring sound analysis in the diagnosis of obstructive sleep apnea in the Chinese Han population. Sleep Breath Schlaf Atmung. 2015;19:599–605. doi:10.1007/s11325-014-1055-0
30. Jin H, Lee LA, Song L, et al. Acoustic analysis of snoring in the diagnosis of obstructive sleep apnea syndrome: a call for more rigorous studies. J Clin Sleep Med. 2015;11:765–771. doi:10.5664/jcsm.4856
31. Nakano H, Hirayama K, Sadamitsu Y, et al. Monitoring sound to quantify snoring and sleep apnea severity using a smartphone: proof of concept. J Clin Sleep Med. 2014;10:73–78. doi:10.5664/jcsm.3364
32. Lee CH, Hong SL, Rhee CS, Kim SW, Kim JW. Analysis of upper airway obstruction by sleep videofluoroscopy in obstructive sleep apnea: a large population-based study. Laryngoscope. 2012;122:237–241. doi:10.1002/lary.22344
33. de Silva S, Abeyratne UR, Hukins C. A method to screen obstructive sleep apnea using multi-variable non-intrusive measurements. Physiol Meas. 2011;32:445–465. doi:10.1088/0967-3334/32/4/006
34. Janott C, Rohrmeier C, Schmitt M, Hemmert W, Schuller B. Snoring - An Acoustic Definition. In: 2019 41st Annual International Conference of the IEEE Engineering in Medicine and Biology Society (EMBC). IEEE; 2019:3653–3657.
35. Hoffstein V, Mateika S, Anderson D. Snoring: is it in the ear of the beholder? Sleep. 1994;17:522–526. doi:10.1093/sleep/17.6.522
36. Oksenberg A, Silverberg DS. The effect of body posture on sleep-related breathing disorders: facts and therapeutic implications. Sleep Med Rev. 1998;2:139–162. doi:10.1016/S1087-0792(98)90018-1
37. Sowho M, Sgambati F, Guzman M, Schneider H, Schwartz A. Snoring: a source of noise pollution and sleep apnea predictor. Sleep. 2019;43(6):zsz305. doi:10.1093/sleep/zsz305
38. Kapur VK, Auckley DH, Chowdhuri S, et al. Clinical practice guideline for diagnostic testing for adult obstructive sleep apnea: an American Academy of Sleep Medicine clinical practice guideline. J Clin Sleep Med. 2017;13:479–504. doi:10.5664/jcsm.6506
 © 2022 The Author(s). This work is published and licensed by Dove Medical Press Limited. The full terms of this license are available at https://www.dovepress.com/terms.php and incorporate the Creative Commons Attribution - Non Commercial (unported, v3.0) License.
By accessing the work you hereby accept the Terms. Non-commercial uses of the work are permitted without any further permission from Dove Medical Press Limited, provided the work is properly attributed. For permission for commercial use of this work, please see paragraphs 4.2 and 5 of our Terms.
© 2022 The Author(s). This work is published and licensed by Dove Medical Press Limited. The full terms of this license are available at https://www.dovepress.com/terms.php and incorporate the Creative Commons Attribution - Non Commercial (unported, v3.0) License.
By accessing the work you hereby accept the Terms. Non-commercial uses of the work are permitted without any further permission from Dove Medical Press Limited, provided the work is properly attributed. For permission for commercial use of this work, please see paragraphs 4.2 and 5 of our Terms.