Back to Archived Journals » Advances and Applications in Bioinformatics and Chemistry » Volume 14
O-GlcNAcylation Prediction: An Unattained Objective
Authors Mauri T ![]() , Menu-Bouaouiche L
, Menu-Bouaouiche L ![]() , Bardor M, Lefebvre T
, Bardor M, Lefebvre T ![]() , Lensink MF
, Lensink MF ![]() , Brysbaert G
, Brysbaert G ![]()
Received 4 December 2020
Accepted for publication 28 April 2021
Published 8 June 2021 Volume 2021:14 Pages 87—102
DOI https://doi.org/10.2147/AABC.S294867
Checked for plagiarism Yes
Review by Single anonymous peer review
Peer reviewer comments 2
Editor who approved publication: Dr Juan Fernandez-Recio
Theo Mauri,1 Laurence Menu-Bouaouiche,2 Muriel Bardor,2 Tony Lefebvre,1 Marc F Lensink,1 Guillaume Brysbaert1
1Univ. Lille, CNRS; UMR8576 - UGSF - Unité de Glycobiologie Structurale et Fonctionnelle, Lille, F-59000, France; 2Normandy University, UNIROUEN, Laboratoire Glyco-MEV EA4358, Rouen, 76000, France
Correspondence: Theo Mauri; Guillaume Brysbaert
UGSF Campus CNRS, Parc de la haute-borne, 50 Avenue de Halley, BP 70478, 59658 Villeneuve d’Ascq Cédex, Lille, France
Tel +33 3 62 53 17 32
Fax +33 3 62 53 17 01
Email [email protected]; [email protected]
Background: O-GlcNAcylation is an essential post-translational modification (PTM) in mammalian cells. It consists in the addition of a N-acetylglucosamine (GlcNAc) residue onto serines or threonines by an O-GlcNAc transferase (OGT). Inhibition of OGT is lethal, and misregulation of this PTM can lead to diverse pathologies including diabetes, Alzheimer’s disease and cancers. Knowing the location of O-GlcNAcylation sites and the ability to accurately predict them is therefore of prime importance to a better understanding of this process and its related pathologies.
Purpose: Here, we present an evaluation of the current predictors of O-GlcNAcylation sites based on a newly built dataset and an investigation to improve predictions.
Methods: Several datasets of experimentally proven O-GlcNAcylated sites were combined, and the resulting meta-dataset was used to evaluate three prediction tools. We further defined a set of new features following the analysis of the primary to tertiary structures of experimentally proven O-GlcNAcylated sites in order to improve predictions by the use of different types of machine learning techniques.
Results: Our results show the failure of currently available algorithms to predict O-GlcNAcylated sites with a precision exceeding 9%. Our efforts to improve the precision with new features using machine learning techniques do succeed for equal proportions of O-GlcNAcylated and non-O-GlcNAcylated sites but fail like the other tools for real-life proportions where ∼ 1.4% of S/T are O-GlcNAcylated.
Conclusion: Present-day algorithms for O-GlcNAcylation prediction narrowly outperform random prediction. The inclusion of additional features, in combination with machine learning algorithms, does not enhance these predictions, emphasizing a pressing need for further development. We hypothesize that the improvement of prediction algorithms requires characterization of OGT’s partners.
Keywords: machine learning, glycosylation, O-GlcNAc, post-translational modification, dataset, OGT
Introduction
O-GlcNAcylation (O-linked β-N-acetylglucosaminylation) is a dynamic post-translational modification (PTM) occurring in cytosol, nucleus and mitochondria under the supervision of two antagonist enzymes: the O-GlcNAc Transferase (OGT) and the O-GlcNAcase (OGA).1,2 The target proteins are modified by the addition of a N-Acetylglucosamine (GlcNAc) residue onto serines (S) or threonines (T), which derives from UDP-GlcNAc supplied by the hexosamine biosynthesis pathway (HBP). The OGT structure can be divided into two parts: the N-terminal tetratricopeptide repeats (TPR) domain which binds to the substrate, and the C-terminal catalytic domain that first recruits UDP-GlcNAc and then adds the GlcNAc moiety on the target protein. Three isoforms of OGT are currently known: ncOGT, mOGT and sOGT. The ncOGT, located in the nucleus and cytoplasm, contains 13.5 TPR repeats, while mOGT, located in the mitochondria, exhibits 9 TPRs. The sOGT (small OGT) is detected in the nucleus and the cytosol like the ncOGT, but contains only 2.5 TPR repeats.3,4 O-GlcNAcylation occurs on thousands of proteins involved in many different pathways and dysregulation of its cycling leads to many pathologies such as cancers, diabetes and Alzheimer’s disease.5 The accurate prediction of O-GlcNAcylation sites would constitute a significant advance as this major PTM is involved in many vital pathways. Unlike N-glycosylation for which the consensus site is well known (N-X-S/T/C with X any residue except proline) and conserved, no specific pattern is currently known for the O-GlcNAcylation.
Therefore, developing efficient prediction tools represent a challenge. Few prediction tools such as YinOYang, O-GlcNAcPred-II and OGTSite are already available.6–8 They implement algorithms such as Random Forest, Neural Networks or Principal Component Analysis and are based on sequence data. They advocate to show good prediction results with sensitivity up to 81.05% and specificity up to 95.91% for O-GlcNAcPred-II. However, these numbers depend on the underlying test set which is different for each tool, making the results hard to compare. In order to be able to properly evaluate the performances of these predictors, we decided to build a large dataset of currently available experimentally proven O-GlcNAcylated sites and to test the performance of the three tools on this new dataset.
We show here that the predictions are not as efficient as expected. Thus, we decided to use the dataset to develop a new prediction tool for O-GlcNAcylation sites, expanding upon the use of sequence information by including structural parameters. We investigated the primary, secondary and tertiary structure environment of every experimentally proven O-GlcNAcylation site in order to define a set of parameters that could be further used by machine learning algorithms. Here, we show that none of the available tools correctly predict O-GlcNAcylated sites, even when we attempted to improve the parameters for machine learning algorithms.
Materials and Methods
Dataset Creation
The dataset was constructed with data from experimentally proven O-GlcNAcylated sites of 236 mammal proteins from the UniProt reviewed database (Swiss-Prot) with the following research: “annotation: (type: carbohyd o glcnac evidence: experimental) AND reviewed: yes”.9 To complete this set, we also retrieved experimental data from PTM-ssMP10 and from the results of Deracinois et al.11 In these sets, we rejected the sites found by sequence homology. The negative sites were taken from the same sequences, considering serines and threonines which were not described as O-GlcNAcylated.
We curated the full set, removing non-mammal sequences. We also removed redundant sequences. After curation, 565 O-GlcNAcylated sites (positive sites) and 40,271 non O-GlcNAcylated sites (negative sites) were gathered. We created a second dataset, removing sequences longer than 4000 residues, since two of the three tested tools do not work on such long sequences: this dataset totals 550 O-GlcNAcylated and 38,665 non O-GlcNAcylated sites.
Evaluation of O-GlcNAcylation Prediction Software
We evaluated the performance of three prediction tools, which are YinOYang, O-GlcNAcpred II and OGTsite,6–8 using the sequences of the reduced dataset. The results of predictions of each of them were then compared to experimental data. A prediction was considered as
- false positive (FP) if not identified experimentally,
- true positive (TP) if validated experimentally,
- false negative (FN) if not predicted but proven experimentally,
- true negative (TN) if not predicted and not proven experimentally.
We further calculated the specificity, the sensitivity, the precision (also called Positive Predictive Value (PPV)), the Negative Predictive Value (NPV), the False Discovery Rate (FDR) and the accuracy of each prediction tool:
- sensitivity is the percentage of unmissed positive sites and corresponds to the number of positive sites correctly classified among all positive ones (TP/(TP+FN)),
- specificity is the percentage of unmissed negative sites and corresponds to the number of TN among all negative ones (TN/(TN+FP)),
- precision (or PPV) corresponds to the chance to predict a site as positive and be correct (TP/(TP+FP)),
- False Detection Rate (FDR) is the contrary, namely the chance to be wrong when predicting a positive site (1-PPV),
- NPV is the same as PPV but for negative sites (TN/(TN+FN)),
- accuracy corresponds to the proportion of correctly predicted sites whether they are positive or negative ((TN+TP)/(TN+FN+TP+FP)).
In OGTSite results, only serines and threonines which are predicted as O-GlcNAcylated are shown. Thus, to calculate the number of TN, we calculated the total number of serines and threonines in our dataset and subtracted FN, TP and FP from it. The total number is 39,215. For the other tools, the “show all serine and threonine” option was available.
Features
Sequence – Structural and Polarity Classification
First of all, each amino acid around the sites in a window of -/+10 residues in the sequence were translated into size (Table 1A) and polarity (Table 1B) classes with Python v3.6 scripts. For the size class, we chose to focus on the nature and the length of each residue totaling 8 classes, whereas for the polarity class, we considered physicochemical properties of amino acids, totaling 9 classes.
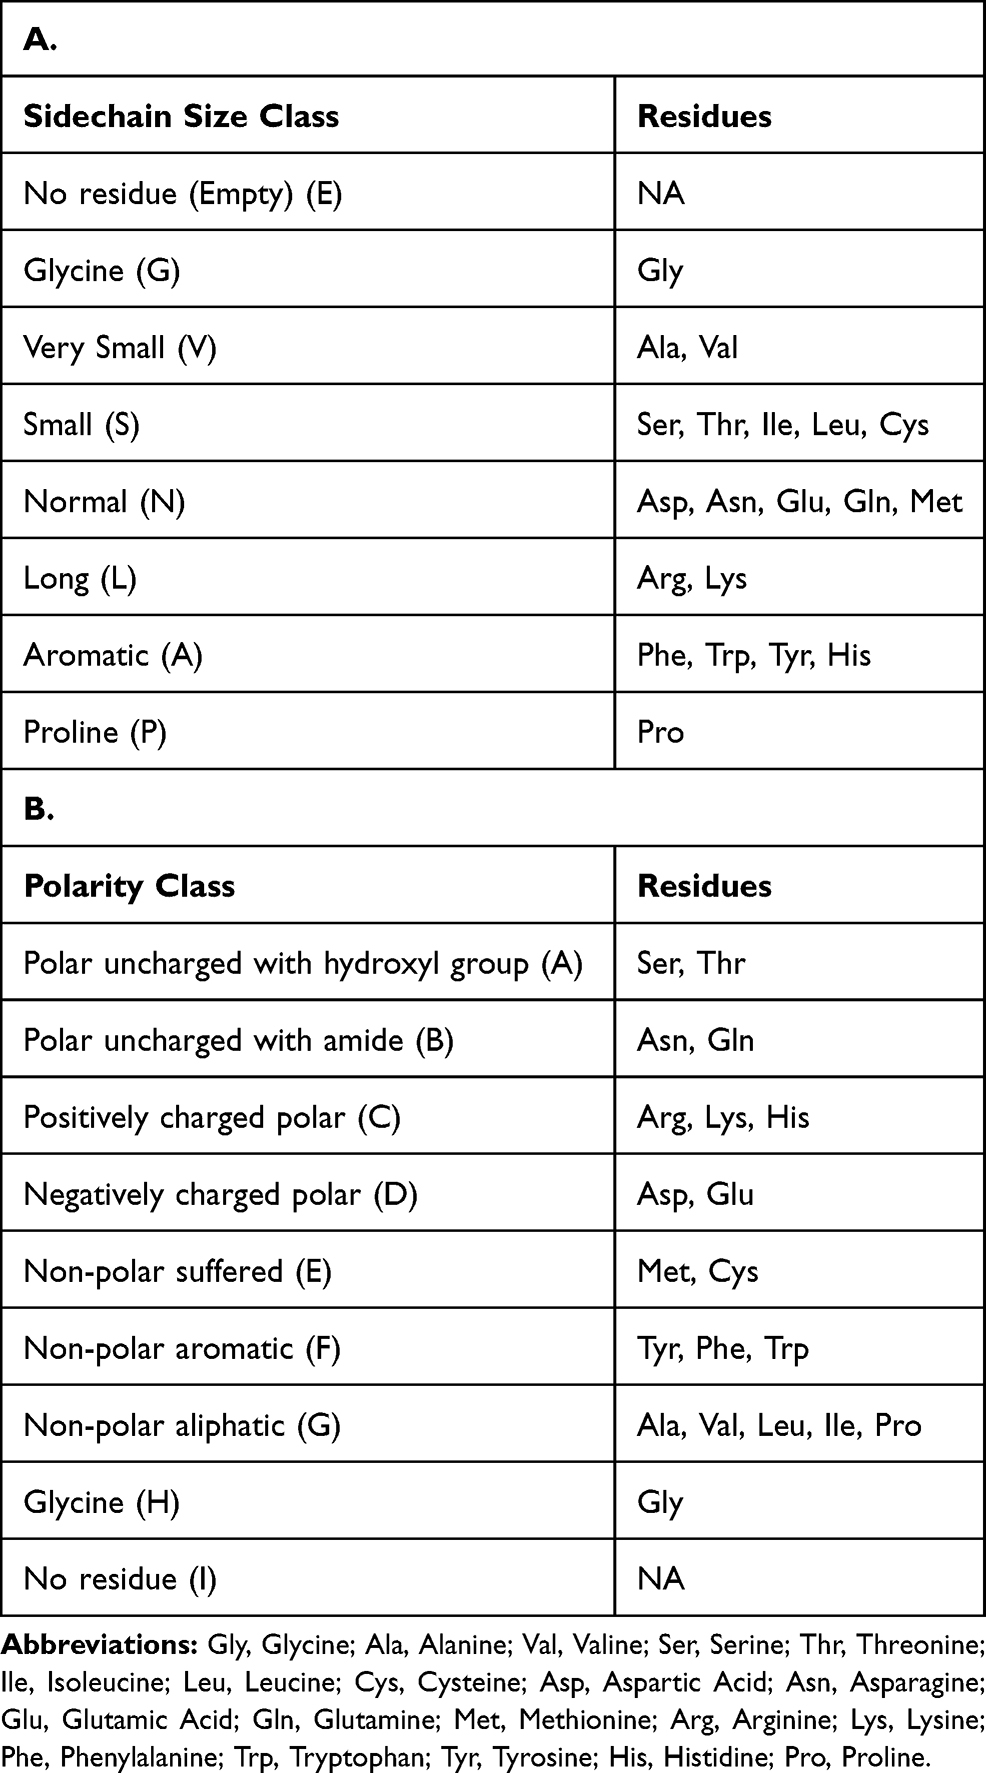 |
Table 1 Definition of the Classes of Amino Acids |
We calculated the proportions of each class at each position in the -/+10 windows and compared them to a random composition of residues of all mammal sequences (reviewed only) retrieved from UniProt (82,495 sequences).
The Chi Square tests were performed after calculating the number of individuals from the proportions. For the case of the random set, these values are theoretical and correspond to the number of individuals that would have been observed.
Sequence – Flexibility Prediction
The flexibility of each site was predicted with the DynaMine tool that only requires a sequence as input.12 A S2 score is provided for each residue. It is lying between 0 and 1 where score inferior to 0.69 is considered as flexible, superior to 0.8 considered as rigid and between these two values there is a twilight zone called context dependent. The results were parsed with a homemade Python v3.6 script to extract the flexibility score of each site, for positive and negative data, and depending on the nature of the site (serine or threonine).
Sequence – Secondary Structure and Angles Predictions
For every site, secondary structures were predicted using two software: SPIDER3 and PSSpred, run locally.13,14 Because the predictions of both were very close to each other, the results were only retrieved from SPIDER3 and stored in a file with all the other parameters.
φ and ψ angles of residues in a −3/+2 window were also retrieved from SPIDER3 predictions, classified as follows: β-strands (−160° < phi < −50° and 100° < psi < 180°), α-helix (−160° < phi < −50° and −60° < psi < 20°) and other.
Structure – Models
To calculate the accessibility of each site, a structure for each protein was needed. As all proteins do not have an available structure in the Protein Data Bank or structures at site locations were missing, we modeled all of them with I-TASSER v5.1 (default parameters),15 installed and run locally on the HPC cluster of the Mesocenter of the University of Lille. We chose I-TASSER, which combines threading and de novo modeling, because it was ranked as the best structure modeling server according to the Critical Assessment of Techniques for Protein Structure Prediction (CASP) for rounds 7 to 14.16–18 Because the tool is limited to 1500 amino acids, we used a sequence window of 1500 residues for those cases where the sequence is longer, ensuring the maximum number of residues at either side of the O-GlcNAcylation site.
Structure – Accessibility to Solvent
NAccess v2.1.119 was used with default parameters to compute the accessibility to solvent of the hydroxyl group of serines or threonines. ElNémo (v10/18/2018)20 was used to create 10 normal modes, from −100 to 100 perturbations by step of 20, from each model obtained by I-TASSER: the 10 largest modes with 10 structures for each of them were kept to render the elasticity of the mode, which produced 100 structures per protein. Then, a homemade Python 3.6 script was written to launch NAccess on each model and their modes to calculate the accessibility. The maximum of accessibility for the 100 structures was conserved for each site.
Machine Learning
To train and test our model, we divided our dataset into two sets: a training set which represents 80% of the dataset and a testing set which represents the remaining 20% of the dataset. As the amount of positive data is much lower than the amount of negative data, we performed an oversampling of the training set and an undersampling of the testing set. Oversampling and undersampling were done with an algorithm for non-continuous data called Random Over Sampling Examples (R package “ROSE”, v0.0.3).21 We also tested on real proportions data (1.4% O-GlcNAcylated vs 98.6% non O-GlcNAcylated) in order to compare the results with the undersampled testing set (Figure 1). We used three types of machine learning algorithms:
- Random Forest (R package “randomForest”, v4.6.14).22 To optimize the parameterization, we trained data on different numbers of trees: once a plateau was found, the first value of this plateau was chosen. Each tree has nodes to test different features. The number of variables tested at each node was chosen to get the best predictions. The finally selected parameters are: ntree = 200 (number of trees), mtry = 3 (number of variables tested at each division).
- Gradient Boosting Tree (GBT) (“xgboost” R package “xgboost”, v1.1.1.1)23 that uses decision trees like Random Forest but including a new variable which is residuals.24 The difference between residuals and the real value to predict is used in the algorithm.
- Support Vector Machine (SVM) is an algorithm essentially based on prediction of two classes (R package “e1071”, v1.7.3).25 Each data value is set in a matrix with as many dimensions as features. Then the algorithm tries to find a plan to separate the positive from the negative data. The more the values are away from this plan, the better the prediction is. We ran four SVM algorithms based on different functions: Linear, Polynomial, Radial basis and Sigmoid which are used to create the plan to classify the two classes. We first used default parameters for all SVM algorithms; then, we investigated hyperparameter tuning for the four algorithms with the “tune” function of the “e1071” package, which gave the hyperparameters cost = 4 and gamma =1. We only present the results of the hyperparameterized sigmoid because this is the one that showed the best results.
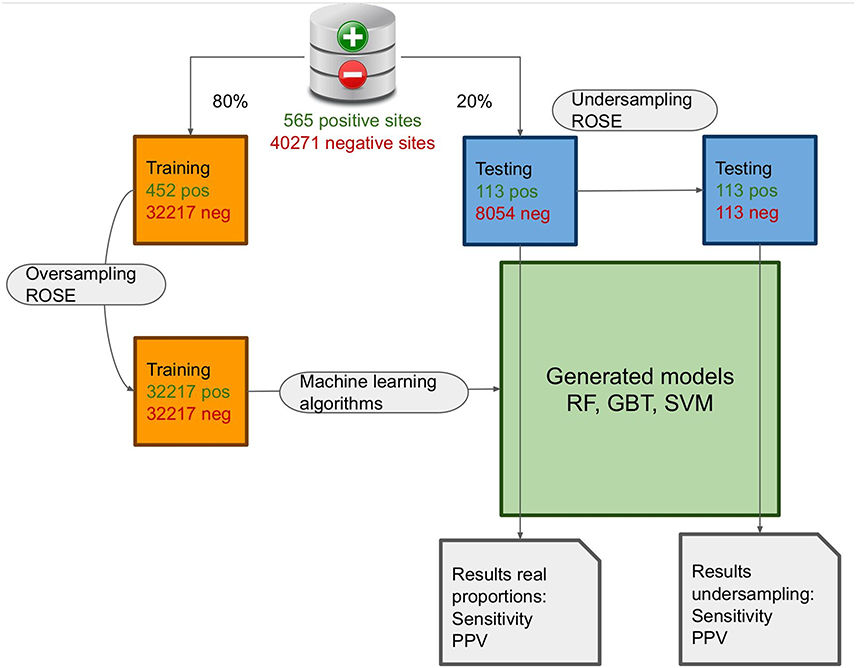 |
Figure 1 Steps of the machine learning training and testing. Machine learning process pipeline representation with over and undersampling to create the training/testing data and the various models from the different algorithms. |
Details about each algorithm can be found in.24
To be able to run the machine learning algorithms, the features listed before were transformed to numeric values. All the transformed parameters are listed below:
- Side Chain length: 0, 1, 2, 3, 4, 5, 6 or 7 where 0 is No Residue, 1 is Glycine, 2 Very Small, 3 Small, 4 Normal, 5 Long, 6 Cycle and 7 Proline from positions −1 to +5
- Non-polar aliphatic amino acids from positions −3 to −1: 0, 1, 2 or 3
- Polar positively charged residues from positions −7 to −5: 0, 1, 2 or 3
- Number of serines and threonines in the -/+10 residue window
- Flexibility: continuous value from 0 to 1 where 0 is flexible and 1 rigid
- Secondary structure: 0, 1 or 2 where 0 is not structured, 1 is alpha helix and 2 is beta strand
- Presence of a proline in +1: 0 or 1 (no or yes)
- Secondary structure according to phi and psi angles (0, 1 or 2)
- Nature of the site: 0 or 1 where 0 is serine and 1 threonine
To test the different algorithms we compared the methods according to the sensitivity and the PPV. We ran each algorithm ten times with ten randomly shuffled datasets (80% to train and 20% to test) and computed the statistics for these ten runs.
To ensure the added value of each feature, MRMD V3.026 was used regarding its five methods: PageRank, LeaderRank, TrustRank, Hist_a and Hist_h.
Everything in this section was done with R v3.6.3.
OGT Partners Analysis
The OGT partners were retrieved from the IMex database through the PSICQUIC27 service inside the Cytoscape28,29 v3.7 software for network visualization and analysis. The enrichment analysis in molecular function of the Gene Ontology was performed with ClueGO v2.5.730 and the EBI GOA (v23/07/2020). The selection criteria were:
- Statistical Test Used = Enrichment/Depletion (Two-sided hypergeometric test)
- Correction Method Used = Bonferroni step down
- Min GO Level = 2
- Max GO Level = 6
- Cluster #1
- Sample File Name = Network selection: ManuallyAddedOrModifiedIDs
- Min number of Genes = 3
- Min Percentage of Genes = 3.0
- GO Fusion = false
- GO Group = true
- Kappa Score Threshold = 0.4
- Over View Term = SmallestPValue
- Group By Kappa Statistics = true
- Initial Group Size = 1
- Sharing Group Percentage = 50.0
Availability of Data
Code and data used in the manuscript are all available in the GIT repository: https://gitlab.in2p3.fr/cmsb-public/OGP.
Results
Evaluation of Available Prediction Tools on a Newly Built Dataset
We built a new dataset with only experimentally proven O-GlcNAcylated sites, ignoring sites identified by homology in order to avoid inclusion of false positives (see Materials and Methods). We obtained a dataset of 565 O-GlcNAcylation sites and 40,271 serine or threonine residues that are not O-GlcNAcylated (data set provided in the git repository). This means that only ~1.4% of all S and T residues of O-GlcNAcylated proteins are O-GlcNAcylated. We refer to O-GlcNAcylated sites as positive data and non O-GlcNAcylated sites as negative data.
Because the YinOYang and O-GlcNAcPred-II prediction tools are limited in terms of protein sequence size, we built a reduced dataset that we used to run each tool. The results of our evaluation are listed in Table 2.
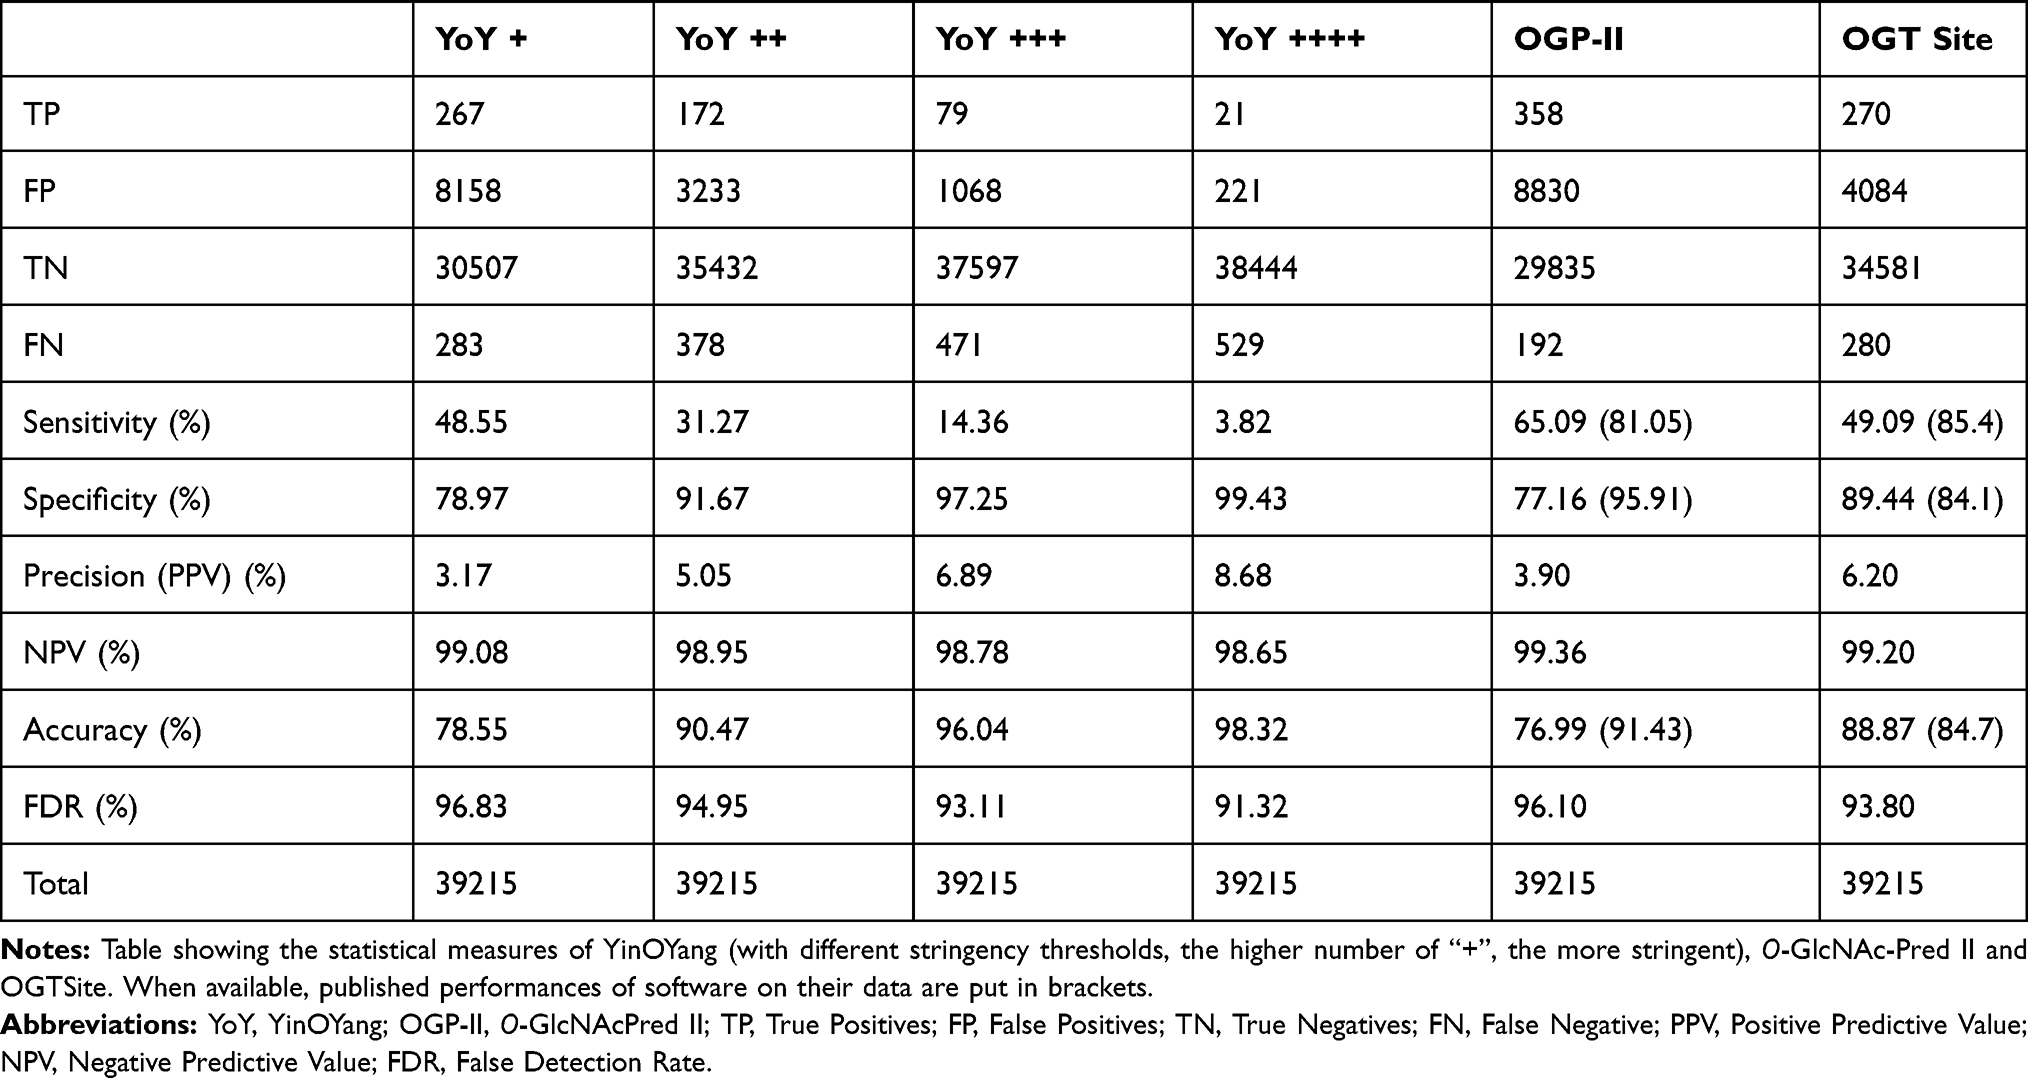 |
Table 2 Evaluation of Commonly Used Methods for O-GlcNAcylated Sites Prediction on Our Dataset |
These results show that, although acceptable values are obtained by the tools for the specificity, the sensitivity and the accuracy, the values are lowered with respect to those previously published6–8 when applied to our new dataset. However, these criteria remain limited in determining which sites are truly O-GlcNAcylated. Another indicator such as the precision, also called Positive Predictive Value (PPV), is more useful. PPV is the chance that a positive prediction is right. In our analysis, we observed that the PPV is very low for any tool, the best one showing only 8.68% (most stringent YinOYang), which means that a site predicted as positive has less than 9% chances to be really O-GlcNAcylated.
The Negative Predictive Value (NPV) is the chance that a negatively predicted site is factually not O-GlcNAcylated. For each tool, values around 99% are found. However, considering that the percentage of non O-GlcNAcylated serines and threonines is ~98.6% (100 − 1.4), the tools perform only marginally better than a random prediction.
In conclusion, the more relevant criterion in a prediction tool is its capacity to identify the true positive sites, quantified in the PPV. Since these are found to be so low for any of the currently available tools, we attempted to improve the predictions using new features. So far, all tools are based on the protein primary structure (sequence) around each site only. Consequently, we decided to first characterize the primary structure of all the O-GlcNAcylated sites and then to expand our analysis to secondary and tertiary structures in order to determine relevant features for new prediction tools.
Analysis of Sequences Around the Sites
We analysed first the O-GlcNAcylated site sequences over a window of −10 to +10 amino acid residues around each O-GlcNAcylated site to keep the maximum of available information without exaggeration. For all the windows, we compared the composition in residues between positive and negative sites in order to highlight over- and under-represented residues in both sets.
Figure 2 shows the proportion of amino acids at each position of the window in the positive (Figure 2A) and negative (Figure 2B) sets. Despite some tendencies, no clear patterns are discernable, although most of the residues around positive sites do show a small side chain. Also, as already described by Leney et al,31 we can see a slightly lower amount of proline residues in +1 for O-GlcNAcylated sites. The authors explain this observation by the crossplay between O-GlcNAcylation and phosphorylation. Indeed, some kinases are proline-directed and the presence of a proline at +1 favors phosphorylation over O-GlcNAcylation. We cannot also exclude the fact that a proline induces a steric hindrance due to its cycle that could hinder the transfer of the O-GlcNAc by the OGT. However, this hypothesis is unfavoured as a proline residue is frequently found at −1 and −2 of an O-GlcNAcylation site.
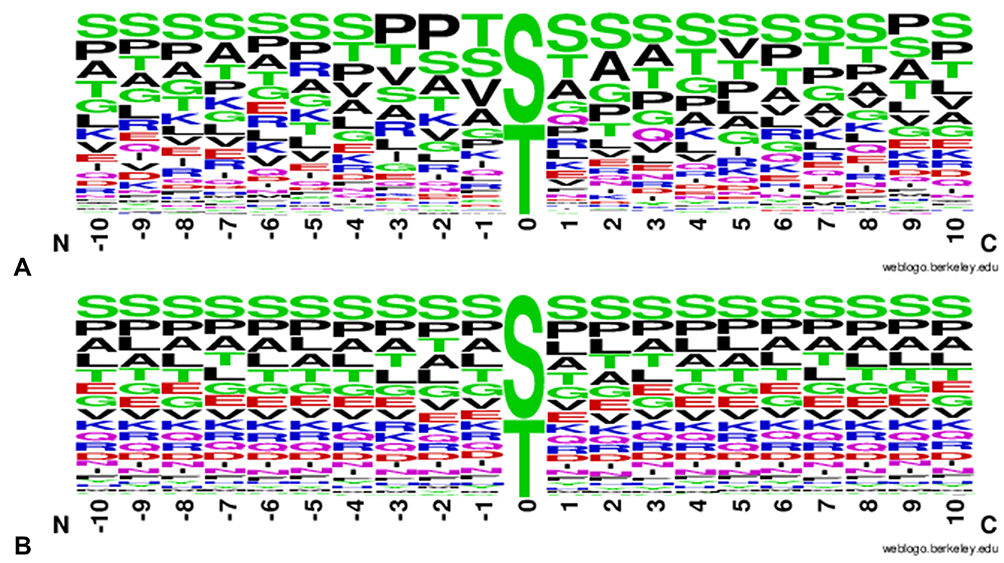 |
Figure 2 WebLogo representing the proportion of amino acids around sites. WebLogo representing the proportion of each amino acid in a -/+ 10 frame around (A) O-GlcNAcylated sites and (B) non O-GlcNAcylated sites. |
To assess if the size of the side chain is a pertinent criterion for prediction of O-GlcNAcylation, we classified residues in function of the size of their side chain. We also classified the residues depending on their polarity and evaluated this criterion as well. In both cases, we compared the proportions to those observed in a random sequence. These classes are listed in Table 1A and B.
Figure 3 shows that the proportions of all the positions in the negative set look more homogeneous between them (Figure 3B) than the proportions of all the positions of the positive set (Figure 3A). Comparing the proportions of the positive set to the negative set and to the proportions of a random sequence, we can see that O-GlcNAcylated sites show a light tendency towards the shorter amino acids in their immediate vicinity. The area −1 to +5 in particular is of special interest as the sum of the proportions of the classes E, G, V and S at each of these positions in the positive set is at least 5% higher to the negative set or the random set. In addition, this figure shows that a serine or threonine close to N-terminal or C-terminal positions has a higher probability to be O-GlcNAcylated as the percentage of the empty class is overall double for the positive data compared to the negative data.
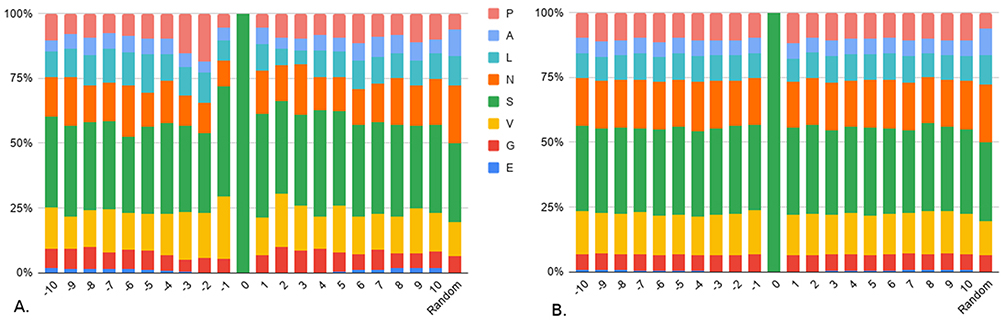 |
Figure 3 Composition in side chain size classes. Composition of side chain size classes around (A) O-GlcNAcylated sites and (B) non O-GlcNAcylated sites. Classes are detailed in Table 1A. Random corresponds to the composition of any position in a random sequence from UniProt. |
When considering polarity, Figure 4 also shows that the proportions of all the positions in the negative set (Figure 4B) look more homogeneous than in the positive set (Figure 4A). Here, two classes are over-represented in the positive set compared to the negative set in two areas: the non-polar aliphatic residues (G), in positions −3 to −1 (respectively, 13.1%, 10.5% and 3.5% higher) and the polar positively charged residues (C) in positions −7 to −5 (respectively, 2.7%, 2.3% and 4% higher). But even if over-represented, not all the sites follow these distributions, which means that these criteria show slight tendencies but are not sufficient to discriminate positive from negative data. The majority of the classes of the non O-GlcNAcylated sites look very close to the random composition. However, running a Chi-square test of proportions between the mean of all the positions of the negative set and the random set shows that they are significantly different (p-value<0.0001). It is essentially due to the amino acid A class (10% higher on average in the negative set), which is the one gathering together serine and threonine residues. The difference in proportions is even higher for the positive set compared to random, also mainly (but not only) due to the A class (14.1% higher on average).
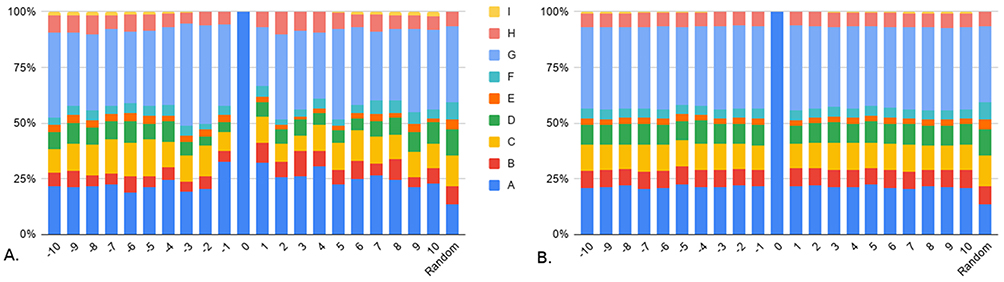 |
Figure 4 Composition in polarity classes. Composition of polarity classes around (A) O-GlcNAcylated sites and (B) non O-GlcNAcylated sites. Classes are detailed in Table 1B. Random corresponds to the composition of any position in a random sequence from UniProt. |
Therefore, globally a −10/+10 window around each serine or threonine in the positive and negative sets contains more serine and threonine residues than random, which means that they tend to be clustered. Intriguingly, the number of serines and threonines seem to be higher around positive than negative sites. Thus, we counted the number of serines and threonines around the sites (without the proper site) for the two classes (Figure 5).
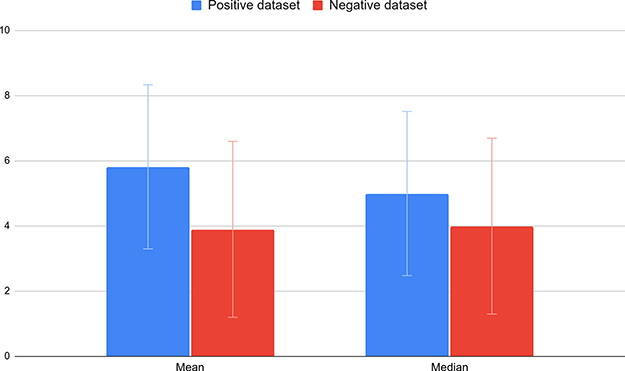 |
Figure 5 Number of serine and threonine residues around positive and negative sites. Histograms representing the mean and median of the number of serine and threonine residues around positive (blue) and negative (red) sites. |
Even if the mean and median of S/T is higher in the O-GlcNAcylated sites (Mann–Whitney test with a p-value <2.2e-16), the standard deviation is high and the distributions show a large overlap, which means that positive sites, like negative sites, can show poor or high densities of S/T, which makes this criterion alone not stringent enough to differentiate between positive and negative sets.
Unfortunately, these criteria show tendencies, but are not discriminative. Additional features will be required in order to enhance the predictive power of our approach. As O-GlcNAcylation is a dynamic modification, we hypothesised that the sites should be flexible and accessible. We therefore investigated the secondary structure, flexibility, tertiary structure and solvent accessibility.
Analysis of Secondary and Tertiary Structures Around the Sites
To predict the backbone flexibility, we used the DynaMine software.12 Figure 6 shows that only 15.27% of all the O-GlcNAcylated sites are predicted in rigid regions, 43.7% in flexible regions and 41.03% in context-dependent regions. These proportions are very similar to the negative dataset with, respectively, 15.78%, 45.13% and 39.09%. By making the distinction between serine and threonine, we find that serine residues are more often found in flexible regions than the threonine ones, independently of whether a site is (positive) or is not (negative) glycosylated and on the contrary that less serines are found in rigid regions. But here, the positive and negative distributions are so close that this feature is not discriminative enough. We further anyway conserved it for machine learning prediction in a first round, in case the very light differences between the positive and negative flexibility predictions could be useful in combination with other features.
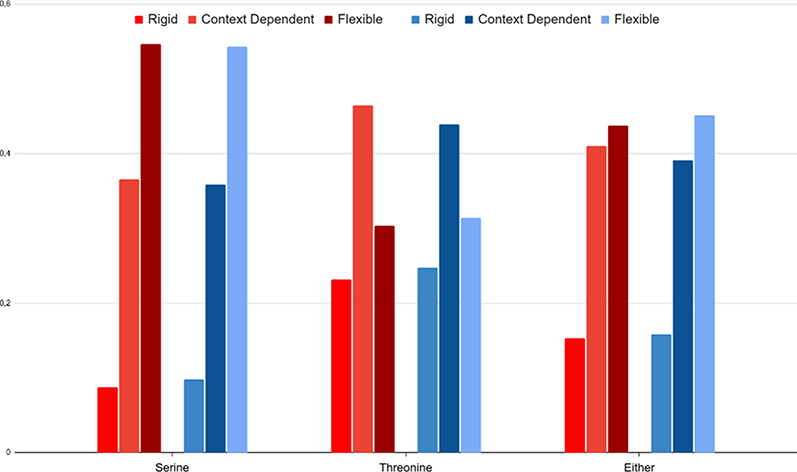 |
Figure 6 Predictive flexibility of O-GlcNAcylated sites and non O-GlcNAcylated sites. Flexibility predicted with DynaMine for positive (red) and negative (blue) datasets depending on the nature of the site: serine, threonine, or both. |
Secondary structures were predicted with SPIDER3, which also computes φ and ψ angles.13 Around 85% of O-GlcNAcylated sites were predicted on unstructured portions of proteins, 10% on α-helix and 5% on β-strands. For non O-GlcNAcylated sites, the percentage of each class is 64%, 28% and 8% for unstructured, α-helix and β-sheet, respectively, which means that O-GlcNAcylated sites are found preferentially in unstructured parts. These results also support the hypothesis that the structure of the substrate should have a small steric hindrance to enter the catalytic pocket of the OGT. But, obviously, this does not allow for a prediction of O-GlcNAcylated sites only based on secondary structure predictions. According to Pathak et al, the backbone symmetry of O-GlcNAcylated sites is like β-strands in the residue range −3 to +2.32 We used the SPIDER3 predictions to check whether the angles actually correspond to β-strands. The most frequent class for each window of 6 residues was kept to classify a site. Table 3 shows that O-GlcNAcylated backbone sites from −3 to +2 are not that different from non O-GlcNAcylated sites. The proportion of β-like backbone in the −3/+2 area is slightly higher for the positive sites but here again, the signal is not strong enough to differentiate these two classes.
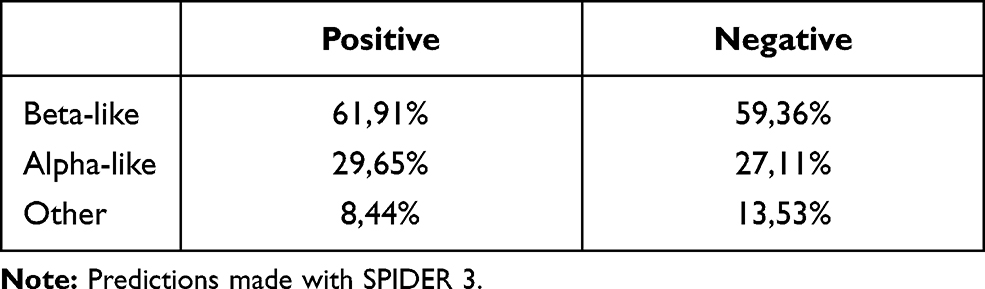 |
Table 3 Percentage of β-Like, α-Like and Other Backbone Angles from −3 to +2 of O-GlcNAcylated Sites (Positive) and Non O-GlcNAcylated Sites (Negative) |
We hypothesised that the sites should be able to dive into the catalytic pocket of the enzyme. Accordingly, modified sites should be globally accessible to solvent. As a consequence, we computed the accessibility to solvent of the O-GlcNAcylated sites. This calculation required the three-dimensional structure of each protein. However, not all proteins of our dataset possess a structure listed in the Protein DataBank (PDB), and even for those for which a structure was available, the area which contained the sites was often missing, undoubtedly due to the intrinsic flexibility of sites prone to O-GlcNAcylation. Therefore, we decided to build modeled structures. Because for a part of the proteins any good template was available, we used I-TASSER. We then calculated the accessibility of all sites in the models using NAccess.19 We also computed normal modes for each structure with the ElNémo software to take into account the potential elasticity of the molecule, which may improve the accessibility of each site.20 But despite some elasticity of the proteins taken into account, the accessibility of each site was very heterogeneous. Figure S1 shows the accessibility for all the sites; ie, the sites of the human CR2 (P20023) and AQP1 (P29972) proteins are totally accessible while others like the mouse Psma7 (Q9Z2U0) and Psma5 (Q9Z2U1) protein sites are not accessible at all. Therefore, in contrast to what we initially thought, we had to discard the use of accessibility for prediction altogether.
Integration of the Features in Machine Learning Algorithms
We studied different aspects of the sites, comparing parameters between the O-GlcNAcylated sites and non O-GlcNAcylated sites of our dataset, from the primary to tertiary structure. None of these parameters are sufficient to differentiate positive from negative data despite some tendencies. Consequently, to find a way to predict O-GlcNAcylation sites, we used them as features in three different types of machine learning (ML) algorithms. We decided not to include the accessibility since it appeared to be unreliable and moreover relies on models of tertiary structures and not on resolved ones. The three types of algorithms we chose are Random Forest (RF), Gradient Boosting Tree (GBT) and Support Vector Machine (SVM),22,24,33 the latter being split into 4 variants (linear, polynomial, radial basis and sigmoidal). We initially chose a RF algorithm because algorithms based on decision trees are well adapted to treat a mixture of numerical and categorical features and to deal with fuzzy input data (outliers, irrelevant inputs). We then evaluated GBT, which is also based on decision trees and is sometimes found to outperform RF for hard classification problems.24 We further tried SVM because it is not based on trees and it is a well-known classifier in bioinformatics that has already been used for O-GlcNAcylation prediction.8,34
Our dataset was divided into two: one for training and one for testing. Following Box and Meyer (1986),35 we used 80% of the data for training and the remaining 20% for testing. As the amount of positive and negative data in the set differs by three orders of magnitude, this could bias the training step. To counter this fact, we used an oversampling method, which consists of adding points in the space representation (created by the features) of positive data to make the amount of positive data equal to the amount of negative data5 for the training (32,217 sites). And we used an undersampling method which consists of choosing randomly the same number of negative data in the set as positive data for the testing (113 sites). The process is described in Figure 1.
Table 4 shows the sensitivity and the PPV for ten runs of each algorithm for testing on undersampled data on one side and not undersampled data (with real proportions of positive vs negative) on the other side. We chose these two measures to be able to compare them with those of YinOYang, O-GlcNAc-Pred II and OGTSite. For the testing set based on undersampled data (50% positive/50% negative), this table demonstrates that Random Forest is the best algorithm based on the mean values of sensitivity followed by the GBT algorithm. The radial basis SVM algorithm follows in third place. Following the PPV, it shows the best prediction algorithm to be GBT while looking at the maximum. Nevertheless, the GBT gives greater heterogeneous results with a standard deviation of 32.18% for the sensitivity and 27.47% for the PPV and, on average, the Random Forest performs better on both tables. We then ran the same algorithms without the features which result from a prediction, namely flexibility, secondary structure and φ/ψ angles, to avoid the potential background noise inherent to any prediction. The results are equivalent to the previous results or less good, showing that including all features is preferred (Table S1).
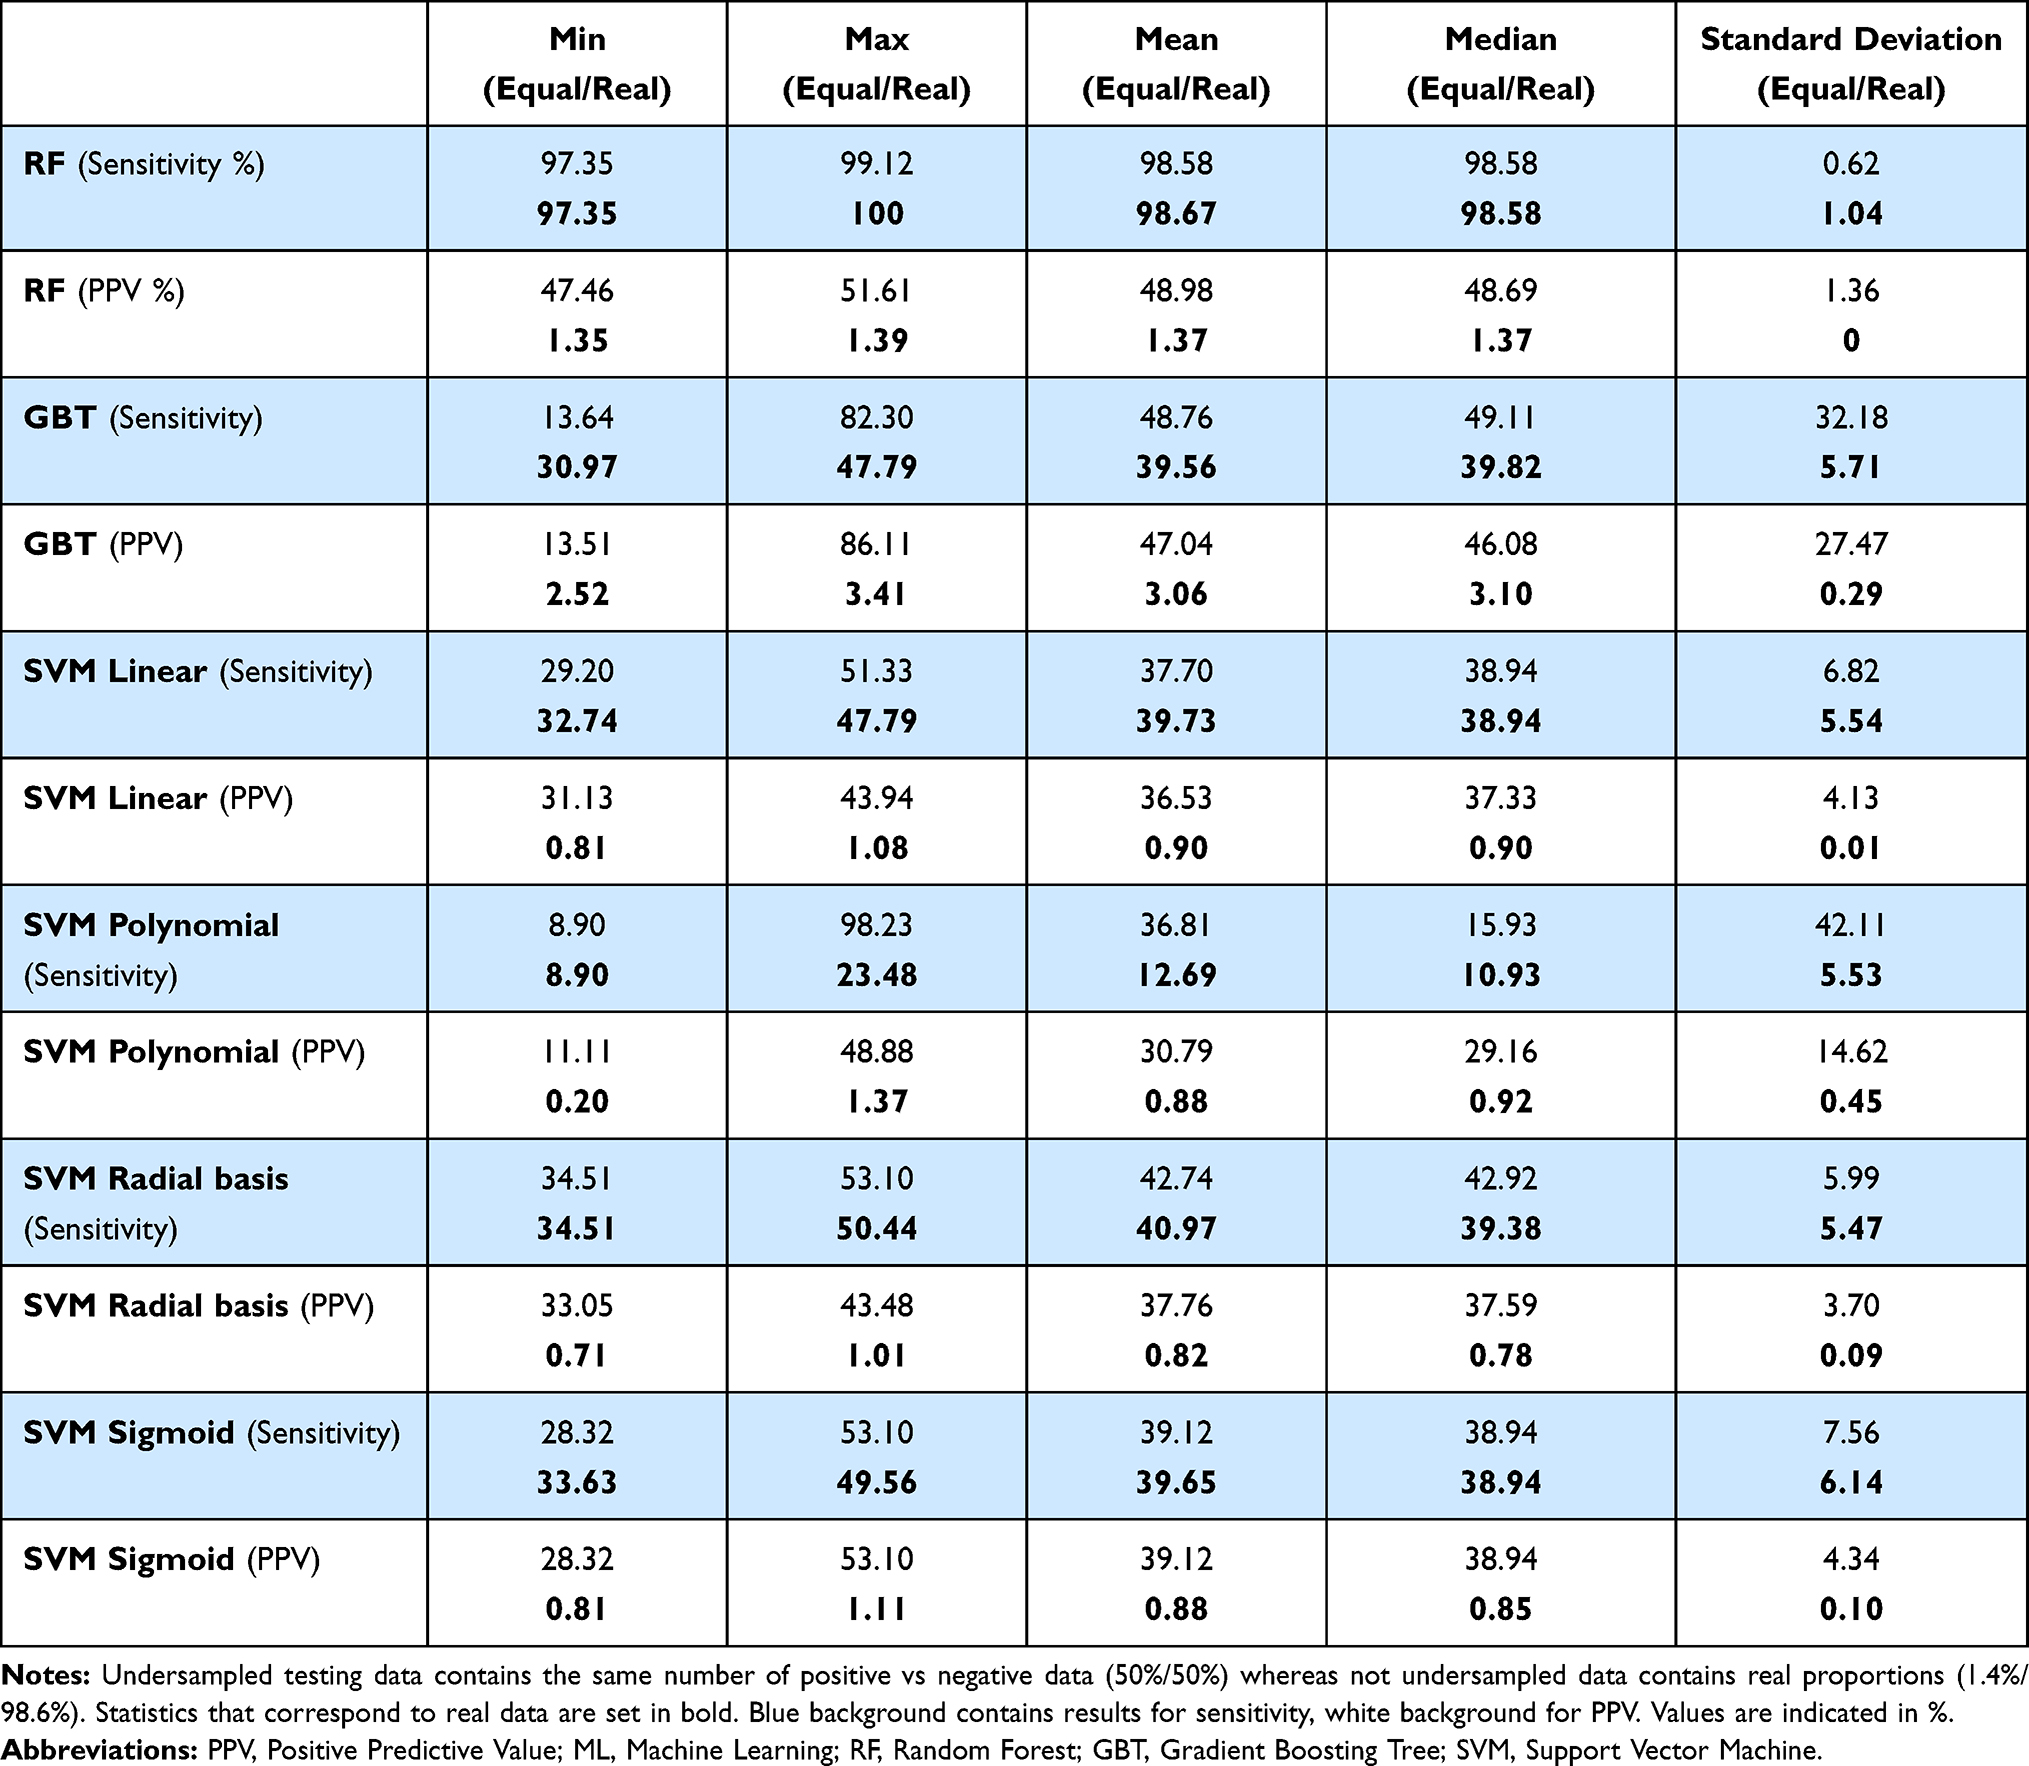 |
Table 4 Sensitivity and PPV of the Three ML Algorithms Tested on Undersampled (Equal) and Not Undersampled (Real) Data |
The results we get when testing on undersampled data are better than the ones of any other tools (Table 2). Nevertheless, this testing set is not representative of the reality where we have less than 2% of serine and threonine residues that can be O-GlcNAcylated. Thereby, we ran ten times the same algorithms but tested them on real proportions of positive and negative data (113 positive sites, ie, 1.4%, and 8054 negative sites, ie, 98.6%), thus without undersampling.
The results presented for real proportions are in bold in Table 4. They are not as good as the previous ones. The sensitivity decreased except for the Random Forest algorithm but looking at the PPV values, they all decreased drastically to around 1% except for the GBT algorithm which is around 3%, a value close to other already existing O-GlcNAcylation prediction tools. For the sensitivity, RF gives really good results but the amount of false positives is very high, which explains the low PPV. Once again, we ran the predictions with the three algorithms on data without the features based on predictions, and obtained similar or slightly worse results (Table S1).
Yet, we tuned the SVM sigmoid algorithm, which gave the best results among the SVM algorithms, with hyperparameterization. Here, the best hyperparameters were cost equals 4 and gamma equals 1. Once the hyperparameters set, the results of the SVM sigmoid algorithm slightly increased but stayed lower than GBT and Random Forest (Table S1).
Thus, currently available tools are not as efficient as claimed, considering the PPV (best PPV is lower than 9%). As we tried to improve predictions with the various machine learning algorithms, optimizing the features, we failed to get better results when running them on data with real proportions (our best PPV is around 3%).
Discussion
Predicting O-GlcNAcylation is a tricky task: unlike other PTMs, such as phosphorylation or N-glycosylation, there is no common pattern or consensus sequences as well as limited experimentally validated data. Much effort has been spent attempting to develop software to solve this problem but we showed here that their predictive power is disappointing. Subsequently, we tried to improve the predictions using machine learning algorithms by adding characterized features based on primary to tertiary structure information. Although they show better results on undersampled data, they fail to give good results on data with realistic proportions of O-GlcNAcylated serine and threonine residues (~1.4% O-GlcNAcylated/98.6% non O-GlcNAcylated).
The published tools are all based on algorithms trained on protein primary sequences. Because there is only a limited amount of experimentally proven data available, the training of an algorithm to predict sites is very hard. Some of the currently available tools therefore use the prediction of O-GlcNAcylated sites by homology. This provides more data for the training, but the data are intrinsically biased, which may explain the poor results we get when running them on our dataset. Precisely, regarding the results of the different tools, we pointed out that the statistical quantities used to compare their efficiency are not as significant as they should be. Looking at the biological problem, the statistical measurements used here must be improved by taking into account the number of false positives. Sensitivity is a major statistical measurement to see if some positive sites are missed which is interesting when data are balanced. Yet, it is a quantity to take carefully into account because if a tool simply predicted all the sites as positive, this statistic would be maximized, but the tool would be pointless. Looking at the Positive Predictive Value (PPV) (also called precision) is more relevant because it shows the proportion of correct positive predictions compared to all the positive predictions, which is exactly what a researcher wants to know when he/she performs such a prediction. However, currently, no available software succeeds to show a correct PPV value.
All these tools are only primary sequence based. In our sequence analysis, we only showed slight tendencies when comparing various features in a -/+10 window around serines/threonines between positive and negative sets, which makes it hard to classify sites into the two categories. We showed a similarity of composition between non O-GlcNAcylation sites and random. The positive data are different from this composition but the difference could result from the low number of data and having a bigger amount could lead to a homogenisation of the composition. A significantly higher number of positive data may bend the composition to a composition close to the random set.
To bypass this problem of lack of discriminating information from sequences and in order to improve the classification, we characterized additional structural and dynamic parameters derived from the sequence to enrich the features list for machine learning algorithms. Unfortunately, these new features either showed slight tendencies again (secondary structure, dihedral angles) or were without real interest (accessibility), and integrating them into machine learning algorithms did not enhance the predictive power. Derived features like these ones can sometimes improve the training but may also generate a bias due to their predictive aspect, which is why we trained our algorithms also without them. The results obtained thus were close to those obtained with predicted features, but never better. For a better evaluation of the feature selection, we used the MRMD3.0 tool to rank and reduce the features for machine learning.32 It provides 5 different ranking algorithms. Two of five did not reduce the number of features and the three others reduced by two or three the features. The Hist_h and the LeaderRank methods removed the flexibility and the number of threonines. LeaderRank scoring also removed the presence of proline at +1 while the TrustRank removed the feature length class at position +5. But these removals resulted in a very low ranking score difference with the other kept features (a difference of 0.0001 point), meaning the results would not significantly change when removing them. Therefore, removing features does not improve predictions.
The data retrieved to build our dataset are all experimentally proven by tandem mass spectrometry, which is a conventional method currently used to identify O-GlcNAcylated sites, and/or by site-mutagenesis. Although experimentally proven, we cannot exclude that false positives and negatives may exist, which adds noise to the training. The FP and FN may be related to technical issues or experimental conditions, in particular considering that O-GlcNAcylation in an invivo environment can be more or less efficient than in an invitro environment.
The lack of positive data which leads to the limitation of the unbalanced data (which add bias in prediction) can explain the low PPV obtained by our method but also by the previously published tools. We pointed out that the use of equal amounts of positive and negative data in our and other works like O-GlcNAcPred-II showed really better results. Still, these proportions are not realistic because only 1% to 2% of the total serine and threonine residues of proteins are truly O-GlcNAcylated and, using our best models on realistic proportions, the PPV dropped significantly from 86% for the best GBT model to 3%. Also, considering the sensitivity, a criterion mostly used in the publications of the currently available tools, we obtained better values than the other tools with a Random Forest algorithm. We do, however, consider this difference insignificant because of the large amount of false-positive data. Indeed, our RF gives a sensitivity close to 100% but with a precision ~50% for balanced data and ~1% for real proportionate data, which basically means it classifies all the sites as O-GlcNAcylated, making the predictor irrelevant. This problem is linked to the oversampling of trained data but training on undersampled data is not possible in this case because of the lack of positive data (we tried to train RF models on undersampled data, which gave on average a sensitivity = 22.12% and a PPV= 0.54%). It highlights the fact that the amount of available experimental data is crucial for any machine learning algorithm. Thus, it will be worthwhile to apply our methods again when significantly more positive experimental data are available. Here, we showed that the PPV of any tool is currently so low (<9%) that there is a necessity to develop a new and efficient tool based on a bigger dataset of positive data. The RF, GBT and SVM classifier methods we used showed in the past to be very efficient for other predictions,36–38 and we are convinced now that the problem resides in the data and associated features used, rather than in the algorithms themselves. That is the reason why we did not explore more algorithms. At present, our conclusion is that protein sequence or any sequence-derived information is simply not sufficient for a good prediction and that the amount of positive data is too low for an efficient prediction.
In contrast to its competitive relationship with phosphorylation, O-GlcNAcylation is catalyzed by only two antagonistic enzymes, OGT and OGA. A hypothesis is that the OGT requires scaffold partners to be addressed to and to bind its substrates, but also to unfold them (some sites being predicted to be buried in the structures we modeled). To preliminary explore this way, we performed an enrichment of these partners in Gene Ontology - Molecular Functions to identify the proteins which are currently known to be in interaction with OGT.
Figure 7 shows that partners of OGT are involved in protein binding but also that some are involved in unfolded protein binding, which may relate to the existence of buried O-GlcNAcylated sites. This GO class contains 4 proteins: Chaperonin Containing TCP1 (T-Complex Protein 1) Subunit 2 (CCT2), 3 (CCT3) and 5 (CCT5) (a chaperone involved in TCP1),39 and a Heat Shock Protein Family D Member 1 complex (HSPD1)40 (a mitochondrial chaperone of imported proteins in the mitochondria). Indeed, these chaperones can bind unfolded proteins to fold them. Their interaction with OGT could participate in the O-GlcNAcylation of target proteins before, during or after folding; this subject area would deserve to be deeply studied in a future work for a better understanding of O-GlcNAcylation processes. Another intriguing point that could help to improve the predictions if taken into account is that O-GlcNAcylation is a reaction that can occur co-translationally,41 meaning that protein folding and O-GlcNAcylation can occur at the same time. These sites should be analysed separately from the post-translational ones to be able to improve predictions but such annotation is currently lacking in databases. Therefore, predicting an O-GlcNAcylation as co-translational is an even more difficult task.
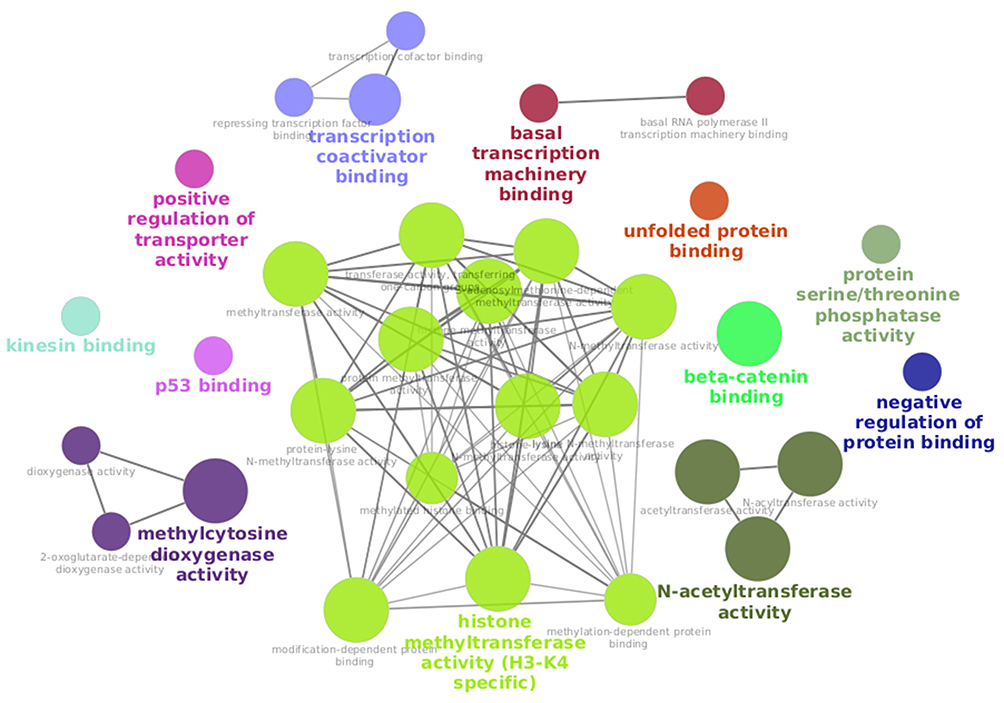 |
Figure 7 Network of GO terms (Molecular Functions) of partners of OGT. Network visualisation of GO terms (Molecular Functions) of proteins known to interact with the human OGT from the IMex interaction database - enrichment performed with ClueGO (see Material and methods for parameters). |
OGT presents several isoforms exhibiting different numbers of TPRs in the N-terminal domain. This variation in the number of repetitions could play a role in the enzyme capacity to recognize and modify sites which are on structured or unstructured parts of proteins, with unstructured sections that would be able to enter the lumen of the TPR superhelix. For instance, the structure of human O-GlcNAc Transferase (PDB ID: 4N3B)42 harbors a modified peptide from HCF-1 inside the superhelix of the first TPR repeat, which indicates that OGT is able to accept unfolded structures inside its TPR domain. The ncOGT may thereby be able to accept longer unfolded structures inside its longer TPR repeats domain compared to sOGT. Furthermore, these O-GlcNAcylation sites could be presented to OGT with the help of its partners. These interactors could help the enzyme to discriminate between sites to O-GlcNAcylate or not. The key for an efficient prediction may thereupon require a detailed study of OGT’s partners and the annotation and classification of each experimentally validated data with its specific context (partners, subcellular compartment of the cell, function of the target …) for a training of the algorithm specific to the context.
Conclusion
Currently available software tools for prediction of sites that can be O-GlcNAcylated do not show relevant statistics because sensitivity and specificity do not reflect the capacity of a predictor to provide an unambiguously positive and correct answer. To this purpose, the precision is more adapted and we showed that these tools are less efficient than expected because of the high amount of false positives in their predictions. We tried to improve the prediction methods by characterizing structural and dynamic features such as flexibility, accessibility and secondary structure prediction, but also amino acid composition through the classification of amino acids around positive or negative sites in function of their nature. We found that these features only showed tendencies and that none could be given discriminatory powers. We have combined them in machine learning algorithms, but none of the algorithms succeeded in enhancing the precision. The highest precision currently reached by any algorithm lies below 9%, which makes the O-GlcNAcylation prediction an as of yet unattained objective.
Acknowledgments
TM is a recipient of a fellow from the “Ministère de l’Enseignement Supérieur et de la Recherche“. We thank the “Centre de Formation par Alternance” of the University of Rouen, the CNRS (Centre National de la Recherche Scientifique) and the University of Lille for their support. We acknowledge support from the High Performance Computing Mesocenter of the University of Lille and the bioinformatics platform bilille for providing access to cluster and cloud computing resources. We thank Thierry Lecroq (University of Rouen, Normandie, France) and the “O-GlcNAcylation, signalisation cellulaire et cycle cellulaire“ team of the UGSF lab for their advice and discussion in this project.
Disclosure
All the authors report no conflicts of interest in this work.
References
1. Vercoutter-Edouart A-S, El Yazidi-Belkoura I, Guinez C, et al. Detection and identification of O-GlcNAcylated proteins by proteomic approaches. Proteomics. 2015;15(5–6):1039–1050. doi:10.1002/pmic.201400326
2. Yang X, Qian K. Protein O-GlcNAcylation: emerging mechanisms and functions. Nat Rev Mol Cell Biol. 2017;18(7):452–465. doi:10.1038/nrm.2017.22
3. Aquino-Gil M, Pierce A, Perez-Cervera Y, Zenteno E, Lefebvre T. OGT: a short overview of an enzyme standing out from usual glycosyltransferases. Biochem Soc Trans. 2017;45(2):365–370. doi:10.1042/BST20160404
4. Vocadlo DJ. O-GlcNAc processing enzymes: catalytic mechanisms, substrate specificity, and enzyme regulation. Curr Opin Chem Biol. 2012;16(5–6):488–497. doi:10.1016/j.cbpa.2012.10.021
5. Bond MR, Hanover JA. A little sugar goes a long way: the cell biology of O-GlcNAc. J Cell Biol. 2015;208(7):869–880. doi:10.1083/jcb.201501101
6. Gupta R, Brunak S. Prediction of glycosylation across the human proteome and the correlation to protein function. Pac Symp Biocomput Pac Symp Biocomput. 2002;310–322.
7. Jia C, Zuo Y, Zou Q, Hancock J. O-GlcNAcPRED-II: an integrated classification algorithm for identifying O-GlcNAcylation sites based on fuzzy undersampling and a K-means PCA oversampling technique. Bioinforma Oxf Engl. 2018;34(12):2029–2036. doi:10.1093/bioinformatics/bty039
8. Kao H-J, Huang C-H, Bretaña NA, et al. A two-layered machine learning method to identify protein O-GlcNAcylation sites with O-GlcNAc transferase substrate motifs. BMC Bioinform. 2015;16(Suppl 18):S10. doi:10.1186/1471-2105-16-S18-S10
9. Pundir S, Martin M, O’Donovan C. UniProt tools. Curr Protoc Bioinforma Ed Board Andreas Baxevanis Al. 2016;53:
10. Liu Y, Wang M, Xi J, Luo F, Li A. PTM-ssMP: a web server for predicting different types of post-translational modification sites using novel site-specific modification profile. Int J Biol Sci. 2018;14(8):946–956. doi:10.7150/ijbs.24121
11. Deracinois B, Camoin L, Lambert M, et al. O-GlcNAcylation site mapping by (azide-alkyne) click chemistry and mass spectrometry following intensive fractionation of skeletal muscle cells proteins. J Proteomics. 2018;186:83–97. doi:10.1016/j.jprot.2018.07.005
12. Cilia E, Pancsa R, Tompa P, Lenaerts T, Vranken WF. The DynaMine webserver: predicting protein dynamics from sequence. Nucleic Acids Res. 2014;42(W1):W264–W270. doi:10.1093/nar/gku270
13. Heffernan R, Yang Y, Paliwal K, Zhou Y, Valencia A. Capturing non-local interactions by long short-term memory bidirectional recurrent neural networks for improving prediction of protein secondary structure, backbone angles, contact numbers and solvent accessibility. Bioinforma Oxf Engl. 2017;33(18):2842–2849. doi:10.1093/bioinformatics/btx218
14. Yan R, Xu D, Yang J, Walker S, Zhang Y. A comparative assessment and analysis of 20 representative sequence alignment methods for protein structure prediction. Sci Rep. 2013;3:2619. doi:10.1038/srep02619
15. Yang J, Zhang Y. I-TASSER server: new development for protein structure and function predictions. Nucleic Acids Res. 2015;43(W1):W174–181. doi:10.1093/nar/gkv342
16. Kryshtafovych A, Schwede T, Topf M, Fidelis K, Moult J. Critical assessment of methods of protein structure prediction (CASP)—round XIII. Proteins Struct Funct Bioinforma. 2019;87(12):1011–1020. doi:10.1002/prot.25823
17. Moult J, Fidelis K, Kryshtafovych A, Schwede T, Tramontano A. Critical assessment of methods of protein structure prediction (CASP) — round x. Proteins. 2014;82(02):1–6. doi:10.1002/prot.24452
18. Moult J, Fidelis K, Kryshtafovych A, Schwede T, Tramontano A. Critical assessment of methods of protein structure prediction (CASP)—round XII. Proteins Struct Funct Bioinforma. 2018;86(S1):7–15. doi:10.1002/prot.25415
19. Hubbard SJ, Thornton JM. NACCESS. London: Department of Biochemistry and Molecular Biology, University College; 1993.
20. Suhre K, Sanejouand Y-H. ElNémo: a normal mode web server for protein movement analysis and the generation of templates for molecular replacement. Nucleic Acids Res. 2004;32(suppl_2):W610–W614. doi:10.1093/nar/gkh368
21. Lunardon N, Menardi G, Torelli N. ROSE: a package for binary imbalanced learning. R J. 2014;6:79–89. doi:10.32614/RJ-2014-008
22. Liaw A, Wiener M. Classification and regression by random forest. Forest. 2001;23.
23. Chen T, Guestrin C. XGBoost: a scalable tree boosting system. Proceedings of the 22nd ACM SIGKDD international conference on knowledge discovery and data mining. ACM. 2016;785–794. doi:10.1145/2939672.2939785
24. Hastie T, Tibshirani R, Friedman J. Boosting and additive trees. In: The Elements of Statistical Learning. Springer Series in Statistics. New York: Springer;2009:337–387. doi:10.1007/978-0-387-84858-7_10
25. Dimitriadou E, Hornik K, Leisch F, et al. The e1071 package. 2006.
26. He S, Guo F, Zou Q, Ding H. MRMD2.0: a python tool for machine learning with feature ranking and reduction. Curr Bioinforma. 2021;15(10):1213–1221. doi:10.2174/1574893615999200503030350
27. Orchard S, Kerrien S, Abbani S, et al. Protein interaction data curation: the International Molecular Exchange (IMEx) consortium. Nat Methods. 2012;9(4):345–350. doi:10.1038/nmeth.1931
28. Shannon P, Markiel A, Ozier O, et al. Cytoscape: a software environment for integrated models of biomolecular interaction networks. Genome Res. 2003;13(11):2498–2504. doi:10.1101/gr.1239303
29. Su G, Morris JH, Demchak B, Bader GD. Biological network exploration with cytoscape 3. Curr Protoc Bioinforma. 2014;47(1):
30. Bindea G, Mlecnik B, Hackl H, et al. ClueGO: a Cytoscape plug-in to decipher functionally grouped gene ontology and pathway annotation networks. Bioinformatics. 2009;25(8):1091–1093. doi:10.1093/bioinformatics/btp101
31. Leney AC, El Atmioui D, Wu W, Ovaa H, Heck AJR. Elucidating crosstalk mechanisms between phosphorylation and O-GlcNAcylation. Proc Natl Acad Sci U S A. 2017;114(35):E7255–E7261. doi:10.1073/pnas.1620529114
32. Pathak S, Alonso J, Schimpl M, et al. The active site of O-GlcNAc transferase imposes constraints on substrate sequence. Nat Struct Mol Biol. 2015;22(9):744–750. doi:10.1038/nsmb.3063
33. Cortes C, Vapnik V. Support-vector networks. Mach Learn. 1995;20(3):273–297. doi:10.1007/BF00994018
34. Wang J, Torii M, Liu H, Hart GW, Hu -Z-Z. dbOGAP - an integrated bioinformatics resource for protein O-GlcNAcylation. BMC Bioinform. 2011;12(1):91. doi:10.1186/1471-2105-12-91
35. Box GEP, Meyer RD. An analysis for unreplicated fractional factorials. Technometrics. 1986;28(1):11–18. doi:10.1080/00401706.1986.10488093
36. Huang S, Cai N, Pacheco PP, Narandes S, Wang Y, Xu W. Applications of Support Vector Machine (SVM) learning in cancer genomics. Cancer Genom Proteomics. 2017;15(1):41–51. doi:10.21873/cgp.20063
37. Fan C, Liu D, Huang R, Chen Z, Deng L. PredRSA: a gradient boosted regression trees approach for predicting protein solvent accessibility. BMC Bioinform. 2016;17(S1):S8. doi:10.1186/s12859-015-0851-2
38. Hou Q, De Geest PFG, Vranken WF, Heringa J, Feenstra KA. Seeing the trees through the forest: sequence-based homo- and heteromeric protein-protein interaction sites prediction using random forest. Bioinformatics. 2017;33(10):1479–1487. doi:10.1093/bioinformatics/btx005
39. Hauri S, Comoglio F, Seimiya M, et al. A high-density map for navigating the human polycomb complexome. Cell Rep. 2016;17(2):583–595. doi:10.1016/j.celrep.2016.08.096
40. Fasci D, van Ingen H, Scheltema RA, Heck AJR. Histone interaction landscapes visualized by crosslinking mass spectrometry in intact cell nuclei. Mol Cell Proteomics. 2018;17(10):2018–2033. doi:10.1074/mcp.RA118.000924
41. Zhu Y, Liu T-W, Cecioni S, Eskandari R, Zandberg WF, Vocadlo DJ. O-GlcNAc occurs cotranslationally to stabilize nascent polypeptide chains. Nat Chem Biol. 2015;11(5):319–325. doi:10.1038/nchembio.1774
42. Lazarus MB, Jiang J, Kapuria V, et al. HCF-1 is cleaved in the active site of O-GlcNAc transferase. Science. 2013;342(6163):1235–1239. doi:10.1126/science.1243990
 © 2021 The Author(s). This work is published and licensed by Dove Medical Press Limited. The
full terms of this license are available at https://www.dovepress.com/terms
and incorporate the Creative Commons Attribution
- Non Commercial (unported, 3.0) License.
By accessing the work you hereby accept the Terms. Non-commercial uses of the work are permitted
without any further permission from Dove Medical Press Limited, provided the work is properly
attributed. For permission for commercial use of this work, please see paragraphs 4.2 and 5 of our Terms.
© 2021 The Author(s). This work is published and licensed by Dove Medical Press Limited. The
full terms of this license are available at https://www.dovepress.com/terms
and incorporate the Creative Commons Attribution
- Non Commercial (unported, 3.0) License.
By accessing the work you hereby accept the Terms. Non-commercial uses of the work are permitted
without any further permission from Dove Medical Press Limited, provided the work is properly
attributed. For permission for commercial use of this work, please see paragraphs 4.2 and 5 of our Terms.