Back to Journals » International Journal of Nanomedicine » Volume 16
Novel Cellulose Fibre-Based Flexible Plasmonic Membrane for Point-of-Care SERS Biomarker Detection in Chronic Wound Healing
Authors Perumal J ![]() , Lim HQ, Attia ABE, Raziq R, Leavesley DI
, Lim HQ, Attia ABE, Raziq R, Leavesley DI ![]() , Upton Z, Dinish US, Olivo M
, Upton Z, Dinish US, Olivo M
Received 21 January 2021
Accepted for publication 6 May 2021
Published 27 August 2021 Volume 2021:16 Pages 5869—5878
DOI https://doi.org/10.2147/IJN.S303130
Checked for plagiarism Yes
Review by Single anonymous peer review
Peer reviewer comments 4
Editor who approved publication: Dr Yan Shen
Jayakumar Perumal,1 Hann Qian Lim,1 Amalina Binte Ebrahim Attia,1 Riazul Raziq,1 David Ian Leavesley,2 Zee Upton,2 US Dinish,1 Malini Olivo1
1Translational Biophotonics Laboratory, Institute of Bioengineering and Bioimaging, Agency for Science Technology and Research (A*STAR), Singapore; 2Skin Research Institute of Singapore, Agency for Science, Technology and Research (A*STAR), Singapore
Correspondence: Malini Olivo
Translational Biophotonics Laboratory, Institute of Bioengineering and Bioimaging, Agency for Science Technology and Research (A*STAR), Singapore
Email [email protected]
Background: Wound management is stretching the limits of health systems globally, challenging clinicians to evaluate the effectiveness of their treatments and deliver appropriate care to their patients. Visual inspection and manual measurement of wound size are subjective, often inaccurate and inconsistent. Growth factors, such as pro-inflammatory cytokines and proteases, play important roles in cutaneous wound healing. However, little is known about the point-of-care monitoring of the changes in such markers during the healing process. Here, we explore the capability of surface-enhanced Raman spectroscopy (SERS) as a viable point-of-care platform to monitor the changes of these surrogate indicators of healing status in chronic wounds.
Methods: We developed a biofunctionalized flexible, cost-effective, scalable and easy-to-fabricate plasmonic SERS substrate using cellulose fibre (CF), which is used for sensing of wound markers based on a modified immunoassay method.
Results: We evaluated and selected the reliable silver nano-island thickness that will be sputtered onto the CF-based substrate for the highest SERS enhancement. Using this biofunctionalized SERS substrate, we detected varying concentrations of MMP-9 (10– 5000 ng/mL) and TNF-α (5– 100 ng/mL) proteins to model the wound exudates. This SERS detection method demonstrates a linear response within biologically relevant concentrations, ranging from 10 to 500 ng/mL for MMP-9 and 5 to 25 ng/mL for TNF-α for these surrogate indicators.
Conclusion: Our SERS sensing platform achieved detection limits in the μM to sub-nM range and displayed high sensitivity and selectivity. This could result in a cheap, point-of-care device that provides a non-invasive measure of cutaneous wound healing in real time. We envision that these flexible substrates after activation may be incorporated into wound dressings in future for routine monitoring of wound healing status.
Keywords: SERS, cellulose fibres, membrane SERS, point-of-care, paper devices, wound biomarkers, flexible biosensor
Introduction
Wound healing involves the multifaceted coordination of cellular responses to the presence of protein mediators and regulators, and mobilization of biological events to facilitate tissue repair.1 In the presence of pathophysiological abnormalities, such as high blood sugar level in diabetes, this coordination fails, impairing wound healing and tissue repair. Current approaches to managing chronic wounds remain reliant on regular monitoring with clinical reviews over prolonged periods of time. This comprehensive care plan is complex, tedious and labor-intensive, resulting in inefficiencies, high costs and often poor compliance, ensuring chronic wound management is among the most impactful current socioeconomic healthcare challenges. Current clinical reviews include capturing digital photographs of the wound and physically measuring its dimensions to monitor the wound size over time; little information is captured from the wound at the cellular or tissue level.2–5 Because of the complexity of the mechanisms involved in wound healing, there exists a plethora of possible biological targets and markers, including inflammatory cytokines, growth factors and proteinases/proteinase inhibitors associated with wound healing and tissue repair.6 Understanding the mechanisms that impair wound healing has identified potential predictive, diagnostic and indicative biomarkers and determined their role in the wound healing cascade of events.7 These biomarkers present in the wound fluid, tissue specimens or serum have potential to grant predictive outcomes for personalized treatment, reveal the wound healing status and response to treatment, and facilitate a more informed clinical assessment.
Generally, a multi-omics approach to evaluating putative biomarkers associated with disease involves collecting biopsy samples from patients and transferring these to a laboratory for quantification using specialist techniques; for example, enzyme-linked immunosorbent assays (ELISAs)5 or liquid chromatography–mass spectrometry (LC–MS).8 This adds to lengthy analytical procedures as clinical samples have to be prepared in accordance with the assays employed. Classical ELISAs are sufficiently sensitive to determine up to 1 pg/mL for some protein biomarkers but they are laborious, costly and not suitable for point-of-care (POC) detection of multiple biomarkers. On the other hand, LC–MS has the capability to detect multiple biomarkers with very high sensitivity and specificity. However, it is time consuming, involves expensive equipment and hence is not feasible for POC analyses.
Incorporating sensors for clinically relevant indicators into wound dressings offers a convenient non-invasive technique to sample wounds directly, improving clinical measures and informing clinical decisions. This innovation will have a direct impact on patients, optimizing the clinical workflow and improving the management of individuals with chronic wounds. Through thoughtful design, sensors should simultaneously detect multiple biomarkers, be portable, flexible and compatible with dressings and, importantly, be cost-effective. If not cost-effective, there exists no incentive to adopt and use the technology. We therefore proposed coupling cellulose fibre (CF) substrates with surface enhanced Raman spectroscopy (SERS) to detect biomarkers known to be associated with impaired wound healing. SERS exploits the enhancement of Raman scattering by molecules physically or chemically adsorbed onto a substrate. This modality is highly sensitive and specific for chemical and bio-molecular detection as it produces unique vibrational spectra (“fingerprints”) for individual molecular species. A selection of SERS substrates have been fabricated with different structural morphologies, including electrochemically roughened electrodes,9–12 colloidal nanoparticle films,13,14 metal film nanospheres (MFON),15,16 metal islands,16–19 electrospinning nanofibrous,20–22 tunable SERS substrates,23–27 silicon-based nanogap and nanopillars,28–30 electron beam lithography regular plasmonic microarray and nanoholes.13,28,30
Silicon and glass28–31 are the classical SERS substrates as they yield low background signals and ensure that most analytes attach to the nanoparticles. However, silicon and glass are less than ideal for incorporation into wound dressings; they are fragile and rigid. Many studies have explored using alternative substrate supports, including CF-based paper substrates. CF is cheap, plentiful and readily recycled. Other advantages of using CF as a substrate include its natural hydrophilicity and its wicking ability that allows it to drive sample flow without external input. Further, plasmonic CF substrates can be made through various methods, such as soaking,32,33 inkjet printing,34 deposition35 and filtration,36 and in a variety of form factors such as microarrays,34 swabs and dipsticks.37
Cutaneous wound healing is characterized as a series of overlapping cascading events.38 Wounds in which any of these events are perturbed exhibit delayed healing and commonly remain “stuck” in the inflammatory phase. The pro-inflammatory cytokines tumor necrosis factor-α (TNF-α) and interleukin-1 (IL1-α and IL1-β) are elevated in patients with chronic wounds.39–43 High levels of activated MMP-2 and MMP-9 are also reported to be present in chronic wounds and hinder wound closure and healing.44,45 These data informed our selection of TNF-α, IL1-α, IL1-β and MMP-9 as candidate biomarkers to be incorporated in prototype CF-based SERS biosensors. In this paper, we developed a flexible, cost-effective, reliable, easy-to-fabricate plasmonic SERS substrate using flexible CF substrate. The plasmonic silver nanoparticles which are non-spherical in shape were optimized and decorated onto the CF substrates using dry deposition by sputtering method. The resultant affordable SERS platform was used to detect MMP-9, TNF-α, IL1-α and IL1-β in simulated wound fluids in the clinically relevant nM to pM range. We envision that these substrates after activation can be incorporated into wound dressings in future for the routine monitoring of wound biomarkers. This proof-of-concept study illustrates the potential application of SERS biosensors to predict the healing status of wounds and monitor healing trajectory in a non-invasive manner.
Materials and Methods
Materials and Chemicals
The following were purchased as indicated: (3-Aminopropyl)triethoxysilane (APTES) (Sigma Aldrich), 2-Iminothiolane hydrochloride (Traut’s reagent) (Sigma Aldrich), 1-Ethyl-3-(3-dimethylaminopropyl)carbodiimide (EDC) (Thermo Fisher Scientific), N-hydroxysuccinimide (NHS) (Thermo Fisher Scientific), 4-Aminothiophenol (4-ATP) (Sigma Aldrich), 2-naphthalenethiol (2-NT) (Sigma Aldrich), recombinant human TNF-α protein (TNF-α) (Abcam), Anti-TNF-α antibody (Anti-TNF-α) (Abcam), recombinant human MMP-9 protein (Abcam); Anti-MMP-9 antibody (Abcam), recombinant human IL1-α protein (Abcam), anti-IL1-α antibody (Abcam); recombinant human IL1-β protein (Abcam); rabbit polyclonal anti-IL1-β antibody (Abcam), Human MMP9 ELISA Kit - ab246539 (Abcam), bovine serum albumin (BSA) (Sigma Aldrich), ethanol (Merck) and phosphate buffered saline (PBS) (Lonza).
Preparation of CF Substrates
The preparation of CF substrates is illustrated in Figure 1A. APTES (300µL of 2%) in ethanol was added to a Whatman Grade 1, 2.5 cm diameter CF membrane filter (GE Healthcare Life Sciences) and left to dry for 5 min. The CF substrates were then washed with acetone, left to dry and sputter-coated with Ag (99.999% purity, JEOL) at 10–20 mA (JEOL, JFC-1600 Auto fine coater). The Ag metal layer was deposited at a rate of ~1 nm/s to achieve different metal thickness.16 The size of the particle is proportional to the duration of deposition. Here, we optimized the deposition condition to form a reproducible particle size of Ag nanoparticles on substrate.18 Following that, the CF substrates were washed twice with water and ethanol and dried in a desiccator for 1 h. SERS measurements were performed on the CF substrates to check for background signals and contamination. Only CF substrates with no evidence of contamination were used for biosensor measurements.
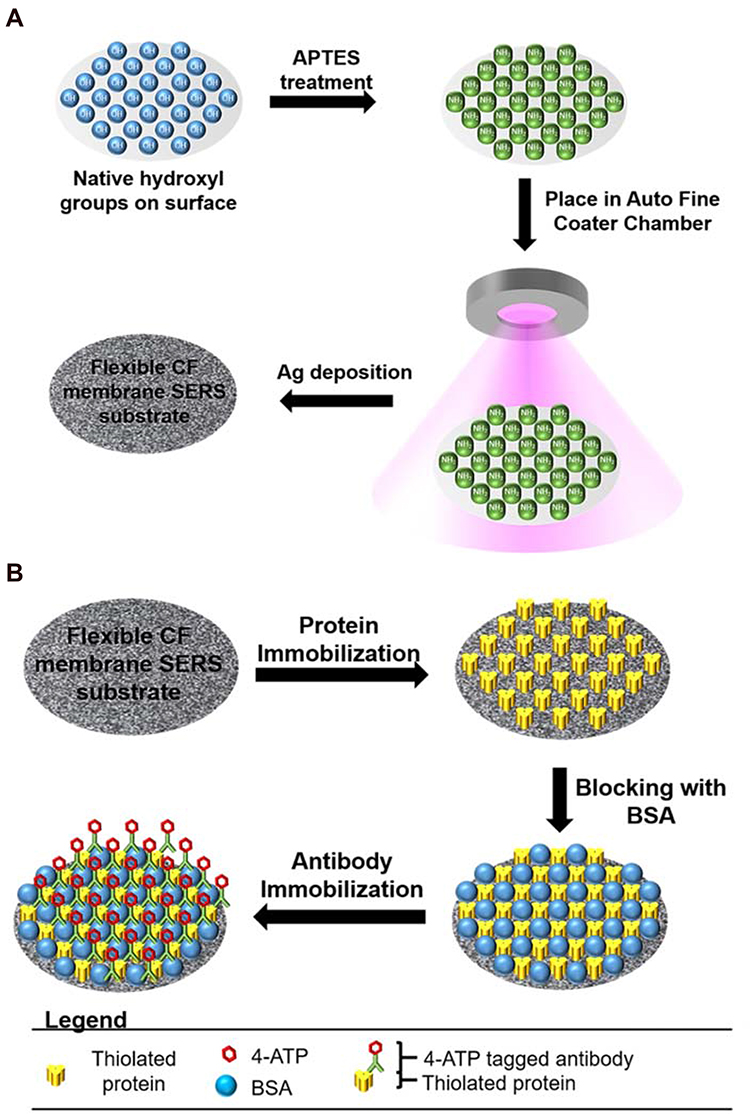 |
Figure 1 Schematic illustration showing (A) cellulose fibre SERS substrate fabrication and (B) treatment of cellulose fibre SERS for biomarker proteins sensing. |
Characterizations
A field emission scanning electron microscope (FE-SEM) from JEOL was used to image the SERS CF substrates. SERS measurements of samples were performed using a Renishaw InVia Raman upright microscope (Renishaw InVia, UK) with a 785 nm laser. This Raman system was integrated with a Leica microscope and the laser light was coupled through an objective lens (50 x, 0.75 N.A.), which was used to excite the sample and to collect the scattered Raman signal. Prominent Rayleigh scattering was blocked using a notch filter. The beam spot illuminating the sample was ~2 µm. Spectra (10) were acquired from more than 10 different spot areas on each sample. Each spectrum was integrated for 10 s, in the range of 700–1800 cm−1. Post-collection processing of the SERS spectra was performed using the WiRE™ v3.4 software associated with the instrument. The background subtraction was performed by cubic spline interpolation. The instrument was calibrated at 520 cm−1 from standard silicon.
Preparation of Modified Wound Biomarker Protein and Antibody
Commercially acquired preparations of MMP-9, TNF-α, IL1-α and IL1-β proteins and antibodies were used as received. 4-ATP and 2-NT were used as the Raman active molecules in this study to estimate the performance of the fabricated substrate. Representative SERS spectra of the Raman reporter molecules were shown in Figure S1. TNF-α protein (10 µg/mL, Abcam) was modified with 14 mM Traut’s reagent and filtered using an Ultra-0.5 Centrifugal Filter Unit (Amicon) to remove excess Traut’s reagent. EDC (400 µL of 50 mM) was added to 100 µL of 1 mg/mL anti-TNF-α solution and incubated for 5 min. NHS (400 µL of 10 mM) was then added to the mixture and left to incubate for 5 min. Next, 100 µL of 1 mM 4-ATP was added to the EDC-NHS anti-TNF-α solution and left to incubate for 30 mins. The solution was subsequently filtered to remove excess unreacted reagents and the resultant protein filtrate was reconstituted to 0.1 mg/mL anti-TNF-α modified with 4-ATP (anti-TNF-α-4-ATP).
Preparation of CF Substrate for Biomarker Sensing
The method of preparing CF substrates for SERS biomarker sensing is presented in Figure 1B. We employed protein modification via Traut’s reagent to minimize non-specific binding on the substrate surface that could be introduced with every incubation step, improving the experimental workflow. Traut’s reagent was used for the thiolation of primary amines of commercially acquired preparations of MMP-9, TNF-α, IL1-α and IL1-β proteins, introducing sulfhydryl groups while retaining the charge properties of the original amino group. Thiolated proteins were filtered to remove excess unreacted Traut’s reagent and serially diluted in PBS to yield final concentrations of 5 to 5000 ng/mL. These were used to establish the limit of detection of the CF substrates. Modified proteins of varying concentrations were immobilized onto Ag-coated CF substrates by incubation with thiolated protein solutions. Samples were washed thoroughly with PBS buffer to remove weakly immobilised and/or unbound thiolated proteins. Following the immobilisation of the thiolated proteins and PBS washing, the CF substrates were incubated in a solution of 0.5 mg/mL BSA solution to occupy non-specific binding sites on the CF substrate surface. Exposure to the corresponding MMP-9, TNF-α, IL1-α and IL1-β antibodies tagged with 4-ATP solution (Raman reporter) resulted in specific binding to thiolated MMP-9, TNF-α, IL1-α and IL1-β proteins, respectively, detected as 4-ATP SERS Raman spectra.
Results and Discussion
Design and Fabrication of Flexible CF Membrane Substrates
The fabrication process of the flexible CF SERS substrates is depicted in Figure 1A. Firstly, the CF-based membrane surface was washed with pure water (Milli-Q) followed by cleaning with ethanol and acetone to remove any residual organic impurities that may have adhered to the membrane and was then dried. In order to improve the adhesion of the metal nanoparticles onto the CF-based membrane surface, we attached the APTES linker molecules by means of self-assembled monolayer (SAM) onto the whole CF membrane surface. This was achieved by conjugating the hydroxyl functional group present in the CF membrane surface with that of the ethoxy group present in APTES. The presence of free amine group on APTES binds the Ag nanoparticles strongly to the CF membrane substrate during the sputtering stage. In our current method, we have used a novel sputtering technique to decorate single layer nanoparticles uniformly on the whole area of the substrate surface. Prior to using the SERS substrate, unbound and loosely bound Ag nanoparticles were removed by repeatedly washing the CF membrane surface, to ensure reliable and robust CF-based SERS substrates.
FE-SEM Characterization of Flexible CF Membrane Substrate
The microstructure of the CF-based substrates resulting from varying the Ag deposition conditions, including the current and deposition time, was investigated using FE-SEM. Figure S2 shows a multilayer morphology of Ag particles for the substrate prepared at 10 mA with deposition times varying from 30 to 80 seconds. It was observed that the distribution of the Ag particles became increasingly disordered with longer sputter-coating times. Similarly, Figure 2 depicts the morphology of the Ag deposition at 20 mA with deposition times varying from 20 to 80 seconds. Increasing the sputtering current increased the deposition rate of the Ag16 and coincidently prevented the aggregation of Ag particles before deposition, suggested by the increased Ag layer thickness with longer deposition times without evidence for more Ag aggregates. To obtain high Raman signal enhancement, the gap between Ag nanoparticles should be less than 50 nm, as the smaller the gap, the larger the SERS enhancement.18 We observed that, as the thickness of the Ag layer increased, the gap between nanoparticles decreased, up to 60 seconds of Ag deposition. With longer deposition time, it was evident that nanoparticles fused together, resulting in weaker electromagnetic fields and loss of plasmonic properties.16–19
 |
Figure 2 SEM images showing the surface morphology of Ag-coated cellulose fibre substrates at 20 mA with various deposition times: (A) 20 s; (B) 30 s; (C) 40 s; (D) 50 s; (E) 60 s; (F) 80; scale bar (in white) is 200 nm and scale bar (in black) is 100 nm. |
Evaluating Performance of Flexible CF Membrane Substrate with 2-NT Raman Probe
CF membranes decorated with varying thicknesses of Ag nanoparticles were tested with the Raman active molecule 2-NT to optimize fabrication of the CF-based SERS substrate. Figure S1B reports a representative 2-NT SERS spectra. The SERS properties of this Raman probe were studied under 785 nm laser excitation: the characteristic SERS band for 2-NT is evident at 1066 cm−1, annotated with an arrow. Figure 3A demonstrates that increasing the duration of Ag deposition coincidently increases SERS enhancement; however, this correlation was only observed in samples with Ag layers with thicknesses up to approximately 60 nm. The rate of deposition of Ag was calculated to be approximately 1 nm/S.16 When the duration of Ag deposition is increased beyond 60 seconds, SERS enhancement is weakened, corresponding with nanoparticles fusing and losing optimal spatial distancing.18 To characterize the Ag-coating uniformity, SERS measurements were acquired across different regions of the substrate (Figure 3B). The overall variation of measures was found to be less than 5% and within the acceptable range. We interpret this as indicating that the Ag nanoparticles were uniformly decorated around the CF. In Figure S3, the SERS intensity of 2-NT illustrates the variable thickness of Ag particle deposition obtained with 10 mA current. When the Ag deposition was performed using 10 mA current, we found that the maximum SERS enhancement was lower than that obtained using 20 mA current for Ag deposition. We interpret this as indicating Ag nanoparticles deposited at 10 mA aggregate and attenuated SERS signals. Among the substrates tested, CF-based substrates sputtered at 20 mA for 60 seconds yielded the highest 2-NT SERS signal intensity, at 1066 cm−1. Thus, depositing Ag onto CF membranes at 20 mA for 60 seconds was selected as the optimal condition for sputter-coating.
 |
Figure 3 Evaluation of substrate performance. (A) Plot shows that the maximum SERS signal enhancement was obtained for the cellulose fibre SERS substrate with approximately 60 nm Ag film thickness; (B) Plot shows the uniformity of the substrate signal enhancement across the substrate. |
We also performed SERS mapping on the above selected substrate to acquire large area scanning to demonstrate the uniformity of signal enhancement along the CF membrane fibres. For this, we scanned the substrate surface to obtain the 2-NT signal intensity at 1066 cm−1 using the 5x magnification objective lens. Figure S4 shows the optical image of the substrate surface with overlaid SERS signal in spatial red heat map. The bright red color corresponds to high SERS enhancement region while black color corresponds to weak or no SERS enhancement region due to absence of nanostructures in the SERS heat map. As shown in Figure S4, we observed uniform SERS signal for 2-NT on the membrane surface along the length of the CF fibres while poor or no SERS signal between the intertwining CF fibres was detected. This demonstrates the uniformity of the CF membrane, making it a potentially good candidate as a novel flexible SERS substrate.
Detection of MMP-9, TNF-α, IL1-α and IL1-β with CF-Based SERS Substrates
We tested selected proteases and interleukins associated with the wound healing response using a modified immunoassay method on the newly fabricated CF-based SERS substrate. The design brief was to use the CF-based SERS substrate to characterize wound exudates via 4-ATP as the Raman probe conjugated to anti-MMP-9 and -TNF-α immunoglobulins. Figure 4 depicts the relationship between analyte concentration (pg to µg/mL range) and intensity of the SERS signal at the 1078 cm−1 peak, corresponding to the Raman probe 4-ATP for each analyte. We tested SERS sensitivity to MMP-9 over concentrations from 10 ng/mL to 5000 ng/mL. The calibration plot was observed to exhibit concentration dependent linear correlation for MMP-9 only up to 500 ng/mL, with an R2 value of 0.952, beyond which no linear correlation was observed. In the case of TNF-α, on the other hand, we tested a lower concentration range: 5 to 100 ng/mL. The resultant calibration plot yielded a non-linear correlation over the whole concentration range with an R2 value of 0.988. Measured results for the cytokines IL1-α and IL1-β are reported in Figure S5. These data demonstrate that we achieved detection of these target protein species with our flexible CF SERS substrates within the biologically relevant, sub-ng/mL concentration range. Notably, the CF SERS detection of the target bioanalytes is more sensitive than data reported for an equivalent nano-mechanical sensor, and for traditional sandwich immunoassays.46–48 The levels of IL-1 and TNF-α reported in healing wounds are ∼1 ng/mL; in chronic wounds, these levels commonly reach 50 and 15 ng/mL, respectively.20,49,50 The wide detection range of the CF SERS substrates is advantageous for determining trace levels of biomarker targets in the wound environment during healing. We did not explore the capacity of the CF SERS substrates to report concentrations beyond this range, but we suggest that further substrate surface functionalization will expand the range of detection. The maximum detectable concentration range of conventional ELISA is less than our functionalized CF-based SERS substrate. From a manufacturing and reproducibility perspective, the performance of the CF-based substrates was found to be relatively uniform across the entire active substrate surface. The notable sensitivity of the proposed approach may be attributed to these characteristics: (1) the Ag layer structure allows decoration of ATP binding sites, thus enhancing detection performance significantly; (2) the deposition of Ag nanoparticles greatly enlarges the active surface area available in the sensor, ensuring it effectively captures higher concentrations of the target biomarker. We have established a reliable and scalable method to manufacture flexible plasmonic substrates using CF.
 |
Figure 4 Calibration plots of (A) MMP-9 and (B) TNF-α biomarkers, respectively (black circle data points). Red square data points indicate the detection of indicated spiked concentrations of (A) MMP-9 and (B) TNF-α biomarkers from the simulated serum samples using respective calibration plots. |
Detection of Spiked Concentrations of TNF-α and MMP-9 Proteins
To validate the specificity and efficiency of detecting the target biomarkers in complex biological fluids, we performed a proof-of-concept study in which we spiked the analyte of interest into samples containing serum albumin (BSA) and other plasma-derived species to imitate the actual biological condition. In order to achieve this, we spiked MMP-9 and TNF-α proteins into a solution of 0.5 mg/mL BSA in phosphate buffered saline, pH 7.4. In order to simulate serum, the proteins in the resultant spiked solutions were then thiolated using Traut’s reagent. To study the feasibility of our CF-based SERS platform in real applications, sample vials spiked with MMP-9 and TNF-α together were prepared with desired analyte concentrations (25, 125 and 1000 ng/mL and 5, 25 and 50 ng/mL, respectively) using the above mentioned method. Figure 4A and B illustrate the detection of spiked concentrations of MMP-9 and TNF-α biomarkers (red square points), respectively, by interpolating the detected concentrations of the analytes from the respective SERS calibration plot obtained at 1078 cm−1. In the case of MMP-9, we obtained an accuracy of more than 95% for lower concentrations of 25 and 125 ng/mL, due to the linear range of the calibration plot up to ~500 ng/mL (Figure 4A). Beyond this concentration range, the calibration plot was no longer linear, resulting in a reduction in accuracy of the SERS sensor to 90.9% for concentrations above 500 ng/mL. Hence, the optimal concentration ranges in which the CF-based SERS membrane biosensor exhibits highest accuracy is from 5–500 ng/mL. Similarly, in the case of the TNF-α biomarker, linear correlation in the calibration plot was observed from the concentration range of 5 to 25 ng/mL, after which the specificity of the sensitivity of the substrate decreased to 75% at concentrations of 50 ng/mL (Figure 4B). Therefore, solutions with biomarker concentrations beyond 50 ng/mL warrant further dilution to detect with high accuracy. As shown in Table 1, recoveries of MMP-9 in spiked samples range from 90 to 97% with a relative standard deviation of <6.2%, while those of TNF-α vary from 75 to 102% with a relative standard deviation of <11.2%. This suggests that the recovery of MMP-9 is more efficient compared to that of TNF-α protein. This could be ascribed to the better correlation of SERS intensity obtained with a large range of concentrations for MMP-9 ie, R2 values closer to 1 whereas in the case of TNF-α, the saturation phase of the calibration plot had not been achieved.
 |
Table 1 Recovery Studies of MMP-9 and TNF-α in Spiked Samples |
Conclusions
We exploited the surface geometry characteristics of cellulose fibres to fabricate CF-based SERS substrates by depositing Ag particles onto chromatography CF substrates, and used the resulting functionalized CF to detect and quantitate protein biomarkers present in wound fluids, namely, MMP-9, TNF-α, IL1-α and IL1-β. CF substrates offer several advantages over existing substrates, being flexible, economical, easy to use, and with uncomplicated analyte uptake (self-wicking). These properties are ideal to facilitate CF sensors being incorporated into existing wound dressing materials and formats. The sensing strategy of our CF membrane substrate as SERS sensors is based on the strong adsorption of plasmonic metal layers onto the CF surface. We have reported on the methodology of fabrication and optimization of CF substrates for SERS enhancement, optimization of Ag deposition variables and stabilization of the Ag coating with ATPES. The exemplar sensor prototype demonstrates linear responses within biologically relevant concentrations, ranging from 10 to 500 ng/mL for MMP-9, and in the case of TNF-α, linear responses for the range of 5 to 25 ng/mL. In addition, we also demonstrated a different range of linear responses for IL1-α and IL1-β. By achieving the highest detection point of sub-µg/mL for these biomarker proteins, our present flexible CF SERS substrate reveals the effectiveness, specificity and high sensitivity required to detect and measure clinically relevant changes in critical biomarkers evident in the wound environment. The prototype SERS sensor we describe possesses considerable promise for permitting non-invasive monitoring of chronic wounds, adding to the armamentarium of much needed clinical decision-making tools.
Acknowledgments
The research was partially supported through grant funding from the Agency for Science, Technology and Research (A*STAR) under its Industry Alignment Fund–Pre-Positioning Programme (IAF-PP), grant number H1701a00H9, as part of Wound Care Innovation for the Tropics (WCIT) Programme. This work was also funded by intramural funding from the Bio-Medical Research Council of Agency for Science, Technology and Research (A*STAR).
Disclosure
The authors declare that they have no known competing financial interests that could have appeared to influence the work reported in this paper.
References
1. Falanga V. Wound healing and its impairment in the diabetic foot. Lancet. 2005;366(9498):1736–1743. doi:10.1016/S0140-6736(05)67700-8
2. Moore K. Using wound area measurement to predict and monitor response to treatment of chronic wounds. J Wound Care. 2005;14(5):229–232.
3. Moore K, McCallion R, Searle RJ, Stacey MC, Harding KG. Prediction and monitoring the therapeutic response of chronic dermal wounds. Int Wound J. 2006;3(2):89–98.
4. Sheehan P, Jones P, Caselli A, Giurini JM, Veves A. Percent change in wound area of diabetic foot ulcers over a 4-week period is a robust predictor of complete healing in a 12-week prospective trial. Diabetes Care. 2003;26(6):1879–1882.
5. Stacey MC, Phillips SA, Farrokhyar F, Swaine JM. Evaluation of wound fluid biomarkers to determine healing in adults with venous leg ulcers: a prospective study. Wound Repair Regen. 2019.
6. Societies WUoWH. Principles of Best Practice: Diagnostics and Wounds. A Consensus Document. London: MEP Ltd; 2008.
7. Eming SA, Koch M, Krieger A, et al. Differential proteomic analysis distinguishes tissue repair biomarker signatures in wound exudates obtained from normal healing and chronic wounds. J Proteome Res. 2010;9(9):4758–4766.
8. Wyffels JT, Fries KM, Randall JS, et al. Analysis of pressure ulcer wound fluid using two‐dimensional electrophoresis. Int Wound J. 2010;7(4):236–248.
9. Albrecht M, Creighton J, Blatchford C. Plasma resonance enhancement of Raman scattering by pyridine adsorbed on silver or gold sol particles of size comparable to the excitation wavelength. J Am Chem Soc. 1977;99:5215–5217.
10. Creighton JA, Blatchford CG, Albrecht MG. Plasma resonance enhancement of Raman scattering by pyridine adsorbed on silver or gold sol particles of size comparable to the excitation wavelength. J Chem Soc, Faraday Trans. 1979;75:790–798. doi:10.1039/f29797500790
11. Fleischmann M, Hendra PJ, McQuillan AJ. Raman spectra of pyridine adsorbed at a silver electrode. Chem Phys Lett. 1974;26(2):163–166. doi:10.1016/0009-2614(74)85388-1
12. Jeanmaire DL, Van Duyne RP. Surface Raman spectroelectrochemistry: part I. Heterocyclic, aromatic, and aliphatic amines adsorbed on the anodized silver electrode. J Electroanal Chem Interf Electrochem. 1977;84(1):1–20. doi:10.1016/S0022-0728(77)80224-6
13. Betz JF, Yu WW, Cheng Y, White IM, Rubloff GW. Simple SERS substrates: powerful, portable, and full of potential. PCCP. 2014;16(6):2224–2239.
14. Chen C, Burstein E, Lundquist S. Giant Raman scattering by pyridine and CN− adsorbed on silver. In: Inelastic Light Scattering. Elsevier. 1980;63–66.
15. Dick LA, McFarland AD, Haynes CL, Van Duyne RP. Metal film over nanosphere (MFON) electrodes for surface-enhanced Raman spectroscopy (SERS): improvements in surface nanostructure stability and suppression of irreversible loss. J Phys Chem B. 2002;106(4):853–860.
16. Fu CY, Kho KW, Dinish US, Koh ZY, Malini O. Enhancement in SERS intensity with hierarchical nanostructures by bimetallic deposition approach. J Raman Spectrosc. 2012;43(8):977–985.
17. Chen C, Burstein E. Giant Raman scattering by molecules at metal-island films. Phys Rev Lett. 1980;45(15):1287.
18. Perumal J, Kong KV, Dinish US, Bakker RM, Olivo M. Design and fabrication of random silver films as substrate for SERS based nano-stress sensing of proteins. RSC Adv. 2014;4(25):12995–13000.
19. Weitz D, Garoff S, Gramila T. Excitation spectra of surface-enhanced Raman scattering on silver-island films. Opt Lett. 1982;7(4):168–170.
20. Wallace HJ, Stacey MC. Levels of tumor necrosis factor-α (TNF-α) and soluble TNF receptors in chronic venous leg ulcers–correlations to healing status. J Invest Dermatol. 1998;110(3):292–296.
21. Yang Y, Zhang Z, He Y, Wang Z, Zhao Y, Sun L. Fabrication of Ag@ TiO2 electrospinning nanofibrous felts as SERS substrate for direct and sensitive bacterial detection. Sens Actuators B Chem. 2018;273:600–609.
22. Yang Y, Zhang Z, Wan M, Wang Z, Zhao Y, Sun L. Highly sensitive surface-enhanced Raman Spectroscopy Substrates of Ag@ PAN electrospinning nanofibrous membranes for direct detection of bacteria. ACS Omega. 2020;5(31):19834–19843.
23. Li C, Xu S, Yu J, et al. Local hot charge density regulation: vibration-free pyroelectric nanogenerator for effectively enhancing catalysis and in-situ surface enhanced Raman scattering monitoring. Nano Energy. 2021;81:105585.
24. Wan M, Zhao H, Wang Z, Zhao Y, Sun L. Preparation of Ag@ PDA@ SiO2 electrospinning nanofibrous membranes for direct bacteria SERS detection and antimicrobial activities. Mater Res Express. 2020;7(9):095012.
25. Yu J, Yang M, Li Z, et al. Hierarchical particle-in-quasicavity architecture for ultratrace in situ Raman sensing and its application in real-time monitoring of toxic pollutants. Anal Chem. 2020;92(21):14754–14761.
26. Zhang C, Li C, Yu J, et al. SERS activated platform with three-dimensional hot spots and tunable nanometer gap. Sens Actuators B Chem. 2018;258:163–171.
27. Zhao X, Liu C, Yu J, et al. Hydrophobic multiscale cavities for high-performance and self-cleaning surface-enhanced Raman spectroscopy (SERS) sensing. Nanophotonics. 2020;9(16):4761–4773.
28. Dinish US, Yaw FC, Agarwal A, Olivo M. Development of highly reproducible nanogap SERS substrates: comparative performance analysis and its application for glucose sensing. Biosens Bioelectron. 2011;26(5):1987–1992.
29. Perumal J, Dinish US, Bendt AK, et al. Identification of mycolic acid forms using surface-enhanced Raman scattering as a fast detection method for tuberculosis. Int J Nanomedicine. 2018;13:6029.
30. Perumal J, Gong T, Dinish US, et al. Development of optimized nanogap plasmonic substrate for improved SERS enhancement. AIP Adv. 2017;7(5):055017.
31. Abu Hatab NA, Oran JM, Sepaniak MJ. Surface-enhanced Raman spectroscopy substrates created via electron beam lithography and nanotransfer printing. ACS Nano. 2008;2(2):377–385.
32. Lee CH, Hankus ME, Tian L, Pellegrino PM, Singamaneni S. Highly sensitive surface enhanced Raman scattering substrates based on filter paper loaded with plasmonic nanostructures. Anal Chem. 2011;83(23):8953–8958.
33. Ngo YH, Li D, Simon GP, Garnier G. Effect of cationic polyacrylamides on the aggregation and SERS performance of gold nanoparticles-treated paper. J Colloid Interface Sci. 2013;392:237–246.
34. Yu WW, White IM. Inkjet printed surface enhanced Raman spectroscopy array on cellulose paper. Anal Chem. 2010;82(23):9626–9630.
35. Niu Z, Surface-enhanced FY. Raman scattering of single-walled carbon nanotubes on silver-coated and gold-coated filter paper. J Colloid Interface Sci. 2006;303(1):224–228.
36. Yu WW, White IM. A simple filter-based approach to surface enhanced Raman spectroscopy for trace chemical detection. Analyst. 2012;137(5):1168–1173.
37. Yu WW, White IM. Inkjet-printed paper-based SERS dipsticks and swabs for trace chemical detection. Analyst. 2013;138(4):1020–1025.
38. Jones V, Grey JE, Harding KG. Wound dressings. BMJ. 2006;332(7544):777–780.
39. Ashcroft GS, Jeong MJ, Ashworth JJ, et al. Tumor necrosis factor‐alpha (TNF‐α) is a therapeutic target for impaired cutaneous wound healing. Wound Repair Regen. 2012;20(1):38–49.
40. Barone EJ, Yager DR, Pozez AL, et al. Interleukin-1alpha and collagenase activity are elevated in chronic wounds. Plast Reconstr Surg. 1998;102(4):
41. Mirza RE, Fang MM, Ennis WJ, Koh TJ. Blocking interleukin-1β induces a healing-associated wound macrophage phenotype and improves healing in type 2 diabetes. Diabetes. 2013;62(7):2579–2587.
42. Piaggesi A, Viacava P, Rizzo L, et al. Semiquantitative analysis of the histopathological features of the neuropathic foot ulcer: effects of pressure relief. Diabetes Care. 2003;26(11):3123–3128.
43. Trengove NJ, Bielefeldt‐Ohmann H, Stacey MC. Mitogenic activity and cytokine levels in non‐healing and healing chronic leg ulcers. Wound Repair Regen. 2000;8(1):13–25.
44. Lobmann R, Ambrosch A, Schultz G, Waldmann K, Schiweck S, Lehnert H. Expression of matrix-metalloproteinases and their inhibitors in the wounds of diabetic and non-diabetic patients. Diabetologia. 2002;45(7):1011–1016.
45. Wysocki AB, Staiano-Coico L, Grinnell F. Wound fluid from chronic leg ulcers contains elevated levels of metalloproteinases MMP-2 and MMP-9. J Invest Dermatol. 1993;101(1):64–68.
46. Guerrini L, Pazos E, Penas C, Vázquez ME, Mascareñas JL, Alvarez-Puebla RA. Highly sensitive SERS quantification of the oncogenic protein c-Jun in cellular extracts. J Am Chem Soc. 2013;135(28):10314–10317.
47. Kho KW, Dinish US, Kumar A, Olivo M. Frequency shifts in SERS for biosensing. ACS Nano. 2012;6(6):4892–4902.
48. Vavassori S, Kumar A, Wan GS, et al. Butyrophilin 3A1 binds phosphorylated antigens and stimulates human γδ T cells. Nat Immunol. 2013;14(9):908.
49. Battaglia TM, Masson J-F, Sierks MR, et al. Quantification of cytokines involved in wound healing using surface plasmon resonance. Anal Chem. 2005;77(21):7016–7023.
50. Liu Y, Min D, Bolton T, et al. Increased matrix metalloproteinase-9 predicts poor wound healing in diabetic foot ulcers. Diabetes Care. 2009;32(1):117–119.
 © 2021 The Author(s). This work is published and licensed by Dove Medical Press Limited. The
full terms of this license are available at https://www.dovepress.com/terms
and incorporate the Creative Commons Attribution
- Non Commercial (unported, 3.0) License.
By accessing the work you hereby accept the Terms. Non-commercial uses of the work are permitted
without any further permission from Dove Medical Press Limited, provided the work is properly
attributed. For permission for commercial use of this work, please see paragraphs 4.2 and 5 of our Terms.
© 2021 The Author(s). This work is published and licensed by Dove Medical Press Limited. The
full terms of this license are available at https://www.dovepress.com/terms
and incorporate the Creative Commons Attribution
- Non Commercial (unported, 3.0) License.
By accessing the work you hereby accept the Terms. Non-commercial uses of the work are permitted
without any further permission from Dove Medical Press Limited, provided the work is properly
attributed. For permission for commercial use of this work, please see paragraphs 4.2 and 5 of our Terms.