")
Back to Journals » Journal of Inflammation Research » Volume 15
Nonlinear Relationship Between Chinese Visceral Adiposity Index and New-Onset Myocardial Infarction in Patients with Hypertension and Obstructive Sleep Apnoea: Insights from a Cohort Study
Authors Cai X , Li N , Hu J, Wen W , Yao X, Zhu Q, Heizhati M, Hong J, Sun L, Tuerxun G, Zhang D, Luo Q
Received 17 December 2021
Accepted for publication 15 January 2022
Published 2 February 2022 Volume 2022:15 Pages 687—700
DOI https://doi.org/10.2147/JIR.S351238
Checked for plagiarism Yes
Review by Single anonymous peer review
Peer reviewer comments 2
Editor who approved publication: Professor Ning Quan
Xintian Cai,1,2 Nanfang Li,1 Junli Hu,1 Wen Wen,1,2 Xiaoguang Yao,1 Qing Zhu,1,2 Mulalibieke Heizhati,1 Jing Hong,1 Le Sun,1 Guzailinuer Tuerxun,1 Delian Zhang,1 Qin Luo1
1Hypertension Center of People’s Hospital of Xinjiang Uygur Autonomous Region, Xinjiang Hypertension Institute, National Health Committee Key Laboratory of Hypertension Clinical Research, Key Laboratory of Xinjiang Uygur Autonomous Region, Xinjiang Clinical Medical Research Center for Hypertension Diseases, Urumqi, Xinjiang, People’s Republic of China; 2Graduate School, Xinjiang Medical University, Urumqi, Xinjiang, People’s Republic of China
Correspondence: Nanfang Li
Hypertension Center of People’s Hospital of Xinjiang Uygur Autonomous Region, Xinjiang Hypertension Institute, National Health Committee Key Laboratory of Hypertension Clinical Research, Key Laboratory of Xinjiang Uygur Autonomous Region, Xinjiang Clinical Medical Research Center for Hypertension Diseases, Urumqi, Xinjiang, People’s Republic of China
, Email [email protected]
Purpose: We aimed to investigate the relationship between the Chinese visceral adiposity index (CVAI) and the risk of new-onset myocardial infarction (MI) in patients with hypertension and obstructive sleep apnoea (OSA) and to inspect possible modifiers of the effect.
Methods: The Cox regression model was used to evaluate the relationship between baseline CVAI and risk of new-onset MI. A generalized additive model was used to identify the nonlinear relationship. Besides, we conducted subgroup analyses and interaction tests.
Results: A total of 2177 patients with hypertension and OSA undergoing polysomnography were enrolled in this study. During a median follow-up period of 87 months, 82 participants developed new-onset MI. Overall, CVAI was positively related to the risk of new-onset MI (per 1 SD increase; HR = 1.54, 95% CI: 1.28– 1.85). In multivariable-adjusted models, the risk of new-onset MI increased with quartiles of CVAI, with an HR of 3.64 (95% CI: 1.94– 6.83) for quartile 4 compared with quartile 1. The generalized additive model and smoothed curve fit revealed a nonlinear relationship between CVAI and risk of new-onset MI with an inflection point of approximately 112. None of the stratification variables had a significant effect on the relationship between CVAI and new-onset MI. Similar outcomes were observed in the sensitivity analysis. The addition of CVAI significantly improved reclassification and discrimination over the conventional model, with a category-free NRI of 0.132 (95% CI 0.021 to 0.236, P = 0.021) and an IDI of 0.012 (95% CI 0.005 to 0.023, P < 0.001).
Conclusion: This study demonstrated a nonlinear relationship between CVAI and the risk of new-onset MI in patients with hypertension and OSA. Higher CVAI was significantly associated with the risk of new-onset MI when CVAI was ≥ 112.
Keywords: Chinese visceral adiposity index, myocardial infarction, hypertension, obstructive sleep apnoea, cohort study
Introduction
Cardiovascular disease (CVD) is a leading cause of morbidity and mortality worldwide and has become a worldwide public health problem.1,2 Myocardial infarction (MI) is one of the common conditions of CVD and remains the leading cause of cardiovascular mortality despite advances in treatment techniques and prevention strategies in recent decades.3–5 Therefore, prevention of MI by understanding and reducing risk factors is of major importance for clinical practice and public health.6,7 Numerous studies have demonstrated that hypertension is considered to be one of the important risk factors for CVD.8 Obstructive sleep apnea (OSA), a sleep-related breathing disorder, is another major independent risk factor for CVD.9 Several studies have reported that the coexistence of OSA and hypertension further increases the risk of new cardiovascular events.10,11
Obesity has long been recognized as a distinct risk factor for the development of CVD.12 Visceral obesity is considered to be a more prominent risk factor for CVD than subcutaneous fat.13,14 Although several imaging methods, including computed tomography, magnetic resonance imaging, dual-energy X-ray absorptiometry, and dual bioelectricity impedance analysis, can be used to accurately assess the fat distribution and quantify visceral fat.15,16 However, the use of image-based visceral fat assessment is largely limited and unsuitable for routine clinical practice in the general population due to its higher cost, associated technical challenges, and radiation exposure.15,17 The visceral adiposity index (VAI) is an easily measured index to assess visceral fat distribution and dysfunction.18,19 In recent years VAI has been widely used to predict the risk of several diseases, such as CVD, diabetes, and hyperuricemia.19–22 These studies have simultaneously validated the reliability of VAI scores. However, the VAI has limitations when applied to non-Caucasian populations owing to the considerable variation in VAI across populations and ethnicities.23 Due to unhealthy sedentary lifestyles and ethnic differences, the Chinese have more visceral fat accumulation and less obesity compared to Caucasian populations.24 As a novel and easy-to-use index, the Chinese visceral adiposity index (CVAI) is a new index developed to assess visceral obesity in the Chinese population, combining body mass index (BMI), age, waist circumference (WC), high-density lipoprotein cholesterol (HDL-C) and triglyceride (TG) levels in its calculation.25 A considerable body of literature has demonstrated that CVAI is a reliable marker for predicting CVD, diabetes, and metabolic syndrome in the Chinese population.26–28
However, few studies have evaluated the association between CVAI and new-onset MI, especially in patients with hypertension and OSA. Therefore, the purpose of this study was to explore the association between CVAI and the risk of new-onset MI in patients with hypertension and OSA and to further investigate whether there is a nonlinear relationship between CVAI and new-onset MI.
Materials and Methods
Study Population
Urumqi Research on Sleep Apnea and Hypertension (UROSAH) was conducted in Hypertension Center of People’s Hospital of Xinjiang Uygur Autonomous Region, a provincial tertiary hospital, which mainly provides assessment and individualized treatment of hypertension, as well as identification of secondary hypertension.29 UROSAH is a single-center retrospective cohort study to assess the association of OSA with long-term cardiovascular outcomes in patients with hypertension. A review of hypertensive patients who visited the hypertension center between January 2011 and December 2013 was conducted. UROSAH inclusion criteria were as follows: hypertensive patients with suspected OSA. Exclusion criteria for UROSAH were as follows: 1. Patients with acute severe cardiovascular and cerebrovascular diseases in recent 3 months; 2. Patients with acute asthma, chronic obstructive pulmonary disease, interstitial lung disease, pulmonary tuberculosis, and other respiratory diseases; 3. Patients who are currently using steroids, bronchodilators, and antihistamines; 4. Patients with a malignant tumor, acute infection, and autoimmune diseases; 5. Renal and renal vascular hypertension, pheochromocytoma, aldosterone adenoma, Cushing’s syndrome, and other common secondary hypertension patients; 6. Patients failed sleep study (patients without adequate and satisfactory signal recording). A total of 3605 consecutive hypertensive patients with suspected OSA admitted to the hypertension center of the People’s Hospital of Xinjiang Uygur Autonomous Region were recruited. In this sub-study, we further excluded: 1. Participants who were lost to follow-up; 2. After polysomnography (PSG), the apnea hypopnea index (AHI) was < 5 events/hour; 3. A history of MI at baseline; 4. Missing values for baseline BMI, WC, TG, and HDL-C were present. Eventually, 2177 patients comprised the study population. The patient recruitment flow diagram is illustrated in Figure 1.
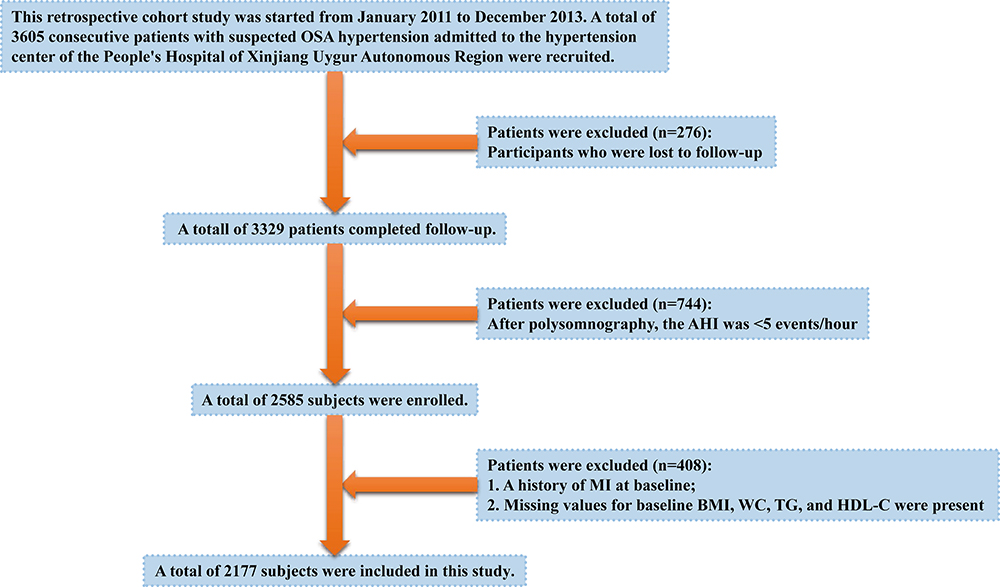 |
Figure 1 Participant flow diagram. |
Ethical Approval
The research was authorized by the Medical Ethics Committee of the People’s Hospital of Xinjiang Uygur Autonomous Region (No. 2019030662) and was conducted in strict compliance with the ethical standards set forth in the Declaration of Helsinki and its subsequent amendments. Written informed consent was submitted by all patients or their legal relatives participating in this study.
Baseline Examination
All participants completed a baseline examination between 2011 and 2013. Anthropometric measurements were taken by trained nurses. Data for height, weight, and WC were acquired following a protocol standardized to an accuracy of 0.1kg and 0.1cm, respectively. During the measurements, participants were asked to wear light clothing, no hats, and no shoes. At the end of normal expiration, WC was measured from the midpoint between the lower ribs and the upper edge of the iliac crest to the nearest 0.1cm. BMI was calculated as weight divided by the square of height (kg/m2). Baseline blood pressure was measured using a mercury sphygmomanometer after the patient had rested quietly for at least 10 minutes, and the average of multiple measurements was taken as the systolic and diastolic blood pressure values. All participants were required not to take caffeine, alcohol, or sedative-hypnotic drugs on the day of the sleep study. All subjects were monitored with PSG (Compumedics, Australia) throughout the entire night. The PSG procedures have all been consistent with previously published studies.30 PSG evaluation included monitoring airflow with nasal pressure and/or thermocouples, respiratory effort with piezoelectric bands at abdominal and chest locations, oxygen saturation measurement with pulse oximetry, surface electrodes connected with standard techniques to obtain chin electromyography, and electrooculography.31 All data were scored by sleep technologists licensed by the American Academy of Sleep Medicine and AHI, mean oxygen saturation (SaO2) during sleep, and lowest oxygen saturation during sleep were also calculated for each patient. AHI is defined as the total number of hypopneas and apneas that occur per hour of sleep.32 Smoking and drinking habits were categorized as never, past, and current.
Laboratory Assays
On the morning of the investigation, blood samples were taken after an all-night fast and analyzed shortly after sampling. Prior to blood collection, subjects were requested to avoid smoking, alcohol, caffeine, and strenuous activity for 8 hours. The levels of fasting plasma glucose (FPG), total cholesterol (TC), HDL-C, low-density lipoprotein (LDL-C), TG, high-sensitivity C-reactive protein (hs-CRP), homocysteine (Hcy), and creatinine (Cr) were measured by a fully automated biochemical analyzer (Hitachi 7600-020/ISE; Hitachi, Tokyo, Japan). The estimated glomerular filtration rate (eGFR) was computed by applying the equation of the Chronic Kidney Disease Epidemiology Collaborative Group.33
Definitions
Hypertension was defined as an SBP ≥140 mmHg or DBP ≥90 mmHg, or the use of any antihypertensive medication. Diabetes was defined as fasting glucose ≥7.0 mmol/L, use of any glucose-lowering medication, or self-reported history of diabetes. OSA was defined as AHI ≥5. In addition, the severity of OSA was defined as mild OSA (5 ≤ AHI < 15), moderate OSA (15 ≤ AHI < 30), and severe OSA (AHI ≥30).34 For the purposes of this study, CPAP adherence was categorized as regular treatment and non-treatment. Regular CPAP treatment was defined as average treatment ≥4 hours/ night for >70% of the entire follow-up period, or on average of ≥4 hours per night (CPAP devices only provide cumulative hours of use).35,36 The CVAI was determined by gender-specific equations and calculated using the following formulas: Males: 267.93 + 0.68 * age + 0.03 * BMI (kg/m2) + 4.00 * WC (cm) + 22.00 * Log10TG (mmol/L) - 16.32 * HDL-C (mmol/L); Females: 187.32 + 1.71 * age + 4.23 * BMI (kg/m2) + 1.12 * WC (cm) + 39.76 * Log10TG (mmol/L) - 11.66 * HDL-C (mmol/L).37
Follow-Up and Outcomes
During a median follow-up period of 87 months (IQR, 76–99), follow-up data were obtained by reviewing patients’ medical records, outpatient clinical visits, or by contacting participants by telephone with trained personnel. 276 of the 3605 participants were missed during follow-up, and all of the remaining 3329 patients had at least one follow-up assessment. Upon entry into this cohort, subjects were followed up for the first occurrence of MI (both fatal and non-fatal). Outcomes were obtained through outpatient follow-up, telephone interviews using a structured questionnaire, and inpatient medical records. Deaths caused by MI were verified by hospital death certificates and consultation with population management. All clinical events were confirmed by medical documentation and authenticated by the clinical events committee of our tertiary hospital. The follow-up period began with the initial visit and ended in January 2021.
Statistical Analysis
Statistical significance of differences in baseline characteristics was assessed according to CVAI quartiles (33.04–123.67, 123.83–150.55, 150.80–179.17, and 179.19–320.94) using ANOVA tests, signed-rank tests, or chi-square tests, accordingly. The Kaplan-Meier method was used to evaluate cumulative risk, and Log rank tests were used to assess differences in survival rates across strata.
Before building the Cox regression model, we evaluated the covariance between variables according to the variance inflation factor (VIF) (Table S1). Variables with VIF > 5 were considered inappropriate for inclusion in the Cox regression model. We eliminated three variables with multicollinearity (WC, eGFR, and Cr). Multivariate Cox regression models were used to estimate the relationship between CVAI and risk of first MI. CVAI was described as a continuous variable [per 1 standard deviation (SD) increase] and a categorical variable (quartiles) and was placed into different models. Besides the crude model, we adjusted for different confounding factors and constructed three regression models. Adjusted model 1 was adjusted for age, gender, NC, BMI, DBP, SBP, history of diabetes, drinking status, and smoking status at baseline; Adjusted model 2 was further adjusted for TG, TC, LDL-C, HDL-C, Lp (a), FPG, HsCRP, and Hcy levels at baseline. Adjusted model 3 was further adjusted for antihypertensive drugs, lipid-lowering drugs, antiplatelet drugs, antidiabetic drugs, regular CPAP treatment, AHI, mean SaO2, and lowest SaO2. P values for the trend test were performed in the regression models after the median value in each quartile of CVAI was entered into the model and treated as an ordinal variable. To verify the robustness of the results obtained from the main analysis, a sensitivity analysis was performed. The sensitivity analysis consisted of the following two aspects: first, a multivariate Cox regression model was constructed again after excluding participants who were regularly CPAP treatment; second, a competing risk analysis was performed using the Fine-Gray model.38
A generalized additive model and smoothing curve fitting were used to assess the potential relationship between CVAI and the risk of first MI. The generalized additive model allows us to fit the model using a nonlinear smoothing term without prior knowledge of the relationship between the dependent and independent variables. When a nonlinearity is detected, the inflection point is first calculated by a recursive algorithm, and then a two-piecewise Cox regression model is constructed on both sides of the inflection point. We determine the best-fit model based on the P-value derived from the log-likelihood ratio test.
Furthermore, we also conducted stratified analyses with interaction tests. Stratification of the study included diabetes (no and yes), age (≥ 60, ≥ 45 and < 60, and < 45 years), gender (male and female), BMI (≥ 25, and < 25 kg/m2), SBP (≥ 140 and < 140 mmHg), DBP (≥ 90 and < 90 mmHg), smoking status (never, past, and current), drinking status (never, past, and current), eGFR (≥ 90 and < 90 mL/min/1.73 m2), and AHI (≥ 30, ≥ 15 and < 30, and ≥ 5 and < 15 events/hour).
In addition, we used C-statistic, integrated discrimination improvement (IDI), and net reclassification index (NRI) to evaluate the incremental predictive value of CVAI over and above conventional risk factors.
A two-tailed P < 0.05 was recorded as significantly different. All statistical analyses were undertaken with R software, version 4.1.1.
Results
Characteristics of the Participants
Of the original participants (n = 3605), 1428 participants were excluded, leaving a total of 2177 participants included in the study for analysis (Figure 1). Baseline characteristics by quartiles of CVAI are listed in Table 1. The mean level of CVAI for all participants was 152.39 ± 42.00. The mean levels of CVAI of the four groups were 100.71 ± 17.86, 138.08 ± 7.58, 164.62 ± 8.13 and 206.06 ± 26.52, respectively. The mean age of these participants was 49.21 ± 10.45 years, of which 1493 (68.58%) were men. There were 870 patients with mild OSA, 647 patients with moderate OSA, and 660 patients with severe OSA in this study, respectively, of whom a total of 80 participants received regular CPAP treatment. During a median follow-up period of 87 months (IQR, 76–99), 82 participants developed new-onset MI. The cumulative incidence of new-onset MI according to the CVAI quartiles for participants was illustrated in Figure 2. The incidence of new-onset MI increased dramatically with increasing CVAI quartiles, from 8 (1.47%) in the 1st quartile to 38 (6.97%) in the 4th quartile. The Kaplan-Meier curve also revealed that participants in the 4th quartile of CVAI had a higher risk of new-onset MI events than participants in other groups (log-test, P < 0.0001).
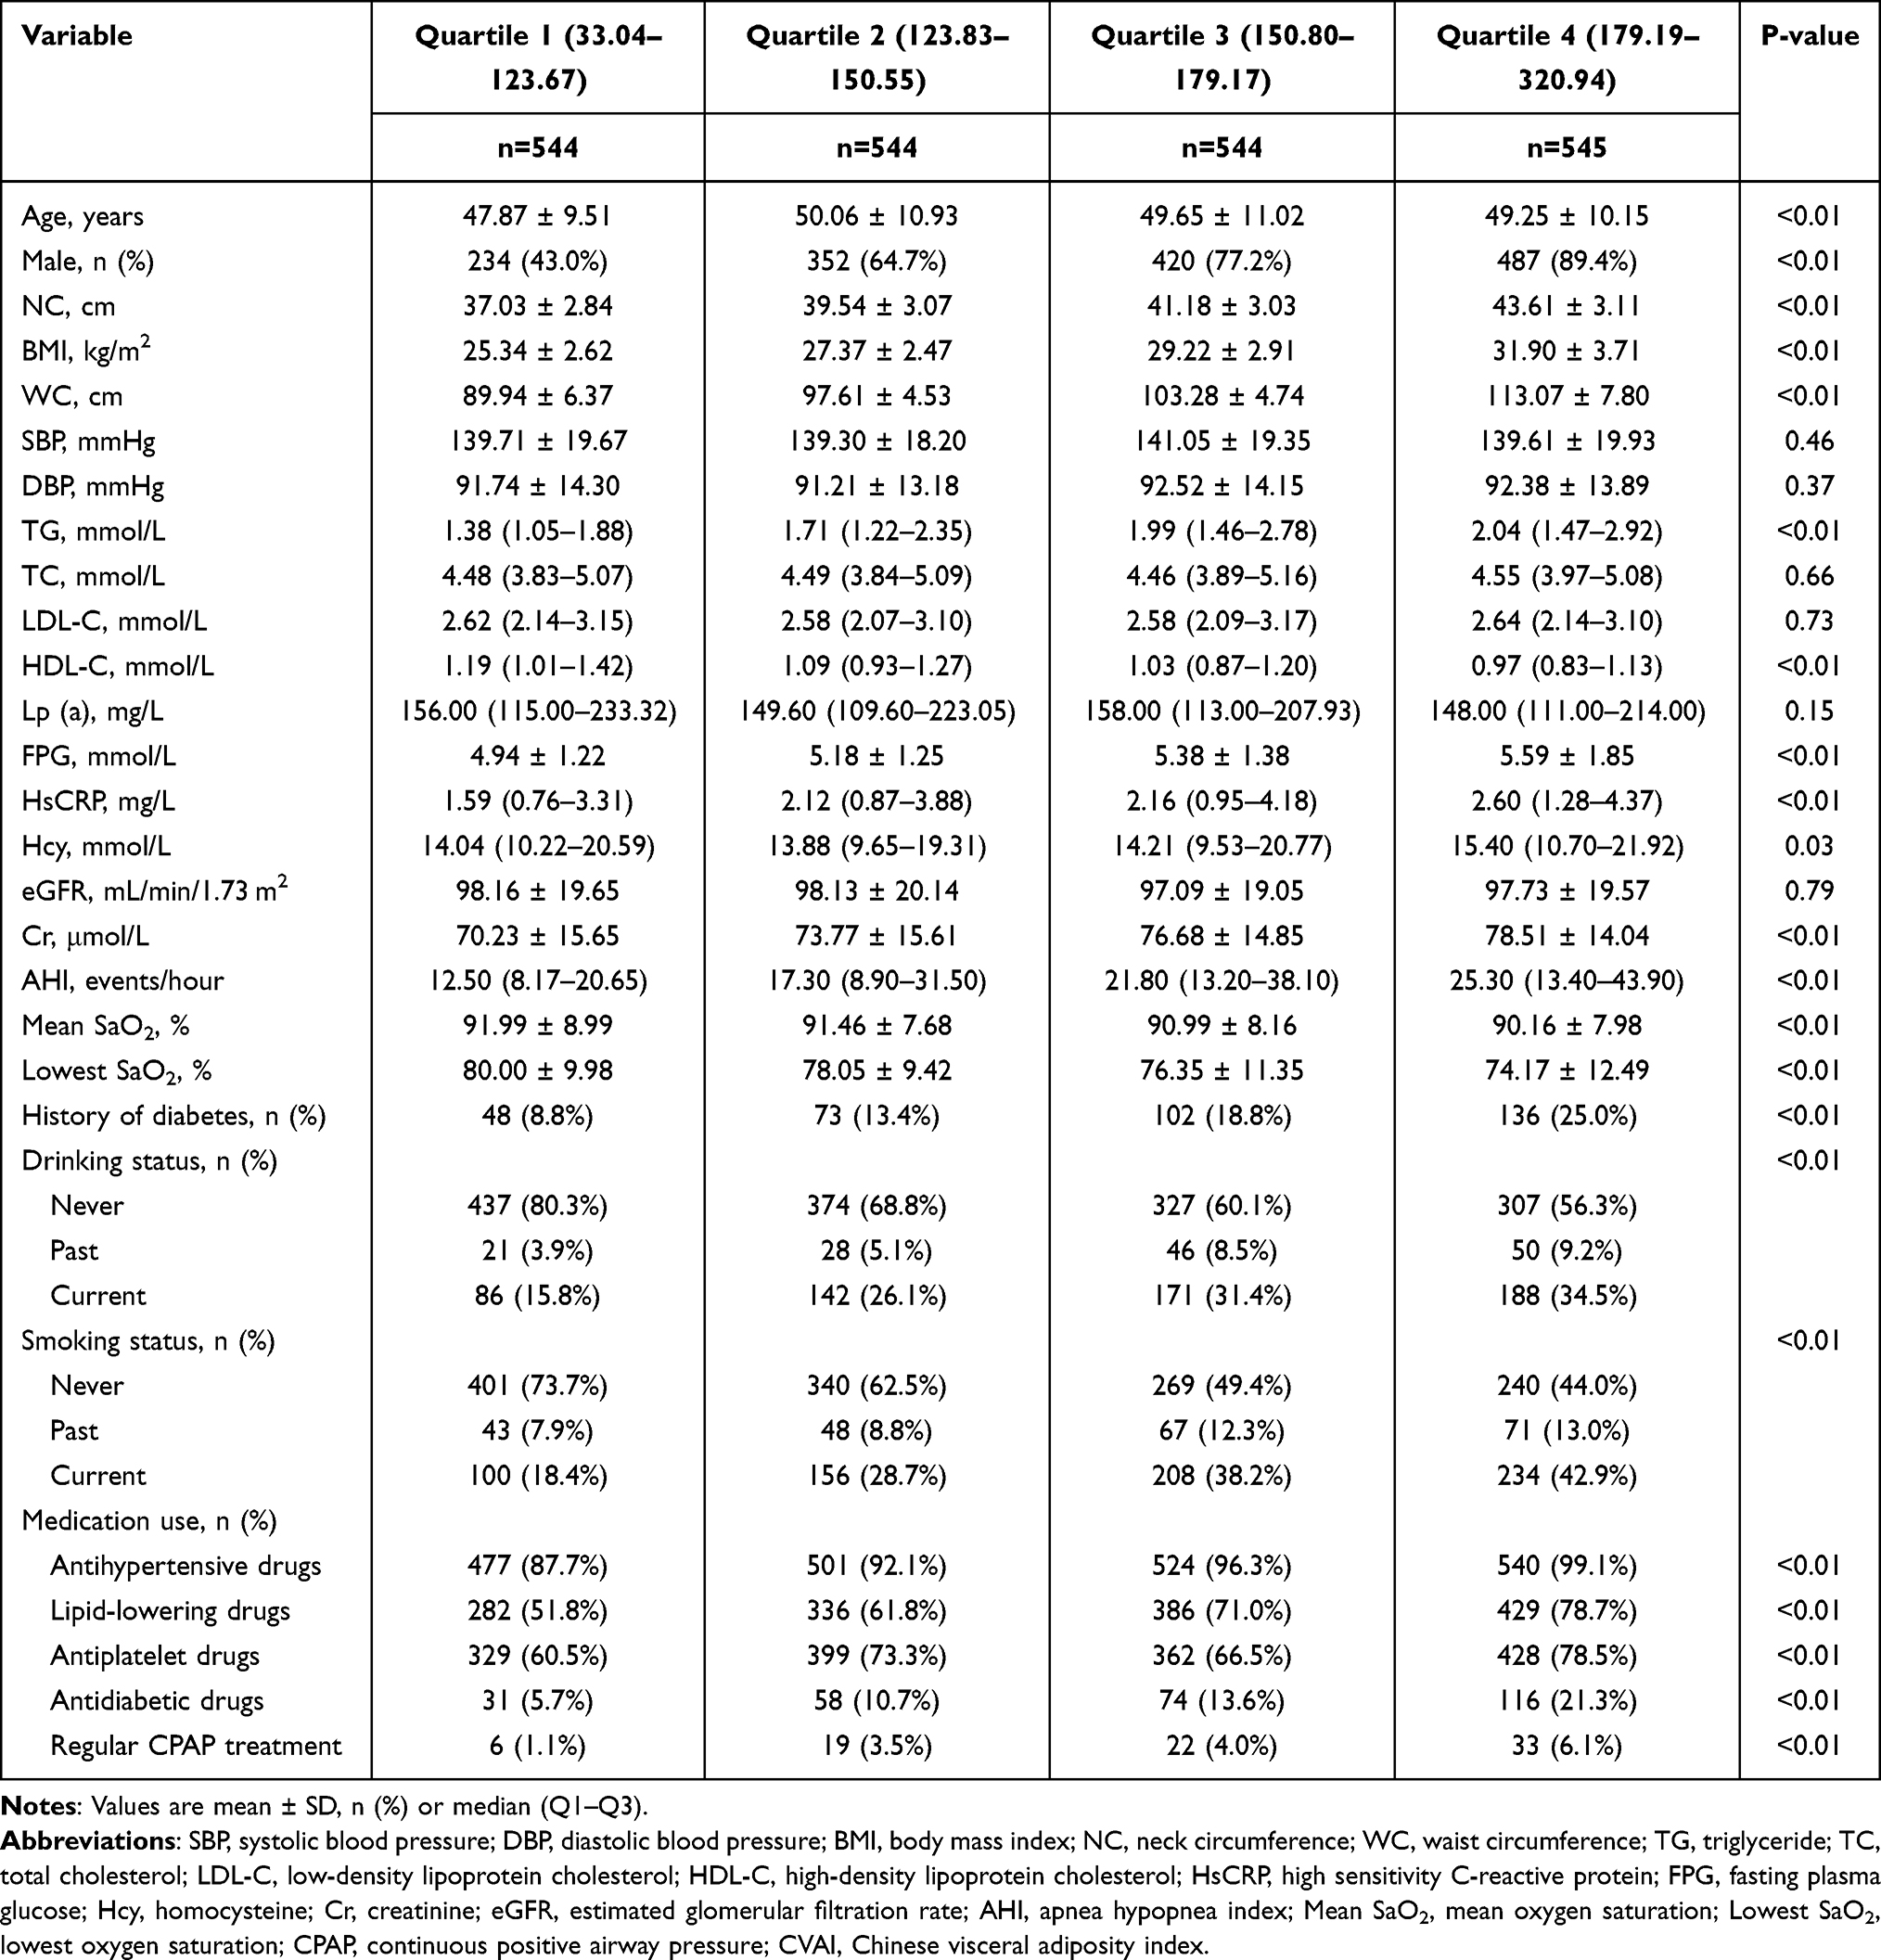 |
Table 1 Baseline Characteristics of Participants According to CVAI Quartiles |
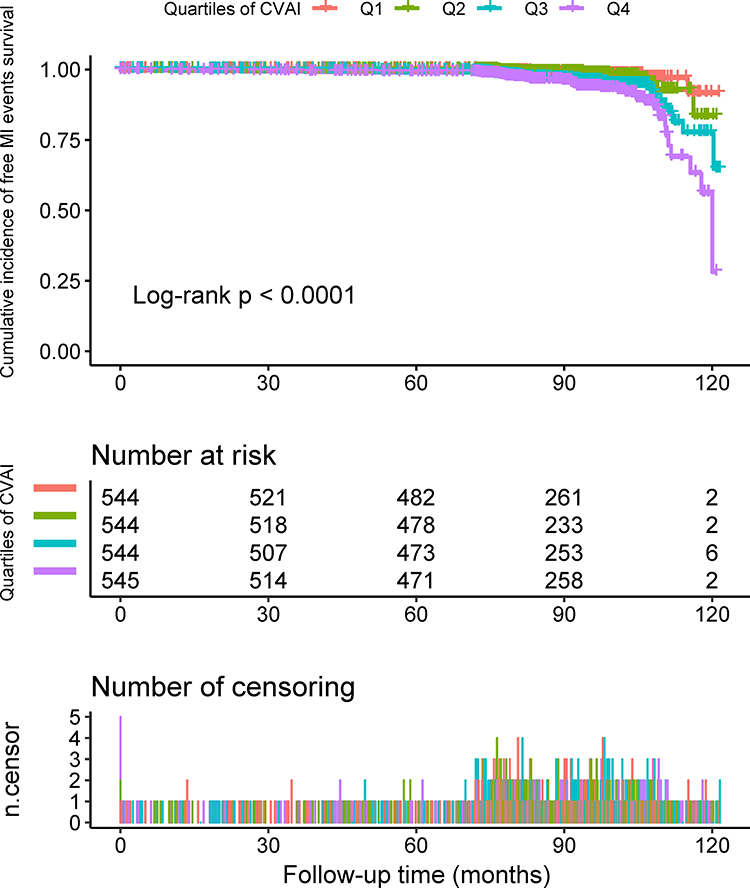 |
Figure 2 Kaplan-Meier survival curves of new-onset MI across CVAI quartile groups. |
Relationship Between CVAI and Incidence of New-Onset MI in Patients with Hypertension and OSA
We eliminated three variables with multicollinearity (WC, eGFR, and Cr). The remaining nonlinear covariates were incorporated into the Cox regression model. Table 2 illustrates the association between CVAI and new-onset MI on the basis of CVAI quartiles and CVAI per 1 SD increase. When CVAI values were expressed as a continuous variable, per 1 SD increment in CVAI was associated with a 65% (95% CI 1.43 to 1.90, P < 0.01) increase in the hazard of new-onset MI in the crude model, a 58% (95% CI 1.35 to 1.84, P < 0.01) increase in adjusted model 1, a 56% (95% CI 1.33 to 1.83, P < 0.01) increase in adjusted model 2, and 54% (95% CI 1.28 to 1.85, P < 0.01) increase in adjusted model 3. When CVAI values were expressed as a categorical variable, compared with quartile 1 in the crude model, the hazard for new-onset MI in quartile 2 showed no statistical significance, while HRs were 2.87 (95% CI 1.64 to 5.03, P < 0.01) for quartile 3 and 4.80 (95% CI 2.80 to 8.24, P < 0.01) for quartile 4. In adjusted model 1, the HRs were 2.49 (95% CI 1.40 to 4.43, P < 0.01) for quartile 3 and 3.99 (95% CI 2.25 to 7.06, P < 0.01) for quartile 4. A similar pattern was found in adjusted model 3, in which HRs were 2.45 (95% CI 1.32 to 4.55, P < 0.01) for quartile 3 and 3.64 (95% CI 1.94 to 6.83, P < 0.01) for quartile 4 (all P for trend < 0.01). To exclude the influence of regular CPAP treatment on the association between CVAI and incidence of new-onset MI, a sensitivity analysis was performed after excluding 80 patients on regular CPAP treatment. We discovered the relationship between CVAI and incidence of new-onset MI was unaffected in patients with hypertension and OSA (Table S2). In addition, we performed a competing risk analysis, which considered death as a competing risk. Sub-distribution HRs for CVAI and new-onset MI after competing risk analysis are presented in Table S3. The relationship between CVAI and new-onset MI was not significantly affected in the Fine-Gray model.
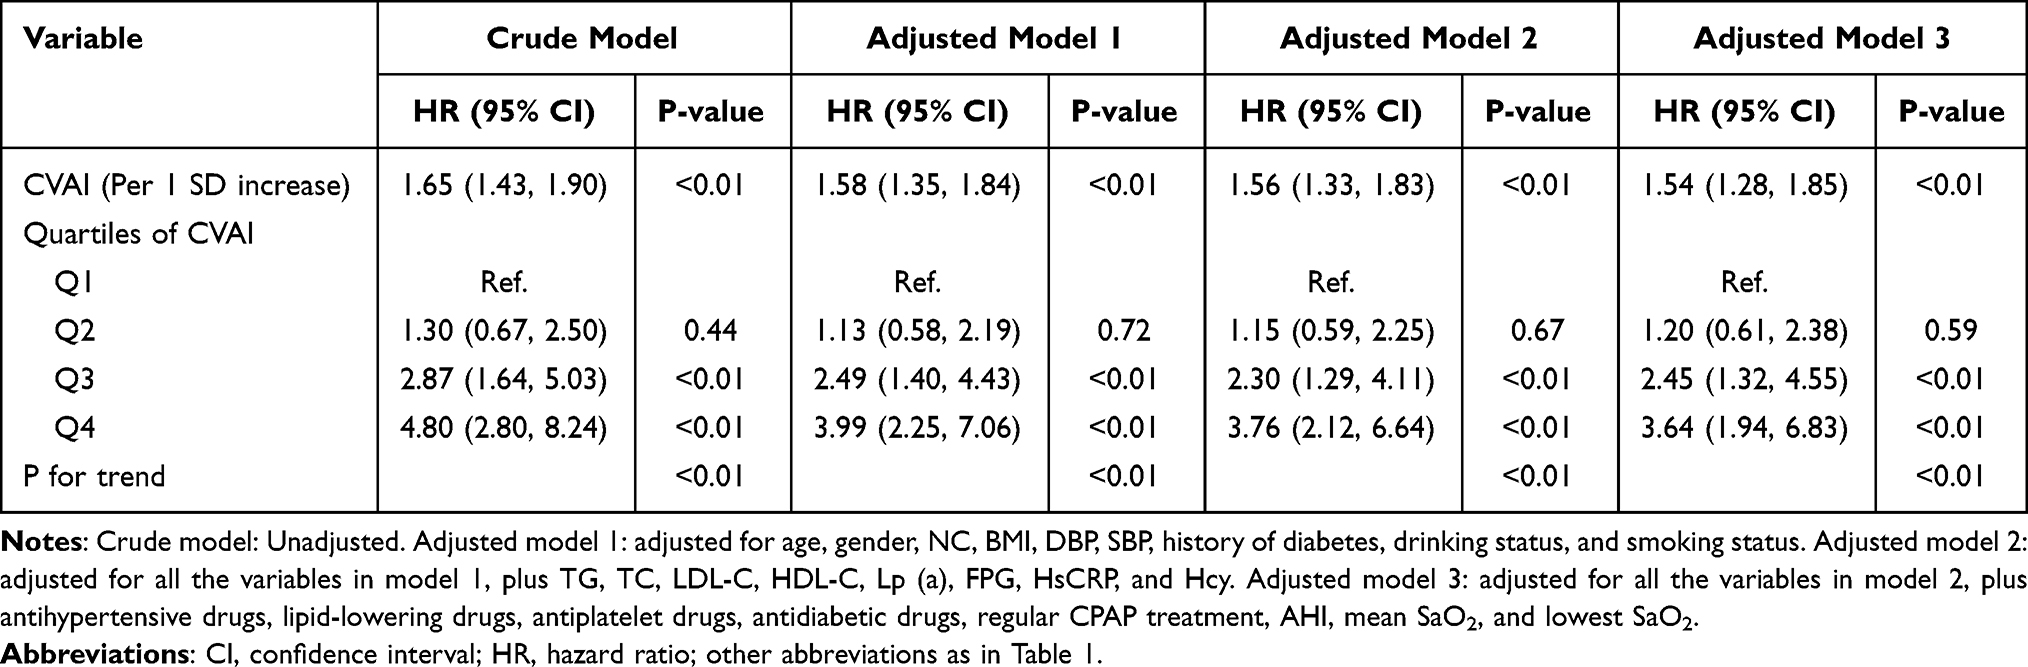 |
Table 2 Relationship Between CVAI and New-Onset MI in Different Models |
Nonlinearity and Threshold Effect Analysis of CVAI on Incidence of New-Onset MI in Patients with Hypertension and OSA
Both unadjusted and adjusted smoothing curves demonstrated that the relationship between CVAI and the risk of new-onset MI was nonlinear (Figure 3). We fitted the relationship between CVAI and risk of new-onset MI with a two-piecewise Cox regression model (Table 3). After adjusting for different confounding factors, the P values for the log-likelihood ratio test were all less than 0.05. This finding stated that a two-piecewise Cox regression model was more appropriate for fitting the association between CVAI and risk of new-onset MI. Using the two-piecewise Cox regression model and recursive algorithm, we calculated the inflection point of the CVAI to be 112. In adjusted model 3, for CVAI ≥ 112, per 1 SD increase in CVAI was associated with a 59% increase in the risk of new-onset MI (P < 0.01). For CVAI < 112, the relationship between CVAI and the risk of new-onset MI was not significant.
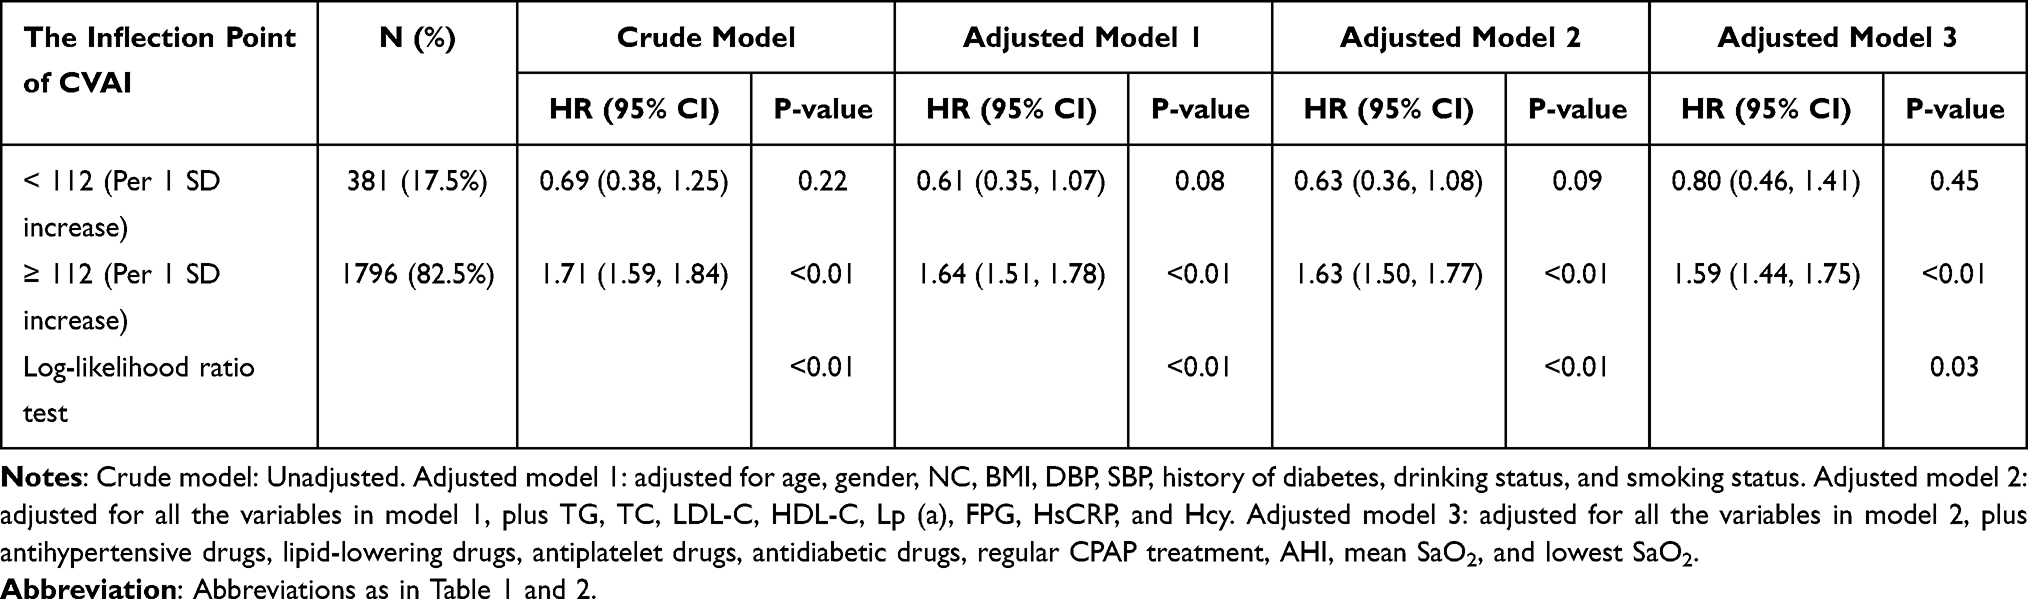 |
Table 3 Threshold Effect Analyses of CVAI (per 1 SD Increase) on the Risk of New-Onset MI Using Two-Piecewise Regression Models |
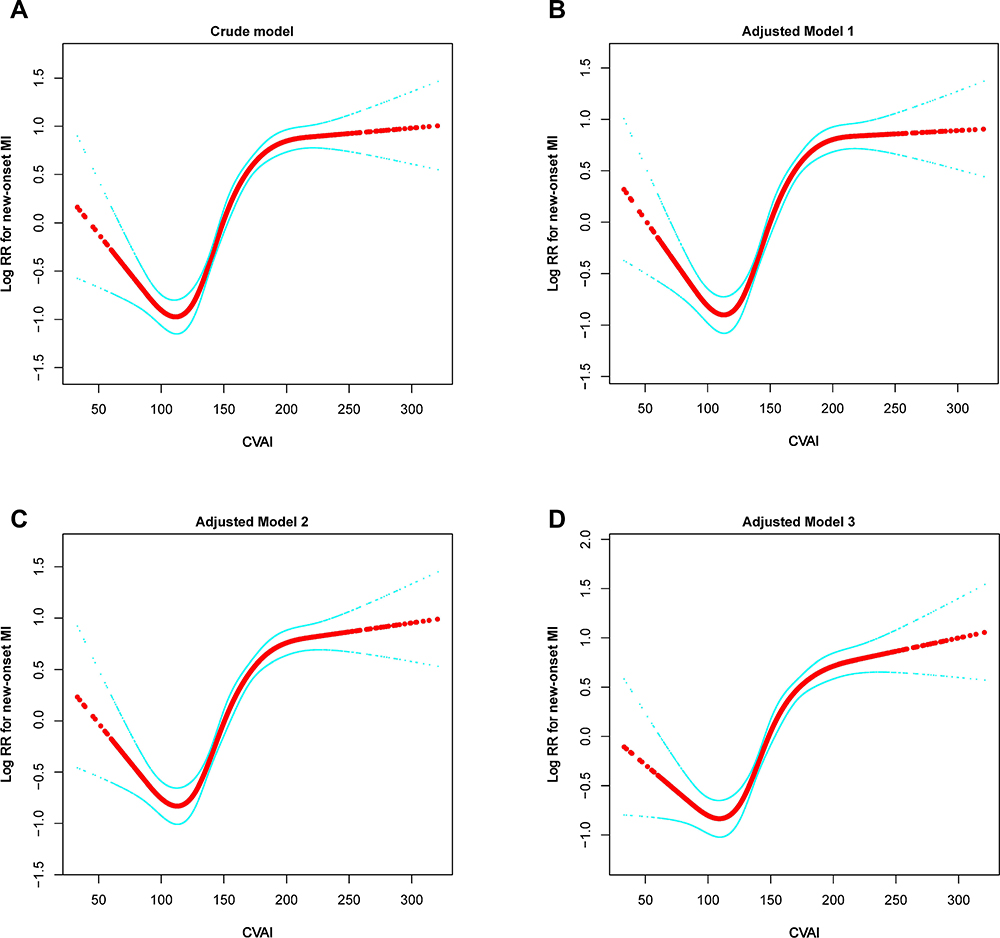 |
Figure 3 Dose-response relationship between CVAI and the probability of new-onset MI in different multivariable models. (A) crude model, (B) adjusted model 1, (C) adjusted model 2, and (D) adjusted model 3. Red line represents the smooth curve fit between variables. Blue line represents the 95% of confidence interval from the fit. Crude model: Unadjusted. Adjusted model 1: Adjusted for age, gender, NC, BMI, DBP, SBP, history of diabetes, drinking status, smoking status, and the time lag between baseline and follow-up. Adjusted model 2: Adjusted for all the variables in model 1, plus TG, TC, LDL-C, HDL-C, Lp (a), FPG, HsCRP, Hcy, and the time lag between baseline and follow-up. Adjusted model 3: Adjusted for all the variables in model 2, plus antihypertensive drugs, lipid-lowering drugs, antiplatelet drugs, antidiabetic drugs, regular CPAP treatment, AHI, mean SaO2, lowest SaO2, and the time lag between baseline and follow-up. Abbreviations: MI, myocardial infarction; RR, relative risk; other abbreviations in Table 1. |
Subgroup Analysis
We further conducted subgroup analyses to assess the association between CVAI (per 1 SD increment) and the risk of new-onset MI in different subgroups. None of the variables, including age (P interaction = 0.24), gender (P interaction = 0.52), eGFR (P interaction = 0.81), BMI (P interaction = 0.45), SBP (P interaction = 0.14), DBP (P interaction = 0.76), AHI (P interaction = 0.42), smoking status (P interaction = 0.31), diabetes (P interaction = 0.28), and drinking status (P interaction = 0.23) at baseline substantially altered the relationship between CVAI and risk of new-onset MI (Figure 4).
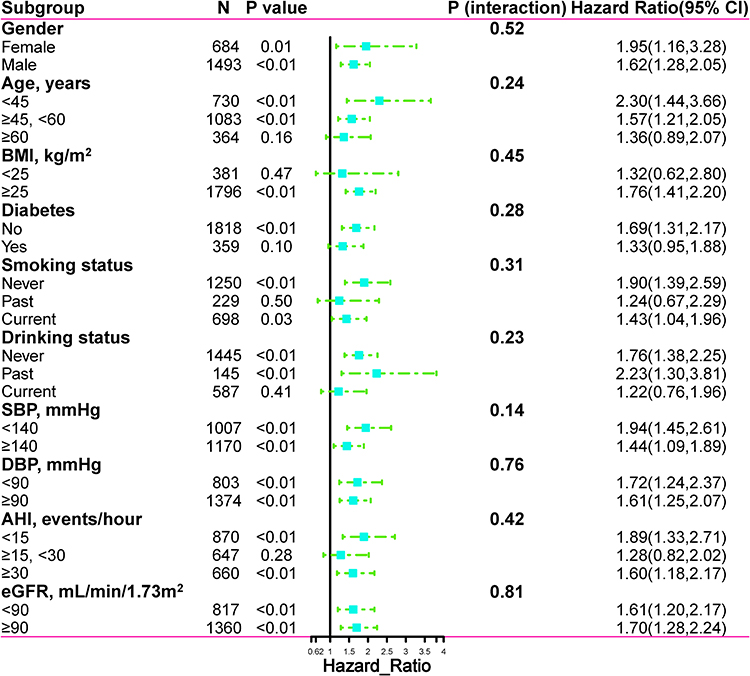 |
Figure 4 Subgroup analysis of associations between CVAI and new-onset MI. The dots and lines represent the estimates of the hazard ratios of new-onset MI for per 1 SD increment of CVAI and the corresponding 95% confidence intervals, respectively. |
Incremental Impact of CVAI on the Predictive Power of New-Onset MI in Patients with Hypertension and OSA
Table 4 showed that compared with the conventional model the inclusion of CVAI markedly enhanced discrimination and reclassification ability over the conventional model with a category-free NRI of 0.132 (95% CI 0.021 to 0.236, P = 0.021), and an IDI of 0.012 (95% CI 0.005 to 0.023, P < 0.001). In addition, C-statistic by the conventional model significantly improve with the addition of CVAI (from 0.677 to 0.710, P < 0.001).
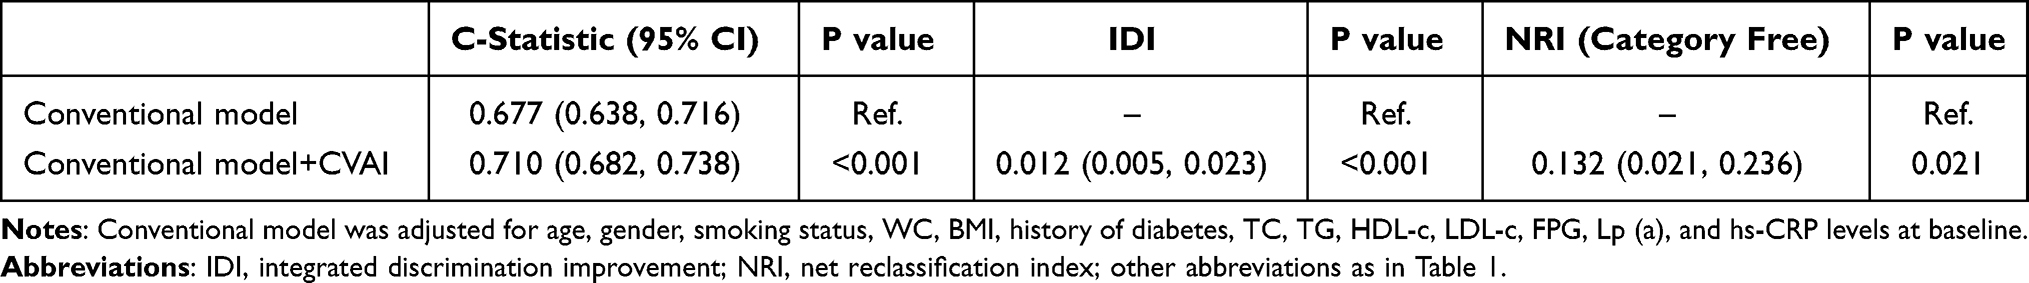 |
Table 4 C-Statistic and Reclassification Analyses for CVAI to Advance the Risk Classification of New-Onset MI |
Discussion
The current aging population in China is associated with an increasing prevalence of CVD.1 MI is one of the leading sources of cardiovascular mortality in China, which not only has a considerable impact on quality of life but also leads to a significant increase in socioeconomic burden.39 The present study was designed as a single-center retrospective cohort study to reveal the relationship between CVAI and new-onset MI. To our knowledge, this is the first study to investigate the relationship between CVAI and the risk of new-onset MI in patients with hypertension and OSA. This study demonstrated that elevated CVAI (CVAI ≥ 112) was independently associated with an increased risk of new-onset MI events in patients with hypertension and OSA. Compared with the lowest quartile, those in the highest quartile of CVAI had a 3.64-fold higher risk of new-onset MI. Furthermore, these results and trends were stable in both sensitivity analysis and subgroup analysis. This implies that our findings are robust and reliable. In addition, we found inconsistent effect size trends on the left and right sides of the inflection point. This result suggests an independent nonlinear relationship between CVAI and the incidence of new-onset MI. More importantly, the inclusion of CVAI in a conventional model consisting of certain conventional risk factors significantly improves reclassification ability.
China has been one of the countries with the largest obese population and obesity has become a leading issue and public health challenge in China.40 Compelling evidence from prospective cohort studies indicates that obesity is associated with an increased risk of CVD and premature death in the Chinese population.41 In the last decades, there is compelling evidence that adipose tissue has multiple effects as an endocrine organ due to the dynamic secretory function of adipocytes and resident macrophages.42 These effects may contribute to the low-grade, chronic pro-inflammatory state of obesity and are further associated with CVD and insulin resistance (IR).42 Indeed, sustained weight gain and adipose tissue accumulation induce major changes within various adipose depots, leading to the dysfunction, IR, increased lipolysis, and altered adipokine production.42–44 These changes are thought to contribute to overall adipose tissue dysfunction and play an important role in the cardiometabolic sequelae associated with obesity. Visceral adiposity appears to be a key factor in the underlying pathophysiological mechanisms.16,45
Recent evidence supports that the distribution pattern of visceral fat can be reliably quantified by imaging techniques.15 However, these imaging techniques lack economic feasibility and lead to the risk of exposure to radiation. Therefore, emphasis has been placed on identifying simple metrics that can be reliably applied in daily clinical practice as surrogate markers of visceral adiposity and indicators of increased cardiometabolic risk. Several studies have pointed out that BMI and WC do not perform satisfactorily for estimating visceral fat function and distribution.46,47 To address this issue, researchers have developed the CVAI for the metabolic characteristics of the Chinese population to more accurately assess the visceral fat distribution and cardiometabolic risk in specific populations.25,37 Initially, CVAI was deemed to be a reliable surrogate for assessing metabolic health and predicting diabetes.37 The results of Wei et al revealed that CVAI is a powerful and independent risk factor for diabetes in Chinese adults. Compared with indicators such as BMI and WC, CVAI demonstrated the best predictive ability for metabolic disease in Chinese adults and is a promising clinical predictor of visceral adiposity dysfunction.48 Wan et al indicated that CVAI had the strongest correlation with the prevalence of CVD and diabetic nephropathy among a range of abdominal obesity indices and that CVAI may be a useful and powerful tool for the prevention and treatment of CVD and diabetic nephropathy.26 Huang et al identified that CVAI performed best in anthropometric and cardiometabolic measures for 10-year CVD risk ≥7.5% in both men and women.49 A survey by Shao et al suggested that CVAI may better reflect the visceral fat status and serve as a potential biomarker for predicting poor prognosis in patients with chronic coronary total occlusion compared to traditional indicators of obesity.50 Li et al showed that CVAI was positively associated with the prevalence of carotid atherosclerosis and high risk of CVD in the elderly and could be used to determine people at high risk of atherosclerosis.28
CVAI has been identified in numerous studies as a validated biomarker for estimating visceral adiposity, but the exact pathophysiological mechanisms underlying the relationship between CVAI and MI are unknown.28,48 Currently, several seemingly plausible mechanisms have been proposed. First, this may be due to the synergistic effect of well-known risk factors included in the CVAI calculation formula. Low HDL-C, high WC, and high TG are all well-known cardiovascular risk factors.51–53 Therefore, the CVAI derived from the combination of these may be more closely related to MI than each individual risk factor. Second, the impact of metabolic comorbidities cannot be ignored. In previous studies, visceral fat has been shown to be strongly associated with metabolic diseases such as diabetes and hypertension, all of which are primary risk factors for MI.54,55 Third, the relationship between CVAI and MI risk may represent a pro-inflammatory process.56,57 Visceral fat produces various pro-inflammatory hormones and cytokines, such as tumor necrosis factor-α, pigment epithelium-derived factor, interleukin-6, and interleukin-8, which may increase the risk of coronary atherosclerosis and MI.56–58
The present study has several noteworthy strengths. First, it is the first study to report a nonlinear relationship between CVAI and risk of new-onset MI in patients with hypertension and OSA. Second, the present study is a retrospective cohort study design with large sample size. After rigorous adjustment for confounding and sensitivity analysis, the relationship between CVAI and new-onset MI remained stable, so the conclusions of this study can be considered relatively reliable. Nevertheless, we acknowledge some limitations of the present study. First, the present study is a retrospective cohort study, and although adjustments were made for a wide range of confounding in the analysis, residual confounding variables that were not measured or recorded cannot be excluded. Second, our current study was conducted on participants with hypertension and OSA, and the generalizability of the results to other populations remains to be considered. Third, imaging studies of fat distribution were not available in the majority of patients; therefore, direct comparisons of CVAI and physical quantification of fat distribution were not possible. Fourth, regular CPAP treatment is the recommended first-line treatment for OSA, but the number of patients regularly using CPAP therapy in this study was low. Possible reasons for this include physical discomfort, pressure intolerance, mask-related discomfort, and the fact that regular CPAP treatment is primarily recommended for those with moderate or severe OSA.59–61 Therefore, it could not be observed in this study whether treatment with CPAP could reduce the risk of new-onset MI in patients with hypertension and OSA. Fifth, although our study reported a nonlinear relationship between CVAI and risk of new-onset MI, the relatively small group size of patients with CVAI < 112 may not provide sufficient statistical power to fully investigate this nonlinear relationship. Because of these limitations, our study only presents hypotheses. These findings do need to be further investigated and confirmed in additional studies.
Conclusions
Our findings suggest that a nonlinear relationship between CVAI and the risk of new-onset MI in patients with hypertension and OSA. Increased CVAI was significantly associated with the risk of new-onset MI when CVAI was ≥ 112. Therefore, the results of this study provide a convenient and useful marker for early prevention of MI in patients with hypertension and OSA, contributing to the identification of those at risk for MI and providing early preventive intervention.
Data Sharing Statement
The dataset utilized in this study is accessible from the corresponding author at reasonable request.
Acknowledgments
We thank all participants and staff of the URSAH study for their important contributions.
Funding
The Natural Science Foundation of Xinjiang Uygur Autonomous Region (grant number: 2021D01C173).
Disclosure
The authors declare no conflict of interest in this work.
References
1. Zhao D, Liu J, Wang M, Zhang X, Zhou M. Epidemiology of cardiovascular disease in China: current features and implications. Nat Rev Cardiol. 2019;16:203–212. doi:10.1038/s41569-018-0119-4
2. James SL, Abate D, Abate KHet al. Global, regional, and national incidence, prevalence, and years lived with disability for 354 diseases and injuries for 195 countries and territories, 1990–2017: a systematic analysis for the Global Burden of Disease Study 2017. Lancet. 2018;392:1789–1858. doi:10.1016/S0140-6736(18)32279-7
3. Roth GA, Johnson C, Abajobir A, et al. Global, regional, and national burden of cardiovascular diseases for 10 causes, 1990 to 2015. J Am Coll Cardiol. 2017;70:1–25. doi:10.1016/j.jacc.2017.04.052
4. Roth GA, Abate D, Abate KHet al. Global, regional, and national age-sex-specific mortality for 282 causes of death in 195 countries and territories, 1980-2017: a systematic analysis for the Global Burden of Disease Study 2017. Lancet. 2018;392:1736–1788. doi:10.1016/S0140-6736(18)32203-7
5. Sun G, Shen JF, Wei XF, Qi GX. Circular RNA Foxo3 relieves myocardial ischemia/reperfusion injury by suppressing autophagy via inhibiting HMGB1 by repressing KAT7 in myocardial infarction. J Inflamm Res. 2021;14:6397–6407. doi:10.2147/JIR.S339133
6. Xie H, Zha E, Zhang Y. Identification of featured metabolism-related genes in patients with acute myocardial infarction. Dis Markers. 2020;2020:8880004. doi:10.1155/2020/8880004
7. Tian X, Zuo Y, Chen S, et al. Triglyceride-glucose index is associated with the risk of myocardial infarction: an 11-year prospective study in the Kailuan cohort. Cardiovasc Diabetol. 2021;20:19. doi:10.1186/s12933-020-01210-5
8. Fuchs FD, Whelton PK. High blood pressure and cardiovascular disease. Hypertension. 2020;75:285–292. doi:10.1161/HYPERTENSIONAHA.119.14240
9. Loffler KA, Heeley E, Freed R, et al. Continuous positive airway pressure treatment, glycemia, and diabetes risk in obstructive sleep apnea and comorbid cardiovascular disease. Diabetes Care. 2020;43:1859–1867. doi:10.2337/dc19-2006
10. Dong JY, Zhang YH, Qin LQ. Obstructive sleep apnea and cardiovascular risk: meta-analysis of prospective cohort studies. Atherosclerosis. 2013;229:489–495. doi:10.1016/j.atherosclerosis.2013.04.026
11. Loke YK, Brown JW, Kwok CS, Niruban A, Myint PK. Association of obstructive sleep apnea with risk of serious cardiovascular events: a systematic review and meta-analysis. Circ Cardiovasc Qual Outcomes. 2012;5:720–728. doi:10.1161/CIRCOUTCOMES.111.964783
12. Ortega FB, Lavie CJ, Blair SN. Obesity and cardiovascular disease. Circ Res. 2016;118:1752–1770. doi:10.1161/CIRCRESAHA.115.306883
13. Després JP. Body fat distribution and risk of cardiovascular disease: an update. Circulation. 2012;126:1301–1313. doi:10.1161/CIRCULATIONAHA.111.067264
14. Van Gaal LF, Mertens IL, De Block CE. Mechanisms linking obesity with cardiovascular disease. Nature. 2006;444:875–880. doi:10.1038/nature05487
15. Graffy PM, Pickhardt PJ. Quantification of hepatic and visceral fat by CT and MR imaging: relevance to the obesity epidemic, metabolic syndrome and NAFLD. Br J Radiol. 2016;89:20151024. doi:10.1259/bjr.20151024
16. Amato MC, Giordano C, Galia M, et al. Visceral adiposity index: a reliable indicator of visceral fat function associated with cardiometabolic risk. Diabetes Care. 2010;33:920–922. doi:10.2337/dc09-1825
17. Cornier MA, Després JP, Davis N, et al. Assessing adiposity: a scientific statement from the American Heart Association. Circulation. 2011;124:1996–2019. doi:10.1161/CIR.0b013e318233bc6a
18. Shang L, Li R, Zhao Y, Sun H, Tang B, Hou Y. Association between Chinese visceral adiposity index and incident type 2 diabetes mellitus in Japanese adults. Diabetes Metab Syndr Obes. 2021;14:3743–3751. doi:10.2147/DMSO.S322935
19. Xiao H, Xiong C, Shao X, et al. Visceral adiposity index and chronic kidney disease in a non-diabetic population: a cross-sectional study. Diabetes Metab Syndr Obes. 2020;13:257–265. doi:10.2147/DMSO.S231656
20. Randrianarisoa E, Lehn-Stefan A, Hieronimus A, et al. Visceral adiposity index as an independent marker of subclinical atherosclerosis in individuals prone to diabetes mellitus. J Atheroscler Thromb. 2019;26:821–834. doi:10.5551/jat.47274
21. Yu Y, Zhang FL, Yan XL, Zhang P, Guo ZN, Yang Y. Visceral adiposity index and cervical arterial atherosclerosis in northeast China: a population based cross-sectional survey. Eur J Neurol. 2021;28:161–171. doi:10.1111/ene.14513
22. Dong H, Xu Y, Zhang X, Tian S. Visceral adiposity index is strongly associated with hyperuricemia independently of metabolic health and obesity phenotypes. Sci Rep. 2017;7:8822. doi:10.1038/s41598-017-09455-z
23. Lear SA, Humphries KH, Kohli S, Chockalingam A, Frohlich JJ, Birmingham CL. Visceral adipose tissue accumulation differs according to ethnic background: results of the Multicultural Community Health Assessment Trial (M-CHAT). Am J Clin Nutr. 2007;86:353–359. doi:10.1093/ajcn/86.2.353
24. Nazare JA, Smith JD, Borel AL, et al. Ethnic influences on the relations between abdominal subcutaneous and visceral adiposity, liver fat, and cardiometabolic risk profile: the international study of prediction of intra-abdominal adiposity and its relationship with cardiometabolic risk/intra-abdominal adiposity. Am J Clin Nutr. 2012;96:714–726. doi:10.3945/ajcn.112.035758
25. Wu J, Gong L, Li Q, et al. A novel visceral adiposity index for prediction of type 2 diabetes and pre-diabetes in Chinese adults: a 5-year prospective study. Sci Rep. 2017;7:13784. doi:10.1038/s41598-017-14251-w
26. Wan H, Wang Y, Xiang Q, et al. Associations between abdominal obesity indices and diabetic complications: Chinese visceral adiposity index and neck circumference. Cardiovasc Diabetol. 2020;19:118. doi:10.1186/s12933-020-01095-4
27. Han M, Qie R, Li Q, et al. Chinese visceral adiposity index, a novel indicator of visceral obesity for assessing the risk of incident hypertension in a prospective cohort study. Br J Nutr. 2021;126:612–620. doi:10.1017/S0007114520004298
28. Li B, Lai X, Yan C, Jia X, Li Y. The associations between neutrophil-to-lymphocyte ratio and the Chinese visceral adiposity index, and carotid atherosclerosis and atherosclerotic cardiovascular disease risk. Exp Gerontol. 2020;139:111019. doi:10.1016/j.exger.2020.111019
29. Wang L, Li N, Yao X, et al. Detection of secondary causes and coexisting diseases in hypertensive patients: OSA and PA are the common causes associated with hypertension. Biomed Res Int. 2017;2017:8295010. doi:10.1155/2017/8295010
30. Cao Y, Zhu Q, Cai X, et al. Glial cell-derived neurotrophic factor functions as a potential candidate gene in obstructive sleep apnea based on a combination of bioinformatics and targeted capture sequencing analyses. Biomed Res Int. 2021;2021:6656943. doi:10.1155/2021/6656943
31. Yang W, Shao L, Heizhati M, et al. Oropharyngeal microbiome in obstructive sleep apnea: decreased diversity and abundance. J Clin Sleep Med. 2019;15:1777–1788. doi:10.5664/jcsm.8084
32. Liang S, Li N, Heizhati M, et al. What do changes in concentrations of serum surfactant proteins A and D in OSA mean. Sleep Breath. 2015;19:955–962. doi:10.1007/s11325-014-1106-6
33. Levey AS, Inker LA, Coresh J. GFR estimation: from physiology to public health. Am J Kidney Dis. 2014;63:820–834. doi:10.1053/j.ajkd.2013.12.006
34. Li N, Cai X, Zhu Q, et al. Association between plasma homocysteine concentrations and the first ischemic stroke in hypertensive patients with obstructive sleep apnea: a 7-year retrospective cohort study from China. Dis Markers. 2021;2021:9953858. doi:10.1155/2021/9953858
35. Xu PH, Hui C, Lui M, Lam D, Fong D, Ip M. Incident type 2 diabetes in OSA and effect of CPAP treatment: a retrospective clinic cohort study. Chest. 2019;156:743–753. doi:10.1016/j.chest.2019.04.130
36. Barnes M, Houston D, Worsnop CJ, et al. A randomized controlled trial of continuous positive airway pressure in mild obstructive sleep apnea. Am J Respir Crit Care Med. 2002;165:773–780. doi:10.1164/ajrccm.165.6.2003166
37. Han M, Qin P, Li Q, et al. Chinese visceral adiposity index: a reliable indicator of visceral fat function associated with risk of type 2 diabetes. Diabetes Metab Res Rev. 2021;37:e3370. doi:10.1002/dmrr.3370
38. Zhang X, Zhang MJ, Fine J. A proportional hazards regression model for the subdistribution with right-censored and left-truncated competing risks data. Stat Med. 2011;30:1933–1951. doi:10.1002/sim.4264
39. Liu S, Li Y, Zeng X, et al. Burden of cardiovascular diseases in China, 1990–2016: findings from the 2016 global burden of disease study. JAMA Cardiol. 2019;4:342–352. doi:10.1001/jamacardio.2019.0295
40. Pan XF, Wang L, Pan A. Epidemiology and determinants of obesity in China. Lancet Diabetes Endocrinol. 2021;9:373–392. doi:10.1016/S2213-8587(21)00045-0
41. Gao M, Lv J, Yu C, et al. Metabolically healthy obesity, transition to unhealthy metabolic status, and vascular disease in Chinese adults: a cohort study. PLoS Med. 2020;17:e1003351. doi:10.1371/journal.pmed.1003351
42. Scheja L, Heeren J. The endocrine function of adipose tissues in health and cardiometabolic disease. Nat Rev Endocrinol. 2019;15:507–524. doi:10.1038/s41574-019-0230-6
43. Cimellaro A, Perticone M, Fiorentino TV, Sciacqua A, Hribal ML. Role of endoplasmic reticulum stress in endothelial dysfunction. Nutr Metab Cardiovasc Dis. 2016;26:863–871. doi:10.1016/j.numecd.2016.05.008
44. Yang S, Wu M, Li X, et al. Role of endoplasmic reticulum stress in atherosclerosis and its potential as a therapeutic target. Oxid Med Cell Longev. 2020;2020:9270107. doi:10.1155/2020/9270107
45. Neeland IJ, Ross R, Després JP, et al. Visceral and ectopic fat, atherosclerosis, and cardiometabolic disease: a position statement. Lancet Diabetes Endocrinol. 2019;7:715–725. doi:10.1016/S2213-8587(19)30084-1
46. Liu D, Zhong J, Wen W, et al. Relationship between skeletal muscle mass to visceral fat area ratio and cardiovascular risk in type 2 diabetes. Diabetes Metab Syndr Obes. 2021;14:3733–3742. doi:10.2147/DMSO.S326195
47. Baveicy K, Mostafaei S, Darbandi M, Hamzeh B, Najafi F, Pasdar Y. Predicting metabolic syndrome by visceral adiposity index, body roundness index and a body shape index in adults: a cross-sectional study from the Iranian RaNCD cohort data. Diabetes Metab Syndr Obes. 2020;13:879–887. doi:10.2147/DMSO.S238153
48. Wei J, Liu X, Xue H, Wang Y, Shi Z. Comparisons of visceral adiposity index, body shape index, body mass index and waist circumference and their associations with diabetes mellitus in adults. Nutrients. 2019;11:1580. doi:10.3390/nu11071580
49. Huang YC, Huang JC, Lin CI, et al. Comparison of innovative and traditional cardiometabolic indices in estimating atherosclerotic cardiovascular disease risk in adults. Diagnostics. 2021;11. doi:10.3390/diagnostics11040603
50. Shao MJ, Luo JY, Shi J, et al. Association of visceral obesity-related indices with coronary collateralization in patients with chronic total occlusion. Front Cardiovasc Med. 2021;8:742855. doi:10.3389/fcvm.2021.742855
51. Luan H, Song Y, Cao L, Wang P, Zhu D, Tian G. Gender differences in the relationship of waist circumference to coronary artery lesions and one-year re-admission among coronary artery disease patients with normal body mass index. Diabetes Metab Syndr Obes. 2021;14:4097–4107. doi:10.2147/DMSO.S330194
52. Bastien M, Poirier P, Lemieux I, Després JP. Overview of epidemiology and contribution of obesity to cardiovascular disease. Prog Cardiovasc Dis. 2014;56:369–381. doi:10.1016/j.pcad.2013.10.016
53. Wang X, Wang H, Li J, et al. Combined effects of dyslipidemia and high adiposity on the estimated glomerular filtration rate in a middle-aged Chinese population. Diabetes Metab Syndr Obes. 2021;14:4513–4522. doi:10.2147/DMSO.S337190
54. Levelt E, Pavlides M, Banerjee R, et al. Ectopic and visceral fat deposition in lean and obese patients with type 2 diabetes. J Am Coll Cardiol. 2016;68:53–63. doi:10.1016/j.jacc.2016.03.597
55. Orr JS, Gentile CL, Davy BM, Davy KP. Large artery stiffening with weight gain in humans: role of visceral fat accumulation. Hypertension. 2008;51:1519–1524. doi:10.1161/HYPERTENSIONAHA.108.112946
56. Kawai T, Autieri MV, Scalia R. Adipose tissue inflammation and metabolic dysfunction in obesity. Am J Physiol Cell Physiol. 2021;320:C375–C391. doi:10.1152/ajpcell.00379.2020
57. Anthony SR, Guarnieri AR, Gozdiff A, Helsley RN, Phillip Owens A, Tranter M. Mechanisms linking adipose tissue inflammation to cardiac hypertrophy and fibrosis. Clin Sci. 2019;133:2329–2344. doi:10.1042/CS20190578
58. Park HJ, Kim J, Park SE, et al. Increased risk of subclinical atherosclerosis associated with high visceral adiposity index in apparently healthy Korean adults: the Kangbuk Samsung Health Study. Ann Med. 2016;48:410–416. doi:10.1080/07853890.2016.1183258
59. Mehrtash M, Bakker JP, Ayas N. Predictors of continuous positive airway pressure adherence in patients with obstructive sleep apnea. Lung. 2019;197:115–121. doi:10.1007/s00408-018-00193-1
60. Crawford MR, Espie CA, Bartlett DJ, Grunstein RR. Integrating psychology and medicine in CPAP adherence–new concepts. Sleep Med Rev. 2014;18:123–139. doi:10.1016/j.smrv.2013.03.002
61. Gay P, Weaver T, Loube D, Iber C. Evaluation of positive airway pressure treatment for sleep related breathing disorders in adults. Sleep. 2006;29:381–401. doi:10.1093/sleep/29.3.381
 © 2022 The Author(s). This work is published and licensed by Dove Medical Press Limited. The full terms of this license are available at https://www.dovepress.com/terms.php and incorporate the Creative Commons Attribution - Non Commercial (unported, v3.0) License.
By accessing the work you hereby accept the Terms. Non-commercial uses of the work are permitted without any further permission from Dove Medical Press Limited, provided the work is properly attributed. For permission for commercial use of this work, please see paragraphs 4.2 and 5 of our Terms.
© 2022 The Author(s). This work is published and licensed by Dove Medical Press Limited. The full terms of this license are available at https://www.dovepress.com/terms.php and incorporate the Creative Commons Attribution - Non Commercial (unported, v3.0) License.
By accessing the work you hereby accept the Terms. Non-commercial uses of the work are permitted without any further permission from Dove Medical Press Limited, provided the work is properly attributed. For permission for commercial use of this work, please see paragraphs 4.2 and 5 of our Terms.