Back to Journals » International Journal of Chronic Obstructive Pulmonary Disease » Volume 18
Nomograms Using CT Morphological Features and Clinical Characteristics to Identify COPD in Patients with Lung Cancer: A Multicenter Study
Authors Tu W ![]() , Zhou T, Zhou X, Ma Y
, Zhou T, Zhou X, Ma Y ![]() , Duan S, Wang Y, Wang X, Liu T, Zhang H, Feng Y, Huang W, Jiang X, Xiao Y, Liu S, Fan L
, Duan S, Wang Y, Wang X, Liu T, Zhang H, Feng Y, Huang W, Jiang X, Xiao Y, Liu S, Fan L ![]()
Received 4 February 2023
Accepted for publication 30 May 2023
Published 12 June 2023 Volume 2023:18 Pages 1169—1185
DOI https://doi.org/10.2147/COPD.S405429
Checked for plagiarism Yes
Review by Single anonymous peer review
Peer reviewer comments 2
Editor who approved publication: Prof. Dr. Richard Russell
Wenting Tu,1,* Taohu Zhou,1,2,* Xiuxiu Zhou,1,* Yanqing Ma,3 Shaofeng Duan,4 Yun Wang,1 Xiang Wang,1 Tian Liu,1 HanXiao Zhang,5 Yan Feng,1 Wenjun Huang,2 Xinang Jiang,1 Yi Xiao,1 Shiyuan Liu,1 Li Fan1
1Department of Radiology, Second Affiliated Hospital of Naval Medical University, Shanghai, 200003, People’s Republic of China; 2School of Medical Imaging, Weifang Medical University, Weifang, Shandong, 261053, People’s Republic of China; 3Department of Radiology, Zhejiang Provincial People’s Hospital, Affiliated People’s Hospital of Hangzhou Medical College, Hangzhou, Zhejiang, 310000, People’s Republic of China; 4GE Healthcare, Precision Health Institution, Shanghai, 210000, People’s Republic of China; 5School of Medical Imaging, Xuzhou Medical University, Xuzhou, Jiangsu, 221018, People’s Republic of China
*These authors contributed equally to this work
Correspondence: Shiyuan Liu; Li Fan, Department of Radiology, Second Affiliated Hospital, Naval Medical University, No. 415 Fengyang Road, Shanghai, 200003, People’s Republic of China, Tel +86 21 81886012 ; +86 21 81886018, Fax +86 21 63587668, Email [email protected]; [email protected]
Purpose: This study aimed to screen out computed tomography (CT) morphological features and clinical characteristics of patients with lung cancer to identify chronic obstructive pulmonary disease (COPD). Further, we aimed to develop and validate different diagnostic nomograms for predicting whether lung cancer is comorbid with COPD.
Patients and Methods: This retrospective study examined data from 498 patients with lung cancer (280 with COPD, 218 without COPD; 349 in training cohort, 149 in validation cohort) from two centers. Five clinical characteristics and 20 CT morphological features were evaluated. Differences in all variables were assessed between COPD and non-COPD groups. Models were developed using multivariable logistic regression to identify COPD, including clinical, imaging, and combined nomograms. Receiver operating characteristic curves were used to evaluate and compare the performance of nomograms.
Results: Age, sex, interface, bronchus cutoff sign, spine-like process, and spiculation sign were independent predictors of COPD in patients with lung cancer. In the training and validation cohorts, the clinical nomogram showed good performance to predict COPD in lung cancer patients (areas under the curves [AUCs] of 0.807 [95% CI, 0.761– 0.854] and 0.753 [95% CI, 0.674– 0.832]); while the imaging nomogram showed slightly better performance (AUCs of 0.814 [95% CI, 0.770– 0.858] and 0.780 [95% CI, 0.705– 0.856]). For the combined nomogram generated with clinical and imaging features, the performance was further improved (AUC=0.863 [95% CI, 0.824– 0.903], 0.811 [95% CI, 0.742– 0.880] in the training and validation cohort). At 60% risk threshold, there were more true negative predictions (48 vs 44) and higher accuracy (73.15% vs 71.14%) for the combined nomogram compared with the clinical nomogram in the validation cohort.
Conclusion: The combined nomogram developed with clinical and imaging features outperformed clinical and imaging nomograms; this provides a convenient method to detect COPD in patients with lung cancer using one-stop CT scanning.
Keywords: chronic obstructive pulmonary disease, lung cancer, computed tomography, chest imaging, nomogram
Introduction
Chronic obstructive pulmonary disease (COPD) is the third leading cause of death in the world. The Global Burden of Disease Study estimated the global prevalence of COPD to be 174 million cases in 2015.1 In the same year, the overall prevalence of spirometry-defined COPD was 8.6%, accounting for 99.9 million people with COPD in China.2 Lung cancers are the second most common malignant tumors and have the highest mortality rate among malignancies.3,4 In 2020, there were 2.207 million new cases of lung cancer worldwide, and lung cancer caused 1.796 million deaths.4 Some studies have shown that 50–70% of patients with lung cancer have COPD, and the incidence of lung cancer in patients with COPD is significantly higher than those without COPD.5 Studies on comorbid COPD and lung cancer have focused on the correlation of pathogenic factors,6,7 the prediction of lung cancer occurrence with COPD-related factors,8,9 prognosis,10 and the correlation between COPD and pathological subtypes of lung cancer.11 COPD and lung cancer share risk factors, such as aging, tobacco use, and air pollution.7 Moreover, some characteristics of COPD are independent predictors of lung cancer.8
Lung cancer with comorbid COPD is associated with poorer overall survival (OS) compared with lung cancer alone.10 Additionally, patients with comorbid lung cancer and COPD have a higher risk of increased postoperative complications.10 Therefore, the accurate identification of comorbid COPD and lung cancer is helpful to optimize clinical treatment decisions and may improve prognosis. Pulmonary function tests (PFTs) are considered the gold standard for the diagnosis of COPD but have several limitations. PFTs require a high level of cooperation from patients; if patients do not follow the operator instructions well, the test results are likely to be unreliable. In addition, PFTs are not applicable to all patients because they have many contraindications, such as angina pectoris, pulmonary embolism, and severe heart failure. As a routine examination method for patients with lung cancer, computed tomography (CT) is non-invasive, requires minimal patient cooperation, and has a wide application range. If CT features can be used to identify the comorbidity of COPD with lung cancer, the benefits of one-stop detection of lung cancer and COPD may be achieved. PFTs are not regular examinations for all patients with lung cancer in some regions, and CT morphological features are likely to provide surrogate biomarkers for COPD while evaluating lung cancer.
The lung structural changes in patients with COPD mainly include airway disease, lung parenchymal damage, and vascular remodeling.12 The lung parenchyma microenvironment at the origin of the lung cancer differs between patients with comorbid COPD and those without, thus affecting the morphological phenotype of lung cancer. One study reported that patients with lung cancer and COPD had a higher incidence of spiculation than patients without COPD, and the morphology of spiculation was related to interstitial changes and the degree of emphysema.13 Therefore, we speculate that morphological features of lung cancer may be potential predictors for COPD in patients with lung cancer. Further, chest CT can be used to estimate the extent and distribution of emphysema and to identify bronchial wall thickening and gas retention. Visual assessment of the CT features of the whole lung parenchyma and interstitium can be used to identify COPD.14–16 There are many studies on COPD and lung cancer using CT, but there are few studies focusing on the CT imaging features in comorbid COPD and lung cancer, and none of these studies attempted to explore the diagnostic value of CT morphological features of lung cancer for COPD.
Some important clinical risk factors of COPD (sex, smoking history, etc.) should be taken into consideration simultaneously when analyzing patient data. Nomograms are graphical representations of complex mathematical formulae, and medical nomograms have been regarded as reliable tools to quantify risk by integrating important factors (biological, demographic, and clinical variables) of clinical events.17 To the best of our knowledge, there is currently no nomogram for identifying COPD in patients with lung cancer. The objective of this study was to assess CT morphological features and clinical characteristics that can be useful for identifying COPD and to further develop and validate clinical, imaging, and combined nomograms for identifying comorbid COPD in patients with lung cancer.
Materials and Methods
Patient Population, Demographic and Clinical Data
The patients in this study were recruited from two hospitals. From Hospital 1, 560 patients were recruited retrospectively from June 2014 to March 2020; fifty-four patients were initially enrolled between November 2019 and December 2021 from Hospital 2. The inclusion criteria were as follows: (1) pathologically confirmed lung cancer by surgery or biopsy; (2) complete PFT results; (3) patient underwent PFT and CT within 2 weeks before surgery or biopsy; (4) clinical data integrity. The exclusion criteria were as follows: (1) pathologically confirmed non-primary lung cancer; (2) no thin-slice chest CT images; (3) missing PFT data and inaccurate PFT caused by poor patient cooperation. The patient inclusion procedure is shown in Figure 1. The patients were allocated to the lung cancer with COPD group (COPD group) and the lung cancer without COPD group (non-COPD group). This retrospective study was approved by the Biomedical Research Ethics Committee of Shanghai Changzheng Hospital (Second Affiliated Hospital), Naval Medical University, Shanghai, China (approval number, 2018SL028). Informed patient consent was obtained, and the study was conducted in accordance with the Declaration of Helsinki.
 |
Figure 1 Flowchart of study population. |
In total, 444 cases from Hospital 1 and 54 cases from Hospital 2 were eligible for further analysis. These 498 patients from the two centers were combined into one pool and then randomly divided into a training cohort (n=349) and a validation cohort (n=149) at a ratio of 7:3. Demographic and clinical data included age, sex, smoking status, family lung cancer history, body mass index (BMI) and histological subtypes of lung cancer. BMI was calculated by dividing weight (kg) by the square of height (m). The pathological subtypes of lung cancer were categorized according to the 2015 World Health Organization Classification of Tumors of the Lung.18
Pulmonary Function Testing
PFT was performed using a spirometer (Jaeger/Toennies, Germany) that met the American Thoracic Society criteria. The vital capacity (VC), forced expiratory volume in one second (FEV1), forced vital capacity (FVC), percentage of FEV1 to the predicted value (FEV1%pred), ratio of FEV1 to FVC (FEV1/FVC), and maximum expiratory flow at 25% of the FVC (MEF25) were collected for analysis. FEV1/FVC<0.70 and an increase in FEV1 of less than 200 mL after the use of a bronchodilator was diagnosed as COPD.
CT Image Acquisition
CT examinations in Hospital 1 were conducted using a 256-slice or a 128-slice CT scanner (Brilliance-iCT and Ingenuity CT; Philips Medical Systems, Best, Netherlands). The slice thickness and slice increment were 1 mm. Other scanning parameters have been described in a previous study.19 The patients in Hospital 2 underwent CT examinations using a Somatom Definition AS 64 or 128 CT (Siemens Healthineers, Erlangen, Germany). The slice thickness and slice increment were 2 mm. Other scanning parameters have been reported previously.20 All CT scanning was performed from the thoracic inlet to the middle portion of the kidneys, and non-contrast enhanced images were used for analysis.
Evaluation of CT Morphological Features
Two chest radiologists with three and eight years of experience in thoracic CT interpretation, who were blinded to the patients’ clinical information, reviewed CT images independently. Both radiologists assessed all images of 498 patients in three orthogonal planes (axial, coronal, sagittal). When there were multiple lung cancer nodules, the largest one was evaluated. In cases of discordant interpretations, CT findings were adjudicated by another senior radiologist (with twenty years of experience in chest CT). CT images were read with mediastinal (width, 300 HU; level, 60 HU) and lung (width, 1500 HU; level, −500 HU) window settings. A total of 20 CT morphological features were assessed: location; density; shape; interface; three marginal characteristics including lobulation sign, spiculation sign, and spine-like process sign; six internal characteristics including vacuole sign, cavity sign, cystic airspace, calcification, bronchus cutoff sign, and bronchus dilation/distortion; two features of adjacent structures consisting of pleural indentation sign and vascular convergence sign; the maximum and minimum diameters of the maximum cross section; and three features of the lung parenchyma, including bronchial wall thickening, emphysema in the lobe of lung cancer (ELLC), and emphysema in the remaining lobes (ERL), which were all visually evaluated. The definitions and scoring rules for CT morphological features are described in Supplementary Table S1, and graphical figures of CT morphological features are shown in Supplementary Figure S1. Most of the definitions of morphological features of pulmonary nodules have been previously reported.21
Development of Predictive Nomograms and Statistical Analysis
We performed statistical analyses using the SPSS 23.0 software and R software (version 4.2.1). Statistical tests were two-sided, and the significance level was set at α = 0.05. Differences in all variables between COPD group and non-COPD group were assessed using the Student’s t-test or the Mann–Whitney U-test for continuous variables according to the normality of the data and Fisher’s exact test or chi-square test for categorical variables. Fisher’s exact test or chi-square test was used to compare histological subtypes of lung cancer between non-COPD and COPD groups and between non-emphysema and emphysema groups, as well as the origination of different histological subtypes of lung cancer (from areas with emphysema or without emphysema). The analysis of association between sex and smoking status was performed using the chi-square test and Cramer’s V coefficient.
To develop an optimal nomogram for the identification of COPD in patients with lung cancer, three models were built. Univariable logistic regression was performed to select significant risk variables with P-values<0.05. The selected variables were imported into a multivariate logistic regression. We used the Enter method for variable selection; only variables with P<0.05 and those with important diagnostic value (P>0.05, such as smoking status) were included in the final model. Using this method, a clinical model containing only clinical characteristics and an imaging model containing only imaging features were established. Clinical characteristics and imaging features were incorporated to build a combined model. Three nomograms were drawn from the three models, referred to here as the clinical, imaging, and combined nomograms. Receiver operating characteristic (ROC) curves, which could evaluate the predictive performance of the nomograms, were compared using Delong test. During ROC analyses, the optimized threshold (cut-off value) was determined through Youden index, followed by the calculation of the sensitivity, specificity, accuracy, and positive/negative predictive values (PPV/NPV) for each model. Confusion matrices for the various nomograms to identify COPD were also calculated at multiple thresholds. Calibration curves were used to evaluate the goodness of fit, while decision curve analyses determined the clinical usefulness of the three nomograms.
Results
Clinical Characteristics and Pulmonary Function Parameters
In the training cohort, there were 191 patients with lung cancer with COPD (54.73%) and 158 patients without COPD (45.27%). The clinical characteristics and pulmonary function parameters of the patients are shown in Table 1. Between the COPD and non-COPD groups, there were significant differences in age, sex, and smoking status (P<0.001). There were more current smokers and former smokers in the COPD group than in the non-COPD group (73.58% vs 26.42%, 71.43% vs 28.57%), and the difference was statistically significant (P<0.001). Compared with the non-COPD group, lung cancer with COPD occurred more in men than in women (73.93% vs 25.36%, P<0.001). The patients in the COPD group were significantly older than those in the non-COPD group (P<0.001). Regarding pulmonary function parameters, FEV1, FEV1%pred, FEV1/FVC, and MEF25 in the COPD group were statistically lower than those in the non-COPD group (P<0.001). Differences in clinical variables between patients from the two hospitals are listed in Supplementary Table S2.
 |
Table 1 Clinical Characteristics and Pulmonary Function Parameters in the Training and Validation Cohort |
Comparison of Histological Subtypes of Lung Cancer
In both groups, the most common histologic subtype was adenocarcinoma. In the training cohort, adenocarcinoma was more frequently found in the non-COPD group than in the COPD group (89.87% vs 65.45%). On the contrary, compared with adenocarcinoma, squamous cell carcinoma and small-cell carcinoma were more frequent in the COPD group (21.99% vs 3.16% and 4.71% vs 0.63%, P<0.05; Supplementary Table S3). As shown in Supplementary Table S4, adenocarcinoma was more common in patients without emphysema, while squamous and small-cell carcinoma were more frequently found in patients with emphysema (P<0.05). As shown in Supplementary Table S5, squamous and small-cell carcinoma more frequently originated from areas with emphysema, whereas adenocarcinoma showed the opposite (P<0.05).
Comparison of CT Morphological Features
The comparisons of CT morphological features between the COPD and non-COPD groups are shown in Table 2. There were 13 morphological features with statistical differences between the two groups (P<0.05) in the training cohort. Compared with the non-COPD group, COPD was found more frequently in patients with lung cancer with solid density, coarse interface, spiculation, spine-like process, calcification, bronchus cutoff sign, bronchus dilation/distortion, pleural indentation sign, larger maximum diameter, larger minimum diameter, bronchial wall thickening, ELLC, and ERL. There were no differences in location, shape, lobulation sign, vacuole sign, cavity sign, cystic airspace, and vessel convergence sign between the non-COPD and COPD groups.
 |
Table 2 Comparison of CT Morphological Features Between Non-COPD and COPD Groups |
Development of Predictive Models, Nomograms, and Performance Evaluation
Based on the multiple logistic regression (Table 3), the clinical characteristics of age and sex were included in the clinical model. The CT morphological features of interface, bronchus cutoff sign, spine-like process, spiculation sign, and bronchial wall thickening were included in the imaging model. The combined model was developed with age, sex, interface, bronchus cutoff sign, spine-like process, spiculation sign. These three models were displayed as clinical nomogram, imaging nomogram and combined nomogram respectively, as shown in Figure 2A–C.
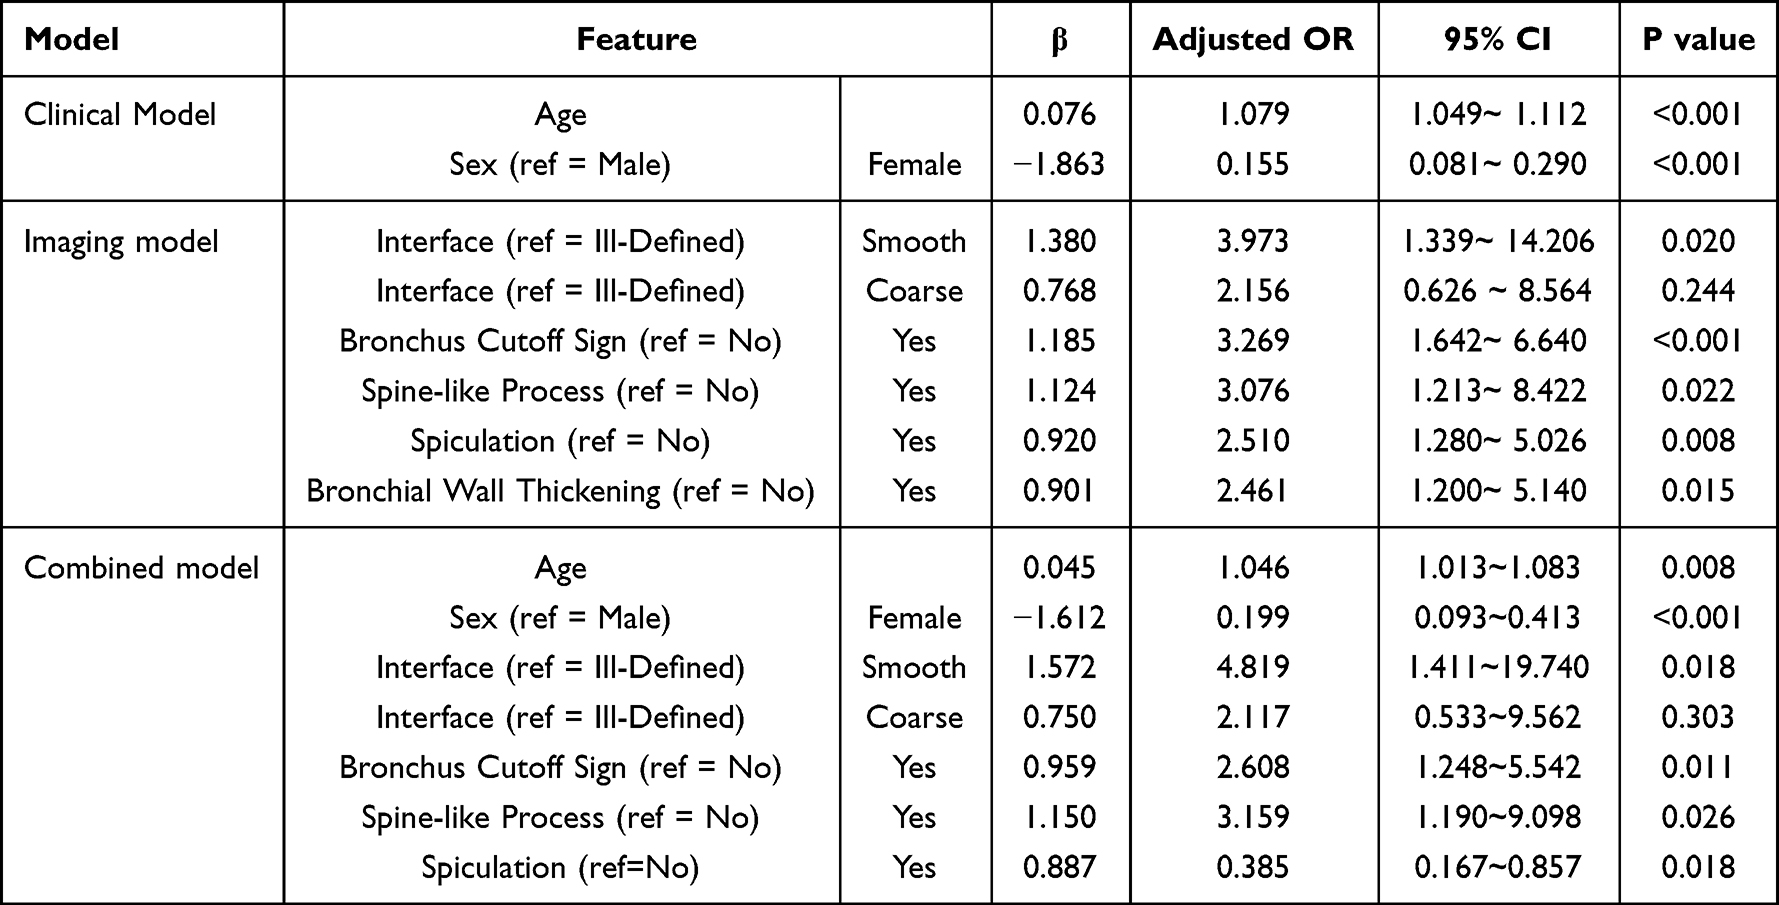 |
Table 3 Multiple Logistic Regression Analysis of Clinical Characteristics and Morphological Features |
 |
Figure 2 Nomograms for the diagnostic models. (A) Clinical nomogram; (B) Imaging nomogram; (C) Combined nomogram. By adding up the points for each variable to get the total points and locating it on the total point axis, it will be easily able to draw a straight line down to find the patient’s risk of concomitant COPD. |
According to ROC curve analysis of the three nomograms in the training cohort (Figure 3A and Table 4), at the optimal threshold (cut-off value=0.569), the clinical nomogram showed good performance for identifying COPD in patients with lung cancer (AUC, 0.807; 95% confidence interval [CI], 0.761–0.854; sensitivity, 79.06%; specificity, 73.42%; accuracy, 76.50%); while the imaging nomogram showed slightly better performance at the optimal threshold (AUC, 0.814; 95% CI, 0.770–0.858; sensitivity, 72.77%; specificity, 78.48%; accuracy, 75.36%; cut-off value, 0.592). For the combined nomogram generated with clinical and imaging features, the performance was further improved (AUC, 0.863; 95% CI, 0.824–0.903; sensitivity, 80.10%; specificity, 81.01%; accuracy, 80.52%; cut-off value, 0.580).
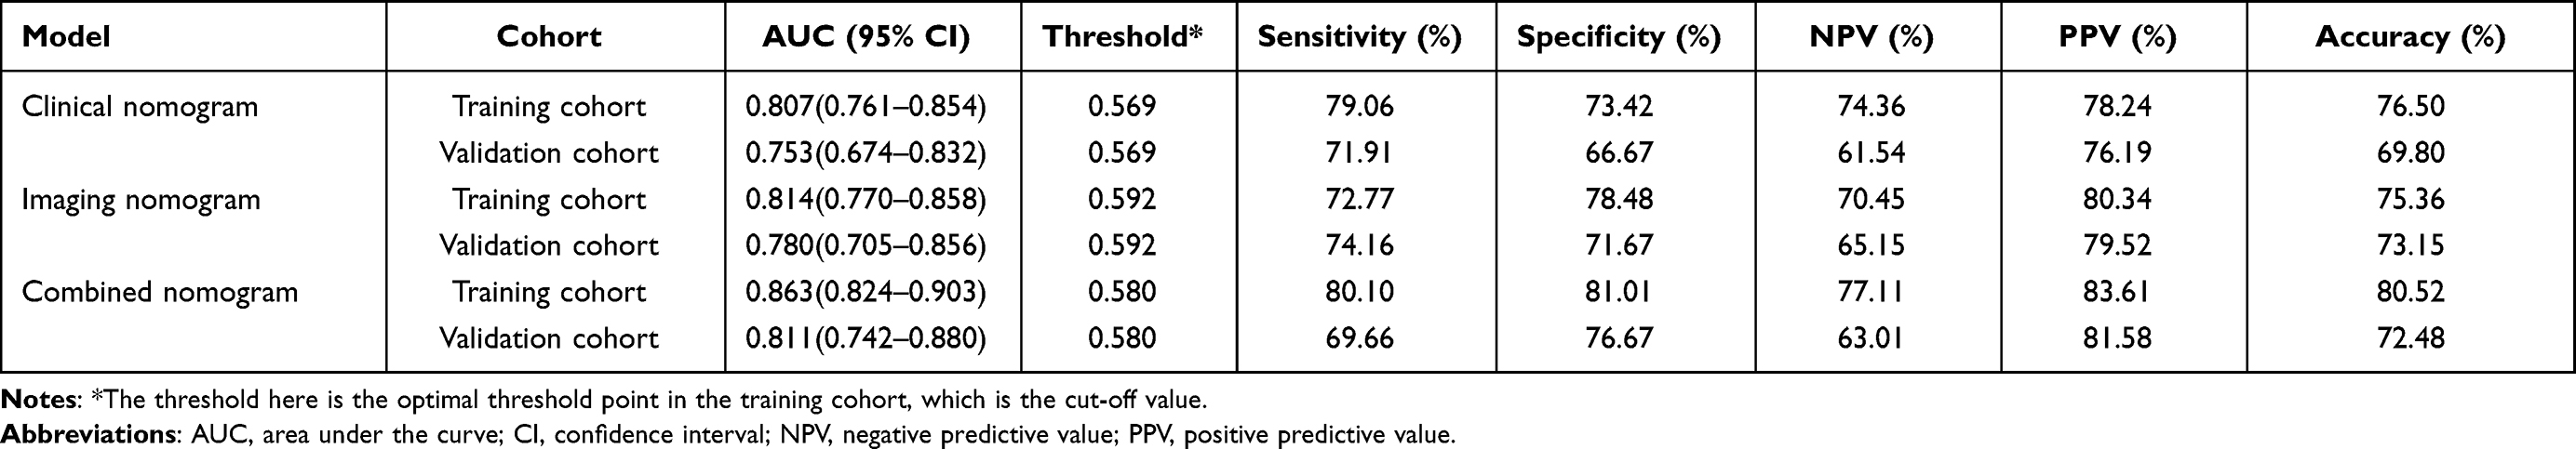 |
Table 4 Predictive Performance of Different Nomograms in the Training and Validation Cohort |
 |
Figure 3 ROC curve analysis of the three nomograms. (A) the training cohort; (B) the validation cohort. |
Smoking is an important risk factor for COPD;1,2 however, smoking status was not included in the clinical and combined nomograms (P>0.05). We tested the association between sex and smoking status and found a strong association in both the training and validation cohorts (Cramer’s V=0.606, 0.636, respectively; P<0.001). To explore whether adding smoking status and an interaction term (sex×smoking status) could improve the performance of the nomograms, we added smoking status and smoking status+interaction term to the clinical and combined nomograms and conducted ROC curve analysis. As Supplementary Table S6 shows, adding smoking status or adding smoking status+interaction item did not significantly improve the diagnostic performance of the clinical and combined nomogram, especially in the validation cohort (Delong test, P>0.05). Therefore, the nomograms that we ultimately built did not include smoking status or this interaction term.
Validation of Nomograms and Comparison of Performance
In the validation cohort, the combined nomogram had good diagnostic value at the optimal threshold (AUC, 0.811; 95% CI, 0.742–0.880; specificity, 76.67%; PPV, 81.58%). The combined nomogram was superior to the clinical (AUC, 0.753; 95% CI, 0.674–0.832) and the imaging nomograms (AUC, 0.780; 95% CI, 0.705–0.856) in the validation cohort, as shown in Figure 3B and Table 4. Delong tests showed significant differences between the combined nomogram and the other nomograms in the training cohort (P<0.05; Supplementary Table S7). At most thresholds, there were more true negative predictions and higher accuracy for the combined nomogram compared with the clinical nomogram in the validation cohort, as shown in Table 5. At the risk thresholds of 20%, 40%, and 60%, the combined nomogram assigned the correct status to 68.46%, 73.15%, and 73.15% of the subjects, respectively, in the validation cohort; while the clinical nomogram classified 62.42%, 67.11%, and 71.14% of the subjects into the correct categories, respectively.
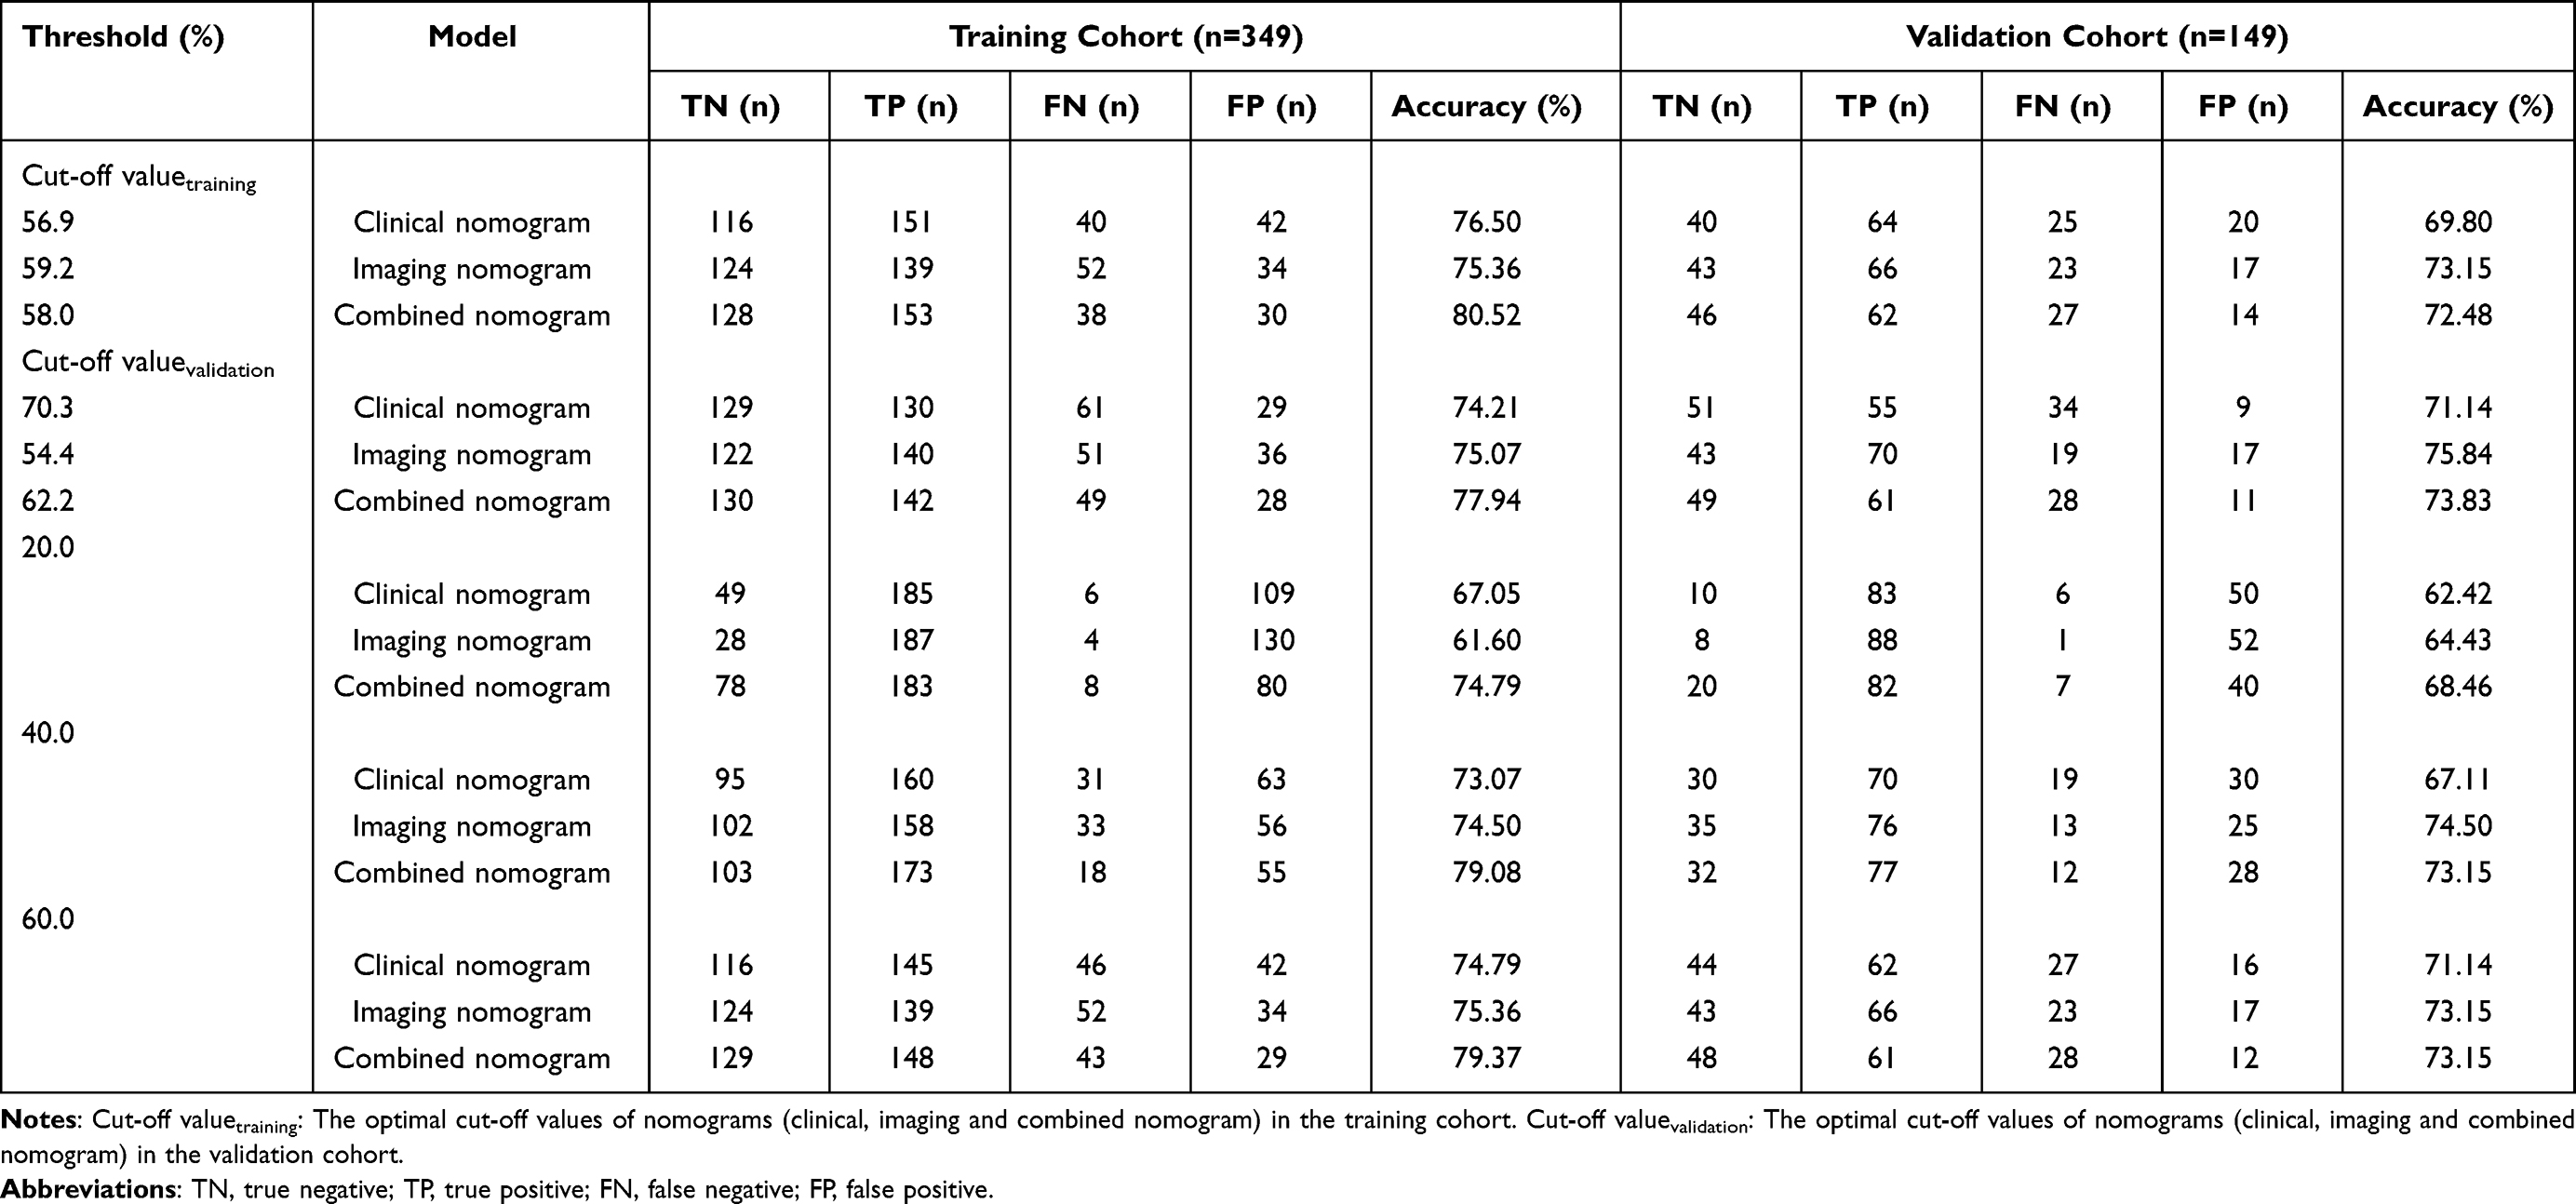 |
Table 5 Confusion Matrices for the Various Nomograms to Identify COPD at Multiple Thresholds |
The calibration curves presented an excellent and best agreement for the combined nomogram in the training cohort and an acceptable agreement in the validation cohort between the nomogram prediction and actual observation for predicting COPD (Figure 4 and Supplementary Figure S2). Decision curves indicated that at a threshold probability ranging from approximately 10–73% in the validation cohort, the combined nomogram model can be beneficial for identifying COPD in patients with lung cancer (Figure 5). Besides, decision curves showed that the combined nomogram had a higher net benefit than the clinical and the imaging nomograms across the majority of the range of reasonable threshold probabilities (21–22%, 33–41% and 45–71% in the validation cohort). Figure 6 shows how the combined nomogram can be used in clinical practice to identify COPD comorbidity in patients with lung cancer.
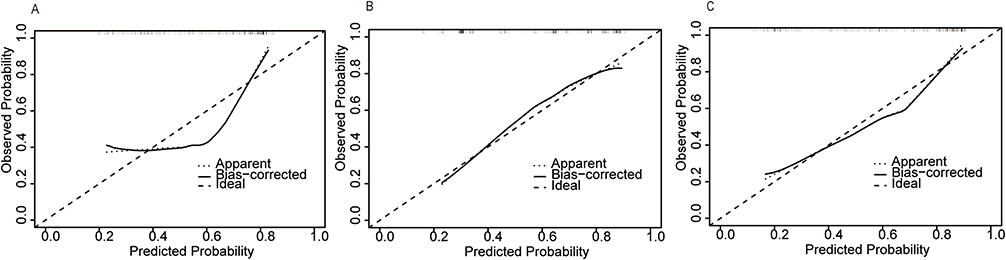 |
Figure 4 Calibration curves of the three nomograms in the validation cohort. (A–C) the clinical nomogram, the imaging nomogram, and the combined nomogram in the validation cohort, respectively. Estimated risk of COPD is plotted on the x-axis; the observed outcome of COPD is plotted on the y-axis. The diagonal dotted line represents a perfect prediction by an ideal model. The solid line represents the performance of the nomogram in which a closer fit to the diagonal dotted line represents a better estimation. |
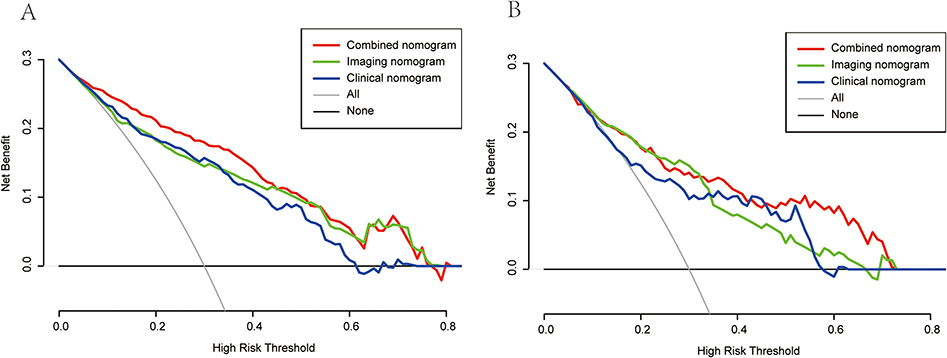 |
Figure 5 Decision curves of the three nomograms. (A) the training cohort; (B) the validation cohort. The oblique gray line represents the assumption that all patients combine with COPD. The horizontal black line represents the assumption that no patients combine with COPD. The red, green and blue lines represent the net benefit of using the three nomograms to predict COPD, respectively. The combined nomogram had the highest net benefit compared with both the other nomograms and simple strategies such as intervening all patients (oblique gray line) or no patients (horizontal black line) across the majority of the range of threshold probabilities. |
 |
Figure 6 Practical applications of the combined nomogram. (A–C) A 33-year-old female patient with minimally invasive adenocarcinoma and without COPD (FEV1/FVC=0.93). (A) A smooth ground glass nodule without spiculation, spine-like process and bronchus cutoff sign. (B) Lung density analysis diagram shows there is no emphysema area in both lungs. (C) The combined nomogram shows the total points is 286, and the prediction probability of COPD is 0.0476. (D–F) A 70-year-old male patient with invasive adenocarcinoma and COPD (FEV1/FVC=0.65). (D) A coarse mass with spiculation, spine-like process and bronchus cutoff sign. (E) Lung density analysis diagram shows multiple emphysema areas in both lungs (red areas represent areas of bronchi or emphysema). (F) The combined nomogram shows the total points is 456, and the prediction probability of COPD is 0.947. |
Discussion
In the present study, age, sex, interface, bronchus cutoff sign, spine-like process, and spiculation sign were independent predictors of COPD in patients with lung cancer. Further, we developed and compared three nomograms for identifying COPD in patients with lung cancer using multi-center data. The combined nomogram generated with both clinical and imaging features outperformed the imaging and clinical nomograms at most risk thresholds, and this was verified in the validation cohort. Therefore, the combined nomogram is an easy-to-use instrument to detect COPD in patients with lung cancer.
Lung cancer is one of the most common comorbidities of COPD.1 Lung cancer comorbid with COPD is associated with poor OS, and the OS of lung cancer worsens with an increased COPD severity.10,22 Further, patients with comorbid lung cancer and COPD have a higher incidence of postoperative complications compared to those without COPD.10 If patients with lung cancer have COPD and severe pulmonary dysfunction, it is necessary to improve lung function before undergoing surgical treatment. During surgery, more lung volume will also be retained to ensure postoperative residual lung function. Therefore, correct identification of COPD in patients with lung cancer is helpful to optimize clinical treatment decisions, such as selecting the appropriate surgical timing and determining a more appropriate surgical scope, which may improve the prognosis of patients with COPD and lung cancer. A large amount of epidemiological evidence has shown that male sex, high age, positive smoking status, low BMI, and a positive parental history of respiratory diseases are major risk factors for COPD.2,23 In the present study, we found that patients with lung cancer with male sex, high age, and a positive history of smoking were more likely have comorbid COPD, which is similar to the conclusions of previous studies. Moreover, age and sex were independent predictors of COPD in patients with lung cancer, but smoking status was not (P>0.05), which is regarded as the most important risk factor for COPD.1,2 We found that sex was strongly associated with smoking status, so we speculated that the association between sex and smoking may explain why smoking was not included in the regression model.
To the best of our knowledge, there are few studies comparing the imaging manifestations of lung cancer between patients with and without COPD. A series of changes in lung structure in COPD affect the blood and oxygen supply to lung carcinomas, leading to changes in the biological behavior of lung cancer cells and further affecting the morphological appearance of lung cancer on CT images. In the present study, COPD was found more frequently in lung cancer with coarse interface, bronchus cutoff sign, spine-like process, spiculation sign, and bronchial wall thickening. Most of these features are signs of malignant pulmonary nodules, indicating that lung cancer with comorbid COPD has more malignant signs. This was supported by a previous study in which poorly differentiated lung cancers were more common in patients with COPD than in a non-COPD group, suggesting that COPD-related lung cancers may have higher malignant potential.24 Hou et al13 found that the incidence of spiculation in patients with lung cancer with COPD was higher than in those without COPD, and the present study also had similar findings. This may be due to the destruction of alveolar walls caused by emphysema as well as the rapid growth of tumor cells along the defective pulmonary interstitium; tumor cells are more likely to invade outward. Therefore, spiculation sign, spine-like process and coarse interface are more likely to appear in patients with COPD. One study25 found that 65% of benign nodules in patients with emphysema were misdiagnosed as malignant because the nodules were surrounded by emphysema. In patients with emphysema, malignant signs also appeared in benign nodules, and there were no significant differences between benign and malignant nodules in signs such as lobulation sign, spiculation sign, and ground glass opacity. This suggests that an emphysema background contributes to more malignant features in pulmonary nodules.
In the present study, the incidences of squamous and small-cell lung cancer in the COPD group were significantly higher than those in the non-COPD group. Additionally, squamous and small-cell carcinoma was more frequently found in patients with emphysema, and squamous and small-cell carcinoma more frequently originated from lobes with emphysema than lobes without. Some studies have reached the same conclusion. Smith et al11 analyzed the relationship between the degree of emphysema and the histopathological type of lung cancer and found that the occurrence of emphysema was associated with an increased incidence of squamous and small-cell carcinoma but was not associated with the incidence of adenocarcinoma. Another study reported that adenocarcinoma was more frequently seen in areas without emphysema, while squamous cell carcinoma was more frequently found in areas with emphysema than those without (61% vs 18%, P<0.001).26
By displaying intuitive graphs of predictive models, nomograms easily provide the probability of clinical events, such as the diagnosis of malignant nodule, epidermal growth factor receptor mutation, and OS.27–29 The three COPD prediction nomograms established in the present study all showed good prediction efficiency, and the combined nomogram generated with clinical and imaging features had the best performance and good clinical applicability. Kotz et al30 developed and validated a risk prediction model for general practitioner-recorded diagnosis of COPD. The model was composed of age, smoking status, level of deprivation, and asthma history. The AUC of the model was 0.845 for females and 0.832 for males. The AUC of the combined nomogram in the present study (0.863) was higher than those in Kotz et al’s study, which may be due to the inclusion of more variables in our study, including imaging features. In lung cancer screening, another study15 added three quantitative CT biomarkers (emphysema, air trapping, bronchial wall thickness) to a clinical model to identify COPD, and diagnostic performance improved greatly. The full model yielded an accuracy of 82.8% and a specificity of 88.8%, slightly better than the present study’s nomograms. They introduced more reliable quantitative COPD-related features; therefore, future studies should use quantitative radiomics features of the whole lung and pulmonary nodule to identify COPD.
There are some limitations to the present study. First, this study was retrospective, which may cause potential bias. Second, only three subjectively evaluated imaging features related to COPD were analyzed in this study, which lacked a full description of imaging manifestations of COPD. The quantitative parameters of emphysema, small airways, and pulmonary vessels should be further added to improve the prediction efficiency of the model. Third, this study only included subjective features evaluated with the naked eye and lacked more subtle features to comprehensively analyze image information. Therefore, we intend to use radiomics to identify COPD in patients with lung cancer in a future study. Fourth, the nomograms we proposed can only be used in patients with lung cancer, and their utility is thus limited. Nevertheless, one-stop chest CT can early screen potential patients with COPD, especially for lung cancer patients without COPD symptoms and without undergoing PFT. Our team is developing a COPD prediction model based on whole-lung features, which could be applied in various cases. Finally, the nomograms we created currently do not automatically output the probability of COPD, because these would require radiologists to spend additional time to evaluate the features. Now, we are developing structured reports in an attempt to transform them into a model that can automatically output the probability of COPD. By using structured reports provided to patients, imaging features can be automatically extracted from text, eliminating the need for radiologists to spend additional time on secondary evaluation.
Conclusion
In conclusion, some CT morphological features and clinical characteristics can be used to identify COPD. The combined nomogram derived from clinical and morphological features showed the optimal predictive performance, which outperformed the clinical and imaging nomograms. The combined nomogram provides a useful surrogate tool for COPD diagnosis in patients with lung cancer in routine practice with one-stop CT scanning.
Abbreviations
COPD, Chronic obstructive pulmonary disease; PFT, Pulmonary function test; CT, Computed tomography; BMI, Body mass index; VC, Vital capacity; FEV1, Forced expiratory volume in one second; FVC, Forced vital capacity; FEV1%pred, the percentage of FEV1 to the predicted value; MEF25, Maximum expiratory flow at 25% of the FVC; ELLC, Emphysema in the lobe of lung cancer; ERL, Emphysema in the remaining lobes; ROC, Receiver operating characteristic; AUC, Area under the curve; CI, Confidence interval; OS, Overall survival.
Data Sharing Statement
The data supporting the conclusion of this article are included within the article. All data are available from the corresponding author upon reasonable request.
Acknowledgments
We thank the sponsors who provide financial support for the conduct of the research. The details of the sponsors are described below.
Author Contributions
Shiyuan Liu and Li Fan are co-corresponding authors. All authors made a significant contribution to the work reported, whether that is in the conception, study design, execution, acquisition of data, analysis and interpretation, or in all these areas; took part in drafting, revising or critically reviewing the article; gave final approval of the version to be published; have agreed on the journal to which the article has been submitted; and agree to be accountable for all aspects of the work.
Funding
This study was sponsored by National Key R&D Program of China [grant numbers 2022YFC2010002, 2022YFC2010000]; Shanghai Sailing Program [grant number 20YF1449000]; the National Natural Science Foundation of China [grant numbers 81871321, 81930049, 82171926, 81871405]; the Youth Fund of the National Natural Science Foundation of China [grant numbers 82202140, 82001812]; Pyramid Talent Project of Shanghai Changzheng Hospital; the program of Science and Technology Commission of Shanghai Municipality [grant numbers 19411951300, 21DZ2202600]; Medical imaging database construction program of National Health Comission [grant number YXFSC2022JJSJ002]; and the clinical Innovative Project of Shanghai Changzheng Hospital [grant number 2020YLCYJ-Y24]. The funders have no role in the study design, data collection, data analysis and writing the manuscripts.
Disclosure
The authors declare that we have no known competing financial interests or other conflict of interests that could influence our work reported in this paper.
References
1. Rabe KF, Watz H. Chronic obstructive pulmonary disease. Lancet. 2017;389:1931–1940. doi:10.1016/S0140-6736(17)31222-9
2. Wang C, Xu J, Yang L, et al. Prevalence and risk factors of chronic obstructive pulmonary disease in China (the China Pulmonary Health [CPH] study): a national cross-sectional study. Lancet. 2018;391(10131):1706–1717. doi:10.1016/S0140-6736(18)30841-9
3. Siegel RL, Miller KD, Fuchs HE, et al. Cancer Statistics, 2021. CA Cancer J Clin. 2021;71(1):7–33. doi:10.3322/caac.21654
4. Sung H, Ferlay J, Siegel RL, et al. Global cancer statistics 2020: GLOBOCAN estimates of incidence and mortality worldwide for 36 cancers in 185 countries. CA Cancer J Clin. 2021;71(3):209–249. doi:10.3322/caac.21660
5. Wang Z, Seow WJ, Shiraishi K, et al. Meta-analysis of genome-wide association studies identifies multiple lung cancer susceptibility loci in never-smoking Asian women. Hum Mol Genet. 2016;25:620–629. doi:10.1093/hmg/ddv494
6. Wang ZL. Association between chronic obstructive pulmonary disease and lung cancer: the missing link. Chin Med J. 2013;126(1):154–165.
7. Huang YQ, Zhu M, Ji MM, et al. Air pollution, genetic factors, and the risk of lung cancer: a prospective study in the UK biobank. Am J Respir Crit Care Med. 2021;204(7):817–825. doi:10.1164/rccm.202011-4063OC
8. Carr LL, Jacobson S, Lynch DA, et al. Features of COPD as predictors of lung cancer. Chest. 2018;153(6):1326–1335. doi:10.1016/j.chest.2018.01.049
9. Schwartz AG, Lusk CM, Wenzlaff AS, et al. Risk of lung cancer associated with COPD phenotype based on quantitative image analysis. Cancer Epidemiol Biomarkers Prev. 2016;25(9):1341–1347. doi:10.1158/1055-9965.EPI-16-0176
10. Shibazaki T, Odaka M, Noda Y, et al. Effect of comorbidities on long-term outcomes after thoracoscopic surgery for stage I non-small-cell lung cancer patients with chronic obstructive pulmonary disease. J Thorac Dis. 2018;10:909–919. doi:10.21037/jtd.2018.01.57
11. Smith BM, Schwartzman K, Kovacina B, et al. Lung cancer histologies associated with emphysema on computed tomography. Lung Cancer. 2012;76(1):61–66. doi:10.1016/j.lungcan.2011.09.003
12. Berg K, Wright JL. The pathology of chronic obstructive pulmonary disease: progress in the 20th and 21st centuries. Arch Pathol Lab Med. 2016;140(12):1423–1428. doi:10.5858/arpa.2015-0455-RS
13. Hou SF, Ma DQ. CT manifestations of spicular sign in peripheral lung cancer under background complicated by inters tisial lung disease and chronic obstructive pulmonary disease. Pract Radio. 2012;28(7):1015–1018. Chinese.
14. Ungurean I, Tudorache V, Mogoşeanu M, et al. Aportul tehnicilor de radioimagistiă înţelegerea mecanismelor fiziopatologice din bronhopneumopatia obstructivă cronică. Partea I. Aportul imagisticii în investigarea leziunilor aparatului respirator caracteristice determinate de BPOC [The role of radio-imaging techniques in the investigation of the pathophysiologic mechanisms in chronic obstructive bronchopneumonia. Part I. Role of imaging in the investigation of respiratory lesions caused by COPD]. Pneumologia. 2010;59(3):144–151. Romanian.
15. Mets OM, Schmidt M, Buckens CF, et al. Diagnosis of chronic obstructive pulmonary disease in lung cancer screening Computed Tomography scans: independent contribution of emphysema, air trapping and bronchial wall thickening. Respir Res. 2013;14(1):59. doi:10.1186/1465-9921-14-59
16. McDonough JE, Yuan R, Suzuki M, et al. Small-airway obstruction and emphysema in chronic obstructive pulmonary disease. N Engl J Med. 2011;365(17):1567–1575. doi:10.1056/NEJMoa1106955
17. Liang W, Zhang L, Jiang G, et al. Development and validation of a nomogram for predicting survival in patients with resected non-small-cell lung cancer. J Clin Oncol. 2015;33(8):861–869. doi:10.1200/JCO.2014.56.6661
18. Travis WD, Brambilla E, Burke AP, Marx A, Nicholson AG. Introduction to the 2015 world health organization classification of tumors of the lung, pleura, thymus, and heart. J Thorac Oncol. 2015;10(9):1240–1242.
19. Fan L, Fang M, Tu W, et al. Radiomics signature: a biomarker for the preoperative distant metastatic prediction of stage I nonsmall-cell lung cancer. Acad Radiol. 2019;26(9):1253–1261. doi:10.1016/j.acra.2018.11.004
20. Ma Y, Li J, Xu X, Zhang Y, Lin Y. The CT delta-radiomics based machine learning approach in evaluating multiple primary lung adenocarcinoma. BMC Cancer. 2022;22(1):949. doi:10.1186/s12885-022-10036-1
21. Fan L, Liu SY, Li QC, Yu H, Xiao XS. Multidetector CT features of pulmonary focal ground-glass opacity: differences between benign and malignant. Br J Radiol. 2012;85(1015):897–904. doi:10.1259/bjr/33150223
22. Gao YH, Guan WJ, Liu Q, et al. Impact of COPD and emphysema on survival of patients with lung cancer: a meta-analysis of observational studies. Respirology. 2016;21(2):269–279. doi:10.1111/resp.12661
23. Yang Y, Mao J, Ye Z, et al. Risk factors of chronic obstructive pulmonary disease among adults in Chinese mainland: a systematic review and meta-analysis. Respir Med. 2017;131:158–165. doi:10.1016/j.rmed.2017.08.018
24. Kondo R, Yoshida K, Eguchi T, et al. Clinical features of lung cancer in smokers with light and mild chronic obstructive pulmonary disease: a retrospective analysis of Japanese surgical cases. Eur J Cardiothorac Surg. 2011;40(6):1439–1443. doi:10.1016/j.ejcts.2011.03.017
25. Matsuoka S, Kurihara Y, Yagihashi K, et al. Peripheral solitary pulmonary nodule: CT findings in patients with pulmonary emphysema. Radiology. 2005;235(1):266–273. doi:10.1148/radiol.2351040674
26. Shin B, Shin S, Chung MJ, et al. Different histological subtypes of peripheral lung cancer based on emphysema distribution in patients with both airflow limitation and CT-determined emphysema. Lung Cancer. 2017;104:106–110. doi:10.1016/j.lungcan.2016.12.009
27. Liu A, Wang Z, Yang Y, et al. Preoperative diagnosis of malignant pulmonary nodules in lung cancer screening with a radiomics nomogram. Cancer Commun. 2020;40(1):16–24. doi:10.1002/cac2.12002
28. Tu W, Sun G, Fan L, et al. Radiomics signature: a potential and incremental predictor for EGFR mutation status in NSCLC patients, comparison with CT morphology. Lung Cancer. 2019;132:28–35. doi:10.1016/j.lungcan.2019.03.025
29. Wang S, Yang L, Ci B, et al. Development and validation of a nomogram prognostic model for SCLC patients. J Thorac Oncol. 2018;13(9):1338–1348. doi:10.1016/j.jtho.2018.05.037
30. Kotz D, Simpson CR, Viechtbauer W, et al. Development and validation of a model to predict the 10-year risk of general practitioner-recorded COPD. NPJ Prim Care Respir Med. 2014;24:14011. doi:10.1038/npjpcrm.2014.11
 © 2023 The Author(s). This work is published and licensed by Dove Medical Press Limited. The
full terms of this license are available at https://www.dovepress.com/terms
and incorporate the Creative Commons Attribution
- Non Commercial (unported, 3.0) License.
By accessing the work you hereby accept the Terms. Non-commercial uses of the work are permitted
without any further permission from Dove Medical Press Limited, provided the work is properly
attributed. For permission for commercial use of this work, please see paragraphs 4.2 and 5 of our Terms.
© 2023 The Author(s). This work is published and licensed by Dove Medical Press Limited. The
full terms of this license are available at https://www.dovepress.com/terms
and incorporate the Creative Commons Attribution
- Non Commercial (unported, 3.0) License.
By accessing the work you hereby accept the Terms. Non-commercial uses of the work are permitted
without any further permission from Dove Medical Press Limited, provided the work is properly
attributed. For permission for commercial use of this work, please see paragraphs 4.2 and 5 of our Terms.