Back to Journals » Journal of Inflammation Research » Volume 17
Nomogram and Web Calculator Based on Lasso-Logistic Regression for Predicting Persistent Organ Failure in Acute Pancreatitis Patients
Authors Gao X ![]() , Xu J, Xu M
, Xu J, Xu M ![]() , Han P, Sun J, Liang R, Mo S, Tian Y
, Han P, Sun J, Liang R, Mo S, Tian Y
Received 31 October 2023
Accepted for publication 23 January 2024
Published 7 February 2024 Volume 2024:17 Pages 823—836
DOI https://doi.org/10.2147/JIR.S445929
Checked for plagiarism Yes
Review by Single anonymous peer review
Peer reviewer comments 2
Editor who approved publication: Professor Ning Quan
Xin Gao,1 Jiale Xu,2 Musen Xu,2 Pengzhe Han,2 Jingchao Sun,2 Ruifeng Liang,1 Shaojian Mo,2,* Yanzhang Tian2,*
1School of Public Health, Shanxi Medical University, Taiyuan, People’s Republic of China; 2Department of Biliary and Pancreatic Surgery, Shanxi Academy of Medical Sciences, Tongji Shanxi Hospital, Shanxi Bethune Hospital, Third Hospital of Shanxi Medical University, Taiyuan, People’s Republic of China
*These authors contributed equally to this work
Correspondence: Shaojian Mo; Yanzhang Tian, Shanxi Bethune Hospital, Shanxi Academy of Medical Sciences, Tongji Shanxi Hospital, Third Hospital of Shanxi Medical University, Taiyuan, People’s Republic of China, Tel +8619834514208 ; +8613903512030, Email [email protected]; [email protected]
Purpose: Acute pancreatitis is a common gastrointestinal emergency. Approximately 20% of patients with acute pancreatitis develop organ failure, which is significantly associated with adverse outcomes. This study aimed to establish an early prediction model for persistent organ failure in acute pancreatitis patients using 24-hour admission indicators.
Patients and Methods: Clinical data and 24-h laboratory indicators of patients diagnosed with acute pancreatitis from January 1, 2017 to January 1, 2022 in Shanxi Bethune Hospital were collected. Patients from 2017 to 2021 were used as the training cohort to establish the prediction model, and patients from 2021 to 2022 were used as the validation cohort. Univariate logistic regression and LASSO regression were used to establish prediction models. The performance of the model was evaluated using area under the curve (AUC), calibration curves, and decision curve analysis (DCA), and subsequently validated in the validation group.
Results: A total of 1166 patients with acute pancreatitis were included, a total of 145 patients suffered from persistent organ failure from 2017 to 2021. Data were initially selected for 100 variables, and after inclusion and exclusion, 46 variables were used for further analysis. Two prediction models were established and nomogram was drawn respectively. After comparison, the prediction values of the two models were similar (The univariate model AUC was 0.867, 95% CI (0.834– 0.9). The LASSO model AUC was 0.864, 95% CI (0.828– 0.895)), and the model established by LASSO regression was more parsimonious. A web calculator was developed using the model established by LASSO.
Conclusion: Predictive model including 6 risk indicators can be used to predict the risk of persistent organ failure in patients with acute pancreatitis.
Keywords: prediction model, LASSO regression, acute pancreatitis, nomogram, organ failure
Introduction
Acute Pancreatitis (AP) is a commonly encountered gastrointestinal emergency in the clinical setting. It refers to an acute abdominal condition caused by the abnormal activation of pancreatic enzymes, leading to self-digestion of the pancreas. Its primary feature is a localized inflammatory response within the pancreas. In severe cases, it can result in the dysfunction of other organs. Its hallmark clinical symptom is a sudden onset of persistent upper abdominal pain, which may radiate to the back.1 With the rise in living standards in recent years, the incidence of AP has been steadily increasing. Globally, the incidence of AP ranges from 4.9 to 73.4 per 100,000,1 and it’s rising at an annual rate of 3.07%.2 AP is progressively becoming a significant disease threatening human health and deserves attention. Studies have shown that approximately 20% of AP patients can develop Organ Failure (OF), with respiratory, renal, and cardiac dysfunctions being most common.3 OF is a critical determinant of the prognosis of AP and, to a large extent, dictates the outcome for AP patients. OF lasting ≤48 hours typically carries a lower risk of complications and mortality. However, patients with Persistent Organ Failure (POF) (lasting >48 hours) face a mortality rate as high as 50%.4 Therefore, early prediction and assessment of the potential development of POF in AP patients and providing timely treatment are crucial in reducing mortality from AP.
In 1974, Ranson proposed the Ranson scoring system after studying 100 patients with AP who were admitted to hospital for 48 hours.5 The scoring system included 5 clinical indicators on admission and 1 point for each of the 6 indicators for 48 hours, totaling 11 points, and the score of 3 and above was considered as severe pancreatitis, and the morbidity and mortality rate of less than 3 points was 0.9%, 3–4 points was 16%, 5–6 points was 40%, and 6 points or more points is 100%, and its scoring system is considered a milestone in the estimation of the severity of AP. However, this scoring system is limited in its clinical application for predicting POF, with non-ICU patients not routinely collecting all data points at the time of data collection and calculating a score that takes at least 48h with an accuracy of approximately 75%.6 The APACHE II score is a patient prognostic prediction score proposed by Knaus et al.7 This score is not an exclusive scoring system for AP and it can be applied to almost all ICU patients, where a score of ≥8 on the APACHE II scale indicates the possible presence of severe pancreatitis. The APACHE score is highly sensitive, but many of its parameters require the ICU setting to be measured and the scoring system is too examinative, cumbersome, and expensive, and is also time-delayed, with deficiencies in the prediction of POF.8 The CTSI is also a useful scoring system for accurately diagnosing the severity pancreatitis. However, CT may underestimate or misclassify the severity of the disease if performed within 72 hours of symptom onset.9 All of these scores are either delayed for POF or lack sufficient research evidence and are inadequate. A recent systematic review and meta-analysis concluded that current early predictors of POF, infected pancreatic necrosis and mortality are not sufficiently accurate for individualized patient prediction, and that ideal predictors should be applied to patients on admission or within 24 hours of symptom onset, with an accuracy of between 95% - 100%.10
In recent years, there has been a keen interest in identifying predictive factors for diseases to recognize clinical indicators that threaten human health as early as possible. Statisticians are focused on developing and refining modern statistical methods to ensure the selection of rigorous methods for estimating the impact of predictive factors on outcomes. However, most variable selection processes rely on more traditional statistical methods, such as univariate and multivariate regression analyses. These methods sometimes yield contradictory hazard ratios between univariate and multivariate COX regressions. This contradiction arises from multicollinearity among variables, leading to biased results.11 In 1996, Robert Tibshirani introduced a novel method for estimating linear models, known as the Least Absolute Shrinkage and Selection Operator (LASSO).12 This approach accommodates a plethora of covariates in the model and addresses overfitting by constructing a penalty function.13 It also resolves issues of multicollinearity, yielding more relevant predictive factors, thus compensating for the shortcomings of traditional methods.14 However, the application of LASSO regression in the realm of AP remains limited. In this paper, we employ LASSO regression to select predictive factors and integrate it with multivariate logistic regression to mitigate the interference of confounding factors, ensuring the acquisition of precise predictive variables. The results are visualized in the form of a nomogram.
The aim of this study is to establish a prediction model based on LASSO-logistic regression for predicting POF in AP patients. This will enable early identification of high-risk individuals for POF using patient indicators within the first 24 hours of admission, guiding clinicians to tailor timely and individualized therapeutic measures for high-risk patients, thereby enhancing their prognosis.
Materials and Methods
Patients
We collected patients with a first diagnosis of AP from January 1, 2017, to January 1, 2022, at Shanxi Bethune Hospital. Patients from 1/1/2017 to 1/1/2021 were used to build the model and patients from 1/1/2021 to 1/1/2022 were used to validate the model.
The diagnostic criteria for AP include the followings: ① continuous upper abdominal pain; ② serum amylase and/or lipase levels more than 3 times the upper limit of normal; ③ abdominal imaging findings consistent with acute pancreatitis. A diagnosis of AP can be made if any two of these three criteria are met.15
The diagnostic criteria for OF are based on the modified Marshall scoring system,16 where a score of ≥2 for any organ indicates the presence of OF. OF that persists beyond 48 hours is defined as POF.
Inclusion and Exclusion Criteria
Inclusion criteria: ① meeting the diagnostic criteria for AP; ② aged ≥18 years; ③ admitted within 48 hours of symptom onset; ④ hospitalized at Shanxi Bethune Hospital and initially diagnosed with AP.
Exclusion criteria: ① incomplete clinical data or missing medical records; ② chronic pancreatitis, trauma, or pregnancy-associated pancreatitis; ③ patients with diagnosed chronic diseases of the heart, lungs, kidneys, etc.; ④ patients with prior immunological disorders or hematological diseases.
Data Collection
General Information includes: sex, age, height (cm), weight (kg), body mass index (BMI), etiology, triggering factors, smoking history, medical history, and presence or absence of POF. Vital signs upon admission, as well as laboratory indices within 24 hours of admission (covering liver and kidney function tests, pancreatic function, blood cell analysis, serum electrolytes, coagulation function) are also recorded. Data were initially selected for 100 variables, and after inclusion and exclusion, 46 variables were used for further analysis.
Data Processing and Statistical Analysis
Data cleaning was conducted using STATA (Version 17). Variables with more than 20% missing values were excluded. Variables with missing values between 5% and 20% were imputed using multiple imputations to select the optimal dataset to fill in missing values. Variables with less than 5% missing values were replaced by their mean. Outliers were treated using the winsorize method.17
In the clinic, AP patients with POF represent a small percentage of all AP patients, which leads to unbalanced data. In order to solve this problem, simple random sampling was applied and this study was conducted according to 1:3. Simple random sampling using SPSS (Version 26.0). Bar charts are drawn using GraphPad prism 9.
Predictive model was conducted using R (Version 4.2.0). Baseline data analysis was performed using the “compare groups” package. A complete predictive model requires three steps: variable selection, model establishment, and model evaluation.①Variable selection: “glmnet” package for LASSO regression to screen predictive variables; ② Model establishment: To further control confounding factors, the results of the LASSO regression were subjected to multivariate logistic regression analysis using the “glm” package; ③ Model evaluation: The “pROC” package was used to draw ROC curves to evaluate the model’s ability to distinguish different outcome events, the “rms” package for calibration plots to assess the discrepancy between predicted and actual outcomes, and the “rmda” package for DCA to evaluate the model’s clinical utility. P-value < 0.05 was considered statistically significant. Web calculator using “DynNom” package.
Results
Characteristics of Patients
Between January 1, 2017, and January 1, 2022, a total of 1489 patients were diagnosed with AP at Shanxi Bethune Hospital. Out of these, 1166 patients met the inclusion criteria (Figure 1). A total of 933 patients were enrolled from January 1, 2017 to January 1, 2021, according to the modified Marshall scoring criteria, 145 patients had concomitant POF, and 788 patients had no POF. We sampled 435 patients without POF in a ratio of 1:3, which was used as a modeling group together with the patients with POF.
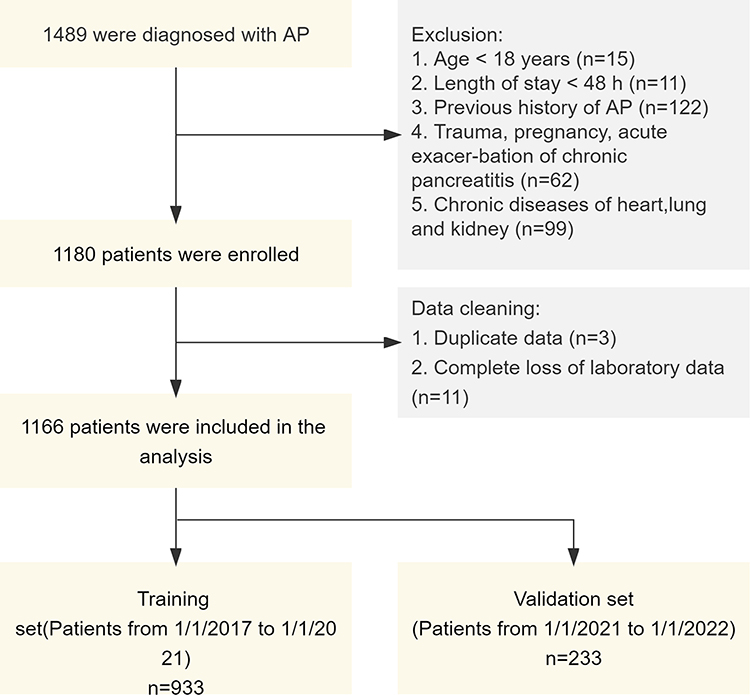 |
Figure 1 Flowchart of patient enrollment. |
Table 1 provides a summary of the baseline characteristics of the AP patients. Among them, 377 were males and 208 were females, with an average age of 48 years. The mean age of patients with POF was 56 years, which was significantly higher than that of the group without POF.
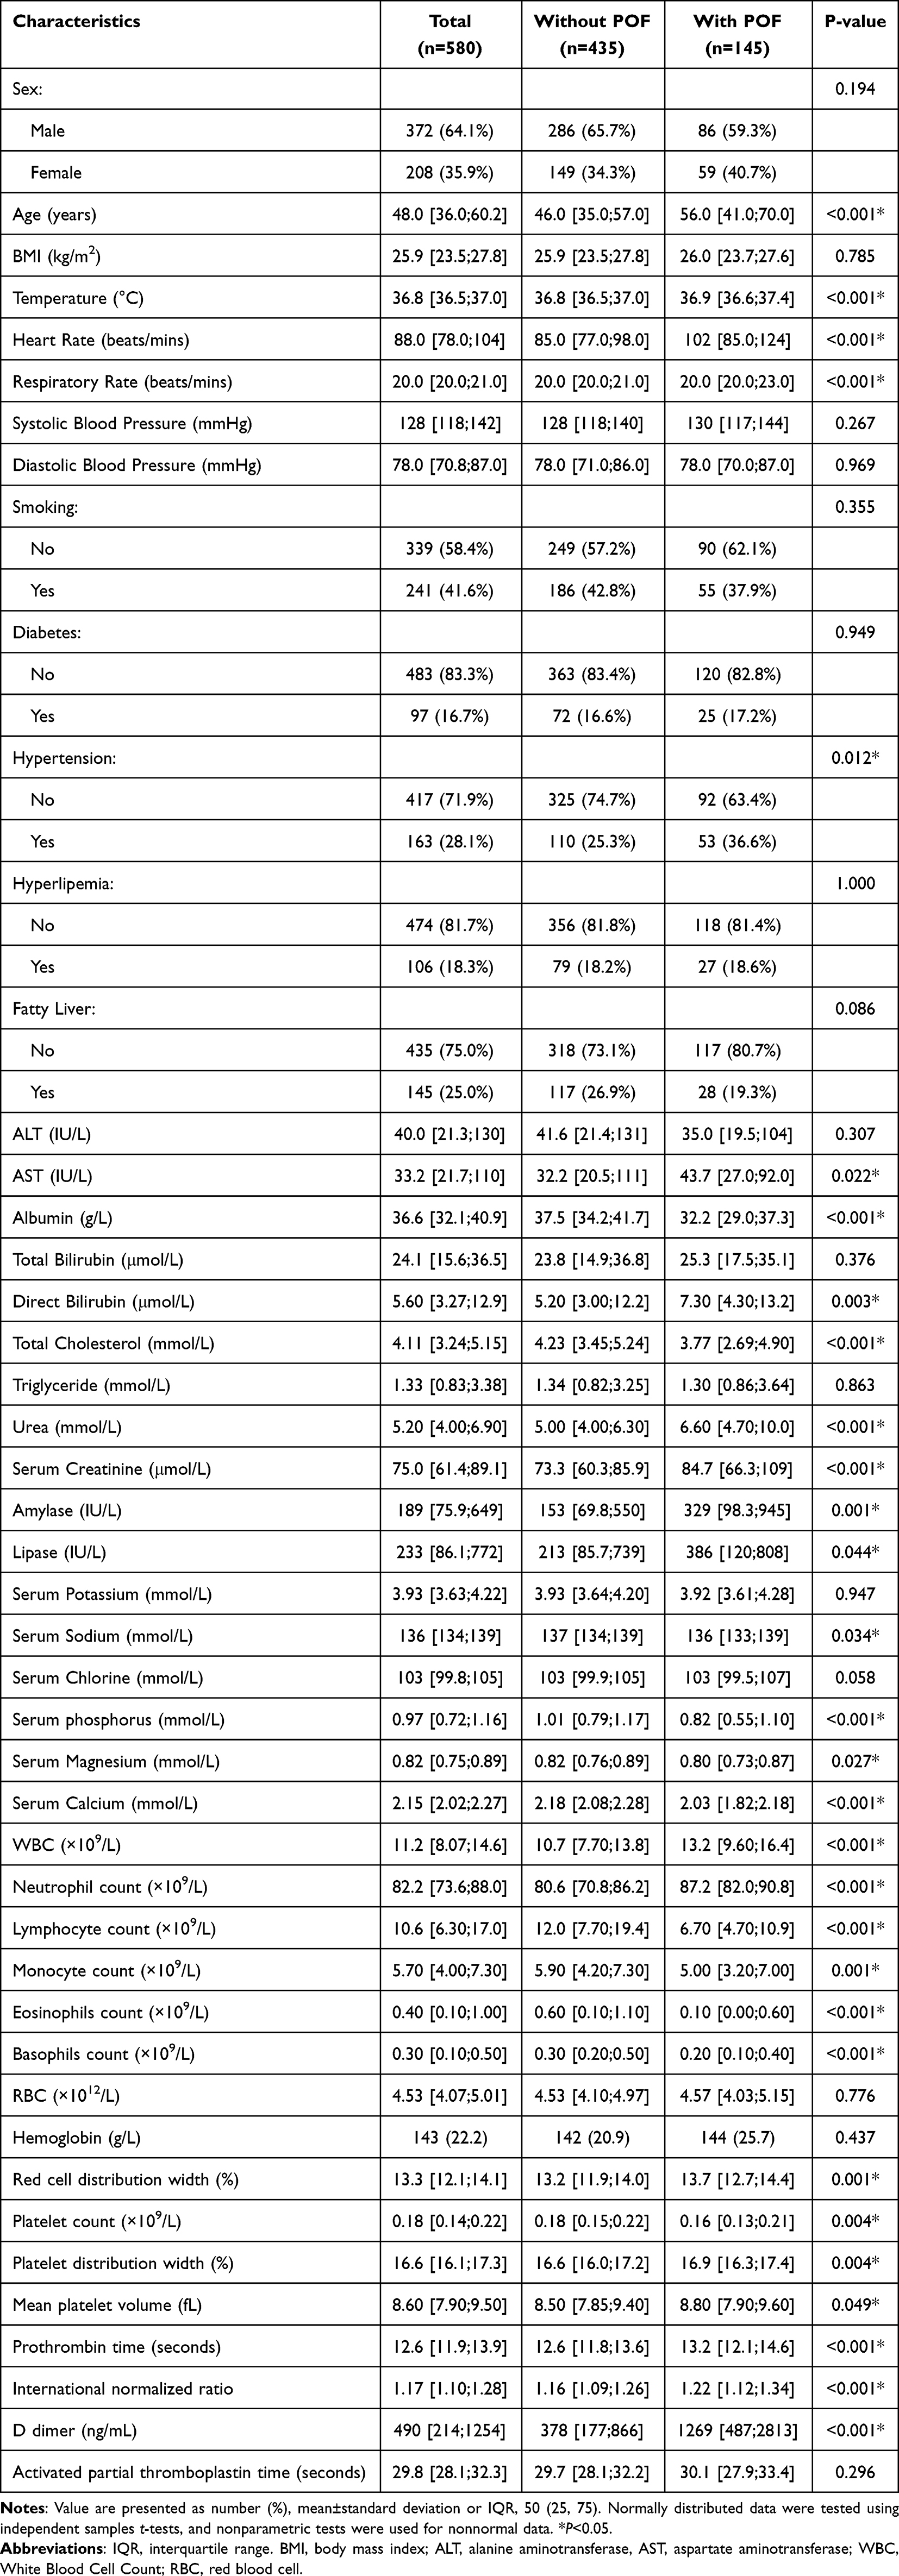 |
Table 1 Differences Between the Two Groups in AP Patients with or Without POF |
Bar charts of outcome events in the two groups were plotted to understand whether POF predicted patients’ poor outcomes. As shown in the Figure 2, compared with patients without POF, patients with POF stayed in the hospital longer, had higher rates of bacterial infection, developed walled-off necrosis in pancreas, accumulated pancreatic fluid collections, were more likely to be admitted to the ICU, and were even more likely to die in the hospital. Thus, screen high-risk groups and give timely intervention is essential. Establishing a predictive model for early diagnosis of POF in AP patients addresses this need.
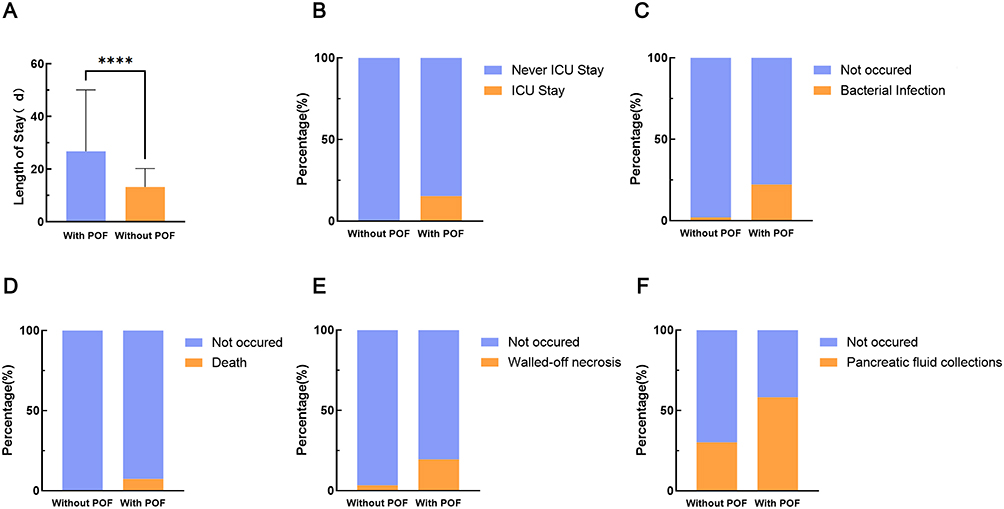 |
Figure 2 Comparison of clinical outcomes based on whether there are complicated with POF. Length of stay. For non-normal distributed data, Mann–Whitney test was used. P<0.001. ****P<0.001. (B) ICU stay. (C) Bacterial Infection. (D) Death. (E) Walled-off necrosis. (F) Pancreatic fluid collections. (B and D) Fisher’s exact test. P<0.001. (C, E and F) Chi-square test. P <0.001. |
Building Predictive Models
The model was established using training set, we used univariate logistic regression and LASSO regression to select predictors. Then, independent predictors were screened by excluding confounding factors using multifactor logistic regression.
Supplementary Table 1 describes the results of univariate and multivariate logistic regression screening for predictors in the training set. Ultimately, seven variables were selected, which were age, heart rate, direct bilirubin, serum creatinine, serum calcium, lymphocytes count and d-dimer.
The results of the LASSO regression are shown in Figure 3, when the model error is the smallest, 14 independent variables are screened out, and when the model error is one standard error, 8 independent variables are selected. In order to be more convenient for clinical application, we select the independent variables screened out when log(λ) is one standard error, namely Age, Heart Rate, Albumin, Urea, Serum Creatinine, Ca (Calcium), Lymphocytes and D-dimer. To further eliminate the effects of confounding factors, the factors screened out by LASSO regression were incorporated into a multivariate logistic regression. This resulted in the identification of five independent predictive factors. The results of multivariate logistic regression are shown in Table 2, Age, Heart Rate, Serum Creatinine, Ca (Calcium), Lymphocytes and D-dimer are independent predictors of POF.
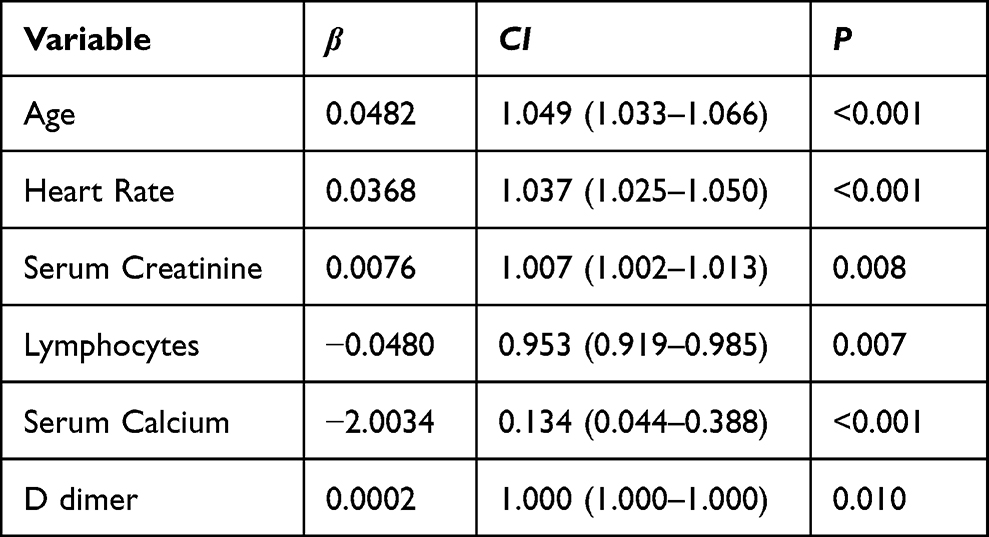 |
Table 2 Multivariate Logistic Regression Results |
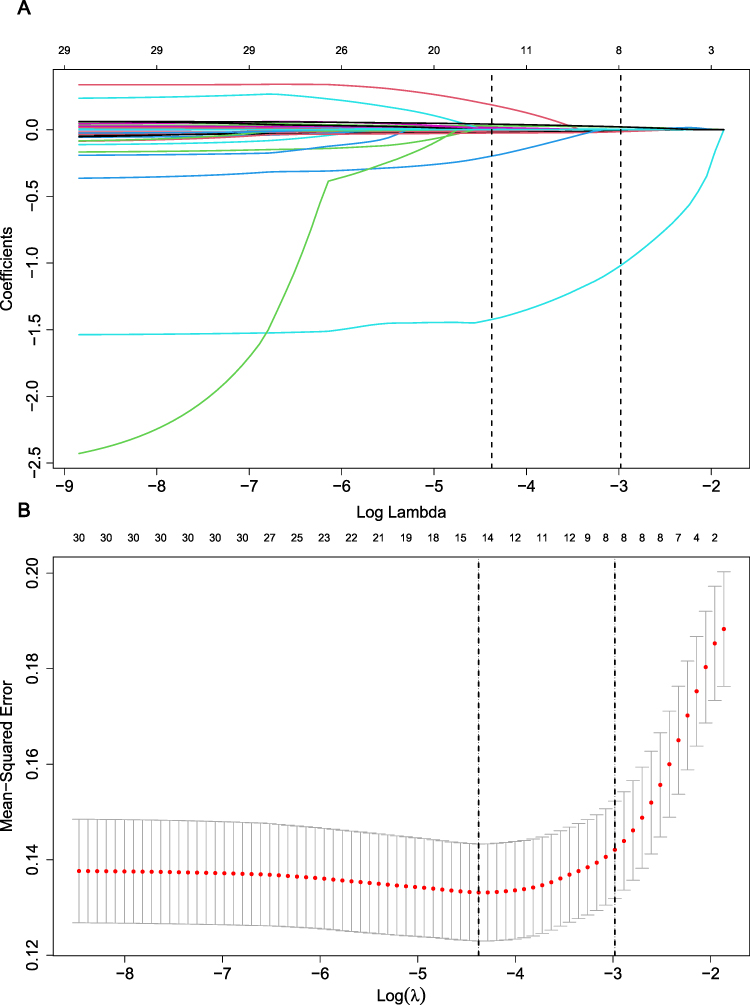 |
Figure 3 Selection of predictive variables using LASSO regression. (A) Characteristics of variable coefficient changes. The horizontal coordinates represent the value of the parameter log(λ), ordinate represents the coefficient of the independent variable. Finally, the coefficients of all independent variables are compressed to 0, and the later the independent variable becomes 0, the greater the contribution to the model. The dashed line on the left indicates the value of the parameter log(λ) when the model error is minimal, the dashed line on the right represents the value of the parameter log(λ) when the model error is amplified by one standard error. (B) Ten-fold cross-validation for adjusting parameters. The horizontal coordinates represent the value of the parameter log(λ), ordinate represents the mean squared error of the model. |
Model Visualization
To provide a more intuitive display of the model and to facilitate its clinical application, we constructed nomograms and calculated scores for each observational indicator. Figure 4 illustrates the nomogram that predicts whether or not a patient with AP will develop POF. Figure 4A shows the nomogram created by univariate logistic regression and Figure 4B shows the nomogram created by LASSO regression. Each index on the graph corresponds to its test result, and one can determine the corresponding prediction score (as denoted by the scale at the top) based on the test result. By summing up the scores for each index, the predicted total score can be determined, and the value corresponding to this total score provides the probability of POF.
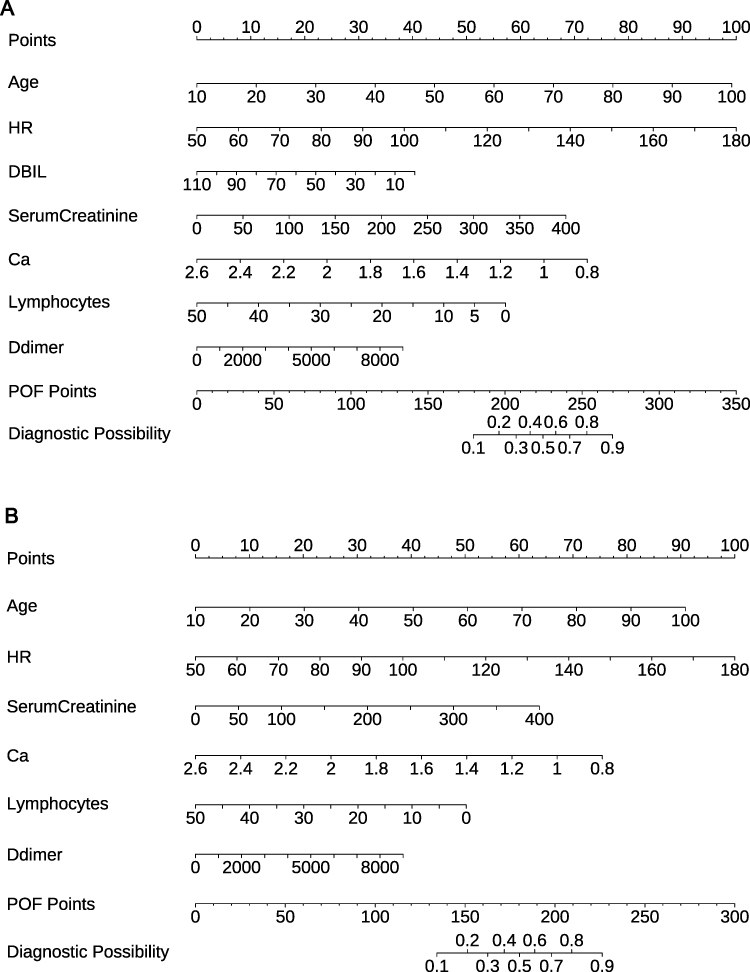 |
Figure 4 Nomogram for predicting whether patients with AP will develop POF. The nomogram created by univariate logistic regression (A). The nomogram created by LASSO (B). |
Evaluation of Model Predictive Performance
The validation dataset was utilized to access the prediction performance of the model. As depicted in Figure 5A and B (in Figure 5, Mod A is the nomogram built by univariate logistic regression and model B is the nomogram built by LASSO), the ROC curves for both the training and validation cohorts demonstrate the model’s capacity to differentiate outcome events: the AUC were 0.867 and 0.864 for the training cohort, 0.838 and 0.835 for the validation group. Further supporting the model’s efficacy, Figure 5C and D show that the predicted outcome events closely align with the actual ones.
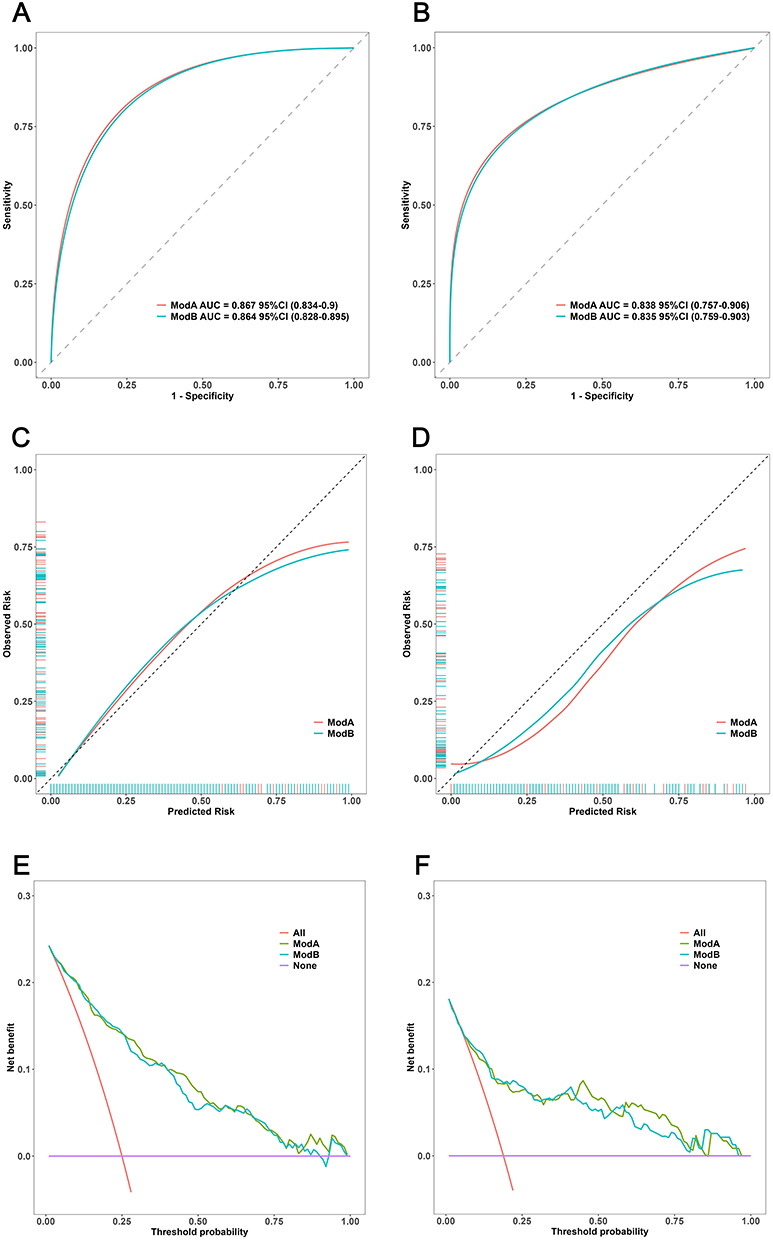 |
Figure 5 Nomogram performance. ROC curves of the model for predicting POF probabilities in the training cohort (A) and validation cohort (B). Calibration plots for predicting POF probabilities in the training cohort (C) and validation cohort (D). The gray slash represents the ideal reference line, and the black curve represents the predictive performance of the model. The closer the black curve is to the gray slash, the closer the predicted outcome event is to the actual event. Decision curves for the training cohort (E) and validation cohort (F). The abscissa is the threshold probability, and the ordinate is the net benefit rate, when the black dashed line is above the two solid lines, it indicates that the model provides a net benefit. |
To further elucidate the model’s clinical utility, we plotted the Decision Curve Analysis (DCA) in Figure 5E and F. This analysis reveals that our model provides significant net clinical benefits. When compared to other metrics, our nomogram consistently delivers greater net benefits.
For a comprehensive validation, we internally evaluated our model on three fronts: discriminative ability, calibration, and clinical utility. The outcomes confirm that our model is proficient at predicting whether AP patients will develop POF and underscores its positive implications for clinical application.
By comparison, the predictive value of the predictive models created by the two statistical methods was similar. The model of LASSO regression was more streamlined and more conducive to rapid clinical triage.
Web Calculator
While the nomogram is convenient and low cost, it cannot provide exact values in its calculation. Therefore, we developed a web calculator based on nomogram to simplify the calculation process and yield more precise prediction values (https://acute-pancreatitis-with-pof.shinyapps.io/Gx-AP-POF-Dymnomo/). Drag the numerical strip on the left to input the test result, and then click “Predict” to obtain the precise predicted value (Figure 6).
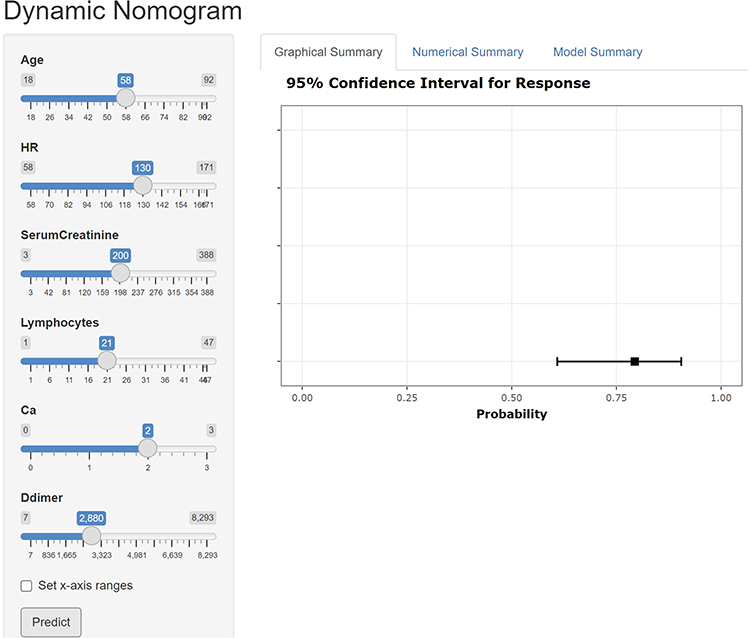 |
Figure 6 Dynamic web calculator to predict whether patients with AP will develop POF. The left band inputs variable values, Graphical Summary shows the probability and confidence interval of POF occurrence in the form of pictures. |
Discussion
POF is a complex physiological process, influenced by various factors. Early identification of risk factors associated with POF in patients is vital for stratified management of AP. In this study, 46 clinical data of the patients were collected, with the laboratory test indicators being comprehensive. Importantly, these indicators were obtained from the initial examination of patients within the first 24 hours after admission, minimizing the interference from subsequent clinical treatments. From the statistical point of view, we established 2 kinds of prediction models, the two models differ by one indicator, but the predictive value is similar, the statistical model established by LASSO regression seems to be more streamlined, in addition, LASSO regression can effectively solve the problem of data multicollinearity. Furthermore, we present two visualization models for clinicians to choose from: the Nomogram and a web calculator. While the Nomogram offers simplicity and clarity, the web calculator boasts convenience and accuracy. Upon validation, our model demonstrated great predictive capabilities, holding potential benefits for clinical application.
This research indicates that an increase in age is one of the predictor for POF. This could be attributed to the relative decline in physiological functions in the elderly, rendering them less resilient to diseases. Previous studies have demonstrated that age is not only closely associated with the incidence of AP but also serves as an independent risk factor for AP mortality.18,19
The present study considered vital signs of patients upon admission and identified heart rate as an independent predictor of POF in AP patients, which is consistent with the findings of Pan et al.20 Rapid heart rate is primarily regulated by the sympathetic nerve.21 Some studies suggest that the inflammatory response and lung injury in rats with AP are significantly reduced when the drugs inhibiting the sympathetic nerve are administered.22 This offers a novel perspective for the clinical treatment of AP.
Serum creatinine is a well-recognized indicator of renal function and is incorporated into several scoring systems, such as the modified Marshall score and the APACHE II score. Our study suggests that serum creatinine can independently predict the onset of POF, aligning with the findings of many other studies.23,24 Inflammatory events in the body lead to systemic fluid redistribution allowing a surge of toxins, cytokines, and inflammatory mediators into the circulation, which subsequently causes renal injury and an associated rise in creatinine.25 Studies indicate that acute kidney injury often follows organ failure in AP patients, and the mortality rate for patients with acute kidney injury combined with AP is over 25%.26
The progression of pancreatitis requires the activation of pancreatic enzymes by calcium ions, which constantly initiates their self-digestion.27 On the other hand, exudation of pancreatic fluid degrades pancreatic adipose tissue, and free fatty acids combine with calcium ions to form calcium saponification, leading to a decrease in blood calcium level.28 In this study, we observed that the lower the blood calcium level, the higher the probability of POF. Serum calcium is a pivotal predictor for POF in AP patients.
D-dimer is commonly used to assess thrombosis and is also a risk factor for predicting both AP severity and thrombosis.29–31 Coagulation and inflammation are known to influence each other reciprocally: the onset of inflammation can activate coagulation, and in turn, coagulation can stimulate inflammation.32 An increasing body of studies confirms the correlation between D-dimer levels at the time of admission and AP severity. For instance, in a study by Zhang et al, it was observed that patients with elevated D-dimer levels were more likely to experience severe AP.33,34
AP is an inflammatory disease. There is an important relationship between the role of inflammatory cells and the severity of AP. The activation of T lymphocytes and B lymphocytes is significantly related to the pathogenesis of AP, and may be an important factor leading to the progression of AP.35 Our study is consistent with existing findings that lymphocytes can independently predict whether or not AP patients develop POF. Nowadays, researchers are no longer limited to the analysis of the cellular level, and the predictive value of cytokines is widely used. Some studies have shown that CD4+T lymphocytes and CD19+B lymphocytes can predict the occurrence of organ failure.36
Most of the existing AP prediction models are based on univariate logistic regression, and a few researchers have applied machine learning to predict the severity of AP. Some researchers developed an EASY-APP based on machine learning to predict the severity of AP. The study used patients from multiple countries to build a prediction model. Respiratory rate, abdominal guarding, axillary body temperature, serum amylase, gender and serum glucose level are more related to the severity of AP. However, the data were highly imbalanced, with only 70 of 1184 patients enrolled having severe pancreatitis (AUC score was 0.803 ± 0.010).37 The study by Mikolasevic et al pointed out that the presence of nonalcoholic fatty liver disease was associated with severe acute pancreatitis, but this result was not obtained in our study.38 Hong et al studied 700 patients with acute pancreatitis, biliary etiology, chronic concomitant diseases, hematocrit, blood urea nitrogen, and the serum albumin level were independently associated with POF.39
In the prediction model established by univariate logistic regression, direct bilirubin was the pair predictor of POF in AP patients, which was different from the model established by LASSO regression. According to previous statistics, nearly half of AP patients were diagnosed with biliary pancreatitis or cholecystitis and gallstones, although we have tried to adjust the imbalance of the data.
In this study, the six selected predictors were combined to create both visual Nomogram and an online calculator. These tools are designed to be more conducive to clinical application and to provide valuable guidance for clinical decision-making. However, there are some limitations to consider. This study originates from a single center and employs a retrospective approach, which may introduce biases. In addition, of the total sample, only 145 AP patients exhibited complications with POF, representing just 25% of all patients. This distribution may reduce our models sensitivity. In the future, validation from multiple centers with larger datasets will be essential to corroborate our findings.
Conclusion
Heart Rate, Serum Creatinine, Ca (Calcium), Lymphocytes and D-dimer are independent predictors of POFwere independently associated with persistent organ failure in acute pancreatitis. Using 6 clinical risk indicators, we developed nomogram and web calculator.
Abbreviations
AP, acute pancreatitis; OF, organ failure; POF, persistent organ failure; LASSO, least absolute shrinkage and selection operator; AUC, area under the curve; DCA, decision curve analysis; BMI, body mass index; ALT, alanine aminotransferase, AST, aspartate aminotransferase; WBC, White Blood Cell Count; RBC, red blood cell.
Ethics Statement
Informed consent was obtained from the patients and this study has been approved by the Ethics Committee of Shanxi Academy of Medical Sciences. The studies were conducted in accordance with the local legislation and institutional requirements. Ethics No.YXLL-2023-237. Our study complies with the Declaration of Helsinki.
Acknowledgments
The authors would like to thank all the patients and investigators who participated in this study.
Author Contributions
All authors made a significant contribution to the work reported, whether that is in the conception, study design, execution, acquisition of data, analysis and interpretation, or in all these areas; took part in drafting, revising or critically reviewing the article; gave final approval of the version to be published; have agreed on the journal to which the article has been submitted; and agree to be accountable for all aspects of the work.
Funding
This project was funded by the Key Research and Development Program of Shanxi Province (201903D321165) and Shanxi Province 136 revitalization medical project (department of general surgery)(2019XY004).
Disclosure
The authors declare that the research was conducted in the absence of any commercial or financial relationships that could be construed as a potential conflict of interest.
References
1. Boxhoorn L, Voermans RP, Bouwense SA, et al. Acute pancreatitis. Lancet. 2020;396(10252):726–734. doi:10.1016/S0140-6736(20)31310-6
2. Iannuzzi JP, King JA, Leong JH, et al. Global incidence of acute pancreatitis is increasing over time: a systematic review and meta-analysis. Gastroenterology. 2022;162(1):122–134. doi:10.1053/j.gastro.2021.09.043
3. Garg PK, Singh VP. Organ failure due to systemic injury in acute pancreatitis. Gastroenterology. 2019;156(7):2008–2023. doi:10.1053/j.gastro.2018.12.041
4. Schepers NJ, Bakker OJ, Besselink MG, et al. Impact of characteristics of organ failure and infected necrosis on mortality in necrotising pancreatitis. Gut. 2019;68(6):1044–1051. doi:10.1136/gutjnl-2017-314657
5. Ranson JH, Rifkind KM, Roses DF, Fink SD, Eng K, Spencer FC. Prognostic signs and the role of operative management in acute pancreatitis. Surg Gynecology Obstetrics. 1974;139(1):69–81.
6. Mounzer R, Langmead CJ, Wu BU, et al. Comparison of existing clinical scoring systems to predict persistent organ failure in patients with acute pancreatitis. Gastroenterology. 2012;142(7):1476–1482; quiz e1415–1476. doi:10.1053/j.gastro.2012.03.005
7. Knaus WA, Zimmerman JE, Wagner DP, Draper EA, Lawrence DE. APACHE-acute physiology and chronic health evaluation: a physiologically based classification system. Crit Care Med. 1981;9(8):591–597. doi:10.1097/00003246-198108000-00008
8. Yang CJ, Chen J, Phillips AR, Windsor JA, Petrov MS. Predictors of severe and critical acute pancreatitis: a systematic review. Digestive Liver Dis. 2014;46(5):446–451. doi:10.1016/j.dld.2014.01.158
9. Harshit Kumar A, Singh Griwan M. A comparison of APACHE II, BISAP, Ranson’s score and modified CTSI in predicting the severity of acute pancreatitis based on the 2012 revised Atlanta Classification. Gastroenterol Rep. 2018;6(2):127–131. doi:10.1093/gastro/gox029
10. Jiang X, Su Z, Wang Y, et al. Prognostic nomogram for acute pancreatitis patients: an analysis of publicly electronic healthcare records in intensive care unit. J Crit Care. 2019;50:213–220. doi:10.1016/j.jcrc.2018.10.030
11. Xu Y, Han D, Huang T, et al. Predicting ICU mortality in rheumatic heart disease: comparison of xgboost and logistic regression. Front Cardiovasc Med. 2022;9:847206. doi:10.3389/fcvm.2022.847206
12. Li Y, Lu F, Yin Y. Applying logistic LASSO regression for the diagnosis of atypical Crohn’s disease. Sci Rep. 2022;12(1):11340. doi:10.1038/s41598-022-15609-5
13. McNeish DM. Using lasso for predictor selection and to assuage overfitting: a method long overlooked in behavioral sciences. Multivariate Behav Res. 2015;50(5):471–484. doi:10.1080/00273171.2015.1036965
14. McEligot AJ, Poynor V, Sharma R, Panangadan A. Logistic LASSO regression for dietary intakes and breast cancer. Nutrients. 2020;12(9):2652. doi:10.3390/nu12092652
15. Banks PA, Bollen TL, Dervenis C, et al. Classification of acute pancreatitis--2012: revision of the Atlanta classification and definitions by international consensus. Gut. 2013;62(1):102–111. doi:10.1136/gutjnl-2012-302779
16. Siregar GA, Siregar GP. Management of severe acute pancreatitis. Open Access Maced J Med Sci. 2019;7(19):3319–3323. doi:10.3889/oamjms.2019.720
17. Wang Q, Qiao W, Zhang H, et al. Nomogram established on account of Lasso-Cox regression for predicting recurrence in patients with early-stage hepatocellular carcinoma. Front Immunol. 2022;13:1019638. doi:10.3389/fimmu.2022.1019638
18. Guo X, Li Y, Lin H, et al. A nomogram for clinical estimation of acute biliary pancreatitis risk among patients with symptomatic gallstones: a retrospective case-control study. Front Cell Infect Microbiol. 2022;12:935927. doi:10.3389/fcimb.2022.935927
19. Spanier BWM, Dijkgraaf MGW, Bruno MJ. Epidemiology, aetiology and outcome of acute and chronic pancreatitis: an update. Best Pract Res Clin Gastroenterol. 2008;22(1):45–63. doi:10.1016/j.bpg.2007.10.007
20. Pan L-N, Pan S-A, Lei B-H, Hong G-L, Chen K-W, Kam CW. Development of a novel nomogram incorporating red blood cell distribution width-albumin ratio for the prediction of 30-day mortality in acute pancreatitis patients. Emerg Med Int. 2022;2022:1573931. doi:10.1155/2022/1573931
21. Ackland GL, Yao ST, Rudiger A, et al. Cardioprotection, attenuated systemic inflammation, and survival benefit of beta1-adrenoceptor blockade in severe sepsis in rats. Crit Care Med. 2010;38(2):388–394. doi:10.1097/CCM.0b013e3181c03dfa
22. Zhang L, Nie Y, Zheng Y, et al. Esmolol attenuates lung injury and inflammation in severe acute pancreatitis rats. Pancreatology. 2016;16(5):726–732. doi:10.1016/j.pan.2016.05.395
23. Li B, Wu W, Liu A, et al. Establishment and validation of a nomogram prediction model for the severe acute pancreatitis. J Inflamm Res. 2023;16:2831–2843. doi:10.2147/JIR.S416411
24. Hong W, Lu Y, Zhou X, et al. Usefulness of random forest algorithm in predicting severe acute pancreatitis. Front Cell Infect Microbiol. 2022;12:893294. doi:10.3389/fcimb.2022.893294
25. Wajda J, Dumnicka P, Maraj M, Ceranowicz P, Kuźniewski M, Kuśnierz-Cabala B. Potential prognostic markers of acute kidney injury in the early phase of acute pancreatitis. Int J Mol Sci. 2019;20(15):3714. doi:10.3390/ijms20153714
26. Nassar TI, Qunibi WY. AKI associated with acute pancreatitis. Clin J Am Soc Nephrol. 2019;14(7):1106–1115. doi:10.2215/CJN.13191118
27. Raraty M, Ward J, Erdemli G, et al. Calcium-dependent enzyme activation and vacuole formation in the apical granular region of pancreatic acinar cells. Proc Natl Acad Sci U S A. 2000;97(24):13126–13131. doi:10.1073/pnas.97.24.13126
28. van Dijk SM, Hallensleben NDL, van Santvoort HC, et al. Acute pancreatitis: recent advances through randomised trials. Gut. 2017;66(11):2024–2032. doi:10.1136/gutjnl-2016-313595
29. Weitz JI, Fredenburgh JC, Eikelboom JW. A test in context: D-Dimer. J Am Coll Cardiol. 2017;70(19):2411–2420. doi:10.1016/j.jacc.2017.09.024
30. Cui H, Mei C, Cui M, et al. 血氯和IL-6联合凝血指标对重症急性胰腺炎严重程度的预测价值 [Predictive value of serum chlorine and IL-6 combined with coagulation indexes on severity of severe acute pancreatitis]. Chinese Critical Care Medicine. 2022;34(12):1301–1304. Chinese. doi:10.3760/cma.j.cn121430-20220916-00844
31. Zheng J, Han M, Chen J, Deng MM, Luo G. Predictive value of D-dimer and fibrinogen degradation product for splanchnic vein thrombosis in patients with severe acute pancreatitis: a single-center retrospective study. Scand J Gastroenterol. 2023;58(10):1–7.
32. Dumnicka P, Maduzia D, Ceranowicz P, Olszanecki R, Drożdż R, Kuśnierz-Cabala B. The interplay between inflammation, coagulation and endothelial injury in the early phase of acute pancreatitis: clinical implications. Int J Mol Sci. 2017;18(2):354. doi:10.3390/ijms18020354
33. Wan J, Yang X, He W, et al. Serum D-dimer levels at admission for prediction of outcomes in acute pancreatitis. BMC Gastroenterol. 2019;19(1):67. doi:10.1186/s12876-019-0989-x
34. Zhang G-Q, Wang G, Li L, et al. Plasma D-Dimer level is an early predictor of severity of acute pancreatitis based on 2012 Atlanta classification. Med Sci Monit. 2019;25:9019–9027. doi:10.12659/MSM.918311
35. Mora A, Pérez-Mateo M, Viedma JA, Carballo F, Sánchez-Payá J, Liras G. Activation of cellular immune response in acute pancreatitis. Gut. 1997;40(6):794–797. doi:10.1136/gut.40.6.794
36. Shi C, Hou C, Zhu X, et al. New predictor of organ failure in acute pancreatitis: CD4+ T lymphocytes and CD19+ B lymphocytes. Biomed Res. Int. 2018;2018:1012584. doi:10.1155/2018/1012584
37. Kui B, Pintér J, Molontay R, et al. EASY-APP: an artificial intelligence model and application for early and easy prediction of severity in acute pancreatitis. Clin Transl Med. 2022;12(6):e842. doi:10.1002/ctm2.842
38. Mikolasevic I, Orlic L, Poropat G, et al. Nonalcoholic fatty liver and the severity of acute pancreatitis. Eur J Internal Med. 2017;38:73–78. doi:10.1016/j.ejim.2016.10.019
39. Hong W, Lin S, Zippi M, et al. Serum albumin is independently associated with persistent organ failure in acute pancreatitis. Can J Gastroenterol Hepatol. 2017;2017:5297143. doi:10.1155/2017/5297143
 © 2024 The Author(s). This work is published and licensed by Dove Medical Press Limited. The
full terms of this license are available at https://www.dovepress.com/terms
and incorporate the Creative Commons Attribution
- Non Commercial (unported, 3.0) License.
By accessing the work you hereby accept the Terms. Non-commercial uses of the work are permitted
without any further permission from Dove Medical Press Limited, provided the work is properly
attributed. For permission for commercial use of this work, please see paragraphs 4.2 and 5 of our Terms.
© 2024 The Author(s). This work is published and licensed by Dove Medical Press Limited. The
full terms of this license are available at https://www.dovepress.com/terms
and incorporate the Creative Commons Attribution
- Non Commercial (unported, 3.0) License.
By accessing the work you hereby accept the Terms. Non-commercial uses of the work are permitted
without any further permission from Dove Medical Press Limited, provided the work is properly
attributed. For permission for commercial use of this work, please see paragraphs 4.2 and 5 of our Terms.
Recommended articles
Diagnostic and Prognostic Value of Monocyte Distribution Width in Sepsis
Wu J, Li L, Luo J
Journal of Inflammation Research 2022, 15:4107-4117
Published Date: 20 July 2022
Clinical Prediction Score for Early Diagnosis of Acute Pancreatitis in Emergency Departments
Liengswangwong W, Preechakul P, Yuksen C, Jenpanitpong C, Tienpratarn W, Watcharakitpaisan S
Open Access Emergency Medicine 2022, 14:355-366
Published Date: 26 July 2022
Development and Validation of a Multivariable Prediction Model to Identify Acute Exacerbation of COPD and Its Severity for COPD Management in China (DETECT Study): A Multicenter, Observational, Cross-Sectional Study
Yin Y, Xu J, Cai S, Chen Y, Chen Y, Li M, Zhang Z, Kang J
International Journal of Chronic Obstructive Pulmonary Disease 2022, 17:2093-2106
Published Date: 5 September 2022
Leiomyoma with Bizarre Nuclei: A Current Update
Guo E, Li C, Hu Y, Zhao K, Zheng Q, Wang L
International Journal of Women's Health 2022, 14:1641-1656
Published Date: 25 November 2022
Diagnosis, Prognosis, and Treatment of Triple-Negative Breast Cancer: A Review
Jie H, Ma W, Huang C
Breast Cancer: Targets and Therapy 2025, 17:265-274
Published Date: 17 March 2025