Back to Journals » Journal of Inflammation Research » Volume 17
New Classification of Rheumatoid Arthritis Based on Immune Cells and Clinical Characteristics
Authors Wang J ![]() , Xue Y, Zhou L
, Xue Y, Zhou L
Received 21 July 2023
Accepted for publication 25 April 2024
Published 22 May 2024 Volume 2024:17 Pages 3293—3305
DOI https://doi.org/10.2147/JIR.S395566
Checked for plagiarism Yes
Review by Single anonymous peer review
Peer reviewer comments 2
Editor who approved publication: Dr Adam Bachstetter
Jiaqian Wang,1 Yuan Xue,2 Liang Zhou3
1Department of Orthopaedic, Zhongshan Hospital, Fudan University, Shanghai, 200032, People’s Republic of China; 2Department of Orthopaedic, Wuxi Ninth People’s Hospital of Soochow University, Wuxi, 214000, People’s Republic of China; 3Department of Orthopaedic, Lianshui County People’s Hospital, Huai‘an, People’s Republic of China
Correspondence: Jiaqian Wang, Email [email protected]
Background: Rheumatoid arthritis (RA) is a chronic systemic immune disease characterized by joint synovitis, but there are differences in clinical manifestations and serum test results among different patients.
Methods: This is a bioinformatics study. We first obtained the gene expression profile of RA and normal synovium from the database, and screened the differentially expressed immune related genes for enrichment analysis. Subsequently, we classified RA into three subtypes by unsupervised clustering of serum gene expression profiles based on immune enrichment scores. Then, the enrichment and clinical characteristics of different subtypes were analyzed. Finally, according to the infiltration of different subtypes of immune cells, diagnostic markers were screened and verified by qRT-PCR.
Results: C1 subtype is related to the increase of neutrophils, C-reactive protein and erythrocyte sedimentation rate, and joint pain is more significant in patients. C2 subtype is related to the expression of CD8+T cells and Tregs, and patients have mild joint pain symptoms. The RF value of C3 subtype is higher, and the expression of various immune cells is increased. CD4 T cells, NK cells activated, macrophages M1 and neutrophils are immune cells significantly infiltrated in synovium and serum of RA patients. IFNGR1, TRAC, IFITM1 can be used as diagnostic markers of different subtypes.
Conclusion: In this study, RA patients were divided into different immune molecular subtypes based on gene expression profile, and immune diagnostic markers were screened, which provided a new idea for the diagnosis and treatment of RA.
Keywords: rheumatoid arthritis, molecular subtype, immune cells, immunodiagnostic markers
Introduction
Rheumatoid arthritis (RA) is a chronic systemic autoimmune disease characterized by joint synovitis. Persistent synovitis can lead to irreversible damage of intra-articular cartilage and bone, joint dysfunction, and even disability.1 The Global Burden of Disease research report showed that the prevalence of RA increased by 7.4% and the incidence rate increased by 8.2% between 1990 and 2017.2 However, the exact cause of RA has not yet been clarified, environmental, infectious, genetic and other factors are closely related.3 Among them, it is widely recognized that immune factors play a crucial role in the whole process.4 Studies have shown that the infiltration of immune cells in synovium seriously affects the occurrence and progression of RA.5 For example, macrophages can secrete a large number of cytokines, chemokines and degrading enzymes, which are positively correlated with the severity of the disease.6 Activated CD4+T cells can initiate specific immune responses, leading to joint inflammation and bone destruction.7 Other immune cells, such as natural killer cells, also play a regulatory role in RA.8 Therefore, it is very important to evaluate the infiltration of immune cells in synovium and determine the differences of immune cell components in order to clarify the pathogenesis of RA.
In addition, although the basic pathological change of RA is synovitis, some patients show alternate onset and relief of joint pain, while others show persistent swelling and joint pain, with almost no relief process.9 Even some patients have extra-articular manifestations, with 14.7% of patients developing interstitial lung disease.10 Therefore, early diagnosis and classification of RA is of great significance for the treatment of RA.11 However, the current role of serological diagnostic markers is limited. Even if rheumatoid factor and anti-cyclic citrulline antibody are positive, RA cannot be diagnosed, and it still needs to be based on long-term clinical symptoms.12 C-reactive protein (CRP) and erythrocyte sedimentation rate (ESR) increased in the acute stage of RA, but there was no specificity.13 This brings great difficulties to the early diagnosis of RA, but the first change in RA patients is usually at the molecular level.14 With the development and widespread use of microarray and high-throughput sequencing technology, we can early identify changes in gene expression and screen out immune diagnostic markers.15
For the above reasons, we performed unsupervised clustering on the genes expression profile of RA based on the immune related gene set. Enrichment analysis was conducted on different subtypes of RA, and the relationship between clinical characteristics and immune cells of different subtypes was explored, and key genes for different subtypes were further screened. This classification based on immune molecular mechanism and screening of immune markers provide new ideas for the diagnosis and treatment of RA.
Materials and Methods
Datasets Collection and Preprocessing
We searched the Gene Expression Omnibus (GEO) database (https://www.ncbi.nlm.nih.gov/geo/) with “rheumatoid arthritis” as the keyword. GEO is an international public repository that contains the most non-tumor genomic data uploaded by researchers worldwide. If the data meets the following criteria, it will be included in the analysis: (1) Gene expression profile of homo sapiens; (2) Case–control studies with complete data; (3) Tissue sample size of RA patients is greater than 100. Based on these conditions, a joint synovial data set (GSE89408) and a whole blood dataset (GSE93272) were screened for further study. GSE89408 contains 28 normal control samples and 152 joint synovial samples from RA patients. GSE93272 contains 232 whole blood tissue samples from Japanese Keio University Hospital RA patients. After downloading the raw data, we use the “impute” package to complete the missing values, and use the median to standardize the data.
Evaluation of Immune Cells Infiltration
The infiltration of immune cells in joint synovium and whole blood was evaluated by CIBERSORT algorithm. The algorithm uses LM22 characteristic matrix to define 22 kinds of infiltrating immune cell components, and only retains the data with p value <0.05. The score of immune infiltrating cells of each sample was calculated based on the expression profile of the dataset, and the results were visualized by violin diagram and histogram. The correlation between clinical characteristics and immune cells was analyzed by Pearson method and visualized by correlation heatmap.
Screening of Differential Expressed Immune Related Genes
By comparing the synovial expression datasets GSE89408 of RA patients and normal controls, the differentially expressed genes (DEGs) were identified by “limma” package. The volcanic map shows the difference level of DEGs, and the false discovery rate (FDR) <0.05 and | log2FC | >1 was considered to be statistically significant. The genes with the most significant differences were visualized by heatmap. A total of 1436 immune related genes were downloaded from ImmPort database, and the final DE-IRGs were extracted by Venn diagram intersection.
Functional Enrichment Analysis
The Gene Ontology (GO) and Kyoto Encyclopedia of Genes and Genomes (KEGG) analysis of DE-IRGs were performed by “clusterProfiler” package. Ten significantly different biological processes, cellular components, molecular functions and pathways were screened by p value <0.05.
Gene set enrichment analysis (GSEA) compared the differential expression of different subtypes in whole blood, and screened four significantly different GO biological processes and KEGG pathways in different subtypes by p value <0.05.
Unsupervised Cluster Analysis of Different Subtypes
In order to clarify the different molecular immune subtypes of RA patients, unsupervised clustering was used to analyze the whole blood dataset. We first calculated the enrichment score of each sample in all immune gene sets by using ssGSEA, and obtained the enrichment score matrix. “ ConsenseClusterPlus” based on “pam” method was used to cluster the matrix, and the optimal number of clusters was determined according to the empirical cumulative distribution function diagram and UMAP diagram. Finally, all tissue samples were divided into three subtypes and the clinical characteristics of different subtypes were extracted.
Weighted Gene Co-Expression Network Analysis
In order to extract hub genes of different subtypes, we used weighted gene co-expression network analysis (WGCNA). Simply put, we used the goodSamplesGenes method to remove the outliers and samples, and further constructed the scale free co-expression network. After selecting the appropriate soft-threshold β, adjacency is transformed into topological overlap matrix (TOM). Average linkage hierarchical clustering was carried out according to the dissimilarity measure based on TOM, and the most relevant co-expression modules with different subtypes were obtained. The correlation between module and gene expression was calculated to obtain module membership (MM). According to | MM | >0.8, genes with high connectivity in important modules are identified as hub genes.
Predictive Immunodiagnostic Biomarkers
The common genes of DE-IRGs in synovium and hub genes of different subtypes in whole blood were used as immunodiagnostic markers. Venn diagram was used to visualize the results. ROC analysis is carried out through the “pROC” package to obtain the area under the curve (AUC). AUC > 0.75 indicates that biomarkers have good diagnostic value.
qRT‐PCR Validation and Statistical Analysis
In order to further verify the effectiveness of immunodiagnostic markers of different subtypes, whole blood and synovial samples from three patients with confirmed RA who underwent total knee replacement were obtained. Three patients who underwent total knee arthroplasty due to osteoarthritis served as the normal control group. All participants gave written informed consent. All procedures were approved by the medical ethics committee of Lianshui County People’s Hospital and followed the tenets of the Declaration of Helsinki. Quantitative real-time polymerase chain reaction (qRT-PCR) was carried out as the method previously described.16 All experiments were performed independently in triplicate. Paired t-test and Mann–Whitney U-test were used to assess the significant differences between two groups. GraphPad Prism software (version 5.01; USA) was used for statistical analyses.
Results
Immune Cells Infiltration in Synovium
We first analyzed the composition of 22 immune cells in RA and normal synovial tissues. T cells CD4 memory resting, macrophage M2, mast cell resting are the main infiltrating immune cells (Figure 1A). Compared with normal samples, RA synovial samples contain more B cells memory, T cells CD4 memory activated, macrophage M1 and neutrophils, while T cells CD4 memory resting, T cells regulatory (Tregs), NK cells, mast cell resting are relatively less, p values < 0.01 (Figure 1B). The correlation heatmap showed that the increased expression of B cells memory was positively correlated with the T cells CD4 memory activated, macrophage M1 was negatively correlated with NK cell activated and mast cell resting, neutrophils were positively correlated with T cells CD4 naive, and were negatively correlated with macrophage M2, correlation coefficient > 0.4 (Figure 1C).
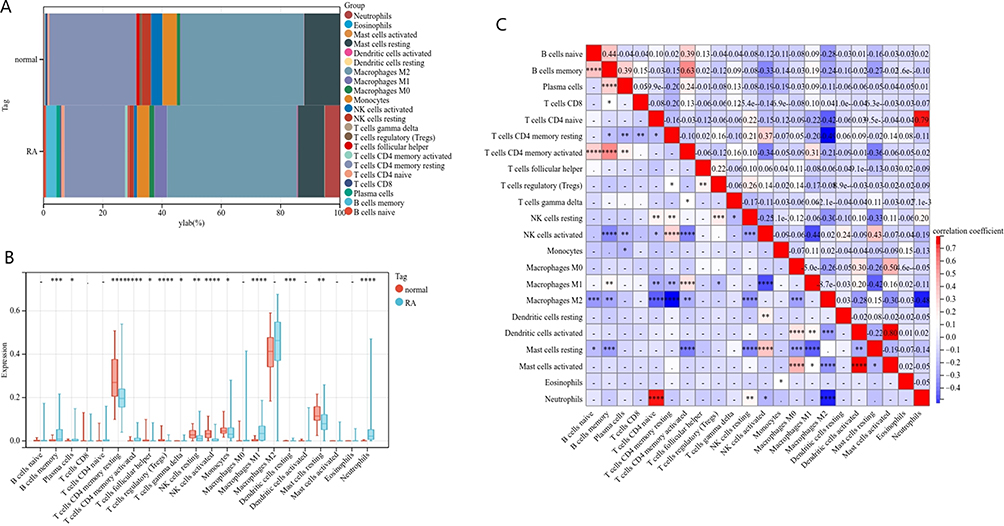 |
Figure 1 Immune cell infiltration in RA and normal synovium. (A) Histogram shows the composition of 22 immune cells in RA and normal synovium. (B) Violin diagram shows the difference of immune cells between RA patients and normal. (C) Correlation heatmap shows the relationship between immune cells. (means no significance, statistically significant difference was * p<0.05, **p<0.01, ***p<0.001, ****p<0.001). |
Screening of DE-IRGs and Enrichment Analysis in Synovium
In synovial tissue, 8007 up-regulated DEGs and 1741 down-regulated DEGs were found in normal control group and RA patients (Figure 2A). The heat map shows 20 up-regulated genes and 20 down-regulated genes with the most obvious differences (Figure 2B). Through the intersection of DEGs and immune related genes, a total of 467 DE-IRGs were obtained (Figure 2C).
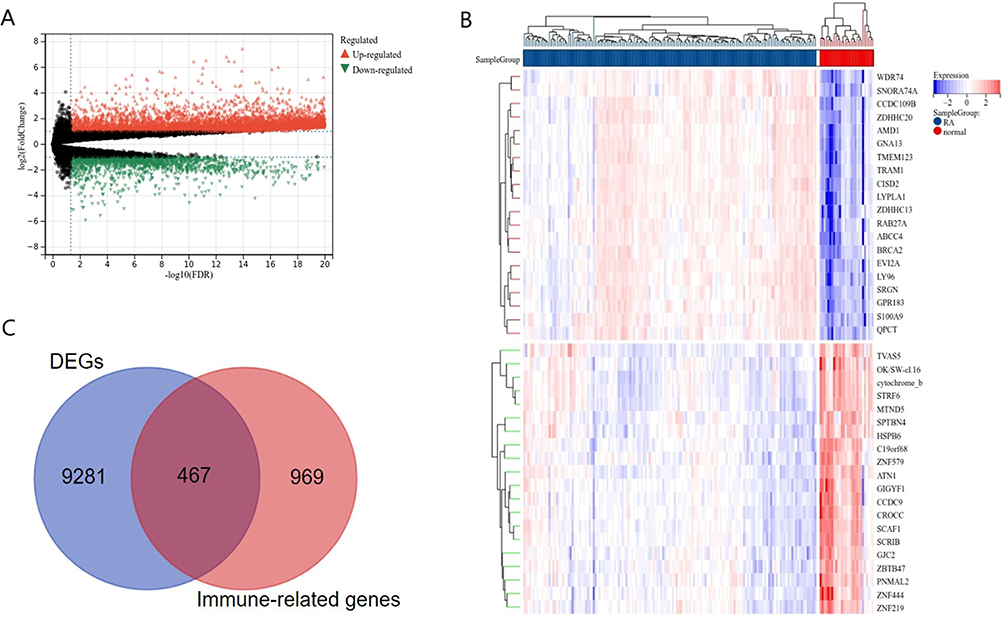 |
Figure 2 Identification of differential expressed immune related genes. (A) Volcano map shows DEGs of RA and normal in synovium. (B) Heatmap shows the top twenty up-regulated and down-regulated DEGs. (C) DE-IRGs screened by Venn diagram. |
GO enrichment analysis showed that the changes of biological process (BP) of synovial DE-IRGs were mainly concentrated in the cellular response to stimulus and cytokine related immune response (Figure 3A). Cellular components (CC) were concentrated in plasma membranes, and molecular functions (MF) were concentrated in receptor activity and cytokine activity (Figure 3B and C). KEGG pathway analysis showed that NK cell mediated cytotoxicity, T cell receptor signaling pathway, Th17 cell differentiation, B cell receptor signaling pathway and rheumatoid arthritis were the main enrichment pathways (Figure 3D). These results prove the effectiveness of immune enrichment analysis and the importance of immune cells in RA.
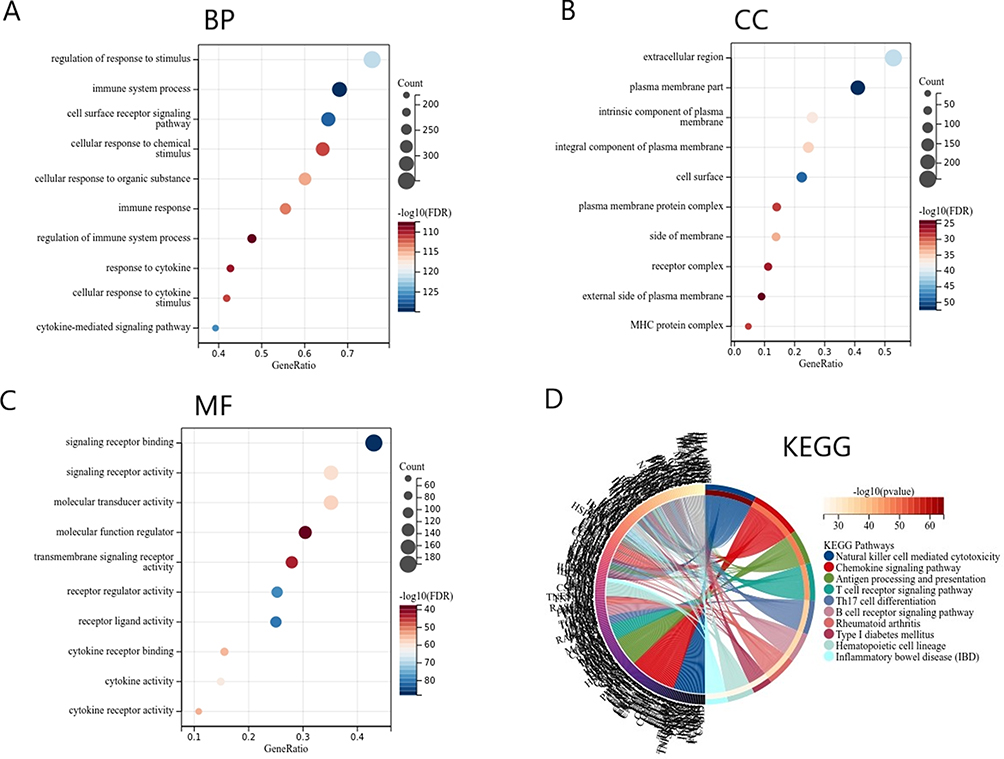 |
Figure 3 Function enrichment analysis of DE-IRGs. (A) Biological process of DE-IRGs. (B) Molecular function of DE-IRGs. (C) Cellular component of DE-IRGs. (D) KEGG pathway of DE-IRGs. |
Identification of RA Molecular Subtypes in Whole Blood
RA is a systemic immune disease, and diagnosis based on whole blood samples is simpler and more convenient. Therefore, we used immune enrichment scores based on whole blood gene expression profiles for unsupervised clustering. According to the area under the cumulative distribution function curve and the average consistency evaluation within the cluster group, the consistency is better when the specific cluster number k = 3 (Figure 4A and B). A total of 232 RA tissue samples were divided into three subtypes: Cluster 1 (n = 81), Cluster 2 (n = 80), Cluster 3 (n = 71) (Figure 4C). Umap analysis showed that there were differences among the three subtypes, which again proved the reliability of clustering (Figure 4D).
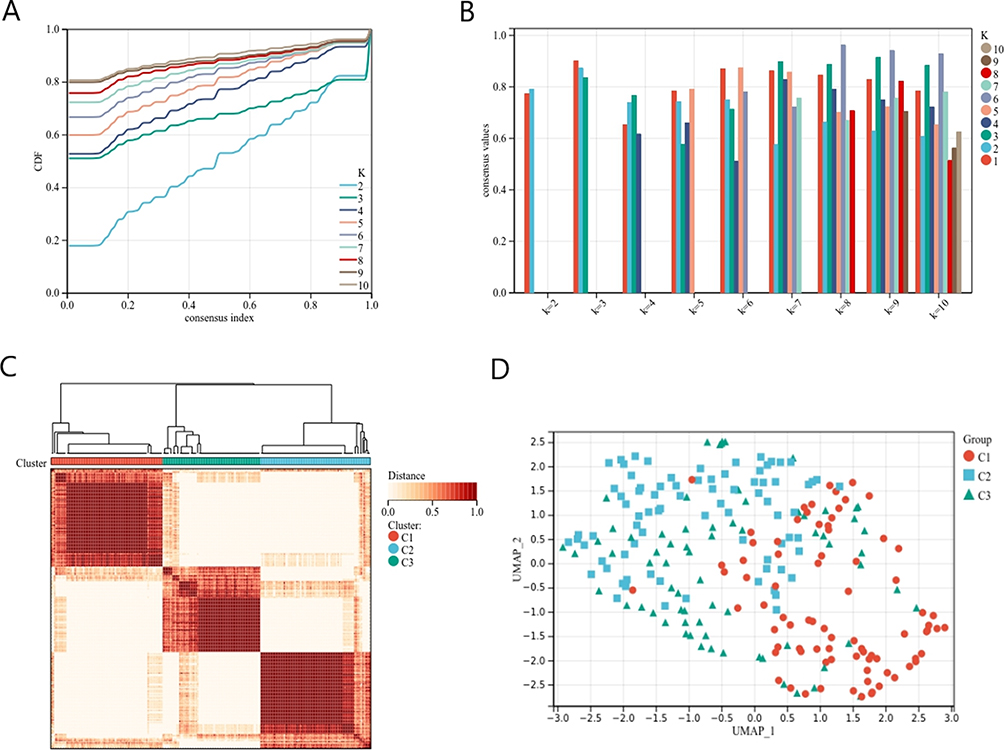 |
Figure 4 Cluster analysis based on the gene expression profile of RA whole blood. (A) Clustering cumulative distribution function (CDF) curve. (B) Samples clustering consistency, determine k=3. (C) Clustering Heatmap. (D) Umap diagram of different subtypes. |
Enrichment Analysis and Clinical Characteristics of Different Subtypes
GSEA analyzed the differences of gene expression profiles among different subtypes, and the results showed that the function of C1 subtype was enriched in neutrophil-related regulatory processes (Figure 5A and B). C2 subtype is closely related to T cells and participates in T cell receptor signaling pathways (Figure 5C and D). C3 subtype is related to dendritic cell activated and participates in a variety of immune signaling pathways such as systemic lupus erythematosus, autoimmune thyroid disease, intestinal immune network (Figure 5E and F).
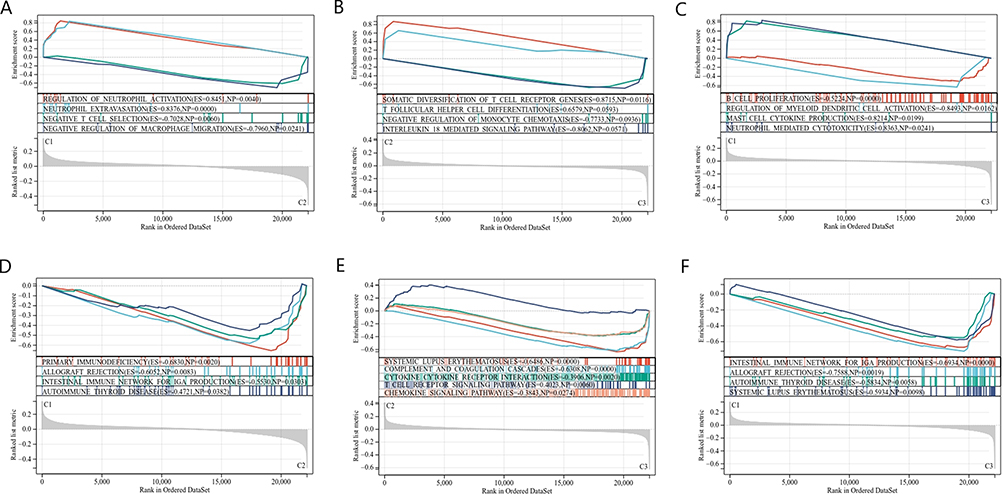 |
Figure 5 Gene set enrichment analysis. (A) GO enrichment analysis of C1vsC2 subtype. (B) GO enrichment analysis of C2vsC3 subtype. (C) GO enrichment analysis of C1vsC3 subtype. (D) KEGG pathway analysis of C1vsC2 subtype. (E) KEGG pathway analysis of C2vsC3 subtype. (F) KEGG pathway analysis of C1vsC3 subtype. |
According to the clinical characteristic data of different samples, we further compared the differences between different subtypes. Rheumatoid factor, anti-cyclic citrullinated peptide antibody and antinuclear antibody of C3 subtype were increased, among which rheumatoid factor was statistically significant (Figure 6A and B). The C-reactive protein (CRP), erythrocyte sedimentation rates (ESR) and matrix metalloproteinase 3 (MMP3) of C1 subtype were the highest, followed by C3, and C2 subtype was the lowest. The differences were statistically significant (Figure 6C). The visual analog score (VAS) of C1 subtype was significantly higher than that of C2 subtype (Figure 6D). There was no significant difference in the number of 28 tenderness and swelling joints (TJC28, SJC28), drug use between subtypes (Figure 6E and F).
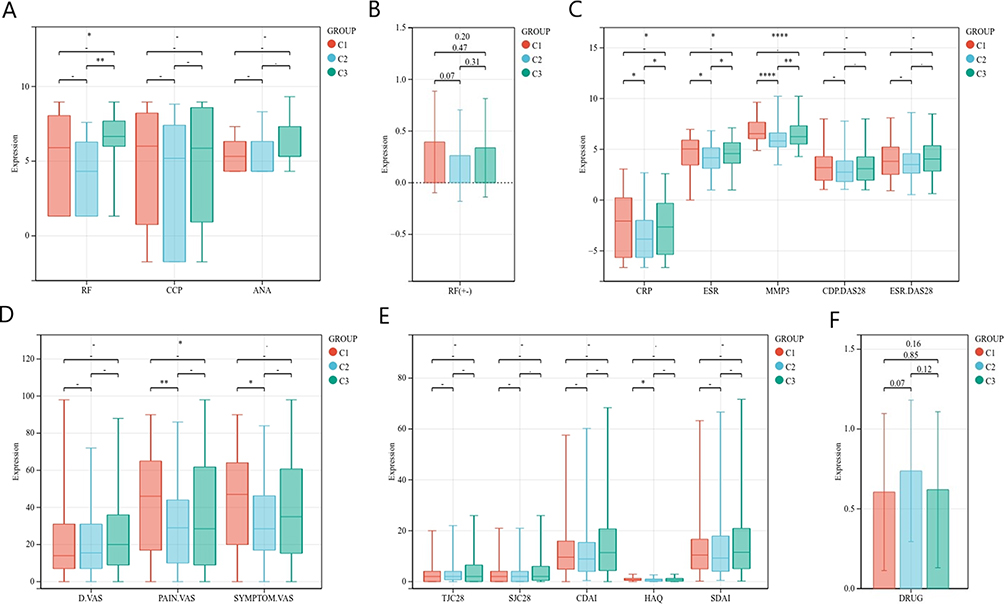 |
Figure 6 Differences in clinical characteristics of different subtypes. (A) Expression of RF, CCP, ANA in different subtypes. (B) RF positive in different subtypes. (C) Expression of CRP, ESR, MMP3, CRP.DAS28, ESR.DAS28 in different subtypes. (D) D.VAS, PAIN.VAS, SYMPTOM.VAS scores of different subtypes. (E) TJC28, SJC28, CDAI, HAQ, SDAI scores of different subtypes. (F) Number of drugs used by different subtypes. (means no significance, statistically significant difference was *p<0.05, **p<0.01, ****p<0.001). |
Immune Cell Infiltration of Different Subtypes in Whole Blood
We further analyzed the infiltration of different subtypes of immune cells in the whole blood. T cells CD8, T cells CD4 naive and NK cells resting are the main immune cells in whole blood, especially neutrophils (Figure 7A). We found that the expression of T cells CD8 and T cells CD4 naive of C2 subtype was significantly increased. The expression of T cells CD4 memory activated, T cells gamma delta was significantly higher than that of C1 subtype. The neutrophil expression of C1 subtype was significantly higher than that of the other two subtypes (Figure 7B). The correlation heat map showed that CRP, ESR and MMP3 were positively correlated with neutrophils and negatively correlated with NK cells resting (Figure 7C).
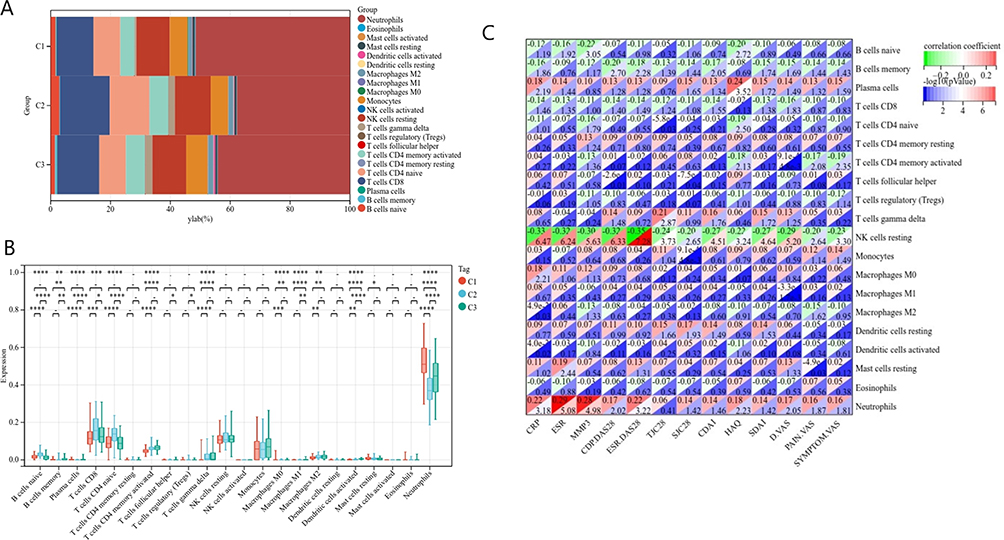 |
Figure 7 Immune cell infiltration in different subtypes of RA whole blood. (A) Histogram shows the composition of 22 immune cells in different subtypes of RA. (B) Violin diagram shows the difference of immune cells between different subtypes of RA. (C) Correlation heatmap shows the relationship between immune cells and clinical characteristics. (means no significance, statistically significant difference was *p<0.05, **p<0.01, ***p<0.001, ****p<0.001). |
Screening and Validation of Immunodiagnostic Markers
In order to screen hub genes of different subtypes, a scale-free network was constructed, and the soft threshold was set to 30 (Figure 8A and B). Based on the weighted gene co-expression correlation, 10 modules were obtained after hierarchical cluster analysis (Figure 8C and D). Among all modules, brown module was significantly positively correlated with C1 subtype, red and grey module was significantly positively correlated with C2 subtype, lightcyan module was significantly positively correlated with C3 subtype, r > 0.5 (Figure 8E).
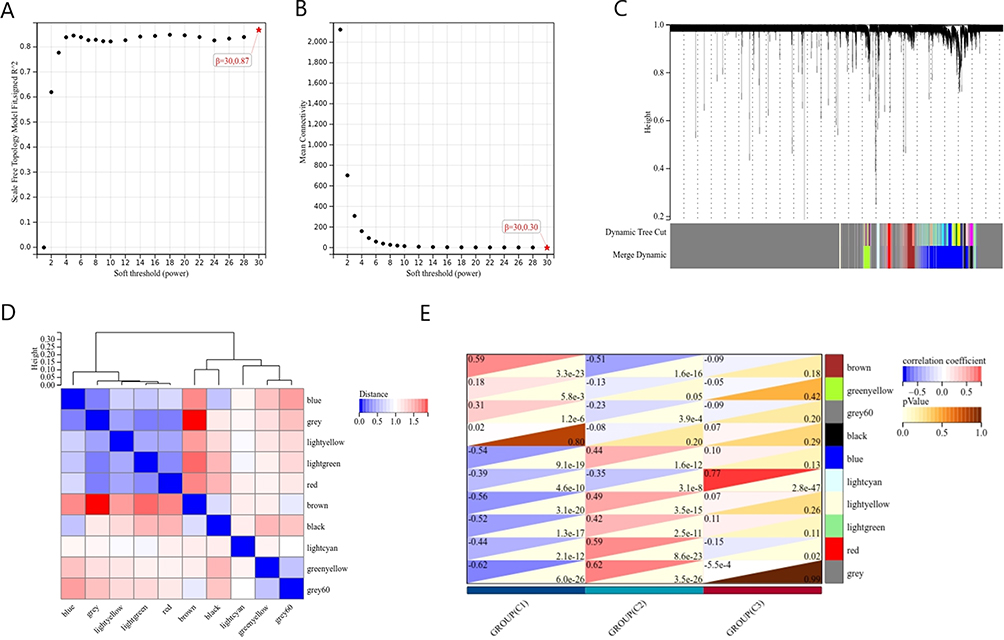 |
Figure 8 Weighted gene co-expression network analysis. (A and B) Select the appropriate soft threshold. (C) Gene dendrogram. (D) Correlation between different modules. (E) Correlations between different subtypes and modules. |
The diagnostic markers of different subtypes were obtained by overlapping hub genes of different subtype-related modules in whole blood with DE-IRGs in synovium. There are five immune hub genes in C1 subtype, four in C2 subtype and two in C3 subtype (Figure 9A). Among them, IFNGR1, NAMPT, PPP3CA are most related to neutrophils, IL21R, LCK, PRKCQ, TRAC are most related to T cells, and IFITM1, TAP1 are most related to dendritic cells activated (Figure 9B). In all 11 immune hub genes, the AUC value of 6 genes is greater than 0.75 (Figure 9C–H).
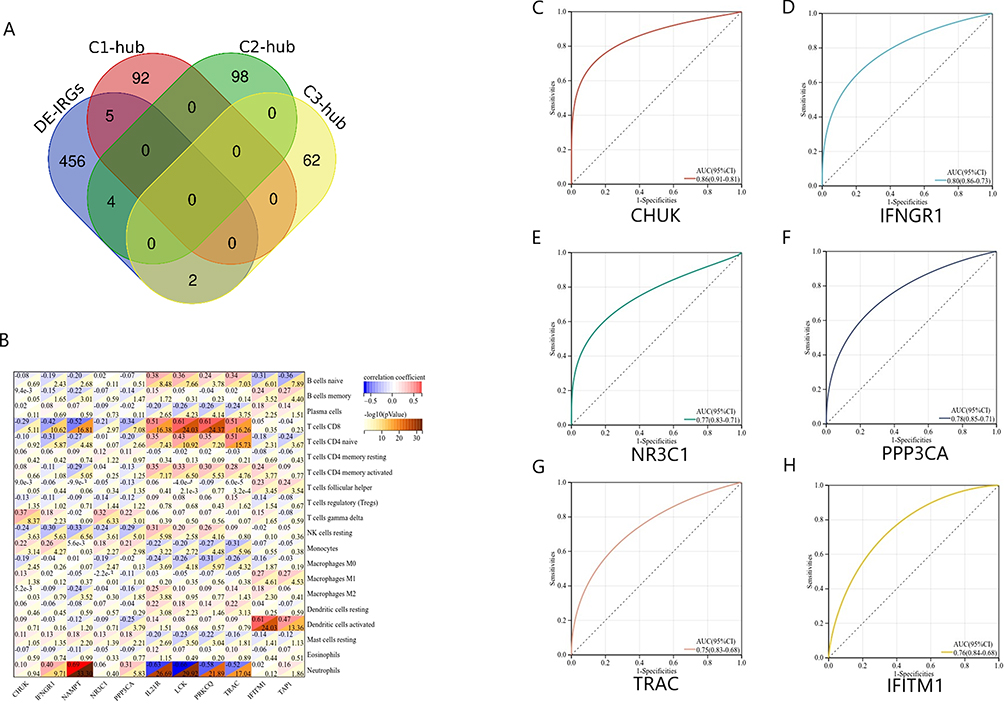 |
Figure 9 Screening immunodiagnostic markers of different subtypes. (A) Venn diagram shows the intersection of different subtype hub genes with DE-IRGs. (B) Heatmap of correlation between immunodiagnostic markers and immune cells. (C–H) Immunodiagnostic markers with AUC > 0.75. |
Based on the correlation between immune cells and AUC values, we determined that IFNGR1 was immunodiagnostic markers of C1 subtype, TRAC was diagnostic marker of C2 subtype, and IFITM1 was diagnostic marker of C3 subtype. These three immune diagnostic markers showed good efficacy in synovium, with significant differences, p < 0.0001 (Figure 10A–C). They also have diagnostic value in serum, but the difference is not as significant as that in synovium (Figure 10D–F).
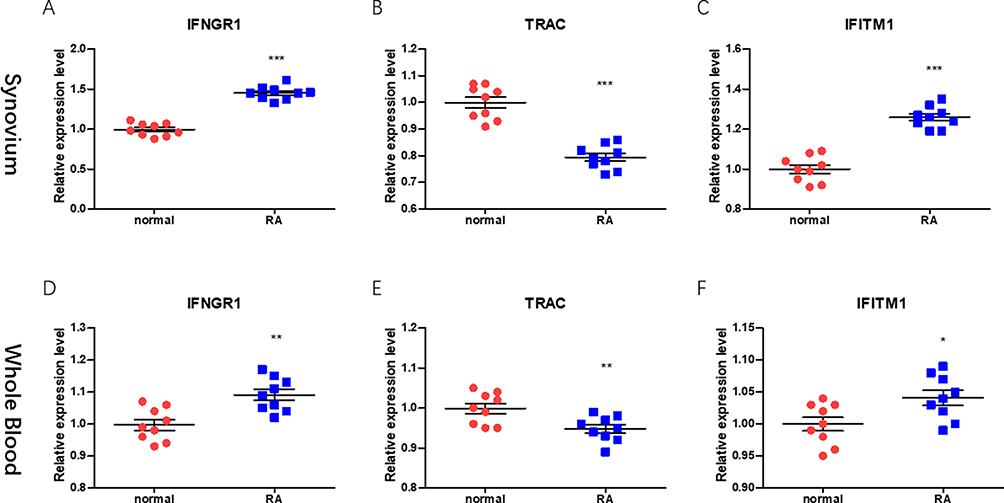 |
Figure 10 The validity of immunodiagnostic markers was verified by qRT-PCR. (A–C) Expression of RA and normal IFNGR1, TRAC, IFITM1 in synovium. (D–F) Expression of RA and normal IFNGR1, TRAC, IFITM1 in whole blood. (statistically significant difference was * p<0.05, ** p<0.01, *** p<0.001). |
Discussion
RA is a systemic autoimmune disease, with synovitis and erosive joint destruction as the main clinical manifestations.17 The immune system not only wrongly attacks normal joint tissue, but also involves extra-articular connective tissue such as serosa, heart, lung and eye.18 Therefore, our study first explored the infiltration mode of RA immune cells from the synovium of joints. The immune dysfunction of RA is closely related to the abnormality of immune cells.19 We found that RA synovial samples contain more B cells memory, T cells CD4 memory activated, macrophage M1 and neutrophils, while NK cells, mast cell resting are relatively less. Previous studies have shown that B cells can differentiate into plasma cells stimulated by antigens. Plasma cells synthesize and secrete antibodies, form antigen antibody complexes, deposit on the vascular wall and other parts, induce inflammatory reactions, and lead to multiple organ damage throughout the body.20 In our results, B cells memory is positively correlated with T cells CD4 memory activated. Activated CD4+T cells can also initiate specific immune responses and lead to corresponding arthritis symptoms.21 In addition, macrophages can secrete a large number of cytokines and differentiate into pro-inflammatory M1 subtypes in the synovitis environment. These cytokines can further lead to joint destruction through neutrophil recruitment and T cell activation.22
However, early RA is often difficult to diagnose because of its atypical clinical symptoms and lack of specific serum diagnostic markers.23 Existing articles only analyze the infiltration of immune cells in RA synovium, but RA is a systemic immune disease, and many patients have extra-articular symptoms.24 We combined gene expression profile data, clinical characteristics and immune cell infiltration to classify RA patients, in order to find more accurate diagnostic markers and drug treatment targets. We found that C1 subtype is enriched in neutrophil-related functions, and the neutrophil expression of this subtype is also significantly higher than that of the other two subtypes. Neutrophils have been found to be related to the occurrence and sustainable development of rheumatoid arthritis. Various chemokines can promote the migration of neutrophils to joints. The activation and proliferation of neutrophils promote cartilage destruction and bone absorption.25 The relief of RA symptoms is also related to the reduction and absorption of neutrophils in synovial fluid.26 Bont found that the antibody of neutrophil extracellular trap was related to the increase of RF, which may be a biomarker of RA, which was consistent with our experimental results.27 We also found that CRP, ESR and MMP3 of C1 subtype were significantly increased, and patients’ joint pain scores were higher. Therefore, we describe C1 as neutrophils associated acute joint pain subtype.
C2 subtype is enriched in T cells related functions, the expression of T cells CD8 and T cells CD4 naive is significantly increased, and T cells CD4 memory activated is also significantly higher than C1 subtype, T cells regulatory (Tregs) is higher than C3 subtype. The expression of RF, CRP, ESR, MMP3 and VAS score of C2 subtype were lower than those of the other two groups. Based on the above results, we described the C2 subtype as T cells related low immune subtype. Tregs cells regulate the immune response by secreting cytokines and reduce the pathological damage caused by immune inflammation.28 CD8+T cells have anti-inflammatory properties and help reduce the persistent autoimmune response of rheumatoid joints.29 Clinical characteristics also proved that C2 subtype may have mild inflammation and better prognosis. C3 subtype is enriched in a variety of immune disease pathways throughout the body, and its expression in immune cells such as B cells memory, T cells gamma delta, macrophages M1, dendritic cells activated are significantly higher than that of the other two subtypes. RF is an autoantibody with denatured IgG as the target antigen, which exists in a variety of autoimmune diseases. RF with high titer often indicates poor prognosis.30 According to the high expression of RF in C3 subtype, we describe it as variety of immune cells related high immune subtypes, which may be related to the extra-articular symptoms of RA. Dana classifies the gene expression data of RA synovium tissue, which distinguishes high inflammatory subtypes characterized by extensive leukocyte infiltration.31 The CRP, ESR and joint pain levels of this subtype are high, which once again proves the reliability of our classification.
In order to further study the diagnostic markers of each subtype, combining DE-IRGs in synovium and hub genes of different subtypes, we obtained three immune diagnostic markers. Among them, IFNGR1 was immune diagnostic marker of C1 subtype. IFNGR1 expression is associated with the presence of RA. IFNGR1 (interferon-γ receptor 1), after binding of IFN-γ, signal transduction activates macrophages through JAK-STAT pathway and initiates the secretion of proinflammatory cytokines to play a role in RA.32 In the correlation heat map, IFNGR1 is related to neutrophils, but its relationship with neutrophils is still being explored.33 TRAC (TCRα subunit constant gene) mutations can cause hereditary immunodeficiency disorders. TRAC mainly exists on the surface of T cells, and its mutation leads to T cells dysfunction.34 C2 subtype is associated with T cells, so TRAC was immunodiagnostic marker of C2 subtype. IFITM1 is a membrane protein, which can be induced by interferon and plays a key role in immune response.35 Interferon (IFN) is a pleiotropic cytokine produced as a defense response in innate immunity and has an immunomodulatory effect.36 Nehmar found that IFN may promote the production of pathogenic autoantibodies. IFN signals describe a subgroup of RA patients and are related to disease activity score or autoantibodies.37 This also provides further theoretical support for our experiment.
Conclusion
Rheumatoid arthritis is a systemic immune disease involving T cells CD4, NK cells activated, macrophage M1 and neutrophils. We classified them into high CRP, ESR, neutrophils associated acute pain subtypes, T cells associated low immune subtypes, and multiple immune cells associated high immune subtypes. This provides a new idea for the diagnosis and treatment of RA.
Data Sharing Statement
The data used to support the findings of this study are included within the article.
Ethical Review Statement
This study was approved by the research ethics committee of Lianshui County People’s Hospital.
Consent for Publication
Informed consent was obtained from all individual participants included in the study.
Acknowledgments
We would like to thank Qifan Li for communicating data and information.
Author Contributions
All authors contributed to data analysis, drafting or revising the article, have agreed on the journal to which the article will be submitted, gave final approval of the version to be published, and agree to be accountable for all aspects of the work.
Funding
No benefit in any form has been received or will be received from a commercial party related directly or indirectly to the subject of this article.
Disclosure
The authors declare that they have no conflicts of interest in this work.
References
1. Smolen JS, Aletaha D, McInnes IB. Rheumatoid arthritis. Lancet. 2016;388(10055):2023–2038. doi:10.1016/S0140-6736(16)30173-8
2. Finckh A, Gilbert B, Hodkinson B, et al. Global epidemiology of rheumatoid arthritis. Nat Rev Rheumatol. 2022;18(10):591–602. doi:10.1038/s41584-022-00827-y
3. Smolen JS, Aletaha D, Barton A, et al. Rheumatoid arthritis. Nat Rev Dis Primers. 2018;4:18001. doi:10.1038/nrdp.2018.1
4. Firestein GS, McInnes IB. Immunopathogenesis of Rheumatoid Arthritis. Immunity. 2017;46(2):183–196. doi:10.1016/j.immuni.2017.02.006
5. Yap HY, Tee SZ, Wong MM, Chow SK, Peh SC, Teow SY. Pathogenic role of immune cells in rheumatoid arthritis: implications in clinical treatment and biomarker development. Cells. 2018;7(10):161.
6. Kurowska-Stolarska M, Alivernini S. Synovial tissue macrophages in joint homeostasis, rheumatoid arthritis and disease remission. Nat Rev Rheumatol. 2022;18(7):384–397. doi:10.1038/s41584-022-00790-8
7. Argyriou A, Wadsworth MH, Lendvai A, et al. Single cell sequencing identifies clonally expanded synovial CD4(+) TPH cells expressing GPR56 in rheumatoid arthritis. Nat Commun. 2022;13(1):4046. doi:10.1038/s41467-022-31519-6
8. Zhang AL, Colmenero P, Purath U, et al. Natural killer cells trigger differentiation of monocytes into dendritic cells. Blood. 2007;110(7):2484–2493. doi:10.1182/blood-2007-02-076364
9. McInnes IB, Schett G. The pathogenesis of rheumatoid arthritis. N Engl J Med. 2011;365(23):2205–2219. doi:10.1056/NEJMra1004965
10. Kim EJ, Collard HR, King TE. Rheumatoid arthritis-associated interstitial lung disease: the relevance of histopathologic and radiographic pattern. Chest. 2009;136(5):1397–1405. doi:10.1378/chest.09-0444
11. Aletaha D, Smolen JS. Diagnosis and management of rheumatoid arthritis: a review. JAMA. 2018;320(13):1360–1372. doi:10.1001/jama.2018.13103
12. Laurent L, Anquetil F, Clavel C, et al. IgM rheumatoid factor amplifies the inflammatory response of macrophages induced by the rheumatoid arthritis-specific immune complexes containing anticitrullinated protein antibodies. Ann Rheum Dis. 2015;74(7):1425–1431. doi:10.1136/annrheumdis-2013-204543
13. Rhodes B, Furnrohr BG, Vyse TJ. C-reactive protein in rheumatology: biology and genetics. Nat Rev Rheumatol. 2011;7(5):282–289. doi:10.1038/nrrheum.2011.37
14. Ungethuem U, Haeupl T, Witt H, et al. Molecular signatures and new candidates to target the pathogenesis of rheumatoid arthritis. Physiol Genomics. 2010;42A(4):267–282. doi:10.1152/physiolgenomics.00004.2010
15. Zhang F, Wei K, Slowikowski K, et al. Defining inflammatory cell states in rheumatoid arthritis joint synovial tissues by integrating single-cell transcriptomics and mass cytometry. Nat Immunol. 2019;20(7):928–942. doi:10.1038/s41590-019-0378-1
16. Wang J, Xue Y, Zhou L. Comparison of immune cells and diagnostic markers between spondyloarthritis and rheumatoid arthritis by bioinformatics analysis. J Transl Med. 2022;20(1):196. doi:10.1186/s12967-022-03390-y
17. van der Woude D, van der Helm-van Mil AHM. Update on the epidemiology, risk factors, and disease outcomes of rheumatoid arthritis. Best Pract Res Clin Rheumatol. 2018;32(2):174–187. doi:10.1016/j.berh.2018.10.005
18. Conforti A, Di Cola I, Pavlych V, et al. Beyond the joints, the extra-articular manifestations in rheumatoid arthritis. Autoimmun Rev. 2021;20(2):102735. doi:10.1016/j.autrev.2020.102735
19. Yu R, Zhang J, Zhuo Y, et al. Identification of diagnostic signatures and immune cell infiltration characteristics in rheumatoid arthritis by integrating bioinformatic analysis and machine-learning strategies. Front Immunol. 2021;12:724934. doi:10.3389/fimmu.2021.724934
20. Bugatti S, Vitolo B, Caporali R, Montecucco C, Manzo A. B cells in rheumatoid arthritis: from pathogenic players to disease biomarkers. Biomed Res Int. 2014;2014:681678. doi:10.1155/2014/681678
21. Prendergast CT, Patakas A, Al-Khabouri S, et al. Visualising the interaction of CD4 T cells and DCs in the evolution of inflammatory arthritis. Ann Rheum Dis. 2018;77(4):579–588. doi:10.1136/annrheumdis-2017-212279
22. Guo D, Lin C, Lu Y, et al. FABP4 secreted by M1-polarized macrophages promotes synovitis and angiogenesis to exacerbate rheumatoid arthritis. Bone Res. 2022;10(1):45. doi:10.1038/s41413-022-00211-2
23. Souto-Carneiro M, Toth L, Behnisch R, et al. Differences in the serum metabolome and lipidome identify potential biomarkers for seronegative rheumatoid arthritis versus psoriatic arthritis. Ann Rheum Dis. 2020;79(4):499–506. doi:10.1136/annrheumdis-2019-216374
24. Zhou S, Lu H, Xiong M. Identifying immune cell infiltration and effective diagnostic biomarkers in rheumatoid arthritis by bioinformatics analysis. Front Immunol. 2021;12:726747. doi:10.3389/fimmu.2021.726747
25. Fresneda Alarcon M, McLaren Z, Wright HL. Neutrophils in the pathogenesis of rheumatoid arthritis and systemic lupus erythematosus: same foe different M.O. Front Immunol. 2021;12:649693. doi:10.3389/fimmu.2021.649693
26. O’Neil LJ, Kaplan MJ. Neutrophils in rheumatoid arthritis: breaking immune tolerance and fueling disease. Trends Mol Med. 2019;25(3):215–227. doi:10.1016/j.molmed.2018.12.008
27. de Bont CM, Stokman MEM, Faas P, et al. Autoantibodies to neutrophil extracellular traps represent a potential serological biomarker in rheumatoid arthritis. J Autoimmun. 2020;113:102484. doi:10.1016/j.jaut.2020.102484
28. Wang T, Sun X, Zhao J, et al. Regulatory T cells in rheumatoid arthritis showed increased plasticity toward Th17 but retained suppressive function in peripheral blood. Ann Rheum Dis. 2015;74(6):1293–1301. doi:10.1136/annrheumdis-2013-204228
29. Carvalheiro H, da Silva JA, Souto-Carneiro MM. Potential roles for CD8(+) T cells in rheumatoid arthritis. Autoimmun Rev. 2013;12(3):401–409. doi:10.1016/j.autrev.2012.07.011
30. Arlestig L, Mullazehi M, Kokkonen H, Rocklov J, Ronnelid J, Dahlqvist SR. Antibodies against cyclic citrullinated peptides of IgG, IgA and IgM isotype and rheumatoid factor of IgM and IgA isotype are increased in unaffected members of multicase rheumatoid arthritis families from northern Sweden. Ann Rheum Dis. 2012;71(6):825–829. doi:10.1136/annrheumdis-2011-200668
31. Orange DE, Agius P, DiCarlo EF, et al. Identification of three rheumatoid arthritis disease subtypes by machine learning integration of synovial histologic features and RNA sequencing data. Arthritis Rheumatol. 2018;70(5):690–701. doi:10.1002/art.40428
32. Navarro-Millan I, Darrah E, Westfall AO, et al. Association of anti-peptidyl arginine deiminase antibodies with radiographic severity of rheumatoid arthritis in African Americans. Arthritis Res Ther. 2016;18(1):241. doi:10.1186/s13075-016-1126-7
33. Yang C, McDermot DS, Pasricha S, et al. IFNγ receptor down-regulation facilitates Legionella survival in alveolar macrophages. J Leukoc Biol. 2020;107(2):273–284. doi:10.1002/JLB.4MA1019-152R
34. Morgan NV, Goddard S, Cardno TS, et al. Mutation in the TCRalpha subunit constant gene (TRAC) leads to a human immunodeficiency disorder characterized by a lack of TCRalphabeta+ T cells. J Clin Invest. 2011;121(2):695–702. doi:10.1172/JCI41931
35. Gomez-Herranz M, Nekulova M, Faktor J, et al. The effects of IFITM1 and IFITM3 gene deletion on IFNgamma stimulated protein synthesis. Cell Signal. 2019;60:39–56. doi:10.1016/j.cellsig.2019.03.024
36. Takaoka A, Yanai H. Interferon signalling network in innate defence. Cell Microbiol. 2006;8(6):907–922. doi:10.1111/j.1462-5822.2006.00716.x
37. Nehmar R, Mariotte A, de Cauwer A, Sibilia J, Bahram S, Georgel P. Therapeutic perspectives for interferons and plasmacytoid dendritic cells in rheumatoid arthritis. Trends Mol Med. 2018;24(4):338–347. doi:10.1016/j.molmed.2018.02.001
 © 2024 The Author(s). This work is published and licensed by Dove Medical Press Limited. The
full terms of this license are available at https://www.dovepress.com/terms
and incorporate the Creative Commons Attribution
- Non Commercial (unported, 3.0) License.
By accessing the work you hereby accept the Terms. Non-commercial uses of the work are permitted
without any further permission from Dove Medical Press Limited, provided the work is properly
attributed. For permission for commercial use of this work, please see paragraphs 4.2 and 5 of our Terms.
© 2024 The Author(s). This work is published and licensed by Dove Medical Press Limited. The
full terms of this license are available at https://www.dovepress.com/terms
and incorporate the Creative Commons Attribution
- Non Commercial (unported, 3.0) License.
By accessing the work you hereby accept the Terms. Non-commercial uses of the work are permitted
without any further permission from Dove Medical Press Limited, provided the work is properly
attributed. For permission for commercial use of this work, please see paragraphs 4.2 and 5 of our Terms.