Back to Journals » International Journal of General Medicine » Volume 19
Network Pharmacology-Serum Metabolomics Integration Identifies Key Targets, Biomarkers and Mechanism of Sendeng-4 in Rheumatoid Arthritis Therapy
Authors Zhou F, Li J, Zhou Y, Zhang X, Luo J, Li X, Sun W, Zhang Q ![]() , Li M
, Li M ![]()
Received 3 February 2026
Accepted for publication 3 April 2026
Published 15 April 2026 Volume 2026:19 597129
DOI https://doi.org/10.2147/IJGM.S597129
Checked for plagiarism Yes
Review by Single anonymous peer review
Peer reviewer comments 2
Editor who approved publication: Dr Woon-Man Kung
Fengye Zhou,1,* Jun Li,2,* Yiyang Zhou,3,* Xueying Zhang,2,* Jun Luo,2 Xinkui Li,4 Wenlong Sun,5 Qian Zhang,3 Mengyao Li6
1Department of Pharmacy, Affiliated Hospital of Inner Mongolia Medical University, Hohhot, Inner Mongolia, People’s Republic of China; 2College of Pharmacy, Inner Mongolia Medical University, Hohhot, Inner Mongolia, People’s Republic of China; 3The First Clinical School of Medicine, Inner Mongolia Medical University, Hohhot, Inner Mongolia, People’s Republic of China; 4School of Computer Science and Information Technology, Inner Mongolia Medical University, Hohhot, Inner Mongolia, People’s Republic of China; 5School of Life Sciences and Medicine, Shandong University of Technology, Zibo, Shandong, People’s Republic of China; 6State Key Laboratory of Systems Medicine for Cancer, Shanghai Cancer Institute, Renji Hospital Affiliated to Shanghai Jiao Tong University School of Medicine, Shanghai, People’s Republic of China
*These authors contributed equally to this work
Correspondence: Qian Zhang, Email [email protected] Mengyao Li, Email [email protected]
Purpose: Rheumatoid arthritis (RA) is characterized by chronic inflammatory synovitis and immunometabolic dysregulation, necessitating safer multi-target therapies. Sendeng-4 (SD-4) is a traditional Mongolian medicinal formula composed of four botanical ingredients (Xanthoceras sorbifolia Bunge, Gardenia jasminoides Ellis, Chebulae Fructus, and Toosendan Fructus) traditionally used for RA. However, its circulating material basis and mechanisms remain unclear. This study aimed to elucidate the pharmacodynamic constituents and potential mechanisms of SD-4 in RA.
Methods: An integrative approach combining serum pharmacochemistry, network pharmacology, molecular docking, in vivo pharmacodynamics, and non-targeted serum metabolomics was employed. Absorbable constituents of SD-4 were identified by HPLC-Q-Exactive-Orbitrap-MS. Key targets and pathways were explored using network analysis, and therapeutic efficacy and metabolomic biomarkers were evaluated in a collagen-induced arthritis mouse model.
Results: Twenty absorbable constituents were detected, with SRC, PIK3CA, and PIK3R1 emerging as key targets involved in PI3K-AKT and HIF-1 signaling. SD-4 treatment significantly reduced arthritis scores (by up to 45% in high-dose mice), paw thickness, and serum pro-inflammatory cytokines (TNF-α, IL-6, IL-1β decreased by 30– 55%, all P < 0.05). Serum metabolomics identified 46 disease-associated metabolites reversed by SD-4, particularly involving tryptophan metabolism and glycolysis/gluconeogenesis. Correlation analyses suggest these metabolic changes are associated with modulation of inflammatory pathways.
Conclusion: SD-4 alleviates arthritis in mice, likely through modulation of the PI3K/SRC network and partial rebalancing of glycolysis–tryptophan metabolic crosstalk, restoring immunometabolic homeostasis. These findings support the potential clinical application of SD-4 for RA and provide a mechanistic framework for its multi-target actions.
Keywords: SenDeng-4, absorbed components, serum metabolomics, network pharmacology, rheumatoid arthritis therapy
Introduction
Rheumatoid arthritis (RA) is a chronic autoimmune disease characterized primarily by inflammatory synovitis. According to the Global Burden of Disease (GBD) study1, in 2020, the global prevalence of RA was approximately 17.6 million, representing a 14.1% increase since 1990. Population-based projections further estimate that, by 2050, the number of affected individuals will rise to 31.7 million, posing a major challenge to health-care systems worldwide. Current standard-of-care therapies, non-steroidal anti-inflammatory drugs, immunosuppressants, and glucocorticoids, can disrupt immune regulation and are associated with significant adverse effects. Because no curative treatment for RA exists, identifying novel therapeutic agents is crucial for both elucidating the disease’s pathophysiology and developing new strategies that improve therapeutic responsiveness.
This study focuses on SenDeng-4, a Mongolian preparation officially recorded in the Drug Standards of the Ministry of Health of the People’s Republic of China (Mongolian Medicine Volume)2. It is considered a canonical remedy for RA in Mongolian medicine. SenDeng-4 comprises four botanical components: the woody part of the dried stem or branch of Xanthoceras sorbifolia Bunge, Gardenia jasminoides Ellis, Chebulae Fructus, and Toosendan Fructus. Each component has a defined traditional use: Xanthoceras sorbifolia Bunge is applied for joint pain relief and edema reduction; Gardenia jasminoides Ellis exhibits anti-inflammatory and hepatoprotective effects; Chebulae Fructus is known for immunomodulation and antioxidant activity; and Toosendan Fructus contributes analgesic and anti-inflammatory effects. The combination of these botanicals is designed to synergistically alleviate RA symptoms, harmonize immune function, and restore systemic balance according to Mongolian medicinal principles.3 These herbs exert synergistic anti-inflammatory, anti-edematous, and analgesic effects and are clinically employed for the management of gout, RA, and related disorders4. In recent years, extensive research has been conducted on SenDeng-4, with a primary focus on chemical characterization and the establishment of quality standards.5 However, mechanistic investigations into its pharmacological actions remain comparatively limited.
According to serum pharmacochemistry, only constituents of a traditional formula that enter systemic circulation can be regarded as prerequisites for therapeutic efficacy.6 High-resolution liquid chromatography–mass spectrometry (HR-LC-MS), integrated with network pharmacology, allows systematic characterization of these serum-transferred components and provides a more accurate view of drug–target–disease associations.7 In parallel, metabolomics captures global alterations in endogenous metabolites induced by genetic or environmental perturbations, reflecting shifts in cellular phenotype and function across biological systems.6,8,9 Network pharmacology and metabolomics have emerged as powerful tools for dissecting multi-component herbal formulations. Serum pharmacochemistry allows identification of bioavailable constituents, while network-based analysis maps potential compound-target interactions, and metabolomics captures systemic metabolic alterations induced by therapy. Although prior studies have applied these techniques to herbal RA interventions, most focus on either chemical profiling or target prediction without integrated validation of metabolic pathways and in vivo efficacy, limiting mechanistic insight.
This study addresses these gaps by integrating serum pharmacochemistry, network pharmacology, molecular docking, in vivo pharmacodynamics, and non-targeted serum metabolomics to elucidate the pharmacodynamic material basis and mechanistic pathways of SD-4 in RA. By linking absorbed constituents to target networks and metabolic alterations, this work advances beyond previous studies to provide a holistic, multi-omics understanding of SD-4’s therapeutic potential and identifies key biomarkers and immunometabolic pathways relevant to RA.
Materials and Methods
Major Instruments
HPLC-Q-Exactive high-resolution liquid chromatograph–mass spectrometer (Thermo Fisher Scientific, USA); FA1204B analytical balance (0.01 mg resolution, Qingdao Juchuangshiji Environmental Protection Co., Ltd., China); ZLS-2 vacuum centrifugal concentrator (Xundi Instruments, Jiangsu, China); and TGL-16MC high-speed refrigerated centrifuge (Changsha Xiangrui Centrifuge Instrument Co., Ltd., China); were used in this study.
Reagents and Consumables
Reference standards Rutin (batch No. 100080–202012, purity ≥ 98.0%) and Ferulin (batch No. 110773–201915, purity ≥ 99.4%) were supplied by the National Institutes for Food and Drug Control, China. Luteolin (batch No. DSTDM003201, purity ≥ 98.0%) was purchased from Chengdu Desite Biotechnology Co., Ltd. (China). Gallic acid (batch No. PU0918, purity ≥ 98.5%); Corilagin (batch No. PU0414, purity ≥ 98.5%), Catechin (batch No. PU0722, purity ≥ 98.5%), Dihydromyricetin (batch No. PU0275, purity ≥ 98.5%), Geniposide (batch No. PU0290, purity ≥ 98.5%), Toosendanin (batch No. PU1056, purity ≥ 98.5%), Myricetin (batch No. PS1149, purity ≥ 98.0%), Quercetin (batch No. PU0698, purity ≥ 98.5%), and Ellagic acid (batch No. PU0843, purity ≥ 98.5%) were provided by Chengdu Push Biotechnology Co., Ltd. (China).
Mouse interleukin-1β (IL-1β) ELISA kit (batch No. MM-0040M1), Mouse interleukin-6 (IL-6) ELISA kit (batch No. MM-0163M1), and Mouse tumor necrosis factor-α (TNF-α) ELISA kit (batch No. MM-0132M1) were procured from the Jiangsu Meimian Industrial Co., Ltd. (China). Sendeng-4 lyophilized powder was prepared in-house, while Methanol (LC-MS grade) was from Fisher Scientific (USA), Formic acid (analytical grade) from Tokyo Chemical Industry Co., Ltd. (Japan), and Distilled water from Watsons, Guangzhou (China).
Experimental Animals
Sprague–Dawley rats and Six- to eight-week-old SPF-grade C57BL/6 mice were obtained from the Laboratory Animal Center of Inner Mongolia Medical University (production license No. SCXK [Mongolia] 2020–0003). Animals were housed at 22 ± 3 °C with 50 ± 10% relative humidity under a 12 h light/12 h dark cycle, with free access to food and water.
Methods
Analysis of SenDeng-4 Serum-Transferred Constituents
Preparation of SenDeng-4 Extract
The four botanical components of SD-4, Xanthoceras sorbifolia Bunge, Gardenia jasminoides Ellis, Chebulae Fructus, and Toosendan Fructus were combined in a prescription ratio of 5:1:1:3 by weight according to traditional formulations. The four crude botanical components of SenDeng-4 were weighed accurately according to the prescription ratio to yield a total of approximately 100 g. The mixture was transferred to a round-bottom flask, extracted twice with 1000 mL of 75% (v/v) aqueous ethanol under reflux for 1.5 h each, and filtered. The combined filtrates were concentrated under reduced pressure using a rotary evaporator and subsequently lyophilized to obtain the SenDeng-4 dry extract. Quality control was ensured using HPLC markers including quercetin, myricetin, geniposide, and dihydromyricetin, with content verified against reference standards (≥98% purity) to maintain batch-to-batch consistency.
Preparation of Reference Standard Solutions
Each reference standard was accurately weighed, dissolved separately in methanol under sonication, and diluted to volume in a 10 mL volumetric flask. Stock solutions were prepared at concentrations of 322.00 μg/mL (Gallic acid), 341.00 μg/mL (Dihydromyricetin), 334.00 μg/mL (Catechin), 306.00 μg/mL (Corilagin), 355.00 μg/mL (Rutin), 302.00 μg/mL (Geniposide), 318.00 μg/mL (Luteolin), 347.00 μg/mL (Myricetin), 315.00 μg/mL (Quercetin), 311.00 μg/mL (Ellagic acid), 399.00 μg/mL (Ferulin), and 331.00 μg/mL (Toosendanin). A mixed reference solution was prepared by diluting 20 μL of each stock in a 10 mL volumetric flask with methanol, yielding final concentrations of 644.00, 682.00, 668.00, 712.00, 710.00, 604.00, 636.00, 694.00, 630.00, 622.00, 798.00, and 662.00 ng/mL, respectively. The mixed solution was stored at 4 °C until analysis.
Preparation of Serum Samples
Twelve Sprague–Dawley rats were acclimatized and randomly divided into a blank group (n = 6) and a drug group (n = 6). The drug group received SenDeng-4 lyophilized powder suspended in water at a dose of 4.00 g/kg body weight, whereas the blank group received an equal volume of purified water (10 mL/kg). Administration was performed once daily by gavage for five consecutive days. At 0.5, 1.0, 1.5, and 2.0 h after the final dose, approximately 0.5 mL of blood was collected from the retro-orbital venous plexus. Samples were centrifuged at 3000 r/min for 10 min at 4 °C, and the resulting sera were pooled per animal and stored at −20 °C until analysis.
Processing of Serum Samples
For each group, 500 μL of sera collected at the four time points were pooled in a 10 mL centrifuge tube. Six milliliters of LC-MS grade methanol were added, and the mixture was vortexed for 1 min and centrifuged at 12000 r/min for 10 min at 4 °C. The supernatant was evaporated to dryness under a gentle stream of nitrogen. The residue was reconstituted in 100 μL LC-MS grade methanol, vortex-mixed, and centrifuged again at 12000 r/min for 10 min at 4 °C. The final supernatant was transferred into LC vial inserts and stored at 4 °C until analysis.
Quality-control (QC) samples were prepared by spiking 100 μL of the mixed reference solution into 500 μL blank serum and processed exactly as described above.
Chromatographic and Mass-Spectrometric Conditions
Chromatographic separation was performed on an Eclipse Plus C18 column (4.6 mm × 150 mm, 5 μm). The mobile phase consisted of methanol (A) and 0.1% formic acid in water (B). The gradient program was: 0–6 min, 7% A; 6–11 min, 7%→21% A; 11–14 min, 21%→43% A; 14–17 min, 43%→60% A; 17–20 min, 60%→75% A; 20–24 min, 75%→80% A; 24–28 min, 80%→85% A; 28–35 min, 85%→93% A; 35–40 min, 93% A. The flow rate was 0.35 mL/min, the column temperature was maintained at 35 °C, and the injection volume was 10 μL.
Mass spectrometric analysis was performed using a heated electrospray ionization (HESI) source in Full MS/dd-MS2 mode. Resolution was set at 70,000 (Full MS) and 17,500 (dd-MS2). Spray voltage was 3.50 kV (negative) and 4.20 kV (positive). Normalized collision energy was 30 eV.
Data Analysis
A local SenDeng-4 chemical component database was constructed by searching CNKI, Wanfang Data, and other databases. Total ion current data were processed using the instrument’s mass spectrometry software, which included elemental composition fitting, peak extraction, and calculation of exact mass and mass deviation. Identification was based on a mass error of ≤10 × 10−2, supported by MS2 fragmentation patterns and published literature. This enabled characterization of both the intrinsic constituents of SenDeng-4 and the serum-transferred components.
Network Pharmacology Analysis of Serum-Based Absorbable Components
Screening of Common Targets Between Absorbable Components and Disease
Absorbable compounds identified from rat serum via HPLC-Q-Exactive-Orbitrap-MS were included in the network pharmacology analysis. Compound structures were retrieved from PubChem and SwissTargetPrediction was used for target prediction (score >0.1 retained). Disease-related targets for RA were obtained from GeneCards, OMIM, and TTD, and duplicates were removed. The overlap between component targets and disease targets was identified with Venny 2.1, yielding putative targets through which SenDeng-4 may exert therapeutic activity against RA.
Construction of Category–Component–Target Interaction Network
Twenty serum absorbable components and their corresponding common targets were imported into Cytoscape 3.9.1 to construct an “absorbable component–potential target” interaction network.
Construction of the Protein–Protein Interaction (PPI) Network
The common targets were submitted to the STRING database, restricted to Homo sapiens, with a minimum interaction confidence threshold of 0.9. Isolated nodes were excluded, and the resulting interaction data were imported into Cytoscape 3.9.1 for visualization of the PPI network. The PPI network was imported into Cytoscape 3.9.1, and topological analysis was performed using the NetworkAnalyzer tool. Core target proteins were selected based on their degree values.
GO Functional and KEGG Pathway Enrichment Analyses
Gene Ontology (GO) functional annotation and Kyoto Encyclopedia of Genes and Genomes (KEGG) pathway enrichment analyses were performed on the potential targets using the DAVID database. Enrichment results were visualized with R software (version 4.1) and associated packages.
Molecular Docking
The 3D structures of six serum-absorbable constituents, Hispidulin, Nobiletin, Naringenin, Myricetin, Dihydromyricetin, and Quercetin, were retrieved from PubChem. Each compound was energy-minimized with ChemBio3D Ultra 14.0 and saved in mol2 format. AutoDockTools 1.5.6 was then used to add polar hydrogens, calculate Gasteiger charges, assign atomic charges, and define rotatable bonds, after which the ligands were exported in PDBQT format.
The 3D crystal structures of the target proteins SRC, EGFR, and AKT1 were downloaded from the Protein Data Bank (PDB). Crystallographic water molecules and native ligands were removed with PyMOL 2.3.0. The cleaned protein structures were processed in AutoDockTools 1.5.6 for hydrogen addition, charge calculation, charge assignment, and atom-type definition, and then saved in PDBQT format.
Binding pockets were predicted with POCASA 1.1. Docking simulations were performed using AutoDock Vina 1.1.2, and the resulting complexes were visualized with PyMOL 2.3.0. Binding free energies (ΔG) were used to assess affinity: values < 0 kcal/mol indicated spontaneous ligand–protein binding, while ΔG < –5 kcal/mol reflected favorable binding affinity.
Establishment of a Mouse Model of Rheumatoid Arthritis
Six- to eight-week-old SPF-grade female C57BL/6 mice were acclimatized for one week and then randomly divided into six groups according to body weight (control group, model group, high-, medium-, and low-dose SD-4 groups, and positive control group), with 12 mice in each group. 2 mg/mL bovine type II collagen and 2 mg/mL complete Freund’s adjuvant were mixed and emulsified in a relatively sterile environment at 4 °C. Emulsification was considered complete when the emulsion did not spread when dropped into water. On day 1 of the experiment, except for the normal control group, all other groups received a subcutaneous injection of 0.1 mL of the inducing agent at the base of the tail for initial induction. On day 15, booster immunization was performed using the same method, with Freund’s incomplete adjuvant as the adjuvant. On day 22 of the experiment, SD-4 was administered at body weight (10 mL/kg). The high-, medium-, and low-dose SD-4 groups received 3.64, 1.82, and 0.91 mg/kg of SD-4 solution daily, respectively. The positive control group received 0.75 mg/kg of methotrexate (MTX, twice weekly). The control and model groups received physiological saline. This continued for three weeks. During the gavage period, the mice were observed daily for eating, drinking, and activity. Body weight, joint index, and paw thickness were recorded every 3 days. For anesthesia, mice were anesthetized with inhaled isoflurane at an induction concentration of 3–4% and maintained at 1.5–2.5% in oxygen. At the end of the experiment, mice were euthanized by continuous exposure to a high concentration of isoflurane until respiratory arrest, followed by cervical dislocation to ensure death. All animal procedures were conducted in accordance with institutional guidelines for Ethics Committee of Inner Mongolia Medical University (Approval No: YKD202102080).
HE Staining
Joint tissues were collected at the end of the experiment, fixed in 4% paraformaldehyde for 24–48 h, and decalcified in 10% (w/v) EDTA (pH 7.2–7.4) at room temperature with regular solution changes until the bone was pliable. After decalcification, samples were dehydrated through a graded ethanol series, cleared in xylene, and embedded in paraffin. Serial sections (4–5 μm) were cut using a microtome, mounted on glass slides, deparaffinized in xylene, and rehydrated through descending ethanol to distilled water. Sections were stained with hematoxylin, differentiated in 1% acid alcohol, blued in running tap water, and counterstained with eosin. After dehydration and clearing, slides were coverslipped with neutral resin and examined under a light microscope. Histopathological changes were evaluated in a blinded manner and semi-quantified using an H&E scoring.
Serum ELISA Test
Mouse blood was collected at the end of the experiment, allowed to clot at room temperature for 30–60 min, and centrifuged at 3,000 × g for 10–15 min at 4°C to obtain serum. Serum aliquots were stored at −80°C and thawed only once prior to analysis. Concentrations of TNF-α, IL-6, and IL-1β in serum were quantified using commercially available mouse ELISA kits according to the manufacturers’ instructions. Briefly, standards and appropriately diluted serum samples were added to pre-coated 96-well plates and incubated at room temperature for the recommended time. After washing, biotinylated detection antibodies were applied, followed by horseradish peroxidase–conjugated streptavidin. Color was developed using tetramethylbenzidine substrate and the reaction was stopped with stop solution. Absorbance was measured at 450 nm (with 570/630 nm reference if available) using a microplate reader. Cytokine concentrations were calculated from standard curves generated by four-parameter logistic regression and normalized to the sample dilution factor. All samples were assayed in duplicate, and intra-assay variation was controlled by including quality controls on each plate.
Serum Metabolomics Analysis
Metabolomics Sample Preparation
Serum from each group were harvested into 1.5 mL microcentrifuge tubes, and an 80% (v/v) methanol–water solution was added. The suspensions were gently pipetted to achieve homogenization and was performed on ice using an ultrasonic processor (1,620 W, 6 s on/4 s off, total 10 min), followed by incubation at 4 °C for 2 h. Samples were centrifuged at 12,000 r/min for 10 min at 4 °C, and the supernatants were transferred to LC-MS vials and dried in a refrigerated vacuum concentrator. The residues were reconstituted in 200 μL of 20% methanol, vortex-mixed for 1 min, and re-centrifuged under the same conditions. Final supernatants were transferred into LC-MS vials containing micro-inserts for analysis. A pooled QC sample was prepared by combining equal aliquots from all individual extracts.
Chromatographic–Mass Spectrometric Conditions
Chromatographic separation was performed on an ACQUITY UPLC HSS T3 column (100 mm × 2.1 mm, 1.8 μm). The mobile phase consisted of acetonitrile (A) and 0.1% formic acid in water (B). The gradient elution was programmed as follows: 0–2 min, 5% A; 2–4 min, 5%→30% A; 4–8 min, 30%→50% A; 8–10 min, 50%→80% A; 10–14 min, 80%→100% A; 14–15 min, 100% A; 15–15.1 min, 100%→5% A; 15.1–16 min, 5% A. The column temperature was maintained at 45 °C, the flow rate was 0.35 mL/min, and the injection volume was 5 μL.
Mass spectrometry was performed with a HESI source in Full MS/dd-MS2 mode. Resolution settings were 70,000 for Full MS and 17,500 for dd-MS2. Spray voltages were 3.0 kV (negative mode) and 3.8 kV (positive mode). Normalized collision energies were set at 10, 20, and 40 eV. The sheath gas temperature was 350 °C with a flow rate of 8 L/min. The scan range was m/z 70–1050 Da.
Data Analysis
Raw LC-MS data were processed with Progenesis QI v3.0 for baseline filtering, peak detection, integration, retention-time correction, alignment, and normalization. Metabolites were identified by matching accurate mass and MS2 spectra against the HMDB, LipidMaps (v2.3), METLIN, and the in-house LuMet-Animal 3.0 database. Multivariate statistical analyses, including principal component analysis (PCA), orthogonal PLS-DA (OPLS-DA), and partial least-squares discriminant analysis (PLS-DA), were conducted using SIMCA 14.1. Differential metabolites were selected based on variable importance in projection (VIP) > 1 and P < 0.05. Metabolic pathway enrichment was performed with MetaboAnalyst 6.0. Receiver operating characteristic (ROC) curves and correlation analyses between pharmacodynamic indices and differential metabolites were visualized using R (version 4.1). The mean ± standard deviation was used to represent all the data. One-way analysis of variance (ANOVA) was used to conduct multiple group comparison (by multiple comparisons test) and least significant difference (LSD). The GraphPad (ver. PRISM 8.0) or SPSS (ver. SPSS 20.0) software was used to analyze all the data. For statistical significance, the P < 0.05 was considered as selection criteria.
Results
Analysis of SenDeng-4 Serum-Based Absorbable Constituents
Using the LC–MS method, total ion chromatograms (TICs) of SenDeng-4 drug-containing serum were acquired in both positive- and negative-ion modes (Figure 1). Data were processed leading to the identification of 20 xenobiotic compounds in rat serum. These included seven tannins (35.00%), five flavones (25.00%), three iridoids (15.00%), three organic acids (15.00%), and two triterpenes (10.00%). Detailed information on each constituent is summarized in Table 1, and the corresponding extracted ion chromatograms (EICs) are shown in Figure 2.
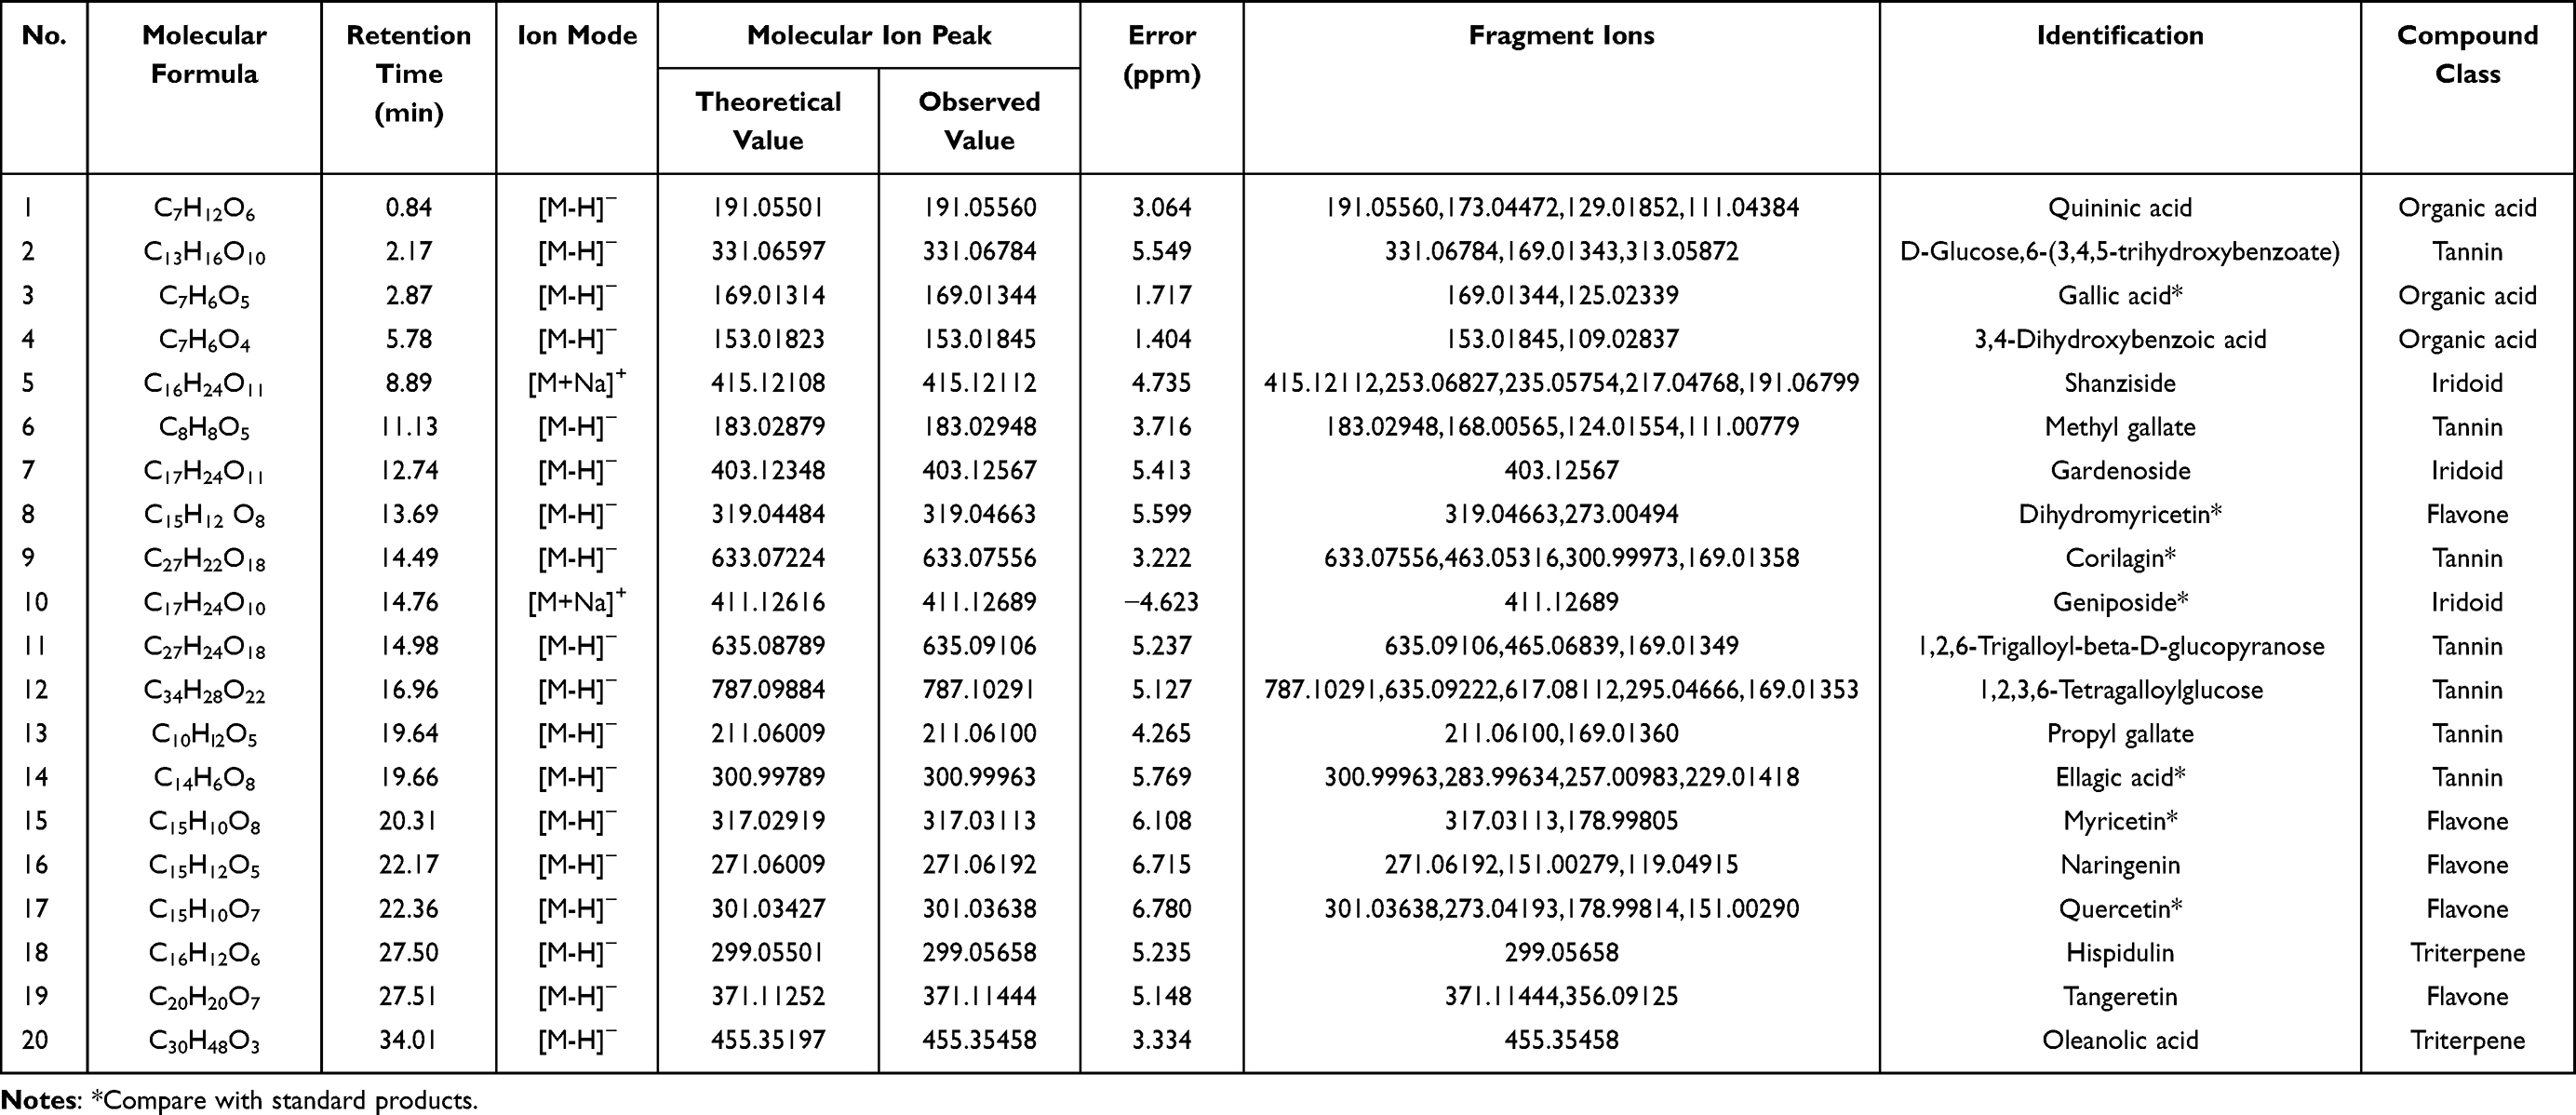 |
Table 1 Identification of Absorbed Components in SengDeng-4 Using HPLC-Q-Exactive-Orbitrap-MS |
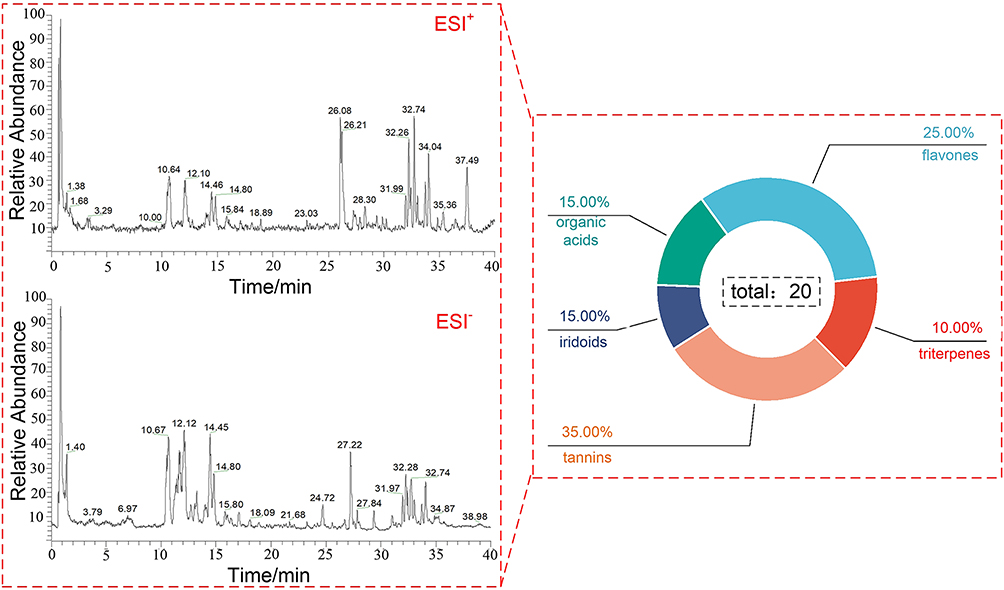 |
Figure 1 HPLC-Q-Exactive-Orbitrap-MS total ion chromatogram of SengDeng-4. |
 |
Figure 2 Extracted ion chromatograms of 20 absorbed serum components: (a) Quininic acid; (b) D-Glucose,6-(3,4,5-trihydroxybenzoate); (c) Gallic acid; (d) 3,4-Dihydroxybenzoic acid; (e) Shanziside; f. Methyl gallate; (g) Gardenoside; (h) Dihydromyricetin; (i) Corilagin; (j) Geniposide; (k) 1,2,6-Trigalloyl-β-D-glucopyranose; (l) 1,2,3,6-Tetragalloylglucose; (m) Propyl gallate; (n) Ellagic acid; (o) Myricetin; (p) Naringenin; (q) Quercetin; (r) Hispidulin; (s) Tangeretin; (t) Oleanolic acid. |
MS/MS Fragmentation Pathways Confirm the Identities of Representative SenDeng-4–Derived Serum Metabolites
Representative fragmentation pathways are presented for Quininic acid (compound 1), D-Glucose, 6-(3,4,5-trihydroxybenzoate) (compound 2), Shanziside (compound 5), and Quercetin (compound 17).
Compound 1 (Quininic acid) displayed a deprotonated precursor ion [M–H]− at m/z 191.055 60. Successive neutral losses of H2O and CO2 generated characteristic fragments [M–H–H2O]− at m/z 173.044 72, [M–H–H2O–CO2]− at m/z 129.018 52, and [M–H–2H2O–CO2]− at m/z 111.043 84. These results, consistent with established fragmentation rules and MSn data, verified compound 1 as Quininic acid (Figure 3C).
 |
Figure 3 Extracted ion chromatograms and identification of representative compounds. (A) D-Glucose,6-(3,4,5-trihydroxybenzoate); (B) Quercetin; (C) Quininic acid; (D) Shanziside. |
Compound 2 (D-Glucose, 6-(3,4,5-trihydroxybenzoate)) produced a deprotonated precursor ion [M–H]− at m/z 331.067 84. Loss of a glucose residue generated the diagnostic fragment [M–H–Glc]− at m/z 169.013 43, while loss of H2O yielded [M–H–H2O]− at m/z 313.058 72. Based on these fragmentation rules and MSn data,10–12 compound 2 was identified as D-Glucose, 6-(3,4,5-trihydroxybenzoate) (Figure 3A).
Compound 5 (Shanziside) formed a sodium-adduct precursor [M+Na]⁺ at m/z 415.121 12. Cleavage of a glucose residue yielded [M+Na–Glc]⁺ at m/z 253.068 27. Further consecutive losses of H2O and CO2 generated [M+Na–Glc–H2O]⁺ at m/z 235.057 54, [M+Na–Glc–2H2O]⁺ at m/z 217.047 68, and [M+Na–Glc–H2O–CO2]⁺ at m/z 191.067 99. Based on these fragmentation pathways and MSn evidence, compound 5 was identified as Shanziside (Figure 3D).
Compound 17 (Quercetin) exhibited a deprotonated ion [M–H]− at m/z 301.036 38 in negative-ion mode. This ion lost CO to generate [M–H–CO]− at m/z 273.041 93, and further underwent a retro-Diels–Alder (RDA) cleavage, eliminating C7H6O2 to form [M–H–CO–C7H6O2]− at m/z 178.998 14. A subsequent CO loss produced [M–H–2CO–C7H6O2]− at m/z 151.002 90. Integration of these data with MSn evidence13 and comparison against a reference standard confirmed the identity of compound 17 as Quercetin (Figure 3B).
Network Pharmacology Reveals Core Targets and PI3K–AKT/HIF-1–Centered Pathways Underlying SenDeng-4 Anti-RA Activity
Network pharmacology identified 344 putative targets for the serum absorbable constituents, 1,648 RA–related targets, and 149 shared constituent–disease targets (Figure 4A). These shared targets were uploaded to the STRING database, and the resulting PPI network was visualized in Cytoscape 3.9.1 (Figure 4B). In this network, node size and color intensity reflect degree value; the top five targets were SRC, PIK3CA, PIK3R1, HSP90AA1, and ESR1. Twenty-three serum absorbable constituents and the 149 shared targets were integrated into Cytoscape 3.9.1 to construct the category–constituent–target network (Figure 4C). In this visualization, squares represent compound categories, diamonds represent the absorbable constituents, and circles represent the shared targets. Network Analyzer was used to rank the core genes by degree value (Table 2). GO functional enrichment analysis of the shared targets yielded 783 significant terms, including 574 biological processes, 60 cellular components, and 149 molecular functions. The top 10 GO terms by P-value are presented as a bubble plot (Figure 4D). KEGG pathway enrichment revealed 157 significant pathways, with the PI3K-AKT, HIF-1, and related signaling cascades being the most prominent; the top 20 pathways are shown in Figure 4E.
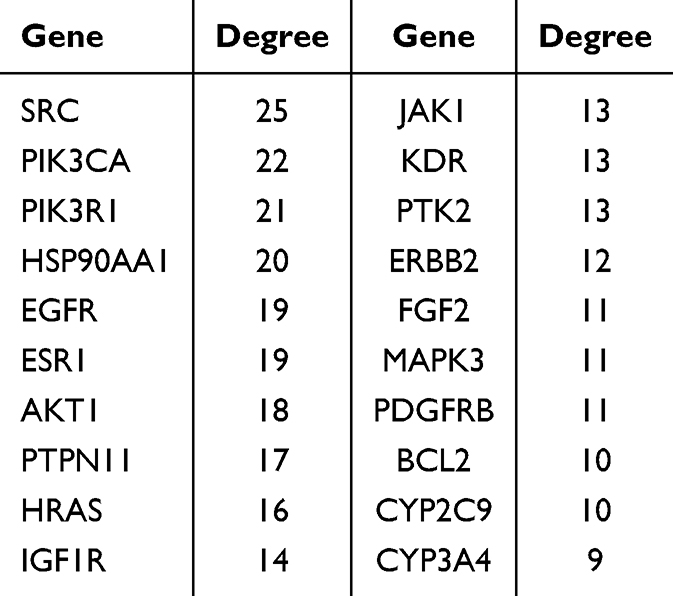 |
Table 2 Ranking of Absorbed Components Based on Degree Values |
 |
Figure 4 Network pharmacology analysis of SengDeng-4 against rheumatoid arthritis. (A) Venn diagram of overlapping targets between SengDeng-4 (344) and rheumatoid arthritis (1,648), identifying 149 shared targets. (B) Protein–protein interaction (PPI) network of the 149 shared targets constructed using STRING and visualized in Cytoscape 3.9.1. Node size and color intensity indicate degree values; the top hub targets are SRC, PIK3CA, PIK3R1, HSP90AA1, and ESR1. (C) Category–constituent–target network integrating 23 absorbed constituents and 149 shared targets. (D) Gene Ontology (GO) enrichment of shared targets (top 10 terms across biological processes, cellular components, and molecular functions). (E) KEGG pathway enrichment of shared targets (top 20 pathways, including PI3K–AKT and HIF-1 signaling, among other signaling pathways related to RA). |
Molecular Docking Demonstrates Stable Binding of SenDeng-4 Serum Constituents to SRC, EGFR, and AKT1
Molecular docking revealed a favorable binding of serum-absorbable constituents with key protein targets. Hispidulin and Tangeretin bound to SRC (PDB ID: 2SRC) with binding energies of –6.1 and –5.4 kcal·mol−1, respectively (Figure 5A and B). Myricetin and naringenin docked with EGFR (PDB ID: 1M17) at –5.9 and –6.1 kcal·mol−1, respectively (Figure 5C and D). Dihydromyricetin and Quercetin exhibited particularly strong affinities for AKT1 (PDB ID: 6NPZ), with binding energies of –10.0 and –9.4 kcal·mol−1, respectively (Figure 5E and F). These results indicate that multiple SenDeng-4 constituents interact stably with key signaling proteins. All docking poses were visualized with PyMOL 2.3.0.
 |
Figure 5 Molecular docking between active components and key target proteins. (A) Hispidulin–SRC; (B) Tangeretin–SRC; (C) Myricetin–EGFR; (D) Naringenin–EGFR; (E) Dihydromyricetin–AKT1; (F) Quercetin–AKT1. |
SD-4 Alleviates Arthritis Severity and Systemic Inflammation in an Experimental Arthritis Model
The modeling procedure for the mouse model of rheumatoid arthritis is illustrated in Figure 6A. Across the treatment period, SD-4 did not cause an obvious loss of body weight, suggesting acceptable tolerability compared with the model group (Figure 6B). In contrast, arthritis severity was markedly improved by SD-4: the model group showed persistently elevated arthritis scores and increased foot thickness, whereas SD-4 administration reduced both clinical indices over time, with the high dose (3.64 g/kg) showing the strongest improvement and lower doses (1.82 and 0.91 g/kg) producing a moderate but consistent benefit (Figure 6B). SD-4 significantly suppressed systemic inflammation, as evidenced by decreased serum concentrations of TNF-α, IL-6, and IL-1β relative to the model group; the magnitude of cytokine reduction was greatest at 3.64 g/kg and was broadly comparable to the positive-control methotrexate (0.75 mg/kg) (Figure 6C). Histopathological examination of joint sections further supported these findings: the model group displayed pronounced inflammatory infiltration and structural damage, while SD-4-treated groups exhibited attenuated synovial inflammation and improved tissue architecture, again most evident at the highest dose (Figure 6D). Accordingly, semi-quantitative H&E scores were significantly lower in SD-4-treated animals than in the model group, confirming that SD-4 alleviates joint pathology and inflammatory burden in experimental arthritis (Figure 6E). Longitudinal comparisons revealed that the high-dose treatment with SD-4 showed more significant effects, therefore, we selected the high-dose group for the non-targeted metabolomics analysis.
 |
Figure 6 SD-4 alleviates arthritis severity and systemic inflammation in an experimental arthritis model. (A) Schematic of the study design. Arthritis was induced by primary immunization (Day 1) and booster immunization (Day 15), followed by treatment administration from Day 22 to Day 42; body weight, paw/foot thickness, and arthritis score were recorded every 3 days, and animals were sacrificed for sample collection on Day 43. (B) Longitudinal changes in body weight, arthritis score, and foot thickness in the Control, Model, SD-4 (3.64, 1.82, and 0.91 g/kg), and methotrexate (MTX, 0.75 mg/kg) groups. (C) Serum levels of pro-inflammatory cytokines tumor necrosis factor-α (TNF-α), interleukin-6 (IL-6), and interleukin-1β (IL-1β). (D) Representative hematoxylin and eosin (H&E)–stained joint sections showing histopathological changes across groups. (E) Semi-quantitative H&E (HE) histopathology scores. Data are presented as mean ± SD with individual animals shown as dots; statistical significance is indicated as *P < 0.05, **P < 0.01, ***P < 0.001, and ****P < 0.0001. |
Multivariate Statistical Analysis of Serum Metabolomics
PCA and PLS-DA
LC–MS datasets acquired in both positive- and negative-ion modes were analyzed using PCA and PLS-DA in SIMCA 14.1. QC samples clustered tightly in both ion modes, confirming analytical stability and reproducibility (Figure 7A and B). A clear separation was observed between the Mo and C groups, while the Y displayed an even more pronounced segregation, indicating distinct metabolic profiles, which were further confirmed by PLS-DA (Figure 7C–F).
 |
Figure 7 Multivariate statistical analysis of metabolomic profiles. (A and B) PCA score plots of LC–MS data in positive and negative ion modes. Tight clustering of quality-control (QC) samples confirmed analytical stability. Control, Model, and SengDeng-4 (SD-4) groups showed clear separation. (C–F) PLS-DA score plots in positive and negative modes showing significant discrimination between Control and Model groups (C and D), as well as between Model and SD-4 groups (E and F), confirming significant metabolic differences among groups. |
OPLS-DA Analysis
OPLS-DA models were constructed for both positive- and negative-ion datasets. Distinct separations were observed between the Control and Model groups, as well as between the Model and SD-4 groups, indicating significant alterations in endogenous metabolites (Figure 8A, C, E and G). In positive-ion mode, model parameters for Control vs. Model were R2X = 0.794, R2Y = 1.000, and Q2 = 0.839, while those for Model vs. SD-4 were R2X = 0.540, R2Y = 1.000, and Q2 = 0.930. In negative-ion mode, corresponding values were R2X = 0.771, R2Y = 1.000, Q2 = 0.851 (Control vs. Model) and R2X = 0.582, R2Y = 1.000, Q2 = 0.960 (Model vs. SD-4). All parameters exceeded 0.5, confirming model robustness and predictive reliability. Permutation tests (200 iterations) were performed to guard against overfitting and false-positive results. As shown in Figures 8B, D, F and H, all Q2 values were consistently below R2, further validating the reliability of the OPLS-DA models.
 |
Figure 8 OPLS-DA models of metabolomic profiles and permutation validation. (A, C, E and G) OPLS-DA score plots of LC–MS data in positive- and negative-ion modes, showing clear separations between control and model groups, as well as between Model and SenDeng-4–treated groups. Model parameters demonstrated robustness and predictive reliability (positive-ion mode: Control vs. Model, R2X = 0.794, R2Y = 1.000, Q2 = 0.839; Model vs. SD-4, R2X = 0.540, R2Y = 1.000, Q2 = 0.930; negative-ion mode: Control vs. Model, R2X = 0.771, R2Y = 1.000, Q2 = 0.851; Model vs. SD-4, R2X = 0.582, R2Y = 1.000, Q2 = 0.960). (B, D, F and H) Results of 200-iteration permutation tests confirmed the model’s validity for the corresponding models, as Q2 values were consistently lower than R2 values, indicating that there was no overfitting. |
Screening of Differential Metabolites
Based on the OPLS-DA models, metabolites were considered differential with VIP > 1 and P < 0.05. In positive-ion mode (Figure 9A), 57 significantly altered metabolites were identified between the Control and Model groups, including 30 up-regulated and 27 down-regulated. In the comparison between the SD-4 group and the Model group (Figure 9C), 92 differential metabolites were identified, comprising 47 up-regulated and 45 down-regulated. In negative-ion mode (Figure 9B), 38 differential metabolites were detected between the Control and Model groups (28 up-regulated, 10 down-regulated). Comparison of the SD-4 group with the Model group (Figure 9D) revealed 82 differential metabolites, comprising 54 up-regulated and 28 down-regulated metabolites.
 |
Figure 9 Volcano plots of differential metabolites based on OPLS-DA. Differential metabolites were screened using VIP > 1 and P < 0.05 as thresholds. (A) Positive-ion mode: 57 metabolites differed between control and model groups (30 up-regulated, 27 down-regulated). (B) Negative-ion mode: 38 metabolites differed between Control and Model (28 up-regulated, 10 down-regulated). (C) Positive-ion mode: 92 metabolites differed between Model and SenDeng-4-treated (SD-4) groups (47 up-regulated, 45 down-regulated). (D) Negative-ion mode: 82 metabolites differed between Model and SD-4 (54 up-regulated, 28 down-regulated). |
Pathway Enrichment Analysis
A Venn diagram constructed with Venny 2.1.0 was used to compare the 95 differential metabolites (combined positive- and negative-ion modes) identified between the Control and Model groups with the 174 differential metabolites identified between the Model and SD-4 groups. This analysis revealed 46 intersecting differential metabolites (Figure 10A). These 46 metabolites were subjected to KEGG pathway enrichment in MetaboAnalyst 6.0. Significant enrichment was observed in pathways such as tryptophan metabolism and glycolysis/gluconeogenesis, among other metabolic pathways (Figure 10B). A hierarchical clustering heatmap was then generated for the 46 overlapping metabolites (Figure 10C). Seventeen of these exhibited consistent regulatory trends. Quantitative analysis using GraphPad Prism 10.1.2 revealed that, compared with the Control group, all 17 metabolites were significantly up-regulated in the Model group and down-regulated in the SD-4 group (Figure 11A–Q).
 |
Figure 10 Overlapping differential metabolites and pathway enrichment. (A) Venn diagram showing 46 overlapping metabolites between control vs. Model groups (95 metabolites, combined ion modes) and Model vs. SenDeng-4–treated (SD-4) groups (174 metabolites). (B) KEGG pathway enrichment of the 46 overlapping metabolites using MetaboAnalyst 6.0, highlighting enrichment in tryptophan metabolism, glycolysis/gluconeogenesis, and related pathways. (C) Hierarchical clustering heatmap of the 46 metabolites demonstrating distinct clustering among Control, Model, and SD-4. |
 |
Figure 11 Relative intensities of 17 key metabolites regulated by SenDeng-4 treatment. Seventeen metabolites with consistent regulatory trends were quantified using GraphPad Prism 10.1.2. Compared with the control group, metabolite levels were significantly elevated in the model group. Treatment with SenDeng-4 (SD-4) significantly reduced these metabolites, restoring them toward control levels (A–Q). Data are presented as mean ± SD (n = 6). *P < 0.05, **P < 0.01, ***P < 0.001, ****P < 0.0001 versus Model group. |
ROC Visualization and Correlation Analysis
ROC curves were constructed for the 17 differential metabolites using R packages. An area under the curve (AUC) value approaching 1.0 indicated strong diagnostic performance. Eleven metabolites—including L-Kynurenine, 6-amino-hexanoic acid, D-glycerate, 2-hydroxycinnamic acid, and 2-aminoacetophenone—achieved AUC = 1.0, demonstrating excellent difference among the Control, Model, and SD-4 groups (Figure 12). Correlation analysis between these metabolites and pharmacodynamic markers (IL-1β, IL-6, TNF-α) revealed that four metabolites—N-(2,4-dinitrophenyl)ethylenediamine, L-Kynurenine, 2-hydroxycinnamic acid, and 2-aminoacetophenone—showed significant associations with these inflammatory indices (Figure 13).
 |
Figure 12 Receiver operating characteristic (ROC) curve analysis of 17 differential metabolites. ROC curves were generated using R packages to evaluate the diagnostic performance of 17 differential metabolites. An area under the curve (AUC) closer to 1.0 indicated stronger discriminatory ability. Eleven metabolites—including L-kynurenine, D-glycerate, 6-amino-hexanoic acid, 2-hydroxycinnamic acid, and 2-aminoacetophenone—achieved an AUC of 1.0, demonstrating excellent capacity to distinguish control, model, and SenDeng-4–treated (SD-4) groups. |
 |
Figure 13 Correlation analysis between differential metabolites and inflammatory cytokines. Correlation analyses were performed between key differential metabolites and pharmacodynamic markers IL-1β, IL-6, and TNF-α. Four metabolites—2-hydroxycinnamic acid, L-kynurenine, 2-aminoacetophenone, and N-(2,4-dinitrophenyl)ethylenediamine—showed significant associations with these inflammatory cytokines. Heatmap visualization, Mantel’s test, and network analysis highlight the strength and significance of the metabolite–cytokine interactions. |
PIK3R1–PIK3CA–SRC Coordinate Immunometabolic Reprogramming to Restore Mitochondrial Function in RA
The three core genes—PIK3R1, PIK3CA, and SRC—are positioned as upstream signaling regulators that can coordinate this metabolic recovery. PIK3R1 and PIK3CA encode key components of the PI3K pathway, which governs glucose uptake, glycolytic enzyme activity, and mitochondrial substrate utilization; tuning PI3K activity can shift cells away from excessive “inflammatory glycolysis” toward more efficient mitochondrial oxidation, thereby reducing lactate-linked inflammatory amplification and supporting TCA cycling. SRC, a central non-receptor tyrosine kinase, interfaces with growth factor/cytokine signaling and can modulate metabolic enzyme phosphorylation and mitochondrial function; dampening aberrant SRC-driven signaling is expected to reduce inflammatory pathway activation while facilitating oxidative metabolism and redox stability. In the context of RA, the coordinated regulation of PIK3R1–PIK3CA–SRC may therefore alleviate disease by (1) normalizing glycolysis–TCA flux, (2) restoring NAD⁺-supported mitochondrial respiration, and (3) re-shaping kynurenine-dependent NAD⁺ biosynthesis and immunometabolic signaling—together limiting pathogenic inflammation and improving joint microenvironment homeostasis (Figure 14).
 |
Figure 14 Integrated analysis of key metabolic pathways and core genes in network pharmacology. This schematic illustrates the metabolic crosstalk between glycolysis/gluconeogenesis and tryptophan metabolism and highlights their coordinated regulation of cellular energy output and NAD⁺ homeostasis. On the left, glucose is converted to pyruvate through glycolysis, with bidirectional interconversion between pyruvate and alanine, and linkage to lactate metabolism via lactate dehydrogenase (LLDH); pyruvate-derived acetyl-CoA feeds into the tricarboxylic acid (TCA) cycle to support ATP generation and NADH production, while also connecting to oxaloacetate and gluconeogenesis. On the right, tryptophan is metabolized through the serotonin branch (serotonin, 5-hydroxytryptamine) and the kynurenine pathway, producing kynurenic acid and quinolinic acid, which supports de novo NAD⁺ synthesis. The central “Cross-Talk” module emphasizes coupling of these pathways through kynurenine-related intermediates and the NAD⁺/NADH balance, thereby integrating metabolic flux with energy production and NAD⁺ biosynthesis. Key signaling genes (PIK3R1, PIK3CA, and SRC) are positioned as regulatory nodes within the glucose–TCA axis and associated branch points, suggesting potential roles in metabolic rewiring and pathway coordination. |
Discussion
A clear and well-defined chemical profile is essential for elucidating the pharmacodynamic material basis of traditional prescriptions. As the constituents of a compound formula are highly complex and display significantly different MS responses in various solvent systems, multiple mobile-phase combinations were systematically evaluated during method development. Methanol–0.1% formic acid in water provided the strongest overall MS intensity and was selected as the optimal mobile phase. Due to the distinct physicochemical properties of the constituents, ionization efficiencies differed between positive- and negative-ion modes; therefore, full-scan analyses were conducted in both modes to ensure comprehensive coverage of the data. To reduce interference from serum proteins, several protein-precipitation approaches were compared. Methanol precipitation yielded the cleanest extracts with the lowest background noise relative to ethyl acetate extraction and acetonitrile precipitation. Furthermore, sensitivity was improved by pooling serum samples collected at multiple time points, concentrating the pooled extracts, and reconstituting them before analysis. Ultimately, 20 prototype constituents were unambiguously identified in drug-containing serum.
Network pharmacology based on these serum-absorbed constituents indicated that hispidulin, naringenin, myricetin, and dihydromyricetin may act on SRC, ESR1, and AKT1 to regulate the PI3K–AKT, HIF-1, and MAPK signaling pathways, exerting therapeutic effects in RA. Previous studies have shown that targeted regulation of the SRC/PI3K/AKT axis suppresses osteoclast differentiation and alleviates bone destruction in RA. Similarly, interference with the HIF-1α/VEGF pathway can inhibit HUVEC proliferation, migration, and angiogenesis, attenuating oxidative stress and pannus formation in disease progression.14,15
Modern pharmacology has also demonstrated that chondrocyte apoptosis is a key driver of cartilage destruction. Hispidulin suppresses Orai1-mediated Ca2⁺ influx and endoplasmic reticulum stress–induced apoptosis, reducing IL-1β-triggered chondrocyte death and conferring joint protection.16,17 The TLR4/MAPK pathway is essential for inflammatory and immune responses; naringenin alleviates arthritis-related phenotypes in animal models by inhibiting the expression of TLR4 and MAPK-related proteins.18,19 In IL-1β-induced chondrocyte injury models, myricetin reduced phosphorylation of PI3K, AKT, and NF-κB p65, inhibited chondrocyte apoptosis, and decreased TNF-α and IL-6 while increasing IL-10 in rat joint fluid. Furthermore, in H2O2-induced chondrocyte injury models, dihydromyricetin regulates chondrocyte apoptosis, inflammation, and oxidative stress by inhibiting the ROS/p38-MAPK pathway, contributing to its anti-arthritic activity.20,21 Serum metabolomics further revealed that, 58 metabolites were up-regulated and 37 were down-regulated, whereas treatment with SenDeng-4 drug-containing serum reversed these changes, with 101 metabolites up-regulated and 73 down-regulated. Venn analysis identified 46 overlapping metabolites, including L-Kynurenine, 6-amino-hexanoic acid, D-glycerate, 2-hydroxycinnamic acid, and 2-aminoacetophenone, which were primarily enriched in tryptophan metabolism and glycolysis/gluconeogenesis. Among these, 17 metabolites showed consistent regulatory trends, and four—N-(2,4-dinitrophenyl)ethylenediamine, L-kynurenine, 2-hydroxycinnamic acid, and 2-aminoacetophenone—were significantly correlated with inflammatory cytokines, underscoring their potential mechanistic relevance.
Tryptophan, an essential amino acid, is mainly catabolized via the kynurenine and serotonin pathways. Dysregulated tryptophan metabolism is closely associated with the onset and progression of RA22–24 Glycolytic flux has been shown to play a key role in RA pathology, as anaerobic glycolysis provides energy for synovial fibroblast proliferation, promotes the secretion of matrix metalloproteinases, facilitates pannus invasion, and leads to irreversible bone erosion. Moreover, glycolysis activates HIF-1α, which drives the metabolic reprogramming of macrophages from an anti-inflammatory M2 phenotype toward a pro-inflammatory M1 phenotype, increasing TNF-α, IL-1β, and IL-6 secretion and intensifying the inflammatory response.25–27 Inflammatory activation of indoleamine-2,3-dioxygenase and tryptophan-2,3-dioxygenase disrupts tryptophan homeostasis, leading to elevated kynurenine levels.28–30 Elevated kynurenine binds to the aryl hydrocarbon receptor on synovial fibroblasts, promoting aberrant activation, proliferation, and migration, as well as IL-1β and IL-6 secretion, which drive synovial inflammation and joint destruction.31–34 In this study, SenDeng-4 treatment significantly reduced kynurenine levels, suggesting that its therapeutic effect on RA is closely associated with the restoration of tryptophan metabolic balance.
The integrated pathway map indicates that rheumatoid arthritis (RA)–associated metabolic dysregulation is characterized by a tight coupling between glucose metabolism (glycolysis/gluconeogenesis–TCA axis) and tryptophan catabolism (kynurenine branch), converging on NAD⁺/NADH redox balance and mitochondria-dependent energy production. In this network, glycolytic flux from glucose to pyruvate and acetyl-CoA feeds the TCA cycle, supporting ATP generation and NADH supply, while oxaloacetate provides an anaplerotic node that links mitochondrial metabolism to gluconeogenesis and broader carbon redistribution. In parallel, tryptophan metabolism is routed toward the kynurenine pathway, generating downstream intermediates (eg., kynurenic acid and quinolinic acid) that fuel de novo NAD⁺ synthesis, thereby replenishing NAD⁺ pools required for oxidative metabolism, redox buffering, and cellular stress resistance. The “cross-talk” highlighted in the figure suggests that restoring redox homeostasis and mitochondrial efficiency is a central metabolic mechanism with anti-inflammatory potential in RA.
Mechanistically, rebalancing these pathways can mitigate RA through several coordinated effects: (i) improved mitochondrial ATP production reduces metabolic stress and limits damage-associated inflammatory signaling; (ii) normalized NAD⁺/NADH ratio supports oxidative phosphorylation, enhances antioxidant capacity, and maintains NAD⁺-dependent regulatory programs (eg., sirtuin/PARP-related responses) that restrain inflammatory gene expression; and (iii) rewiring of tryptophan catabolism reduces accumulation of pro-inflammatory or neurotoxic metabolites while favoring immunoregulatory outputs within the kynurenine branch. Collectively, these metabolic corrections are consistent with decreased synovial inflammation, reduced immune cell hyperactivation, and improved tissue homeostasis that are beneficial for RA.
Although network pharmacology and metabolomics provide complementary insights, the mechanistic connections observed are associative rather than strictly causative. The reversal of key metabolic intermediates suggests that SD-4 may modulate immunometabolic homeostasis, but further functional experiments (eg., target knockdown or pathway-specific interventions) are required to establish direct causality. Our findings align with known RA pathology, where dysregulated glycolysis and tryptophan catabolism contribute to immune cell hyperactivation, redox imbalance, and synovial inflammation. By partially normalizing these metabolic pathways, SD-4 treatment may mitigate inflammatory amplification, improve mitochondrial function, and restore tissue homeostasis. Compared with previous RA-related multi-omics studies, this work uniquely integrates serum-absorbed constituent profiling, network pharmacology, docking simulations, in vivo efficacy, and metabolomics, offering a more holistic mechanistic perspective of a multi-component herbal formulation.
Conclusion
This study clarifies how the traditional Mongolian formula SD-4’s therapeutic potential in rheumatoid arthritis model by integrating serum pharmacochemistry, network pharmacology, molecular docking, in vivo validation, and metabolomics. HPLC–Q-Exactive-Orbitrap-MS identified 20 serum-absorbed constituents, while target mapping highlighted SRC, PIK3CA, and PIK3R1 and implicated PI3K–AKT and HIF-1 signaling. In an experimental arthritis model, SD-4 reduced arthritis severity, paw swelling, and pro-inflammatory cytokines (TNF-α, IL-6, IL-1β), and improved joint pathology. Metabolomics showed reversal of 46 disease-related metabolites, mainly involving tryptophan metabolism and glycolysis/gluconeogenesis, and prioritized inflammation-associated biomarkers such as L-kynurenine and 2-hydroxycinnamic acid.
Data Sharing Statement
Data will be available on reasonable request from corresponding author (Qian Zhang).
Funding
This work was supported by the National Natural Science Foundation of China (82460822, 82360801), the Natural Science Foundation of Inner Mongolia (2023QN08012, 2024QN08054, 2025LHMS08061), a joint project of Inner Mongolia Medical University (YKD2023LH062), a joint scientific research fund project of the Public Hospitals of Inner Mongolia Academy of Medical Sciences (2024GLLH0329), the Talent Cultivation Project for Undergraduate Scientific and Technological Innovation of Inner Mongolia Medical University (YCPY2025024, YCPY2025028), and the Innovation and Entrepreneurship Training Program for Undergraduates of Inner Mongolia Medical University (101322025034).
Disclosure
The author(s) report no conflicts of interest in this work.
References
1. Meng Y, Li F, Zeng S, et al. Global, regional, and national burden of trachoma: cross-country inequalities, 1990–2021, with projections to 2040. Ophthalmol Ther. 2025;14(5):1065–24. doi:10.1007/s40123-025-01102-5
2. Bai P, Dong Y. Development and validation of the HPLC-MS/MS method and its application to the pharmacokinetic study for the Mongolian drug Sendeng-4 in rat blood plasma. Front Pharmacol. 2025;16:1547415. doi:10.3389/fphar.2025.1547415
3. Shyeed MA, Bashera MA, Sazal OS, et al. Investigation of wound healing and anti-inflammatory activity of Senna occidentalis leaf extract, and in silico screening for both activities. Pharm Sci Adv. 2023;1(2):100016. doi:10.1016/j.pscia.2023.100016
4. Zhang Q, Li X, Li J, et al. Mechanism of anti-inflammatory and antibacterial effects of QingXiaoWuWei Decoction based on network pharmacology, molecular docking and in vitro experiments. Front Pharmacol. 2021;12:678685. doi:10.3389/fphar.2021.678685
5. Li D, Du X, Bai W, Schmitz OJ. Sample preparation of Hedyotis diffusa Willd. for two-dimensional gas chromatography–time of flight mass spectroscopic analysis enhanced chemical profiling. Microelectron J. 2024;2:100056.
6. Zhu B-R, Li J, zhang Q, zhang Q. Refining the gut-microbiome axis: a triad of metabolites, targeted microbial delivery, and AI-assisted profiling for precision medicine-food intervention. Food Med Homol. 2025;2(4):9420118. doi:10.26599/FMH.2025.9420118
7. Liu J, Li J, Shi KT, et al. Study on quality markers of Mongolian medicine Guangmingyan Siwei Tangsan for the treatment of functional dyspepsia based on HPLC fingerprinting. Tradit Med Res. 2026;11(7):46. doi:10.53388/TMR20250610002
8. Lu C, Zhang Y, Zhan P, et al. Characterization of the key aroma compounds in four varieties of pomegranate juice by gas chromatography–mass spectrometry, gas chromatography–olfactometry, odor activity value, aroma recombination, and omission tests. Food Sci Hum Wellness. 2023;12(1):10. doi:10.1016/j.fshw.2022.07.033
9. Li PL, Li SH, Zhao W, et al. Characteristic odor of foxtail millet from different areas with different sowing times based on gas chromatography–mass spectrometry. J Future Foods. 2025;5(1):50–56. doi:10.1016/j.jfutfo.2024.01.004
10. Zhang Y, Du R, Zhao P, et al. Preparation and characterization of natural quercetin-based Mongolian medicine Sendeng-4 nanoemulsion and its antibacterial activity. Curr Drug Deliv. 2021;18(7):984–993. doi:10.2174/1567201818666201214143631
11. Zhang Q, Wang F, Liu J, et al. Integration of transcriptomics and metabolomics reveals toxicological mechanisms of ZhuRiHeng drop pill in the 180-day repeated oral toxicity study. Front Pharmacol. 2024;15:1333167. doi:10.3389/fphar.2024.1333167
12. Wang N, Yu WH, Chen YT, et al. Study on the rheological and gel properties of Auricularia auricula pulp and konjac glucomannan compound system. J Future Foods. 2025;5(4):380–387. doi:10.1016/j.jfutfo.2024.07.016
13. Liao Y, Li J, Li Y, et al. Mechanism of Guanxin Qiwei dropping pills targeting Dubosiella to improve atherosclerosis. Front Pharmacol. 2025;16:1633862. doi:10.3389/fphar.2025.1633862
14. Rajapakshe BPS, Maneesha KAV, Jayapema KKC, et al. Development of value-added savory cream from button mushroom (Agaricus bisporus) and evaluation of chemical, physical and microbiological characteristics. J Future Foods. 2025;5(4):410–418. doi:10.1016/j.jfutfo.2024.07.019
15. Zhang Q, Liu J, Li J, et al. Precision application of food and medicine with a multi-omics network and biomimetic delivery system. Food Med Homol. 2026;3(1):9420129. doi:10.26599/FMH.2026.9420129
16. Choi YJ, Fan M, Wedamulla NE, et al. Alleviatory effect of isoquercetin on benign prostatic hyperplasia via IGF-1/PI3K/AKT/mTOR pathway. Food Sci Hum Wellness. 2024;13(3):1698–1710. doi:10.26599/FSHW.2022.9250216
17. Hao YP, Wang L, Li QW, et al. Unraveling the functional components in medicinal Aloe species based on UPLC–MS/MS metabolomics. Food Med Homol. 2025;2:9420098.
18. Li J, Zhang Q, Li S, et al. Shenhuang Liuwei Powder alleviates streptozotocin-induced diabetic ulcers in rats through inhibition of the AGE/RAGE signaling pathway and promotion of antibacterial activity and angiogenesis via activation of the PI3K/Akt/eNOS/HIF-1α pathway. Comb Chem High Throughput Screen. 2024;27:e0113862073370028.
19. Liu K, Gao H, Wang Q, et al. Hispidulin suppresses cell growth and metastasis by targeting PIM1 through JAK2/STAT3 signaling in colorectal cancer. Cancer Sci. 2018;109(5):1369–1381. doi:10.1111/cas.13575
20. Yu Y, Zhu H, Shen M, et al. Sulfated cyclocarya paliurus polysaccharides exert immunomodulatory potential on macrophages via toll-like receptor 4–mediated MAPK/NF-κB signaling pathways. Food Sci Hum Wellness. 2024;13(1):115–123. doi:10.26599/FSHW.2022.9250009
21. Li MY, Zhang Q, Li J, et al. Food and medicine homology in cancer treatment: traditional thoughts collide with scientific evidence. Food Med Homol. 2025;2(3):9420120. doi:10.26599/FMH.2025.9420120
22. Li J, Zhang Q, Li X, et al. QingXiaoWuWei decoction alleviates methicillin-resistant Staphylococcus aureus–induced pneumonia in mice by regulating metabolic remodeling and macrophage gene expression network via the microbiota–short-chain fatty acids axis. Microbiol Spectrum. 2023;11(6):e0034423. doi:10.1128/spectrum.00344-23
23. Liu T, Qi W, Peng W, et al. Cyanidin-3-glucoside protects against photooxidative damage in retinal pigment epithelium cells by regulating sphingolipid signaling and inhibiting the MAPK pathway. Food Sci Hum Wellness. 2023;12:1–19.
24. Wang J, Zhou C, Han S, et al. Effects of anti-CD4 antibody treatment on calcium ion influx in peanut-sensitized C3H/HeJ mice. Food Sci Hum Wellness. 2023;12(3):765–773. doi:10.1016/j.fshw.2022.09.010
25. Ma Y, Chen X, Wang M, et al. Ruxolitinib targets JAK–STAT signaling to modulate neutrophil activation in refractory macrophage activation syndrome. Blood. 2024;146(5):612–27.
26. Tie S, Zhang L, Li B, et al. Effects of dual-targeting procyanidin nanoparticles on metabolomics of lipopolysaccharide-stimulated inflammatory macrophages. Food Sci Hum Wellness. 2023;12(6):11. doi:10.1016/j.fshw.2023.03.045
27. Ren WW, Liang HS, Li B, et al. Towards ideal plant-based yogurts: evaluating component and processing effects on mouthfeel and stability. J Future Foods. 2025;5(5):455–469. doi:10.1016/j.jfutfo.2024.08.003
28. Fang XC, He XM, Zheng YR, et al. Isolation and bioactivity screening of soy isoflavones from soybean glycolipids identifies daidzin as a promising anti-inflammatory agent. Tradit Med Res. 2024;9(3):13. doi:10.53388/TMR20231015002
29. Cheng BF, Feng X, Dong YQ, et al. Pectolinarin inhibits LPS-stimulated inflammation in microglial BV2 cells via the NF-κB signaling pathway. Tradit Med Res. 2024;9(6):32. doi:10.53388/TMR20230816002
30. Chen J, Xiao Y, Li D, et al. New insights into the mechanisms of high-fat diet–mediated gut microbiota in chronic diseases. iMeta. 2023;2(1):e69. doi:10.1002/imt2.69
31. Qin C, Kong XY, Wang F, et al. Acupoint catgut-embedding therapy ameliorates DNCB-induced atopic dermatitis in BALB/c mice by regulating Th2-type immune responses and reducing infiltration of CD4⁺ and CD8⁺ cells. Tradit Med Res. 2024;9(9):14–20. doi:10.53388/TMR20231207005
32. Wu D, Liu L, Jiao N, et al. Targeting keystone species helps restore dysbiosis of butyrate-producing bacteria in nonalcoholic fatty liver disease. iMeta. 2022;1(4):e61. doi:10.1002/imt2.61
33. Teng F, Wang H. Protective effects and metabolomics analysis of dihydromyricetin on cyclophosphamide-induced hepatotoxicity in mice. Pharm Sci Adv. 2025;3.
34. Liu J, Li J, Zhang W, et al. Association analysis–based screening strategy for quality markers of Tengdan capsule in the treatment of hypertensive renal disease. Front Pharmacol. 2025;16:1647921. doi:10.3389/fphar.2025.1647921
 © 2026 The Author(s). This work is published and licensed by Dove Medical Press Limited. The
full terms of this license are available at https://www.dovepress.com/terms
and incorporate the Creative Commons Attribution
- Non Commercial (unported, 4.0) License.
By accessing the work you hereby accept the Terms. Non-commercial uses of the work are permitted
without any further permission from Dove Medical Press Limited, provided the work is properly
attributed. For permission for commercial use of this work, please see paragraphs 4.2 and 5 of our Terms.
© 2026 The Author(s). This work is published and licensed by Dove Medical Press Limited. The
full terms of this license are available at https://www.dovepress.com/terms
and incorporate the Creative Commons Attribution
- Non Commercial (unported, 4.0) License.
By accessing the work you hereby accept the Terms. Non-commercial uses of the work are permitted
without any further permission from Dove Medical Press Limited, provided the work is properly
attributed. For permission for commercial use of this work, please see paragraphs 4.2 and 5 of our Terms.
Recommended articles
Total Flavonoids of Rhizoma Drynariae Treat Osteoarthritis by Inhibiting Arachidonic Acid Metabolites Through AMPK/NFκB Pathway
Chen GY, Liu XY, Yan XE, Yu X, Liu Y, Luo J, Tao QW
Journal of Inflammation Research 2023, 16:4123-4140
Published Date: 20 September 2023