Back to Journals » Journal of Inflammation Research » Volume 16
NAMPT/SIRT1 Expression Levels in White Blood Cells Differentiate the Different Rheumatoid Arthritis Subsets: An Inspiration from Traditional Chinese Medicine
Authors Cheng XP, Wang XW, Sun HF, Xu L, Olatunji OJ ![]() , Li Y, Lin JT, Zuo J
, Li Y, Lin JT, Zuo J ![]()
Received 20 July 2023
Accepted for publication 20 September 2023
Published 26 September 2023 Volume 2023:16 Pages 4271—4285
DOI https://doi.org/10.2147/JIR.S431600
Checked for plagiarism Yes
Review by Single anonymous peer review
Peer reviewer comments 3
Editor who approved publication: Professor Ning Quan
Xiu-Ping Cheng,1,2,* Xiao-Wan Wang,3,* Han-Fei Sun,4,* Liang Xu,3 Opeyemi Joshua Olatunji,5 Yan Li,1,2,6 Jia-Ting Lin,2,7 Jian Zuo1,2,6
1Xin’an Medicine Research Center, the First Affiliated Hospital of Wannan Medical College (Yijishan Hospital), Wuhu, 241000, People’s Republic of China; 2Research Center of Integration of Traditional Chinese and Western Medicine, Wannan Medical College, Wuhu, 241000, People’s Republic of China; 3Department of Rheumatology, the First Affiliated Hospital of Wannan Medical College (Yijishan Hospital), Wuhu, 241000, People’s Republic of China; 4Department of Pharmacy, the Second Affiliated Hospital of Wannan Medical College, Wuhu, 241000, People’s Republic of China; 5African Genome Center, Mohammed VI Polytechnic University, Ben Guerir, 43150, Morocco; 6Center for Xin’an Medicine and Modernization of Traditional Chinese Medicine, Institution of Health and Medicine, Hefei Comprehensive National Science Center, Hefei, 230000, People’s Republic of China; 7Department of Stomatology, the First Affiliated Hospital of Wannan Medical College (Yijishan Hospital), Wuhu, 241000, People’s Republic of China
*These authors contributed equally to this work
Correspondence: Jia-Ting Lin; Jian Zuo, Email [email protected]; [email protected]
Background: Rheumatoid arthritis (RA) patients are prone to developing different metabolic complications. Traditional Chinese Medicine attributes this uncertainty to varied syndrome types.
Methods and Results: We retrospectively analyzed some serological indicators of active RA patients and healthy individuals. Randomly selected RA patients were divided into three groups according to NAMPT and SIRT1 expression levels in white blood cells (WBCs). Their disease severity and metabolic status were compared. Representative blood samples were subjected to a UPLC-MS/MS-based metabolomics analysis. Different human WBCs were treated with oleic acid and palmitic acid in vitro. The results indicated that blood glucose and lipid levels were decreased in RA patients, but their decrease was not in accordance with disease severity. Nutrients in the patients highly expressing SIRT1 were well preserved, with the lowest levels of RF and β-CTX and the highest levels of adiponectin and resistin. Most of them exhibited cold symptoms. When SIRT1 deficiency was obvious, lipid depletion became evident, irrespective of expression levels of NAMPT. Simultaneous high-expression of SIRT1 and NAMPT coincided with the increase in production of lactic acid and the prevalence of hot symptoms. Despite the low levels of IL-6, joint injuries were severe. The corresponding WBCs were especially sensitive to fatty acids anti-inflammatory treatments. The levels of CCL27, CCL11, CCL5, AKP, CRP and ESR were similar among all the groups.
Conclusion: NAMPT overexpression is a risk factor for joint injuries and nutrient depletion in RA. Supplementation with lipids would exert beneficial effects on these RA patients. Its aftermath would cause even severe inflammation. Contrarily, SIRT1 up-regulation restrains inflammation and lipid depletion.
Keywords: rheumatoid arthritis, inflammation, energy metabolism, blood glucose, lipids, joint damage
Introduction
Rheumatoid arthritis (RA) is an autoimmune disease characterized by the breakdown of self-tolerance and articular manifestations. Undoubtedly, the disruption of immune balance is a key event in developing RA. Numerous evidences have shown that the imbalanced differentiation of immune cells and the consequent alteration of cytokine network are the driving force behind RA.1,2 By interacting with effector cells like osteoclast and synovioblast, inflammatory immune cells sustain inflammation and initiate tissue degradation.2,3 Hence, regulating the molecules deciding phenotypes of immune cells is an effective approach to treat RA, and emerging immune pathways have been identified as anti-rheumatic targets.2,4,5 It has been shown that metabolism reprogramming serves as a foundation for immune rebalancing.6,7 Thus, increased attentions are attached to the metabolic complications of RA, since they may potently amplify immune abnormalities and aggravate the disease severity via the so-called metabolism-immune feedback mechanism.8
However, previous observations obtained several conflicting results regarding the relevance of metabolic changes and RA pathology, and RA lipid paradox is the most well known. Overweight is considered as an important risk factor for RA. A substantial portion of RA patients develop obesity and hyperlipidemia. However, RA is a wasting disease, and lean mass loss and fat depletion are obvious in many cases. The patients with low blood lipid levels are much more susceptible to cardiovascular diseases, whereas well-preserved lipids reserve usually promises better prognosis and milder disease severity.8–10 Until now, this mystery is still unresolved, which imposes obvious negative impact on introducing metabolism intervention-based anti-rheumatic regimens.
The wisdom of Traditional Chinese Medicine (TCM) provides some useful clues. According to the ancient Chinese philosophy, all the materials and activities can be divided into two distinct categories, namely Yin and Yang. The two phenomena have opposite properties. Neither of them can exist alone, and their existence relies on each other. The status of any subjects cannot hold still, and their properties are dynamically turning into the opposite.11 The understanding stated above is perfectly reflected in the famous Yin and Yang fish symbol. TCM was developed based on this theory. In TCM, symptoms of a certain disease can be either cold (Yin) or hot (Yang).11 In the case of RA, there are two syndrome subtypes: HanBi (cold symptoms-related) and ReBi (hot symptoms-related).12 The manifestations of ReBi include sensitivity to heat, joint swelling, pain, redness, rapid/bounding pulse, red tongue, thirstiness and fat loss. HanBi is common among chronic patients and characterized by sensation of chill, joint deformation, motor function impairment, weak/slow pulse, pale tongue, fatigues and poor appetite.12,13 It should be noted that there are several cases in the transitory stages, which can hardly be assigned into either of them. Thanks to the simple logic and rules, TCM diagnosis could facilitate researches deciphering RA lipid paradox by categorizing the patients into appropriate subgroups.
Unfortunately, TCM diagnosis is subjective, and the results are not always reliable. As such, it is necessary to introduce some objective parameters to perfect the classification method. TCM syndrome types are traditionally judged by the overall clinical manifestations, such as reactions to caloric stimulation, breath rhythm, pulse pattern, appetite, thirstiness, complexion, coating on the tongue, etc.11,12 These clues are reflective of the internal environment. As the two most important dimensions of the internal environment, metabolism and immune conditions are apparently related to TCM practices. ReBi patients typically undergo acute stages, when inflammation is severe and catabolism is increased. These abnormalities in HanBi are attenuated, reaching a rebalanced pathological status.14,15 Due to the altered metabolism profiles of inflammatory immune cells, it is theoretically possible to develop the criteria for RA subtype differentiation by monitoring relevant changes.6,7
There are numerous immune and metabolism indicators, which makes it difficult to develop a comprehensive criterion. This question could be simplified by studying the upstream pathways.16 We previously revealed that collagen-induced arthritis (CIA) rats endured varying symptoms as the disease progressed. At the onset of secondary inflammation, CIA resembled ReBi, whereas, when inflammation became chronic and mild, CIA shared many similarities with HanBi. NAMPT/SIRT1 plays an important role during this process by reshaping monocyte phenotypes.17 We believe that the different RA syndrome types also reflect the varied disease stages and can be differentiated by the status of NAMPT/SIRT1, a dual-functional pathway. NAMPT is the rate-limiting enzyme for NAD synthesis, and the latter acts as an indispensable co-enzyme during energy biogenesis. NAMPT up-regulation would fuel inflammation by sustaining energy supply, which is evidenced in RA.18 SIRT1 is a NAD-dependent deacetylase, and therefore serves as a downstream of NAMPT. Interestingly, it shows the opposite functions, inhibiting glycolysis and inflammation.19 Accordingly, SIRT1 up-regulation is believed to benefit anti-RA therapies.20 The subtle relationship between NAMPT and SIRT1 vividly embodies the Yin-Yang theory.
Inspired by these clues, herein we investigated the possibilities of establishing RA subtype differentiation criteria under the guidance of TCM idea based on either conventional RA-related clinical parameters or NAMPT/SIRT1 status and tested if such a criterion can benefit clinical practices by extending our knowledge about RA lipid paradox and personalized nutritional care during RA therapies.
Materials and Methods
Assessing the Relevance Between RF and Metabolic Phenotypes in RA Patients
The use of clinical data and human blood samples were strictly in accordance with the guidelines of the Declaration of Helsinki and approved by the Institutional Ethics Research Committee of Yijishan Hospital (ethics approval number: 2019–23). All participants signed the consent form for experimental use of their blood.
We first investigated the metabolic difference between RA patients and healthy population. In this analysis, fifty-two patients diagnosed with active RA were enrolled when they visited the Outpatient Department of Yijishan Hospital from January 2021 to October 2021. The levels of metabolic indicators including blood glucose, total cholesterol (TC), triglycerides (TG), high-density lipoprotein (HDL), low-density lipoprotein (LDL) as well as immune indicators including antistreptolysin O (ASO), rheumatoid factor (RF), C-reactive protein (CRP), complement-C3 (C3), C4, IgA, IgG, IgM, IgE together with TCM diagnosis results were retrieved from the Hospital Information System (HIS). The same number of age- and gender-paired healthy individuals were adopted as the control, and their clinical data were obtained from the Medical Examination Center of the same hospital. Their demographic characteristics and clinical information are shown in Supplementary S1. Their metabolic status was compared to ascertain variations due to RA. Thereafter, the RA patients were divided into three subsets according to RF values (RF−, <20 U/L; RF+, 20–500 U/L; RF++, >500 U/L). Their disease severities and metabolic differences were compared. We were keen to find out if this grouping result was coincident with lipid metabolism phenotype difference and TCM diagnosis.
Evaluating NAMPT/SIRT1 as an Indicator for RA Subtype Classification
In this analysis, other fifty-four RA patients were enrolled, who had well-documented medical history, and the essential data are included in Supplementary S2. In addition to the information mentioned above, some other medical records were also taken into consideration, including erythrocyte sedimentation rate (ESR), X-ray digital radiographic examination (DR), body mass index (BMI), medication, complete blood count and hepatic/renal functions.
Anticoagulation blood samples from these patients were collected, separated into plasma and blood cells within 24 h after sampling. Levels of alkaline phosphatase (AKP), glucose, pyruvic acid, lactic acid, TC and TG in the plasma were determined using corresponding colorimetric kits from Solarbio (Beijing, China) and Jiancheng Bioengineering Institute (Nanjing, Jiangsu, China). Blood levels of β-BTX, IL-6, CCL27, CCL11, CCL5, adiponectin and resistin were quantified using ELISA kits supplied by Multi-Science (Hangzhou, Zhejiang, China). All the assays were performed strictly in accordance with the manufacturer’s protocols.
Based on the relative expression of NAMPT and SIRT1 in white blood cells (WBCs), the patients were assigned to three subsets (NAMPT++SIRT1++, NAMPT+SIRT1++ and NAMPT+SIRT1+). Their disease severity and metabolic status were compared, and the statistically different indicators among the three groups were identified. TPI1 expression in WBCs was also investigated by PCR method to reflect glycolysis status. To highlight metabolic differences, a metabonomic study was performed. The results were used to test the hypothesis that NAMPT and SIRT1 expression levels in WBCs can be used to differentiate RA subtypes and perfect TCM diagnosis.
RT-qPCR Assay
Cell precipitates obtained from blood samples after centrifugation were re-suspended in red blood cell lysis buffer (Solarbio, Beijing, China). The samples were subjected to erythrolysis, and WBCs were harvested after further centrifugation. TRIzol reagent (Keygen Biotech, Nanjing, Jiangsu, China) was used for extracting total RNA from WBCs. The products were purified with chloroform extraction and isopropanol precipitation. cDNA was synthesized using ReverAid First-Strand cDNA synthesis kit (Thermo Fisher Scientific, Rockford, IL, USA), which was further subjected to SYBR Green qPCR Mix (New England Biolabs, Ipswich, MA, USA)-based qPCR procedures on a 7500 Real-Time PCR apparatus (Thermo Fisher Scientific, Rockford, IL, USA). The relative expression of genes was calculated using 2−ΔΔCT method taking β-ACTIN as the internal reference. The primers were synthesized by General Biol (Chuzhou, Anhui, China), and their sequences were shown in Supplementary S3.
UPLC-MS/MS-Based Metabonomic Study
Five representative plasma samples were selected from each RA subgroup mentioned in the last section, and 100 μL of the plasma was spiked with 400 μL of an extraction solution (methanol: acetonitrile = 1:1). The solution was kept at −40°C for 1 h and centrifuged at 12,000 rpm for 15 min. The supernatant was taken as an analyte. Quality control samples were prepared by mixing an equal amount of all the analytes, which were repeatedly analyzed to test the accuracy and reliability of the analytical method. Chromatographic separation was achieved using a BEH Amide column (2.1 mm × 100 mm, 1.7 μm) on an UPLC system (Vanquish, Thermo Fisher Scientific). The mobile phase A was an aqueous solution comprised 25 mmol/L ammonium acetate and 25 mmol/L of ammonia hydroxide (pH = 9.75), and acetonitrile was designated as the mobile phase B. The auto-sampler temperature and injection volume were set at 4°C and 2 μL, respectively. The metabolites were detected using an Orbitrap Exploris 120 mass spectrometer (Orbitrap MS, Thermo) equipped with an ESI interface operating on IDA mode. The key parameters utilized for the metabolite detection were summarized below: sheath gas flow rate, 50 Arb; aux gas flow rate, 15 Arb; capillary temperature, 320°C; full MS resolution, 60,000; MS/MS resolution, 115,000; collision energy, 10/30/60 in NCE mode; spray voltage, 3.8 kV (positive) or −3.4 kV (negative). The raw data obtained were subjected to peak detection, extraction, alignment, integration and normalization processing. Common signals were kept and allocated to the different metabolites by searching an in-house MS/MS database. The processed data were then fed to a SIMCA software (V16.0.2, Sartorius Stedim Data Analytics AB, Umea, Sweden) for orthogonal projections to latent structures-discriminant analysis (OPLS-DA). The differential metabolites were screened out based on Student’s t-test and variable importance in the projection (VIP) values. Those with p < 0.05 and VIP > 1 were displayed in heatmaps.
In vitro WBC Treatments
The anticoagulation blood from other sixty RA patients was collected, and each of the samples was divided into two portions. Half of the blood samples were subjected to ELISA analysis of IL-1β and TGF-β levels and PCR analysis of NAMPT and SIRT1 expression. The remaining half were incubated with a free fatty acid (FFA) mixture of oleic acid (0.66 mM) and palmitic acid (0.33 mM) in an atmospheric condition of 5% CO2 at 37°C with occasional shaking for 6 h. Thereafter, the plasma and WBCs from the treated blood samples were subjected to ELISA and PCR analyses, respectively. In the PCR assay, the expression of iNOS and ARG-1 were detected to assess WBC immune status. GAPDH served as the reference. Their sequences were displayed in Supplementary S3. Using the aforementioned grouping strategy, the blood samples were divided into three categories, and we compared their different reactions to FFA stimulus.
Statistical Analysis
All the data were presented as mean ± standard deviation. Statistical differences among groups were analyzed using GraphPad Prism 8.0 (GraphPad Software, Cary, NC, USA) and one-way analysis of variance coupled with Tukey post hoc test.
Results
Blood Glucose and Lipids Were Decreased in Active RA Patients
The impacts of RA severity on metabolism are still unknown. In an attempt to avoid this uncertainty, we selectively compared the metabolic profiles of active RA patients and healthy individuals. The proportion of each gender in the two groups was the same. Their ages were also paired (57.44 ± 11.80 vs 57.27 ± 12.73 years, p > 0.05) (Figure 1A). We previously revealed that RA-related acute inflammation relies on accelerated glycolysis, which could increase glucose consumption.17 Consistent with this, levels of blood glucose in the investigated RA patients were considerably lower when compared to the controls (4.99 ± 0.82 vs 5.29 ± 0.58 mM, p < 0.05). The individual variation in RA patients was larger. Meanwhile, blood TC (4.15 ± 1.01 vs 4.72 ± 1.13 mM, p < 0.01), TG (0.96 ± 0.43 vs 1.60 ± 1.42 mM, p < 0.01) and LDL (2.20 ± 0.69 vs 2.67 ± 0.89 mM, p < 0.01) were also significantly decreased in these RA patients when compared to the healthy counterparts. Although HDL levels between the two populations were not statistically different, a decreased trend was observed in RA patients (Figure 1B). These results confirm that nutrients depletion occurs in active RA patients, which suggests that monitoring certain immune indicators can differentiate RA subtypes with the different metabolic phenotypes.
 |
Figure 1 General metabolic difference between two different populations. (A) ages of the recruited general people and active RA patients; (B) levels of blood glucose, TC, TG, HDL and LDL in the people. All the data were obtained from HIS. Statistical significance: *p < 0.05 and **p < 0.01 compared between the two populations. |
RF is Not an Ideal Indicator Identifying Metabolism-Related RA Subtypes
Despite the fact that some cases are diagnosed to be RF-negative, RF is still a vital tool for RA diagnosis and indicator of disease severity. We divided the recruited RA patients into three subgroups according to RF levels (RF−, RF+ and RF++) (Figure 2A) and investigated if they expressed distinctly different metabolic phenotypes. Among the clinical indicators we examined, CRP, C4 and IgE were revealed to be closely related to RF. RF++ RA patients were diagnosed with the highest levels of CRP (70.20 ± 68.87 mg/L) and IgE (333.10 ± 388.73 IU/mL) and the lowest levels of C4 (0.14 ± 0.05 g/L) (Figure 2B). No other clinical parameters were observed with statistically different levels among the subgroups. Age is not a key variable affecting RA severity (Figure 2C). Due to severe conditions, HDL levels in RF++ RA subgroup were the lowest, especially when compared to RF+ subgroup (1.31 ± 0.33 vs 1.55 ± 0.44 mM, p < 0.05). However, blood TC, TG, and LDL as well as glucose were not decreased by the increase in RF titers (Figure 2D). Blood glucose levels were even gradually increased when RA severity was aggravated. We tried to categorize RA patients using other RA-related indicators like ASO, CRP, C3, C4, IgA, etc. None of these indicators differentiated RA metabolism phenotypes better than RF. In other words, the conventional diagnostic parameters were unable to predict the metabolic status of RA patients. Only HDL was revealed to negatively correlate to CRP, and there was no other observed correlative relationship between immune and metabolism parameters (Figure 2E). This is the exact dilemma encountered by the previous researches and the partial reason developing RA lipid paradox. This grouping strategy also failed to correlate with TCM diagnosis. The incidence of ReBi and HanBi in all the groups was similar.
 |
Figure 2 Metabolic differences of RA patients with varied disease severity. (A) RF titer-based grouping strategy of RA subsets; (B) levels of RA diagnosis indicators CRP, C4 and IgE in RA subgroups; (C) ages of the patients in different subgroups; (D) blood levels of metabolic indicators (blood glucose, TC, TG, HDL and LDL) in the patients (red lines indicate the thresholds of normal reference values); (E) correlation among clinical parameters. All the data were obtained from HIS. Statistical significance: *p < 0.05 and **p < 0.01 compared between the pairs as indicated in images. |
NAMPT/SIRT1 Status in WBCs is Related to RA Clinical Manifestations
When NAMPT was overexpressed, the expression of TPI1, a glycolytic enzyme, was up-regulated (Figure 3A). Among the assessed clinical indicators, RF was the most sensitive to NAMPT/SIRT1. NAMPT+SIRT1++ RA patients were diagnosed with the lowest levels of RF (49.94 ± 54.33 U/L). The two other commonly used RA diagnosis indicators, CRP and ESR, were unaffected by NAMPT and SIRT1 expressions (Figure 3B). NAMPT/SIRT1 apparently affected metabolism conditions. NAMPT+SIRT1++ subgroup had higher BMI (23.63 ± 2.62 kg/m2) than NAMPT++SIRT1++ (21.99 ± 2.48 kg/m2) and NAMPT+SIRT1+ (21.91 ± 3.24 kg/m2) counterparts. No significant differences in the age and disease duration were observed among the groups (Figure 3C).
 |
Figure 3 General clinical manifestation differences among patients with different NAMPT/SIRT1 status. (A) relative gene expression of NAMPT, SIRT1 and TPI1 in WBCs from NAMPT++SIRT1++, NAMPT+SIRT1++ and NAMPT+SIRT1+ RA patients, assessed by RT-qPCR; (B) RF, CRP and ESR levels in the three subgroups; (C) BMI, age and disease duration of the RA patients; (D) levels of IL-6, CCL27, CCL11, CCL5, β-CTX and AKP in the plasma of RA patients, assessed by ELISA method. Statistical significance: *p < 0.05 and **p < 0.01 compared between the pairs as indicated in images. |
In order to further explore the disease condition differences, we analyzed some RA-related parameters in the blood samples. The lowest level of IL-6 (25.53 ± 27.76 pg/mL) was detected in NAMPT++SIRT1++ RA patients (Figure 3D). Similar to the previous observation, NAMPT-overexpressing RA patients showed higher levels of CCL11 and lower levels of CCL5, albeit the differences were not statistically significant.17 No obvious changes was observed about CCL27 levels when the status of NAMPT/SIRT1 was altered. NAMPT/SIRT1 status in WBCs seems to be closely related to joint damages. The release of β-CTX, a degradation product of collagen, was reduced when SIRT1 was overexpressed. β-CTX levels in NAMPT++SIRT1++, NAMPT+SIRT1++ and NAMPT+SIRT1+ subsets were 1104.26 ± 606.92, 716.35 ± 428.91 and 1322.84 ± 926.99 pg/mL, respectively. Blood concentrations of AKP were slightly higher in NAMPT-overexpressing patients (Figure 3D). These patients tended more to receive DR examination (12 out of 18), and their radiographic damages were severer when compared to the other groups. Fifteen cases in this subgroup were diagnosed with typical hot symptoms. Contrarily, the patients overexpressing SIRT1 showed the least probability of receiving DR examination (4 out of 18), and the odds of developing cold symptoms were high (12 out of 18) (Supplementary S2). These results demonstrate that the simultaneous high-expression of NAMPT and SIRT1 in WBCs indicates joint injury aggravation and hot syndrome inclination, whereas, SIRT1 high-expression alone favors RA recovery and acquisition of cold symptoms.
NAMPT/SIRT1 is Successfully Applied in Metabolism Phenotype Differentiation
We then focused on metabolic differences. High levels of lactic acid (4.72 ± 1.29 mM) and pyruvic acid (0.58 ± 0.11 mM) in the blood of NAMPT++SIRT1++ RA patients demonstrated that NAMPT overexpression promoted glycolysis. These findings are in conformity to the high-expression of TPI1 shown above, whereas the patients highly expressing SIRT1 were observed with the highest levels of blood glucose (3.76 ± 1.02 mM) and the lowest levels of pyruvic acid (0.47 ± 0.07 mM), indicating inhibited glycolysis status (Figure 4A). The relatively high BMI shown above suggests reduced energy expenditure. In consistent to this, NAMPT+SIRT1++ subgroup showed the highest levels of TC (6.36 ± 1.03 mM), and TG levels in these patients were a bit higher than NAMPT+SIRT1+ counterparts (1.87 ± 0.66 vs 1.50 ± 0.50 mM, p < 0.01) (Figure 4B). Compared to the other two, this RA subset was detected with the highest levels of resistin (1108.32 ± 730.73 pg/mL) and adiponectin (844.03 ± 626.39 pg/mL), two important adipokines involved in fat metabolism (Figure 4C).21 High levels of BMI, circulating lipids and adipokines suggest that the functions of adipose tissues are well preserved.
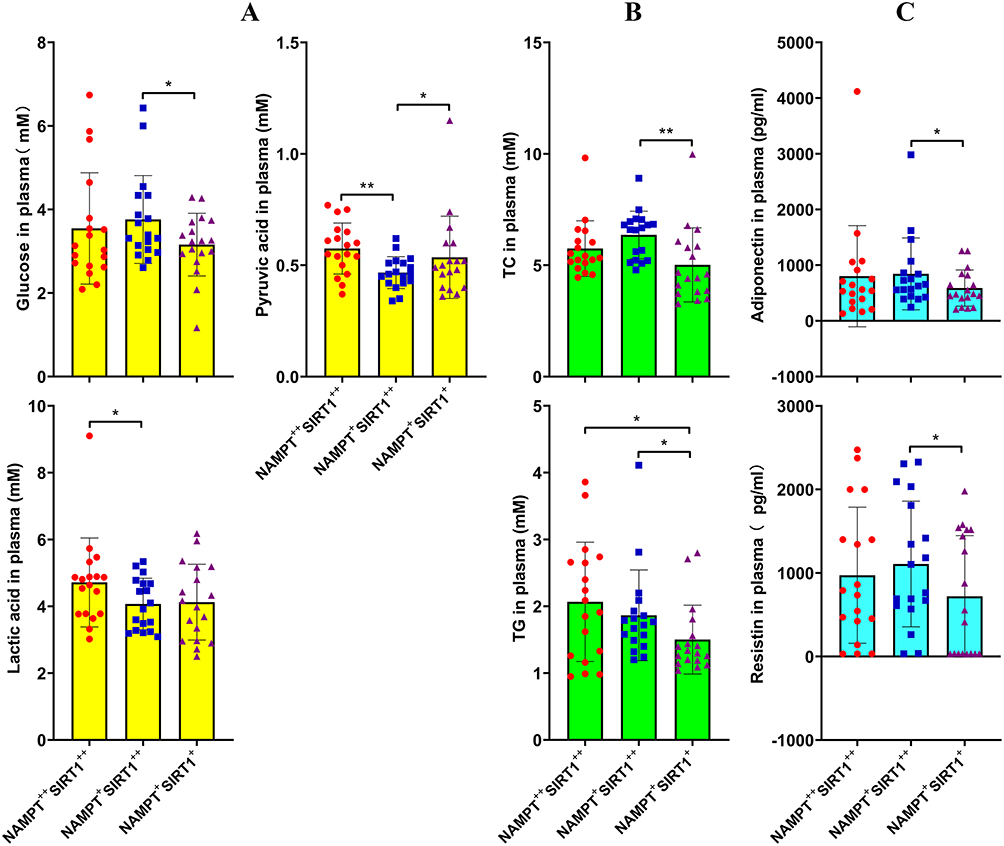 |
Figure 4 Impact of the varied NAMPT/SIRT1 status on metabolism conditions of RA patients. (A) levels of blood glucose, lactic acid, pyruvic acid, assessed by colorimetric method; (B) levels of TC and TG, assessed by colorimetric method; (C) levels of blood adiponectin and resistin, assessed by ELISA method. Statistical significance: *p < 0.05 and **p < 0.01 compared between the pairs as indicated in images. |
To better demonstrate the metabolic differences, we analyzed metabolites in the blood using UPLC-MS/MS method. OPLS-DA showed that the three RA subgroups indeed had different metabolic profiles (Figure 5A). When compared in pairs, their differences became more significant (Figure 5B). The differential compounds in pairs are displayed in Figure 5C. Majority of these metabolites were lipids and amino acid derivatives. The metabolites with reliable change trends among all the groups were manually selected and shown in Figure 5D. Using these metabolites, the three groups can still be successfully differentiated in the scatter diagram constructed by OPLS-DA (Figure 5E). Hence, they can reflect NAMPT/SIRT1-related fundamental metabolic differences.
 |
Figure 5 Different metabolic profiles of patients with the varied NAMPT/SIRT1 status revealed by UPLC-MS/MS-based metabolomics study. (A) results of OPLS-DA using the chromatography data from all the three subgroups; (B) paired comparison of the RA subgroups based on OPLS-DA using chromatography data; (C) the differential metabolites between paired subgroups identified under both positive and negative modes; (D) the metabolites with reliable change trends among groups manually chosen; (E) the capability differentiating subgroups of the chosen metabolites. RA1, RA2 and RA3 represent NAMPT++SIRT1++, NAMPT+SIRT1++ and NAMPT+SIRT1+ RA subgroups, respectively. |
FFA Supplement Especially Benefit RA Therapy in NAMPT++SIRT1++ Subtype
Subsequently, levels of the manually selected metabolites together with some related derivatives were shown individually. Compared with NAMPT++SIRT1++ patients, NAMPT+SIRT1++ cases showed obviously higher levels of FFAs. Undecanoic acid was a good representative for this. Decrease in the total FFAs in NAMPT+SIRT1+ subset was not obvious. However, levels of eicosapentaenoic acid, undecanoic acid and valeric acid were lower than those detected in NAMPT+SIRT1++ counterparts (Figure 6A). SIRT1 overexpression favored aerobic oxidation, as indicated by higher levels of citric acid and succinic acid, two intermediates from tricarboxylic acid cycle. FFA oxidation was also promoted under this condition, evidenced by higher levels of butyrylcarnitine and linoleylcarnitine (Figure 6B). Except for L-arginine, most amino acids including L-asparagine, L-methionine, pyroglutamic acid, L-proline, D-ornithine and citrulline were found with the highest levels in NAMPT+SIRT1++ patients (Figure 6C).
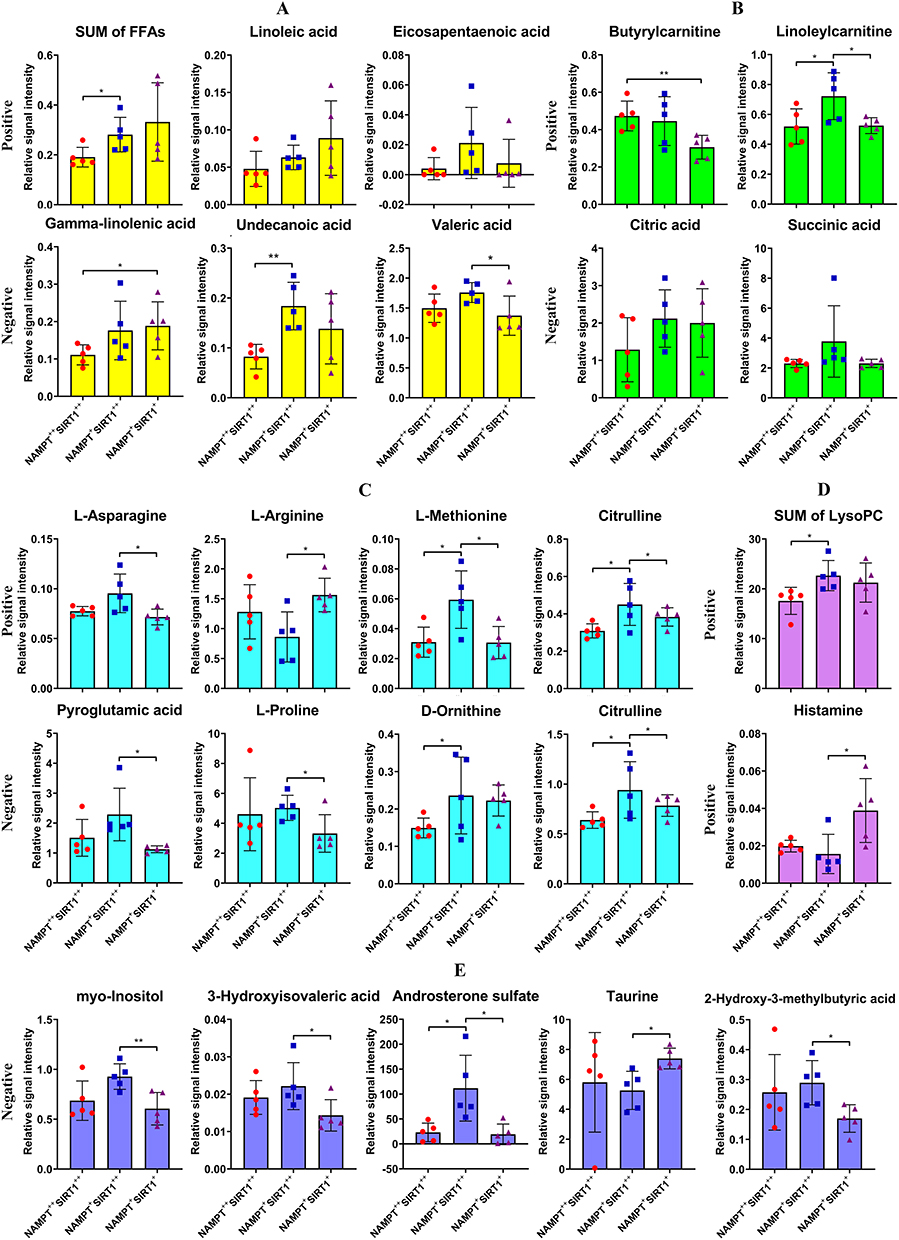 |
Figure 6 Relative concentrations of the differential metabolites in blood plasma of RA patients with the varied NAMPT/SIRT1 status. (A) levels of total and representative FFAs; (B) levels of aerobic oxidation-related intermediates; (C) levels of amino acids; (D) levels of some other differential metabolites detected under positive mode; (E) levels of some other differential metabolites detected under negative mode. Statistical significance: *p < 0.05 and **p < 0.01 compared between the pairs as indicated in images. |
Two other differential metabolites among these groups identified under positive mode were total lysoPC and histamine (Figure 6D). 2-Hydroxy-3-methylbutyric acid, myo-inositol, 3-hydroxyisovaleric acid, androsterone sulfate and taurine were filtered as the additional differential metabolites under negative mode (Figure 6E). The levels of histamine and taurine were found to be low in NAMPT+SIRT1++ patients, while all the other differential metabolites showed the highest levels in this subgroup.
Because the deficiency of nutrients typically FFAs in NAMPT++SIRT1++ and NAMPT+SIRT1+subgroups is obvious, FFA supplement could ease the situation and have profound impact on the immune status. As such, we treated whole blood from different RA patients with a FFA mixture. Considering the chemical composition of normal vegetable oils and the physiological distribution, oleic acid and palmitic acid were chosen, and their final concentrations in blood were set at 0.66 mM and 0.33 mM, respectively.21 The groupings are as shown in Figure 7A. Although the basal levels of IL-1β among the three subgroups were similar, NAMPT+SIRT1++ cases showed obviously higher levels of TGF-β (201.67 ± 85.09 pg/mL) (Figure 7B). This suggests that this situation favors the anti-inflammatory polarization of monocytes. After FFA stimulus, TGF-β level differences between NAMPT++SIRT1++ and NAMPT+SIRT1++ groups disappeared. TGF-β levels in NAMPT++SIRT1++ subgroup became higher when compared to NAMPT+SIRT1+ counterparts (225.83 ± 55.31 pg/mL vs 209.33 ± 21.98 pg/mL, p < 0.05). IL-1β levels in NAMPT++SIRT1++ subset were the lowest (14.45 ± 2.28 pg/mL) among the three subgroups (Figure 7C). We highlighted the FFA-induced cytokine changes in Figure 7D, which confirms that TGF-β increase was significant in NAMPT++SIRT1++ subgroup. No difference was observed in ARG-1 expression among the three groups after FFA treatment. Strikingly, compared to the other two subgroups, NAMPT+SIRT1++ WBCs expressed the highest levels of iNOS, a M1 indicator (Figure 7E). These results demonstrate that FFA stimulus was effective in easing inflammation in NAMPT++SIRT1++ WBCs, while NAMPT+SIRT1++ cases were benefited the least from this treatment.
 |
Figure 7 The varied reactions of WBCs from different RA patients to FFA stimulus. (A) the grouping strategy for the blood samples; (B) levels of IL-1β and TGF-β in the blood plasma before the treatment; (C) levels of IL-1β and TGF-β in the blood plasma after the treatment; (D) FFA-induced level changes of IL-1β and TGF-β in different blood samples; (E) expression of mRNA iNOS and ARG-1 in WBCs within different blood samples after FFA treatment. Statistical significance: *p < 0.05 and **p < 0.01 compared between the pairs as indicated in images. |
Discussion
RA-related metabolic complications had been in the limelight decades ago. Since RA is an autoimmune disease, these anomalies should be instigated by certain immune factors. On the other hand, altered metabolism will also affect immune conditions.22 Therefore, thoroughly characterizing the metabolic profiles of RA patients is of great clinical interests, which is still a challenging task until now. Aside the lipid paradox, blood glucose changes in RA are also confusing. Some researchers believe that the prevalence of diabetes in RA patients is generally higher than the healthy population, because inflammation impairs pancreatic islet functions, and the patients with chronic inflammation tend to develop insulin resistance.23 However, this claim is questioned by many other evidences.24 Inflammation obviously requires more energy supply, leading to the increased glucose consumption.25 Meanwhile, inflammatory immune cells mainly utilize glucose via glycolysis with relatively low energy utilization efficiency. Hence, the persistent inflammation would exacerbate glucose depletion. Consistent with these inferences, blood glucose decrease was indeed observed in RA animal models.17 In essence, blood glucose levels can either be increased or decreased in RA population according to the varied disease conditions. In this study, active RA patients generally showed lower levels of blood glucose when compared to the healthy population, but a substantial portion of these patients were diagnosed with hyperglycemia (blood glucose >6.1 mM) (Figure 1). Due to similar reasons, the relationship between lipid changes and RA severity is also uncertain (Figure 2). As the most important alternative energy source, lipids are increasingly catabolized to sustain ATP generation under inflammatory conditions. In fact, fat loss is a hallmark of rheumatoid cachexia.26 However, FFA oxidation capacity in most of the immune cells from RA patients is impaired, which could lead to blood lipid accumulation.27 Under this condition, it is impossible to predict RA severity using some basic metabolism indicators, and vice versa. Unsurprisingly, we failed to differentiate the metabolic phenotypes of RA patients using RF, ASO, CRP, C3, C4 and IgA.
Hence, it is necessary to introduce other research strategies. We revealed that the disease stage is a part of heterogeneity in RA, which is reflected by NAMPT/SIRT1 status in WBCs.17 This pathway bridges the immune and metabolism systems, and it offers a possible chance for the differentiation of RA patients with different immune and metabolism phenotypes. This hypothesis was basically validated (Figures 3–5). NAMPT/SIRT1 is involved in the regulation of monocytes/macrophage polarization and metabolism.18,19 Interestingly, NAMPT and SIRT1 have evolved as a pair of functional rivals. The former expedites DAPDH-mediated glycolysis by providing sufficient NAD supply, and its secreted form participates in several inflammatory pathways.18,28 Hence, NAMPT overexpression is an indicator of M1 polarization. Although SIRT1 relies on NAD to fulfill its functions and serves as a downstream of NAMPT, it is generally an anti-inflammatory signaling.19 Through deacetylation of certain transcriptional factors such as NF-κB and AP-1, SIRT1 negatively regulates inflammation.19,29 In the metabolic aspect, SIRT1 promotes aerobic oxidation and inhibits glycolysis, which is also totally different from NAMPT.19,20 Because of these reasons, NAMPT/SIRT1 status is highly variable and finely mediates dynamical pathological changes in RA. Studying the change patterns of NAMPT/SIRT1 will not only benefit RA subset differentiation but also lay a foundation for the individual treatments.
NAMPT is generally up-regulated in RA patients, and its inhibition is believed to benefit anti-RA therapies.28 In line with this claim, it was observed that activating NAMPT exacerbated RA models.30 However, a recent study revealed that boosting NAMPT-NAD was beneficial for RA patients.31 Meanwhile, SIRT1 expression is usually deficient in rheumatic subjects. As a result, SIRT1 up-regulation is taken as a feasible anti-rheumatic approach.20 Our previous studies confirmed this strategy.32,33 However, some other facts cannot be ignored. In the joints of RA patients, SIRT1 is overexpressed, which is related to an inflammatory milieu.34 Besides, SIRT1 controls the release of extracellular NAMPT.35 These clues implies that SIRT1 inhibition sometimes would be helpful. Together, it is concluded that NAMPT/SIRT1 regulation treatments are conditionally effective and have limited applications. The patients who would potentially benefit from this therapeutic strategy should be filtered in advance.
We successfully divided RA patients into NAMPT++SIRT1++, NAMPT+SIRT1+ and NAMPT+SIRT1++ subsets. A previous study showed that NAMPT overexpression is an early event in RA-induced inflammation.17 Hence, IL-6 levels in these cases were relatively low (Figure 3D). NAMPT drives the inflammatory polarization of monocytes and macrophages, which directly accounts for tissue degradation and joint injuries.36 As a result, radiographic damages were severe (Supplementary S2), and levels of β-CTX and AKP were high (Figure 3D) under this condition. SIRT1 was also highly expressed in these patients (Figure 3A). A reasonable therapeutic strategy to inhibit NAMPT. Levels of IL-6 and CCL5 in NAMPT+SIRT1+ patients were relatively high (Figure 3D), demonstrating an inflammatory phenotype. Considering the expression deficiency of SIRT1, its up-regulation would be especially beneficial. NAMPT+SIRT1++ cases typically underwent remission stages, with the least disease severity. Regulating NAMPT/SIRT1 would be less meaningful. It should be noted that this pathway reflects only few aspects of RA heterogeneity. Many diagnosis and immune indicators were unaffected by these groupings (Figure 3).
Nonetheless, this differentiation method is useful in understanding the RA lipid paradox. The three subgroups had distinctly different metabolic profiles (Figure 5). Levels of BMI, TC, TG and FFAs in NAMPT+SIRT1++ subgroup were higher than the others (Figures 3 and 4). The reason for the eased nutrient depletion is hinged on the improved disease situation and reduced energy requirement, since the pathological properties of monocytes/macrophages will be largely impaired when SIRT1 is overexpressed.37 In contrast, nutritional conditions in the other cases were not so promising, due to inflammation-induced catabolism up-regulation (Figure 6). In the in vivo experiments, we directly treated RA patients’ blood with FFAs but did not isolate the WBCs. It retained the nutritional difference and better mimicked the environments in vivo. The WBCs from NAMPT++SIRT1++ subset were especially sensitive to FFA anti-inflammatory treatment (Figure 7). This result suggests that NAMPT/SIRT1 status monitoring is very useful in differentiating the metabolic status of RA patients and introducing precision nutritional interventions.
Conclusion
We confirmed that blood glucose and lipids were decreased in active RA patients. However, conventional RA diagnostic indicators were unable to predict the metabolic status, since pathological conditions have dual impacts on metabolism. Comparatively, NAMPT and SIRT1 expression difference in WBCs appropriately differentiated RA subgroups and their syndrome types. High-expression of SIRT1 suggests mild joint damage and well-preserved lipid reserve. NAMPT overexpression indicates nutrient depletion and the exacerbated arthritic manifestations. FFA supplement was effective in attenuating inflammation in WBCs under this condition. These findings suggest that NAMPT/SIRT1 is highly variable according to the pathological condition changes. NAMPT/SIRT1-based grouping strategy could benefit individual treatments and precise nutritional care for RA patients.
Abbreviations
RA, rheumatoid arthritis; CIA, collagen-induced arthritis; TG, total cholesterol; TC, total triglycerides; HDL, high-density lipoprotein; LDL, low-density lipoprotein; ASO, antistreptolysin O; RF, rheumatoid factor; CRP, C-reactive protein; C3, complement-C3; C4, complement-C4; ESR, erythrocyte sedimentation rate; BMI, body mass index; AKP, alkaline phosphatase; HIS, hospital information system; WBC, white blood cells; ESI, electron spray ionization; OPLS-DA, orthogonal projections to latent structures-discriminant analysis; VIP, variable importance in the projection.
Data Sharing Statement
All data generated or analyzed during this study are included in this article and its Supplementary Information.
Ethics Approval
All participants signed the consent form for experimental use of their blood. All experimental procedures and protocols were strictly followed the Declaration of Helsinki and approved by the Institutional Ethics Research Committee of Yijishan Hospital (2019–23).
Author Contributions
All authors made a significant contribution to the work reported, whether that is in the conception, study design, execution, acquisition of data, analysis and interpretation, or in all these areas; took part in drafting, revising or critically reviewing the article; gave final approval of the version to be published; have agreed on the journal to which the article has been submitted; and agree to be accountable for all aspects of the work.
Funding
This work was supported by National Natural Science Foundation of China (81973828), Key Project of Natural Science Foundation of Anhui Province for College Scholar (KJ2020A0868), and Major Project of Natural Science Foundation of the Department of Education of Anhui province under (KJ2019ZD32).
Disclosure
The authors declare no conflicts of interest in this work.
References
1. Sharma J, Bhar S, Devi CS. A review on interleukins: the key manipulators in rheumatoid arthritis. Mod Rheumatol. 2017;27(5):723–746. doi:10.1080/14397595.2016.1266071
2. Alam J, Jantan I, Bukhari SNA. Rheumatoid arthritis: recent advances on its etiology, role of cytokines and pharmacotherapy. Biomed Pharmacother. 2017;92:615–633. doi:10.1016/j.biopha.2017.05.055
3. Shiozawa S, Tsumiyama K, Yoshida K, Hashiramoto A. Pathogenesis of joint destruction in rheumatoid arthritis. Arch Immunol Ther Exp. 2011;59(2):89–95. doi:10.1007/s00005-011-0116-3
4. Bergantini L, d’Alessandro M, Cameli P, et al. Effects of rituximab therapy on B cell differentiation and depletion. Clin Rheumatol. 2020;39(5):1415. doi:10.1007/s10067-020-04996-7
5. Yang P, Qian FY, Zhang MF, et al. Th17 cell pathogenicity and plasticity in rheumatoid arthritis. J Leukoc Biol. 2019;106(6):1233–1240. doi:10.1002/JLB.4RU0619-197R
6. Sun L, Yang X, Yuan Z, Wang H. Metabolic reprogramming in immune response and tissue inflammation. Arterioscler Thromb Vasc Biol. 2020;40(9):1990–2001. doi:10.1161/ATVBAHA.120.314037
7. Wyngene LV, Vandewalle J, Libert C. Reprogramming of basic metabolic pathways in microbial sepsis: therapeutic targets at last? EMBO Mol Med. 2018;10(8):e8712. doi:10.15252/emmm.201708712
8. García-Chagollán M, Hernández-Martínez SE, Rojas-Romero AE, et al. Metabolic syndrome in rheumatoid arthritis patients: relationship among its clinical components. J Clin Lab Anal. 2021;35(3):e23666. doi:10.1002/jcla.23666
9. Venetsanopoulou AI, Pelechas E, Voulgari PV, Drosos AA. The lipid paradox in rheumatoid arthritis: the dark horse of the augmented cardiovascular risk. Rheumatol Int. 2020;40(8):1181–1191. doi:10.1007/s00296-020-04616-2
10. Jiang P, Li H, Li X. Diabetes mellitus risk factors in rheumatoid arthritis: a systematic review and meta-analysis. Clin Exp Rheumatol. 2015;33(1):115–121.
11. Zheng HX, Yang Z. Basic Theory of Traditional Chinese Medicine. Beijing: China Press of Traditional Chinese Medicine; 2021:19–26.
12. Chen J, Cheng HB. Fundamentals of Traditional Chinese Medicine. Beijing: China Press of Traditional Chinese Medicine; 2021:106–157.
13. Rheumatology Branch of Chinese Association of Traditional Chinese Medicine. The guidelines for diagnosis and theory of rheumatoid arthritis combing diseases and syndromes. J Tradit Chin Med. 2018;59:1794–1798.
14. Li S, Lu AP, Wang YY, Li YD. Suppressive effects of a Chinese herbal medicine Qing-Luo-Yin extract on the angiogenesis of collagen-induced arthritis in rats. Am J Chin Med. 2003;31(5):713–720. doi:10.1142/S0192415X03001430
15. Zhang E. Bi Syndrome (Arthralgia Syndrome). J Tradit Chin Med. 2010;30(2):145–152.
16. Al-Khami AA, Rodriguez PC, Ochoa AC. Energy metabolic pathways control the fate and function of myeloid immune cells. J Leukoc Biol. 2017;102(2):369–380. doi:10.1189/jlb.1VMR1216-535R
17. Lei M, Tao MQ, Wu YJ, et al. Metabolic enzyme triosephosphate isomerase 1 and nicotinamide phosphoribosyltransferase, two independent inflammatory indicators in rheumatoid arthritis: evidences from collagen-induced arthritis and clinical samples. Front Immunol. 2022;12:795626. doi:10.3389/fimmu.2021.795626
18. Imai S. Nicotinamide phosphoribosyltransferase (Nampt): a link between NAD biology, metabolism, and diseases. Curr Pharm Des. 2009;15(1):20–28. doi:10.2174/138161209787185814
19. Xie J, Zhang X, Zhang L. Negative regulation of inflammation by SIRT1. Pharmacol Res. 2013;67(1):60–67. doi:10.1016/j.phrs.2012.10.010
20. Wu YJ, Fang WJ, Pan S, et al. Regulation of Sirt1 on energy metabolism and immune response in rheumatoid arthritis. Int Immunopharmacol. 2021;101(Pt A):108175. doi:10.1016/j.intimp.2021.108175
21. Yu LJ, Ji CL, Wang Y, et al. Changes within liver accounts for fatty acids decrease in the blood of rats with adjuvant-induced arthritis. Eur J Lipid Sci Tech. 2023;125(4):2200142.
22. Yang Z, Matteson EL, Goronzy JJ, Weyand CM. T-cell metabolism in autoimmune disease. Arthritis Res Ther. 2015;17(1):29. doi:10.1186/s13075-015-0542-4
23. Kondratyeva LV, Popkova TV, Nasonov E. Insulin resistance in rheumatoid arthritis: relationship to lipid metabolism disorders and metabolic syndrome. Rheumatol Sci Pract. 2019;57(3):280–283. doi:10.14412/1995-4484-2019-280-283
24. Inamo J, Kochi Y, Takeuchi T. Is type 2 diabetes mellitus an inverse risk factor for the development of rheumatoid arthritis? J Hum Genet. 2021;66(2):219–223. doi:10.1038/s10038-020-00837-2
25. Vandewalle J, Libert C. Sepsis: a failing starvation response. Trends Endocrinol Metab. 2022;33(4):292–304. doi:10.1016/j.tem.2022.01.006
26. Rajbhandary R, Khezri A, Panush RS. Rheumatoid cachexia: what is it and why is it important? J Rheumatol. 2011;38(3):406–408. doi:10.3899/jrheum.101036
27. Weyand CM, Goronzy JJ. Immunometabolism in the development of rheumatoid arthritis. Immunol Rev. 2020;294(1):177–187. doi:10.1111/imr.12838
28. Franco-Trepat E, Alonso-Pérez A, Guillán-Fresco M, et al. Visfatin as a therapeutic target for rheumatoid arthritis. Expert Opin Ther Targets. 2019;23(7):607–618. doi:10.1080/14728222.2019.1617274
29. Rasha F, Mims BM, Castro-Piedras I, et al. The versatility of Sirtuin-1 in endocrinology and immunology. Front Cell Dev Biol. 2020;8:589016. doi:10.3389/fcell.2020.589016
30. Wang QH, Li Y, Dou DY, et al. Nicotinamide mononucleotide-elicited NAMPT signaling activation aggravated adjuvant-induced arthritis in rats by affecting peripheral immune cells differentiation. Int Immunopharmacol. 2021;98:107856. doi:10.1016/j.intimp.2021.107856
31. Perez-Sanchez C, Escudero-Contreras A, Cerdó T, et al. Preclinical characterization of pharmacologic NAD+ boosting as a promising therapeutic approach in rheumatoid arthritis. Arthritis Rheumatol. 2023. doi:10.1002/art.42528
32. Wang DD, He CY, Wu YJ, et al. AMPK/SIRT1 deficiency drives adjuvant-induced arthritis in rats by promoting glycolysis-mediated monocytes inflammatory polarization. J Inflamm Res. 2022;15:4663–4675. doi:10.2147/JIR.S378090
33. Jiang TT, Ji CL, Yu LJ, et al. Resveratrol-induced SIRT1 activation inhibits glycolysis-fueled angiogenesis under rheumatoid arthritis conditions independent of HIF-1α. Inflamm Res. 2023;72(5):1021–1035. doi:10.1007/s00011-023-01728-w
34. Niederer F, Ospelt C, Brentano F, et al. SIRT1 overexpression in the rheumatoid arthritis synovium contributes to proinflammatory cytokine production and apoptosis resistance. Ann Rheum Dis. 2011;70(10):1866–1873. doi:10.1136/ard.2010.148957
35. Yoon MJ, Yoshida M, Johnson S, et al. SIRT1-mediated eNAMPT secretion from adipose tissue regulates hypothalamic NAD+ and function in mice. Cell Metab. 2015;21(5):706–717. doi:10.1016/j.cmet.2015.04.002
36. Zhou Y, Deng HW, Shen H. Circulating monocytes: an appropriate model for bone-related study. Osteoporos Int. 2015;26(11):2561–2572. doi:10.1007/s00198-015-3250-7
37. Park SY, Lee SW, Kim HY, et al. SIRT1 inhibits differentiation of monocytes to macrophages: amelioration of synovial inflammation in rheumatoid arthritis. J Mol Med. 2016;94(8):921–931. doi:10.1007/s00109-016-1402-7
 © 2023 The Author(s). This work is published and licensed by Dove Medical Press Limited. The
full terms of this license are available at https://www.dovepress.com/terms
and incorporate the Creative Commons Attribution
- Non Commercial (unported, 3.0) License.
By accessing the work you hereby accept the Terms. Non-commercial uses of the work are permitted
without any further permission from Dove Medical Press Limited, provided the work is properly
attributed. For permission for commercial use of this work, please see paragraphs 4.2 and 5 of our Terms.
© 2023 The Author(s). This work is published and licensed by Dove Medical Press Limited. The
full terms of this license are available at https://www.dovepress.com/terms
and incorporate the Creative Commons Attribution
- Non Commercial (unported, 3.0) License.
By accessing the work you hereby accept the Terms. Non-commercial uses of the work are permitted
without any further permission from Dove Medical Press Limited, provided the work is properly
attributed. For permission for commercial use of this work, please see paragraphs 4.2 and 5 of our Terms.
Recommended articles
The Importance of Clinical Pharmacists in Improving Blood Glucose and Lipid Levels in Patients with Diabetes and Myocardial Infarction
Shi FH, Yu BB, Shen L, Xu L, Jiang YH, Gu ZC, Lin HW, Li H
Diabetes, Metabolic Syndrome and Obesity 2023, 16:2733-2744
Published Date: 8 September 2023