Back to Journals » Cancer Management and Research » Volume 15
Mutational and Transcriptional Characterization Establishes Prognostic Models for Resectable Lung Squamous Cell Carcinoma
Authors Liu Y, Duan J, Zhang F, Liu F, Luo X, Shi Y, Lei Y
Received 8 August 2022
Accepted for publication 5 January 2023
Published 17 February 2023 Volume 2023:15 Pages 147—163
DOI https://doi.org/10.2147/CMAR.S384918
Checked for plagiarism Yes
Review by Single anonymous peer review
Peer reviewer comments 2
Editor who approved publication: Dr Matthew Witek
Yinqiang Liu,* Jin Duan,* Fujun Zhang,* Fanghao Liu, Xiaoyu Luo, Yunfei Shi, Youming Lei
Department of Thoracic Surgery, The First Affiliated Hospital of Kunming Medical University, Kunming, People’s Republic of China
*These authors contributed equally to this work
Correspondence: Youming Lei; Yunfei Shi, Department of Thoracic Surgery, The First Affiliated Hospital of Kunming Medical University, No. 295, Xichang Road, Kunming, 650031, People’s Republic of China, Email [email protected]; [email protected]
Background: The prognosis of non-small cell lung cancer (NSCLC) patients has been comprehensively studied. However, the prognosis of resectable (stage I–IIIA) lung squamous cell carcinoma (LUSC) has not been thoroughly investigated at genomic and transcriptional levels.
Methods: Data of genomic alterations and transcriptional-level changes of 355 stage I–IIIA LUSC patients were downloaded from The Cancer Genome Atlas (TCGA) database, together with the clinicopathological information (training cohort). A validation cohort of 91 patients was retrospectively recruited. Data were analyzed and figures were plotted using the R software.
Results: Training cohort was established with 355 patients. TP53 (78%), TTN (68%), CSMD3 (39%), MUT16 (36%) and RYR2 (36%) were genes with the highest mutational frequency. BRINP3, COL11A1, GRIN2B, MUC5B, NLRP3 and TENM3 exhibited significant higher mutational frequency in stage III (P < 0.05). Patients with stage III also exhibited significantly higher tumor mutational burden (TMB) than those with stage I (P < 0.01). The mutational status of 10 genes were found to have significant stratification on patient prognosis. TMB at threshold of 25 percentile (TMB = 2.39 muts/Mb) also significantly stratified the patient prognosis (P = 0.0003). Univariate and multivariate analyses revealed TTN, ADGRB3, MYH7 and MYH15 mutational status and TMB as independent risk factors. Further analysis of transcriptional profile revealed many significantly up- and down-regulated genes, and multivariate analysis found the transcriptional levels of seven genes as independent risk factors. Significant factors from the multivariate analyses were used to establish a Nomogram model to quantify the risk in prognosis of individual LUSC patients. The model was validated with a cohort containing 91 patients, which showed good predicting efficacy and consistency.
Conclusion: The influencing factors of prognosis of stage I–III LUSC patients have been revealed. Risk factors including gender, T stage, cancer location, and the mutational and transcriptional status of several genes were used to establish a Nomogram model to assess the patient prognosis. Subsequent validation proved its effectiveness.
Keywords: lung cancer, squamous cell carcinoma, prognosis, mutation, transcription, resectable
Introduction
Lung squamous cell carcinoma (LUSC) is the second largest type of non-small cell lung cancer (NSCLC) following lung adenocarcinoma (LUAD), accounting for approximately 30–40% of lung cancers.1,2 The origin of LUSC and LUAD is different, in which LUSC originates from basal cells, while LUAD originates from alveolar epithelial cells. The biological and molecular characteristics between LUSC and LUAD also vary greatly, including the growth rate and mode, behavior of invasion and metastasis.3 LUSC is similar to small cell lung cancer (SCLC) in that both are closely related to smoking.4 Therefore, middle-aged and elderly men are more likely to develop LUSC, especially those who have a long history of smoking.3 The association between smoking exposure and LUAD is not as significant as that of LUSC, and the proportion of women is relatively higher in LUAD.3 TTF-1, NapsinA, CK5/6 and p63 (p40) are the most commonly used biomarker combination to differentiate between LUAD and LUSC.5 In terms of mutational landscape, recurrent genetic alterations in LUSC were reported to be more similar to other squamous carcinomas than to LUAD.3 The most significant difference is that EGFR is the predominantly mutated gene in LUAD, but is less than 5% in Western LUSC patients (3–20% in Chinese).6 However, TKI-based therapy and immunotherapy can be used for late-stage LUSC patients if the presence of the corresponding biomarkers is confirmed.
The mutational landscape of the LUSC has been investigated since the wide use of the next-generation sequencing (NGS) technology in cancer research and diagnosis. Several high-frequency mutated genes have been identified, including TP53, PIK3CA, CDKN2A, SOX2 and CCND1, etc., in which PIK3CA mutation and amplification, ERBB mutation and FGFR1 amplification have been found to be definite actionable for LUSC therapy.7–10 The transcriptional alterations of LUSC have also been studied, and many differentially expressed genes have been identified, which provided more insight into the transcriptomic and functional features of LUSC.11,12 A series of clinicopathological, mutational and transcriptional factors have been indicated to influence the prognosis of LUSC, including sex, age, cancer stage, pathological subtypes, mutational signature and tumor mutational burden.13–16
Many studies have so far focused on the molecular alterations, therapeutic strategies and prognosis of stage IIIB-IV NSCLC as these patients have no surgical opportunity but can benefit from systematic targeted therapy or immunotherapy, while stage I–IIIA NSCLC is regarded as resectable and can be potentially cured by surgery.17 The prognosis of stage I–IIIA NSCLC has been less studied than stage IIIB-IV patients because these patients generally have much longer survival and the follow-up time could be very long before the study endpoint can be reached. The prognosis of stage I–IIIA LUSC has not been thoroughly studied as it represents a small proportional of NSCLC patients. In this study, we investigated the mutational and transcriptional profiles of LUSC by downloading and analyzing the corresponding data of genomic and transcriptional alterations from TCGA database. In combination with clinicopathological factors, we established a model for predicting the prognosis of individual LUSC patients with resectable tumors. Validation of the model was performed to make it clinical available for patient assessment.
Methods and Materials
Ethics Approval
This study was approved by the research committee of the First Affiliated Hospital of Kunming Medical University. All experiments methods and procedures and personnel training were carried out in accordance with relevant guidelines and regulations of the First Affiliated Hospital of Kunming Medical University. Informed consent was waived as this study collected and examined retrospective samples.
Study Design, Patients and Samples
The whole-exome somatic mutation data, mRNA transcription data, along with demographic and clinical information of 355 LUSC patients were downloaded from The Cancer Genome Atlas (TCGA) database (https://portal.gdc.cancer.gov/). The year of LUSC diagnosis for these patients ranged from 1992 to 2013. These 355 samples were used in training cohort to establish the mutational and transcriptional profile and the prognosis prediction model. Ninety-one (91) samples were recruited retrospectively from the sample bank of our hospital and were used as the validation cohort. The sample bank for patients in the hospital was established in 1990 and has been collecting samples since then. The year of LUSC diagnosis for these patients ranged from 2003 to 2017, and therefore all patients of the validation cohort had a follow-up time ranged from 5 to 19 years. Whole-exome sequencing and RNA-seq were performed for all samples in the validation cohort. Mutation analysis, expression analysis and prognostic analysis were performed with data from both training and validation cohorts. Patient demographic, clinical, mutational and transcriptional information for both training and validation cohorts is summarized in Table 1.
 |
Table 1 Demographic and Clinicopathological Factors of Subjects in This Study |
Whole-Exome Sequencing and RNA-Seq
Formalin-fixed and paraffin-embedded (FFPE) samples of lung squamous cell cancer tissues and matched adjacent normal tissues were collected from 91 patients. The whole-exome sequencing procedures and data processing procedures were carried out as previously described.18,19 RNA from FFPE cancer tissues and adjacent normal tissues of the 91 patients was extracted using TruSeq Targeted RNA Expression Library Prep Kit (Illumina China, Shanghai 200233, China). The subsequent procedures of RNA-seq and data processing were carried out as previously described.20,21
Data Analysis and Model Establishment
In analyses relating to the mutational status, all patients were divided into mutation group (Mut) and wide-type group (WT). Data files of the TCGA in Mutation Annotation Format (MAF) format were obtained using the “TCGAbiolinks” package of R software (https://www.rstudio.com/). Mutation profile and tumor mutational burden (TMB) were analyzed using the “maftools” package of R software. The “maftools” package of the R software was used for establishing and plotting the mutational landscape and characteristics. The read counts of the transcription data were obtained by HTSeq-count software from the TCGA database, and the differential transcription was analyzed by the “edgeR” package of the R software. Patients were also divided into high and low transcription groups based on median or appropriate percentile in transcriptional-level analysis. Kruskal–Wallis test was performed by R software to compare the differences among groups with different mutational status or transcriptional levels. Heatmap, volcano plot and the results for GO, KEGG and Reactome enrichment analyses were plotted using the “pheatmap”, “ggplot2” and “clusterProfiler” packages of the R software, respectively. The “GLmnet” LASSO (Least Absolute Shrinkage and Selection Operator) regression algorithm of the R software was used for variable selection in the analysis of differentially transcripted genes revealed by RNA-seq. Univariate and multivariate analyses were performed to identify potential risk factors of patient prognosis regarding clinicopathological features, mutational status or mRNA levels. Kaplan–Meier analysis and Log rank test were performed by R software to investigate the potential stratification of mutational status or transcription levels on patient overall survival. The “survival” and “survminer” package of the R software were used for plotting survival curves. The Nomogram model was established and plotted with the “rms” package of the R software. In the prognostic analysis, univariate analysis was performed first on expression data, mutation data and clinicopathological features, and significant factors identified in univariate analysis were then included in subsequent multivariate analysis to construct prognostic models and Nomograph. The Nomogram model was finally validated by the validation cohort. To assess the efficacy of the model, prognostic factors and their coefficients were weighted and the prognostic index (PI) was calculated as previously reported.22 Patients were divided into two groups by PI at 60th percentile. The survival analysis was performed for different groups using Kaplan–Meier method, and the prediction of prognosis was calibrated by the Greenwood-Nam-d Agostino χ2 test.23,24 Chi-square test or non-parametric test was performed to compare the difference between groups of patients. P values were corrected by Benjamini & Hochberg (BH) method. *P < 0.05; **P < 0.01; ***P < 0.001.
Results
The Mutational Profile of Lung SCC and Its Indication for Patient Prognosis
The mutational profile of LUSC has been characterized first. Figure 1A shows the mutational landscape of 355 LUSC patients, in which the mutational status of the top 20 mutated genes is illustrated. It can be seen that TP53 (78%), TTN (68%), CSMD3 (39%), MUC16 (36%) and RYR2 (36%) were the genes with the highest mutational frequency. Analysis of mutational characteristics in Figure 1B shows that single nucleotide variation (SNV) was the predominant mutation type, in which the number of missense mutations far overweight nonsense mutations. TTN ranked the top in the number of mutations, followed by TP53, MUC16, CSMD3 and RYR2. Large amount of co-mutations and mutually exclusive mutations were revealed by mutation event analysis in Figure 1C. For example, TP53 mutations were mutually exclusive from ERICH3 mutations, and TTN was co-mutated with PAPPA2, SYNE1 and MUC16.
 |
Figure 1 The mutational profile of LUSC. (A) The mutational landscape of all patients in this study. The mutational status of top 20 mutated genes is shown as indicated. Mutational types are presented by different colors. (B) Mutational characteristics of LUSC. The distribution of mutation types, base changes, the number of mutations, and the rank of mutated genes are shown as indicated. (C) Landscape of co-mutations and the mutually exclusive mutations in LUSC, which is labeled by colors. P values indicates the significance of correlation. (D–F) The results for GO (D), KEGG (E) and Reactome (F) enrichment analyses are shown as indicated. |
Subsequent GO (gene ontology) (Figure 1D), KEGG (Kyoto Encyclopedia of Genes and Genomes) (Figure 1E) and Reactome enrichment (Figure 1F) analyses revealed a series of cellular functions and pathways that may be altered by the mutations. GO enrichment showed that ion channel activity and ion transportation, neuronal function and cell membrane structure were mainly affected. KEGG and Reactome enrichment showed that pathways related to herpes simplex virus 1 (HSV1) infection, neuronal function (including olfactory transduction and signaling pathway, neuroactive ligand-receptor interaction and neuronal system), PI3K-AKT signaling pathway, RTK signaling were mainly involved.
We further investigated the stage-related mutational frequency for top mutated genes (Figure 2A and B) and stage-related TMB (Figure 2C). It shows that the top mutated genes, including TP53, TTN, CSMD3, MUT16, RYR2 and LRP1B, did not exhibit significant difference in mutational frequency among stages I, II and III. In contrast, among the top 200 mutated genes, six genes exhibited significant difference in mutational frequency among stages, including BRINP3, COL11A1, GRIN2B, MUC5B, NLRP3 and TENM3 (Figure 2B). Interestingly, significantly higher mutational frequency was observed in stage III than stage I and/or stage II (P < 0.05), suggesting a stage-dependent mutational frequency. Further investigation on stage-related TMB revealed that TMB was not significantly different across T1 to T4, while the TMB of patients with multiple lymph node metastases (N2) exhibited significantly higher TMB than those without lymph node metastasis (N0) (P < 0.05) (Figure 2C). Consequently, patients with clinical stage III exhibited significantly higher TMB than patients with stage I (P < 0.01) (Figure 2C). This observation indicated that the difference in TMB between the clinical stages may result from the difference between N stages.
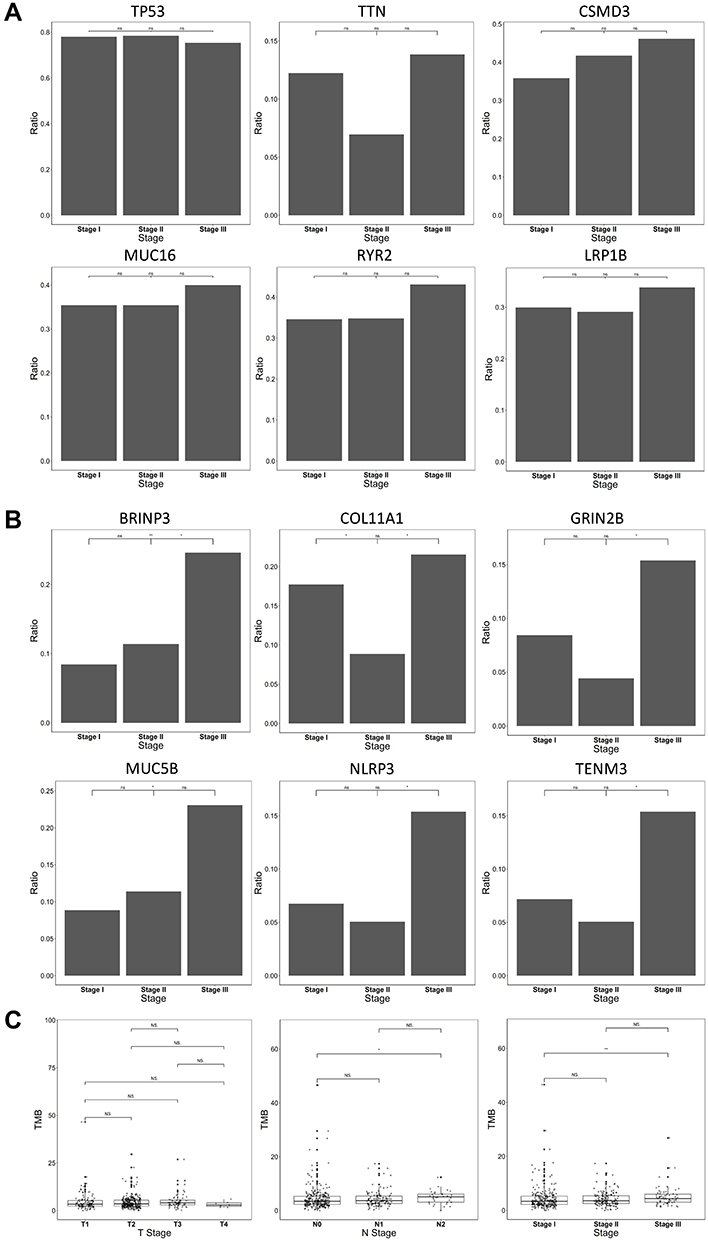 |
Figure 2 Stage-related mutational status and TMB for LUSC. (A) Comparison of mutations frequency across stage I–III for the top six mutated genes. No significant difference was observed among stage I–III for the genes. (B) Significant differences across stage I–III were found for six genes, as indicated in the figure. Stage III generally exhibited higher mutational frequency than Stage I and/or Stage II. (C) Comparison of TMB across T stages, N stages and clinical stages. No significant difference was found across T stages, while the N2 status exhibited significantly higher TMB than the N0 status (P < 0.05), potentially leading to significant higher TMB in clinical stage III than stage I (P < 0.01). *P < 0.05; **P < 0.01. Abbreviation: NS, not significant. |
The potential stratification of prognosis by mutational status and TMB was then investigated. Among the top 200 mutated genes, 10 genes were found to have significant stratification on patient prognosis (Figure 3A). Patients with mutations exhibited significantly better overall survival rate than those with wild type counterparts in TTN, ERBB4, ADGRB3, COL6A3, COL11A1, DCDC1, HYDIN and NLRP13, while patients with WT genes exhibited significantly better overall survival rate than those with mutations in MYH7 and MYH15. The potential stratification by TMB was also investigated (Figure 3B). The distribution of TMB in Stage I, II and III LUSC was plotted first. It appeared that a small proportion of patients exhibited a TMB≥10muts/M, which was previously defined as high TMB group.25 However, stratification by TMB threshold at 10muts/Mb did not stratify patient prognosis (P = 0.529). Similarly, stratification by median TMB (50 percentile, TMB = 3.6 muts/Mb, P = 0.073) could not stratify the patients prognosis. In contrast, threshold at 25% percentile (TMB = 2.39 muts/Mb) significantly stratified the prognosis of all patients (P = 0.0003). This stratification was more prominent in stage I (P = 0.002) than stage II (P = 0.063) and stage III (P = 0.119), in which patients in the high TMB group all exhibited a trend of better survival than those in the low TMB group. These observations suggested that TMB itself can stratify the prognosis of stage I–IIIA LUSC patients.
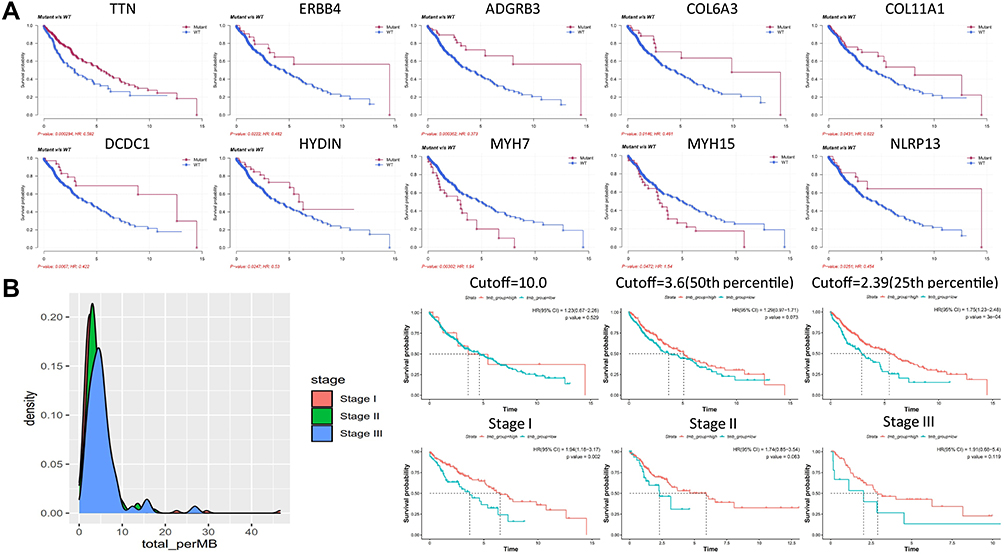 |
Figure 3 Stratification of LUSC patient prognosis by mutational status and TMB. (A) The Kaplan-Meier analysis of patient survival based on mutational status. Survival curves of ten genes with significant stratification are shown as indicated, and P values are labeled. (B) The distribution of TMB in Stage I–III LUSC and stratification of patient prognosis by TMB. No significant difference in overall survival rate between high and low TMB groups when cutoff at 10 muts/Mb or 3.6 muts/Mb (50th percentile) was used. In contrast, significant difference in overall survival rate was observed when cutoff=2.39 muts/Mb (25th percentile) was used (P = 0.0003). The Kaplan–Meier curves of stage I, II and III patients at cutoff=2.39 muts/Mb are shown as indicated. Generally speaking, patients in high TMB group exhibited better survival rate than those in the low TMB group. |
The Transcriptional Profile of LUSC
The transcriptional profile of LUSC was also studied. Using the transcriptional level of the adjacent normal tissue as the control, differential transcription of LUSC tissue was revealed and visualized by heatmap. Figure 4A shows the heatmap of the top 100 differentially transcripted genes. Huge difference in transcription in these genes can be observed between the adjacent normal tissue and the LUSC tissue. The full profile of the whole transcriptional alterations is shown by volcano plot in Figure 4B. Large amount of significantly up-regulated genes (red dots) and down-regulated genes (green dots) can be observed, when |LogFC|=2 and –log10(adj.P.Val)=2 were used as the threshold for statistical significance. Some of the most prominent genes were shown, including up-regulated KRT6A, DSG3, CALML3, SERPINB5 and SERPINB13, and down-regulated CD300LG, SLC6A4, GPM6A, GKN2 and CLDN18. Enrichment analyses were performed to show the corresponding altered cellular functions and pathways (Figure 4C–E). Go enrichment showed that ion channel and transmembrane transporter activity, neutrophil function and membrane function were mainly involved. KEGG and Reactome enrichment showed that membrane protein function (including G-protein coupled receptor (GPCR) ligand binding, neuroactive ligand-receptor interaction, cytokine-cytokine receptor interaction), neutrophil degranulation, PI3K-AKT signaling and Rho GTPase signaling were mainly involved.
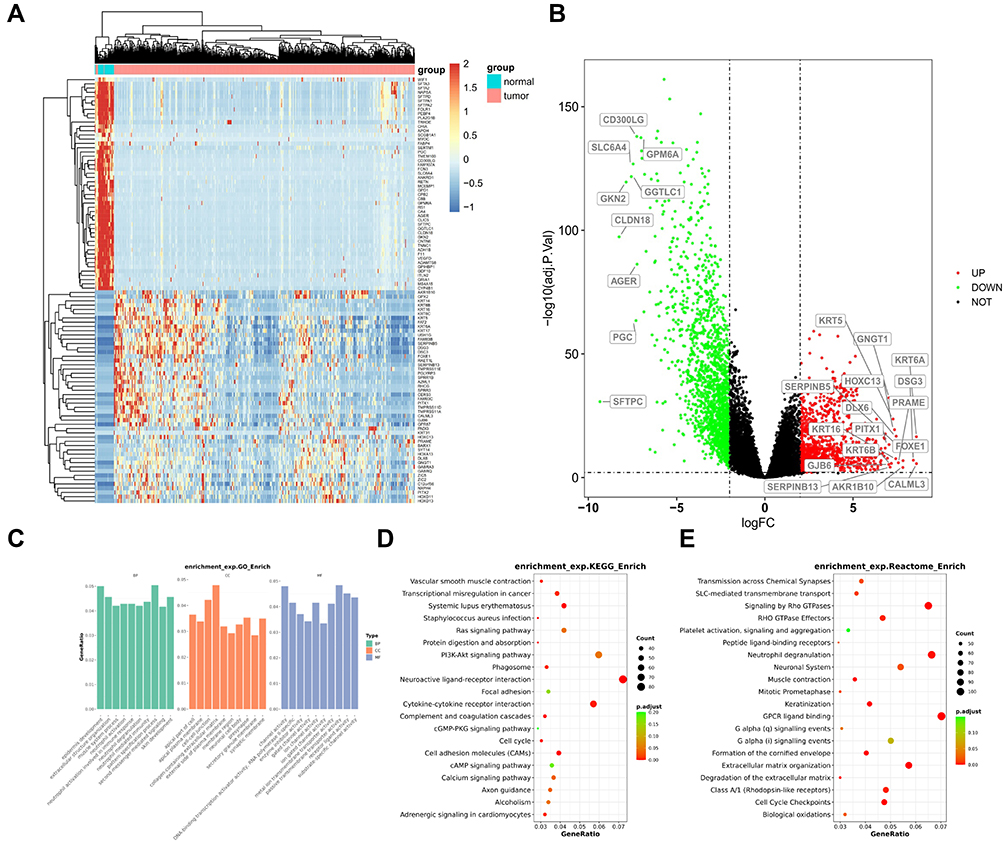 |
Figure 4 The transcriptional profile and significantly altered function and pathways in LUSC. (A) Heatmap illustrates the top 100 genes with significantly altered transcription in LUSC compared with normal tissues. (B) Volcano plot illustrate the panorama of significantly up-regulated or down-regulated genes. The names of genes with the most significant changes are labeled. (C–E) The results for GO (C), KEGG (D) and Reactome (E) enrichment analyses are shown as indicated. |
Prediction of LUSC Patient Prognosis by Prognostic Models
In order to assess the influence of clinicopathological, mutational and transcriptional factors on patient prognosis, and to establish a model to predict the patient prognosis, we performed univariate and multivariate analyses from the above three aspects. Table 2 shows the results of univariate and multivariate analyses on clinicopathological factors. It can be seen that stage T3 (P = 0.01) and clinical stage III (P = 0.03) were significant factors in univariate analysis while TMB was the only significant factor in multivariate analysis (P = 0.00), although T3 was close to significant (P = 0.07). Subsequent univariate and multivariate analyses on mutational status in Table 3 show ten genes with significant results in univariate analysis, while only TTN (P = 0.004), ADGRB3 (P = 0.010), MYH7 (P = 0.003) and MYH15 (P = 0.034) showed significant results in multivariate analysis, suggesting these four genes as independent risk factors. Univariate analysis on transcriptional factors in Supplementary Table 1 revealed 22 significant genes, while multivariate analysis revealed seven significant genes as independent risk factors (Table 4).
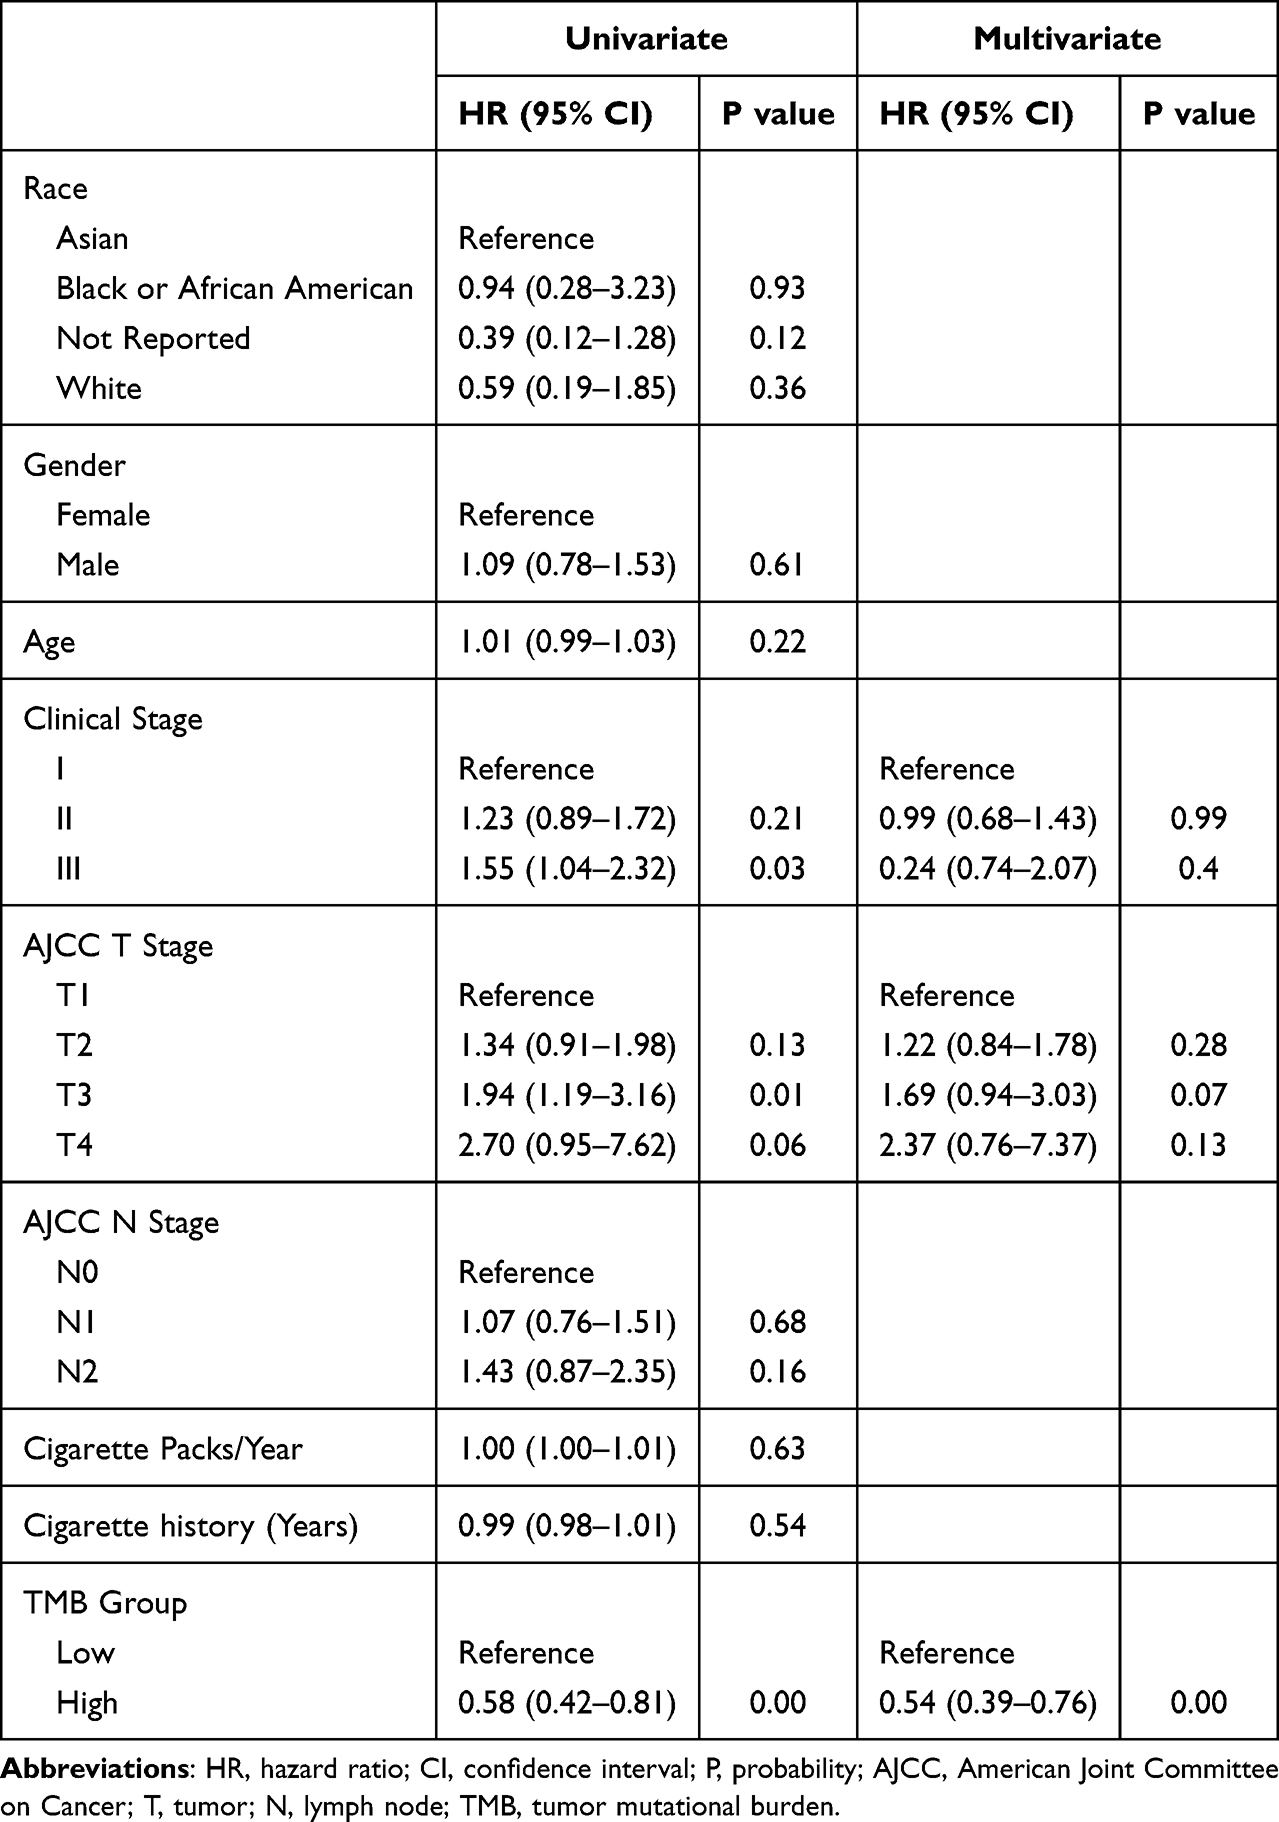 |
Table 2 Univariate and Multivariate Analyses of Prognosis Based on Stratification of Clinicopathological Factors |
 |
Table 3 Univariate and Multivariate Anlayses of Prognosis Based on Mutational Status |
 |
Table 4 Univariate and Multivariate Analyses of Prognosis Based on Significant Clinicopathological, Mutational and Transcriptional Factors |
Univariate and multivariate analyses with all significant clinicopathological, mutational and transcriptional factors were performed and the results are shown in Table 4. It can be seen that male, stage T3, location of middle lobe, mutations of DCDC1, ADGRB3, TTN, and transcriptional status of MEPE, CYP3A4, KLK6, SLC17A8, GRAPL, TGM2, and HPR were independent risk factors. Significant factors from the above multivariate analyses (Table 4) were used to establish a Nomogram model (Figure 5). The risk for individual patient can be predicted by the Nomogram model based on the quantitative grading of each factor in the model.
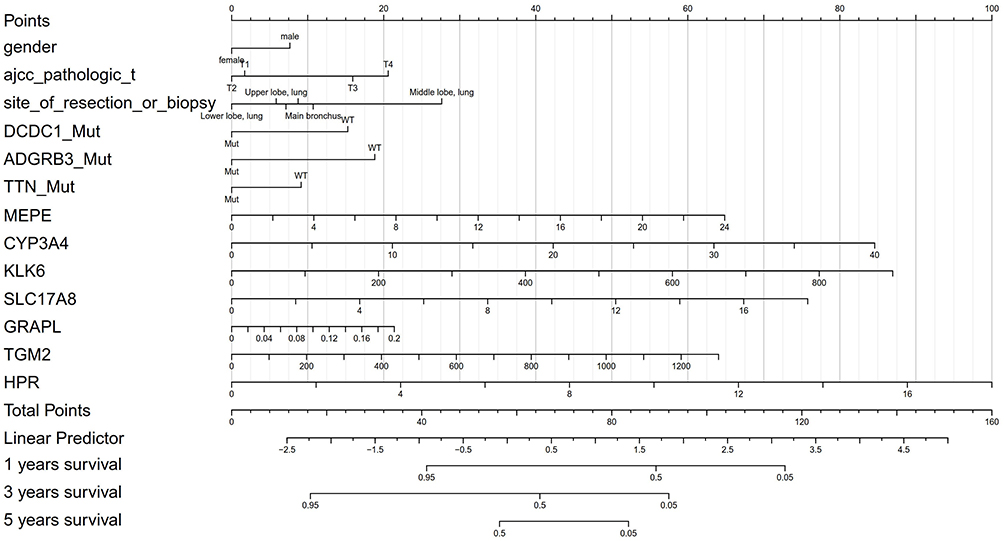 |
Figure 5 Nomogram model for predicting the prognosis of LUSC patients. Model was established based on the results of multivariate analyses of clinicopathological, mutational and transcriptional prognostic factors. |
In order to assess the validity of the Nomogram model in predicting patient prognosis, we established a validation cohort of 91 patients with matched clinicopathological factors to the training cohort (Table 1). No significant difference has been found in the clinicopathological factors between the training and validation cohorts, except that the population for training cohort was mainly White and the population for validation cohort was all Asian (Chinese). Whole-exome sequencing and RNA-seq were performed with the 91 patients, and corresponding analyses have been performed as described in the method section. Figure 6 shows the validation results and a comparison with those from the training cohort. It can be seen from Figure 6A that the validation cohort exhibited no significant difference to the training cohort in prognostic index, suggesting similar predicting capability on patient prognosis. This was also reflected in Figure 6B in that the validation cohort exhibited similar significant stratification to training cohort on patient survival based on a threshold at 60% prognostic index. Furthermore, model-predicted probability of disease-free survival (DFS) and the actual DFS showed good linear correlation at 1-year, 3-year and 5-year time points in both training and validation cohorts, suggesting good predicting efficacy and consistency (Figure 6C).
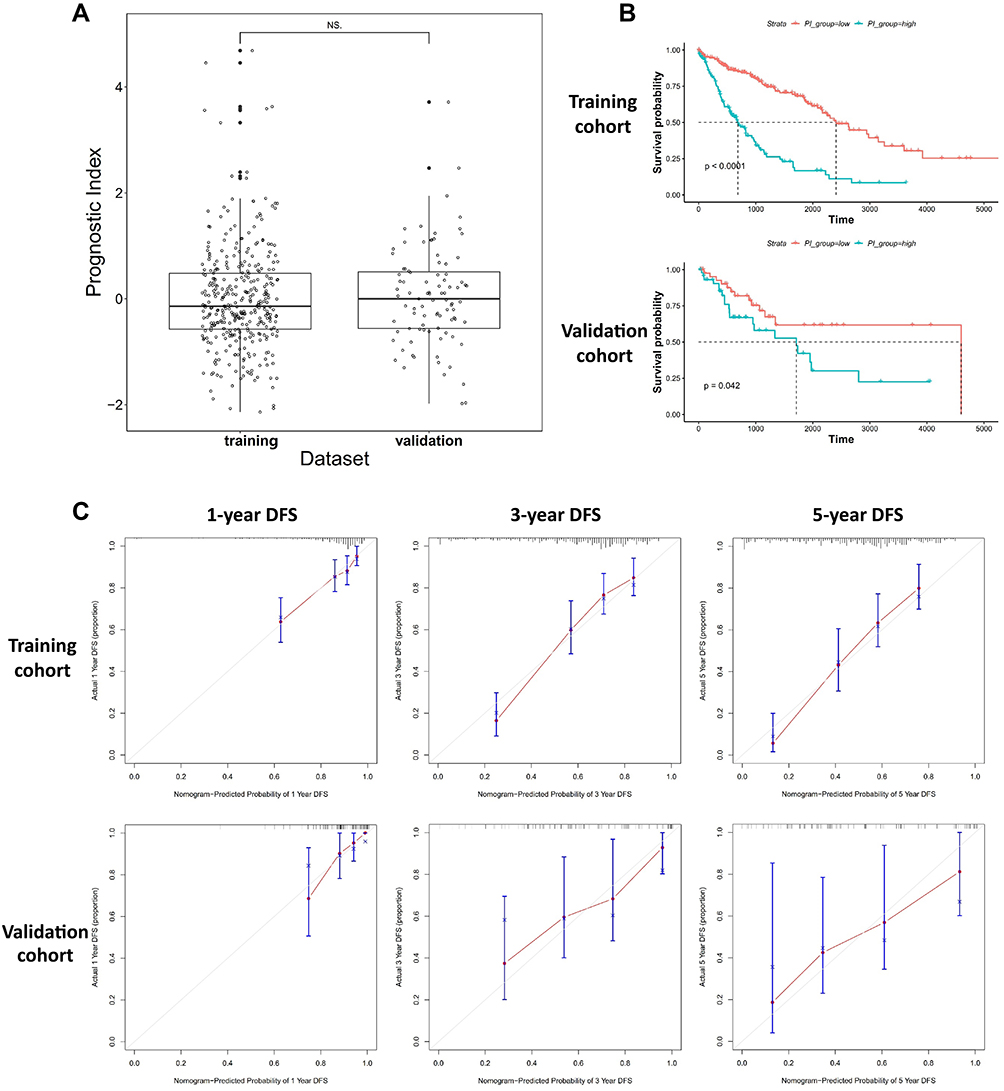 |
Figure 6 Validation of the Nomogram model established in this study. (A) Comparison of the prognostic index from samples of the training and validation cohort, and no significant difference was found. (B) The Kaplan-Meier analyses of patients stratified by low and high prognostic index showed similar trend of stratification in training and validation cohorts. (C) The correlation between model-predicted probability of DFS and the actual DFS at 1-year, 3-year and 5-year time points. Good correlation was observed between the training and validation cohort. |
Discussion
Previous studies showed that LUAD and LUSC were largely distinct from each other in somatic mutational landscape and transcriptional profile.3,26 However, similarity was observed between LUSC and a series of squamous carcinomas in head, neck and bladder.26 These observations suggested that histological contexts may be more influential than organ contexts in modeling somatic and transcriptional alterations. Cancers arising from similar cell types (here it refers to squamous cell) across different tissues may be more similar than those arising from different cells of the same tissue.3 Indeed, the difference in somatic mutational landscape between LUAD and LUSC influenced the systematic therapeutic strategies for stage IIIB-IV patients who do not have surgical opportunities. It appeared that patients with LUAD may have more choice than those with LUSC in terms of TKI-based therapy, as alterations of TKI-related genes, such as EGFR, ALK and ROS1 are more often observed in LUAD than LUSC.27 However, for stage I–IIIA patients who can be potentially cured by surgery, the therapeutic strategies are largely similar between LUAD and LUSC. In this study, we focused on the stage I–IIIA LUSC patients and investigated the prognostic factors at genomic, transcriptional and clinicopathological levels.
We found some similarities and differences in enrichment analyses between the mutational and transcriptional profile. The main similarities included the ion channel and transmembrane transporter activity and PI3K-AKT pathway, while the main differences included the neuronal function in mutational analysis and the neutrophil regulation in transcriptional analysis. The differences may be caused by the differential and inconsistent mutational and transcriptional alterations. Mutational alterations may not necessarily lead to transcriptional changes, and transcriptional changes may not necessarily be caused by mutational alterations.28 For example, large amount of mutations can be found in some large proteins, such as ion channels. These mutations at non-crucial sites may not cause substantial change of ion channel function or expression, however, functions related to ion channels may be enriched in mutation enrichment analysis. On the other hand, epigenetic changes and regulations by various small and large molecules may influence the transcriptional and expressional levels of many proteins. These changes may not be caused by corresponding gene mutations.29 Therefore, alterations of transcription may not directly reflect the mutational changes for certain genes, and vice versa.
Stage-related mutational frequency has been reported in LUAD.27,28 Distinct mutational frequency across stage I–III has been observed in top mutated genes and main driver genes, including EGFR, TP53 and KRAS.30,31 In contrast, we found no substantial difference in mutational frequency across stage I–III in top mutated genes of LUSC, suggesting a differential stage-related mutational profile between the two types of NSCLC. Furthermore, the six genes that showed significant stage-related differences in mutational frequency were not among the top 20 mutated genes. This observation in individual genes was supported by the fact that TMB showed no difference across T1-T4, which, again, confirmed our observations in LUSC. Taken together, these observations strongly suggested that different to LUAD, the mutational frequency of individual genes and the mutational burden in LUSC were largely stable across different stages. However, patients with stage N2 appeared to have higher TMB than those without sign of lymph node metastasis, suggesting that more advanced LUSC, especially under the circumstances of potential active clonal expansion and metastasis, may exhibit higher mutational frequency.
The stratification of patient prognosis by mutational status was observed in several genes in LUSC. Interestingly, patients with mutations exhibited better survival than those with the wild type counterpart in 8 out of 10 genes, especially for some highly mutated genes, such as TTN. It was more interesting to find that LUSC patients with higher TMB exhibited better survival that those with lower TMB. Although TMB has been reported as a marker for stratification in resectable LUAD, the stratification of TMB in LUSC has seldom been studied.32,33 These observations suggested that LUSC patients with higher burden of mutations, such as those exhibiting key individual gene mutations and those with higher TMB, had a higher chance of better overall survival than those with lower burden of mutations, such as those with wild type genes and lower TMB. Furthermore, TMB and four genes were found to be independent risk factors in the multivariate analysis. Since these patients received radical surgery as the main therapy, these observations suggested that mutational burden or mutational status itself was predictive for LUSC patient prognosis. This was also observed in previous studies in LUAD, in which TMB and a series of driver genes were found to be independent risk factors for patient survival.34–36 The reason for the correlation between higher TMB and better survival was not completely clear, while current evidence suggested that higher TMB may reflect better immunogenicity, which could mediate the shaping of tumor-host immune interactions.37 High TMB has been suggested to be correlated with both high neo-epitope burden38 and intense TIL infiltration,39 which have been associated with favorable survival outcomes in resectable lung cancer.40 This may also be true for late-stage lung cancer patients who receive chemotherapy, targeted therapy or immunotherapy.19,41,42 Furthermore, some clues on heterogeneous changes in cancer may also provide potential explanations. It was observed that patients with high mutational burden generally exhibited low copy number changes, while patients with low mutational burden may have high copy number changes.35 Some cancers exhibit low mutational burden but high copy number variation (CNV) and some cancers are contrary,35,43 and those with high CNV changes generally exhibited worse prognosis.44 Metastatic cancers generally exhibit higher CNV changes than those at earlier stages.44–46 It appeared that high CNV changes may be an indicator for worse prognosis, and patients with high CNV changes generally have lower mutational burden. In contrast, patients with higher mutational burden (lower CNV changes) may have better survival. There may be a seesaw effect between CNV and mutational burden, which may be relevant to the survival of patients.
Here in this study, we found several genes with stratification on prognosis as independent risk factors. Since many factors may affect the transcriptional level across different individuals and studies, our observations suggested that the transcriptional alterations may also be significant factors and relevant to patient prognosis, similar to the mutational status. This was reflected in the Nomogram model, which was established by clinicopathological, mutational and transcriptional factors. This means that the prognosis of individual patient can be quantified by determining these factors, provided the tissue sample is available for sequencing. This opened a door for early prognosis prediction for LUSC patients before any therapy, which may be helpful for establishing personalized therapeutic strategies at early stages of intervention. This may also be important at the era of targeted drug-based or immunotherapy-based neoadjuvant or adjuvant therapy, which may further improve the patient survival in combination with radical surgery.47,48 Comprehensive tests on mutational and transcriptional status can provide more and better options for the therapy of LUSC.
It is important to consider the clinical scenario for the application of the model in practice. It is a routine that both early- and late-stage NSCLC patients receive genetic test with tumor tissue or blood samples before any therapy. In order to assess the prognosis of patients using the model, transcriptional analysis can be performed in parallel with mutational analysis using cancer tissues. The prediction of prognosis can be achieved by collecting and analyzing the clinicopathological, mutational and transcriptional factors, and the probability of survival of any individual patient can be predicted by calculating the points in the model. The prognostic information for any individual can be used to guide the selection of therapeutic strategy before therapy and the adjustment of therapies when disease relief or progression is revealed.
This study had some limitations. First, the Nomogram model established in this study was validated in a retrospective cohort, which may be influenced by availability of patients, sample quality and bias in clinical information, therefore it should be further validated in a prospective cohort to ensure its validity in the real world. Secondly, the Nomogram model was established from Western population and was validated in the Chinese population. Although the validation appeared to be successful, further study should be performed to investigate the potential differences in mutational, transcriptional features and prognosis between the populations. Thirdly, although most patients received adjuvant therapy after surgery, the therapeutic strategy may vary across different individuals and may potentially influence the patient prognosis. Further detailed information on postsurgical therapy should be collected and patients may be grouped or stratified in future analysis.
In conclusion, the mutational and transcriptional landscape of stage I–III LUSC has been investigated by data mining of the TCGA database in this study. A Nomogram model for patient prognosis has been established with significant clinicopathological, mutational and transcriptional factors. The model was proved to be effective by validation in a retrospective cohort.
Data Sharing Statement
The datasets generated and/or analyzed during the current study are available in the TCGA repository (https://portal.gdc.cancer.gov/). The datasets used and/or analysed during the current study are available from the corresponding author on reasonable request.
Ethics Approval and Consent to Participate
This study was approved by the First Affiliated Hospital of Kunming Medical University and conducted in accordance with the hospital’s guiding principles. Written informed consent to participate was waived for the use of the clinical samples as retrospective samples were used in this study.
Informed Consent and Consent for Publication
Data from this study were partially downloaded from available database or processed dataset. The written informed consent and consent for publication were waived as this study was partially a database study and used retrospective samples.
Author Contributions
All authors made a significant contribution to the work reported, whether that is in the conception, study design, execution, acquisition of data, analysis and interpretation, or in all these areas; took part in drafting, revising or critically reviewing the article; gave final approval of the version to be published; have agreed on the journal to which the article has been submitted; and agree to be accountable for all aspects of the work.
Funding
This study was supported by Yunnan Provincial Health and Family Planning Commission Reserve Talent Project (No.H-2017013), High level health technical personnel in Yunnan Province (Discipline leader, D-2017013), project “Function and clinical application of PDGFRB gene in lung squamous cell carcinoma” (202101AY070001-134) supported by the Science and technology Planning project of Yunnan Science and Technology Department, and 2018 CSCO-Qilu Tumor Project (Y-Q201802-011). This study was also supported by the project “establishment of oligometastatic database and precise molecular typing of senile non-small cell lung cancer” (2017NS020) funded by the Yunnan Provincial Health Commission, and supported by the “subproject of Yunnan gerontology research center special fund” (202102AA310069) funded by the Science and Technology Department of Yunnan Province, and supported by the “Provincial Basic Research Program (Kunming Medical University Joint Special Project)” (202101AY070001-134) funded by the Science and Technology Department of Yunnan Province.
Disclosure
All authors declare no competing interests in this study.
References
1. Siegel RL, Miller KD, Jemal A. Cancer statistics, 2019. CA Cancer J Clin. 2019;69(1):7–34. doi:10.3322/caac.21551
2. Zhang XC, Wang J, Shao GG, et al. Comprehensive genomic and immunological characterization of Chinese non-small cell lung cancer patients. Nat Commun. 2019;10(1):1772. doi:10.1038/s41467-019-09762-1
3. Campbell JD, Alexandrov A, Kim J, et al. Distinct patterns of somatic genome alterations in lung adenocarcinomas and squamous cell carcinomas. Nat Genet. 2016;48(6):607–616. doi:10.1038/ng.3564
4. Wen J, Fu JH, Zhang W, Guo M. Lung carcinoma signaling pathways activated by smoking. Chin J Cancer. 2011;30(8):551–558. doi:10.5732/cjc.011.10059
5. Kriegsmann K, Cremer M, Zgorzelski C, et al. Agreement of CK5/6, p40, and p63 immunoreactivity in non-small cell lung cancer. Pathology. 2019;51(3):240–245. doi:10.1016/j.pathol.2018.11.009
6. Cheung AH, Tong JH, Chung LY, et al. EGFR mutation exists in squamous cell lung carcinoma. Pathology. 2020;52(3):323–328. doi:10.1016/j.pathol.2019.12.003
7. Cancer Genome Atlas Research Network. Comprehensive genomic characterization of squamous cell lung cancers. Nature. 2012;489(7417):519–525. doi:10.1038/nature11404
8. Schwaederle M, Elkin SK, Tomson BN, Carter JL, Kurzrock R. Squamousness: next-generation sequencing reveals shared molecular features across squamous tumor types. Cell Cycle. 2015;14(14):2355–2361. doi:10.1080/15384101.2015.1053669
9. Friedlaender A, Banna G, Malapelle U, Pisapia P, Addeo A. Next generation sequencing and genetic alterations in squamous cell lung carcinoma: where are we today? Front Oncol. 2019;9:166. doi:10.3389/fonc.2019.00166
10. Satpathy S, Krug K, Jean Beltran PM, et al. A proteogenomic portrait of lung squamous cell carcinoma. Cell. 2021;184(16):4348–4371.e40. doi:10.1016/j.cell.2021.07.016
11. Li Y, Gu J, Xu F, Zhu Q, Ge D, Lu C. Transcriptomic and functional network features of lung squamous cell carcinoma through integrative analysis of GEO and TCGA data. Sci Rep. 2018;8(1):15834. PMID: 30367091; PMCID: PMC6203807. doi:10.1038/s41598-018-34160-w
12. Wang C, Tan S, Liu WR, et al. RNA-Seq profiling of circular RNA in human lung adenocarcinoma and squamous cell carcinoma. Mol Cancer. 2019;18(1):134. doi:10.1186/s12943-019-1061-8
13. Radkiewicz C, Dickman PW, Johansson ALV, Wagenius G, Edgren G, Lambe M. Sex and survival in non-small cell lung cancer: a nationwide cohort study. PLoS One. 2019;14(6):e0219206. doi:10.1371/journal.pone.0219206
14. Xu F, Lin H, He P, et al. A TP53-associated gene signature for prediction of prognosis and therapeutic responses in lung squamous cell carcinoma. Oncoimmunology. 2020;9(1):1731943. doi:10.1080/2162402X.2020.1731943c
15. Yan D, Chen Y. Tumor mutation burden (TMB)-associated signature constructed to predict survival of lung squamous cell carcinoma patients. Sci Rep. 2021;11(1):9020. doi:10.1038/s41598-021-88694-7
16. Chen R, Ding Z, Zhu L, Lu S, Yu Y. Correlation of clinicopathologic features and lung squamous cell carcinoma subtypes according to the 2015 WHO classification. Eur J Surg Oncol. 2017;43(12):2308–2314. doi:10.1016/j.ejso.2017.09.011
17. Wright G, Manser RL, Byrnes G, Hart D, Campbell DA. Surgery for non-small cell lung cancer: systematic review and meta-analysis of randomised controlled trials. Thorax. 2006;61(7):597–603. doi:10.1136/thx.2005.051995
18. Zhao Q, Wang F, Chen YX, et al. Comprehensive profiling of 1015 patients’ exomes reveals genomic-clinical associations in colorectal cancer. Nat Commun. 2022;13(1):2342. doi:10.1038/s41467-022-30062-8
19. He Y, Song L, Wang H, et al. Mutational profile evaluates response and survival to first-line chemotherapy in lung cancer. Adv Sci. 2020;8(4):2003263. doi:10.1002/advs.202003263
20. Cheng J, Li Y, Wang X, et al. Response stratification in the first-line combined immunotherapy of hepatocellular carcinoma at genomic, transcriptional and immune repertoire levels. J Hepatocell Carcinoma. 2021;8:1281–1295. doi:10.2147/JHC.S326356
21. Wu B, Yang J, Qin Z, Yang H, Shao J, Shang Y. Prognosis prediction of stage IV colorectal cancer patients by mRNA transcriptional profile. Cancer Med. 2022;11(24):4900–4912. doi:10.1002/cam4.4824
22. Royston P, Altman DG. External validation of a Cox prognostic model: principles and methods. BMC Med Res Methodol. 2013;13:33. doi:10.1186/1471-2288-13-33
23. Demler OV, Paynter NP, Cook NR. Tests of calibration and goodness-of-fit in the survival setting. Stat Med. 2015;34(10):1659–1680. doi:10.1002/sim.6428
24. D’Agostino RB, Byung-Ho N. Evaluation of the performance of survival analysis models: discrimination and calibration measures. Handb Stat. 2004;23:1–25.
25. Carbone DP, Reck M, Paz-Ares L, et al. First-line nivolumab in stage IV or recurrent non-small-cell lung cancer. N Engl J Med. 2017;376(25):2415–2426. doi:10.1056/NEJMoa1613493
26. Hoadley KA, Yau C, Wolf DM, et al. Multiplatform analysis of 12 cancer types reveals molecular classification within and across tissues of origin. Cell. 2014;158(4):929–944. doi:10.1016/j.cell.2014.06.049
27. Molina JR, Yang P, Cassivi SD, Schild SE, Adjei AA. Non-small cell lung cancer: epidemiology, risk factors, treatment, and survivorship. Mayo Clin Proc. 2008;83(5):584–594. doi:10.4065/83.5.584
28. Seo JS, Ju YS, Lee WC, et al. The transcriptional landscape and mutational profile of lung adenocarcinoma. Genome Res. 2012;22(11):2109–2119. doi:10.1101/gr.145144.112
29. Zhang R, Chen C, Dong X, et al. Independent validation of early-stage non-small cell lung cancer prognostic scores incorporating epigenetic and transcriptional biomarkers with gene-gene interactions and main effects. Chest. 2020;158(2):808–819. doi:10.1016/j.chest.2020.01.048
30. Zhao ZR, Lin YB, Ng CSH, et al. Mutation profile of resected EGFR-mutated lung adenocarcinoma by next-generation sequencing. Oncologist. 2019;24(10):1368–1374. doi:10.1634/theoncologist.2018-0567
31. Liao H, Luo X, Liang Y, Wan R, Xu M. Mutational status of main driver genes influences the prognosis of stage I-III lung adenocarcinoma patients underwent radical surgery. Transl Cancer Res. 2021;10(7):3286–3298. doi:10.21037/tcr-21-240
32. Devarakonda S, Rotolo F, Tsao MS, et al. Tumor mutation burden as a biomarker in resected non-small-cell lung cancer. J Clin Oncol. 2018;36(30):2995–3006. doi:10.1200/JCO.2018.78.1963
33. Yang QF, Wu D, Wang J, et al. Development and validation of an individualized immune prognostic model in stage I-III lung squamous cell carcinoma. Sci Rep. 2021;11(1):12727. doi:10.1038/s41598-021-92115-0
34. Yi M, Li A, Zhou L, Chu Q, Luo S, Wu K. Immune signature-based risk stratification and prediction of immune checkpoint inhibitor’s efficacy for lung adenocarcinoma. Cancer Immunol Immunother. 2021;70(6):1705–1719. doi:10.1007/s00262-020-02817-z
35. Zhang T, Joubert P, Ansari-Pour N, et al. Genomic and evolutionary classification of lung cancer in never smokers. Nat Genet. 2021;53(9):1348–1359. doi:10.1038/s41588-021-00920-0
36. Reungwetwattana T, Nakagawa K, Cho BC, et al. CNS response to osimertinib versus standard epidermal growth factor receptor tyrosine kinase inhibitors in patients with untreated EGFR-mutated advanced non–small-cell lung cancer. J Clin Oncol. 2018;36(33):3290–3297. doi:10.1200/JCO.2018.78.3118
37. Litchfield K, Reading JL, Puttick C, et al. Meta-analysis of tumor- and T cell-intrinsic mechanisms of sensitization to checkpoint inhibition. Cell. 2021;184(3):596–614.e14. doi:10.1016/j.cell.2021.01.002
38. Forde PM, Chaft JE, Smith KN, et al. Neoadjuvant PD-1 blockade in resectable lung cancer [published correction appears in N Engl J Med. 2018 Nov 29;379(22):2185]. N Engl J Med. 2018;378(21):1976–1986. doi:10.1056/NEJMoa1716078
39. Mazzaschi G, Madeddu D, Falco A, et al. Low PD-1 expression in cytotoxic CD8+ tumor-infiltrating lymphocytes confers an immune-privileged tissue microenvironment in NSCLC with a prognostic and predictive value. Clin Cancer Res. 2018;24(2):407–419. doi:10.1158/1078-0432.CCR-17-2156
40. Tian Y, Xu J, Chu Q, et al. A novel tumor mutational burden estimation model as a predictive and prognostic biomarker in NSCLC patients. BMC Med. 2020;18(1):232. doi:10.1186/s12916-020-01694-8
41. Leader AM, Grout JA, Maier BB, et al. Single-cell analysis of human non-small cell lung cancer lesions refines tumor classification and patient stratification. Cancer Cell. 2021;39(12):1594–1609.e12. doi:10.1016/j.ccell.2021.10.009
42. Jia Q, Wu W, Wang Y, et al. Local mutational diversity drives intratumoral immune heterogeneity in non-small cell lung cancer. Nat Commun. 2018;9(1):5361. doi:10.1038/s41467-018-07767-w
43. Lei Y, Zhang G, Zhang C, et al. The average copy number variation (CNVA) of chromosome fragments is a potential surrogate for tumor mutational burden in predicting responses to immunotherapy in non-small-cell lung cancer. Clin Transl Immunol. 2021;10(1):e1231. doi:10.1002/cti2.1231
44. Jamal-Hanjani M, Wilson GA, McGranahan N, et al. Tracking the evolution of non-small-cell lung cancer. N Engl J Med. 2017;376(22):2109–2121. doi:10.1056/NEJMoa1616288
45. Lee HW, Seol HJ, Choi YL, et al. Genomic copy number alterations associated with the early brain metastasis of non-small cell lung cancer. Int J Oncol. 2012;41(6):2013–2020. doi:10.3892/ijo.2012.1663
46. Pearlman A, Upadhyay K, Cole K, et al. Robust genomic copy number predictor of pan cancer metastasis. Genes Cancer. 2018;9(1–2):66–77. doi:10.18632/genesandcancer.165
47. Broderick SR. Adjuvant and neoadjuvant Immunotherapy in Non-small cell lung cancer. Thorac Surg Clin. 2020;30(2):215–220. doi:10.1016/j.thorsurg.2020.01.001
48. Chaft JE, Rimner A, Weder W, Azzoli CG, Kris MG, Cascone T. Evolution of systemic therapy for stages I-III non-metastatic non-small-cell lung cancer. Nat Rev Clin Oncol. 2021;18(9):547–557. doi:10.1038/s41571-021-00501-4
 © 2023 The Author(s). This work is published and licensed by Dove Medical Press Limited. The
full terms of this license are available at https://www.dovepress.com/terms
and incorporate the Creative Commons Attribution
- Non Commercial (unported, 3.0) License.
By accessing the work you hereby accept the Terms. Non-commercial uses of the work are permitted
without any further permission from Dove Medical Press Limited, provided the work is properly
attributed. For permission for commercial use of this work, please see paragraphs 4.2 and 5 of our Terms.
© 2023 The Author(s). This work is published and licensed by Dove Medical Press Limited. The
full terms of this license are available at https://www.dovepress.com/terms
and incorporate the Creative Commons Attribution
- Non Commercial (unported, 3.0) License.
By accessing the work you hereby accept the Terms. Non-commercial uses of the work are permitted
without any further permission from Dove Medical Press Limited, provided the work is properly
attributed. For permission for commercial use of this work, please see paragraphs 4.2 and 5 of our Terms.
Recommended articles
Molecular Characteristics and the Effect of KRAS Mutation on the Prognosis of Immunotherapy in Non-Small Cell Lung Cancer in Xinjiang, China
Gu G, Yu B, Wan H, Lu S, Zhu X, Zhao Y, Fuxi Y, Liu C
OncoTargets and Therapy 2022, 15:1021-1032
Published Date: 21 September 2022
Clinical Applications of Aneuploidies in Evolution of NSCLC Patients: Current Status and Application Prospect
Yan X, Liu SM, Liu C
OncoTargets and Therapy 2022, 15:1355-1368
Published Date: 10 November 2022
Quantitative Analysis of TP53-Related Lung Cancer Based on Radiomics
Qiao H, Ding Z, Zhu Y, Wei Y, Xiao B, Zhao Y, Feng Q
International Journal of General Medicine 2022, 15:8481-8489
Published Date: 6 December 2022
GABRP is a Promising Prognostic Biomarker and Associated with Immune Cell Infiltration in Lung Squamous Cell Carcinoma
Fu J, Lin J, Zeng X, Li G, Wei Y, Xian L
Pharmacogenomics and Personalized Medicine 2023, 16:357-371
Published Date: 15 April 2023
Effect of Type 2 Diabetes on the Development of Acute Respiratory Distress Syndrome (ARDS) in Patients with Lung Cancer After Surgery and Its Prognosis
Zhang L, Guan L, Tang X, Zhao Y
International Journal of General Medicine 2023, 16:4573-4584
Published Date: 9 October 2023