Back to Journals » Journal of Hepatocellular Carcinoma » Volume 13
Multimodal Modeling Distinguishes Treatment Response from Overall Survival in Hepatocellular Carcinoma Receiving Combined Interventional and Targeted Immunotherapy
Authors Lu D, Sun P, Li H, Liang Z, Zhang Z, Cao Q, Zhang D, He Q, Jia J, Wang Y, Dong Z ![]() , Wang D
, Wang D ![]() , Li T
, Li T ![]()
Received 30 March 2026
Accepted for publication 11 June 2026
Published 20 June 2026 Volume 2026:13 613014
DOI https://doi.org/10.2147/JHC.S613014
Checked for plagiarism Yes
Review by Single anonymous peer review
Peer reviewer comments 2
Editor who approved publication: Professor Toshihiro Tanaka
Donghai Lu,1,* Pengfei Sun,1,2,* Han Li,1 Zeng Liang,1 Zhaohan Zhang,1 Qihang Cao,1 Daolin Zhang,1 Qiao He,1 Jisen Jia,1 Yuxuan Wang,1 Zhaoru Dong,1 Dongxu Wang,1 Tao Li1
1Department of General Surgery, Qilu Hospital of Shandong University, Jinan, Shandong, People’s Republic of China; 2Department of HPB Surgery, Shandong Cancer Hospital Affiliated to Shandong First Medical University and Shandong Academy of Medical Science, Jinan, Shandong, People’s Republic of China
*These authors contributed equally to this work
Correspondence: Tao Li, Department of General Surgery, Qilu Hospital of Shandong University, 107 Wenhua Xi Road, Jinan, Shandong, 250012, People’s Republic of China, Tel +86-0531-82169169, Email [email protected] Dongxu Wang, Department of General Surgery, Qilu Hospital of Shandong University, 107 Wenhua Xi Road, Jinan, Shandong, 250012, People’s Republic of China, Tel +86-0531-82169169, Email [email protected]
Background & Aims: While combined interventional therapies and targeted immunotherapy have improved outcomes for unresectable hepatocellular carcinoma (HCC), radiographic tumor shrinkage does not guarantee prolonged survival (the “responder paradox”). We hypothesized that these distinct endpoints may be associated with different clinical and biological factors and require separate predictive strategies. This study aimed to develop the predictive radiomics-integrated multimodal estimation (PRIME) system to independently predict and biologically characterize treatment response versus overall survival (OS).
Methods: In this multicenter study comprising 246 patients receiving combined interventional therapies and targeted immunotherapy, we integrated clinical data and dual-phase CT radiomics. We employed multimodal fusion algorithms to construct two models: PRIME-R (predicting 3-month objective response) and PRIME-S (predicting OS). Model performance was rigorously tested in an external validation cohort. Furthermore, we utilized SHapley Additive exPlanations and matched imaging-transcriptomic data to elucidate the specific clinical and molecular features associated with each outcome.
Results: The PRIME models demonstrated superior accuracy compared to single-modality approaches. In external validation, PRIME-R achieved an AUC of 0.85, while PRIME-S achieved a C-index of 0.72. Significant risk stratification was confirmed (HR = 3.31, 95% CI: 2.06– 5.31, P < 0.001). Crucially, feature analysis revealed a distinct divergence: PRIME-R was primarily driven by tumor morphology. In contrast, PRIME-S relied heavily on systemic inflammation and liver function reserve. Transcriptomic profiling supported this interpretation, showing that response was associated with acute immune activation, whereas survival was associated with metabolic adaptation and tissue homeostasis.
Conclusion: Short-term response and long-term survival in HCC are distinct clinical endpoints associated with different biological drivers. The PRIME system effectively distinguishes these outcomes, offering insights into the responder paradox and supporting dual-endpoint risk stratification pending further prospective validation. The diagram illustrates the relationship between tumor shrinkage and durable survival, highlighting the responder paradox. It begins with a liver showing tumor shrinkage due to combined therapy, which includes medication and radiomics and clinical data. Despite shrinkage, durable survival is not guaranteed, indicated by the responder paradox. The PRIME-RESPONSE section involves tumor geometry and immune activation. The PRIME-SURVIVAL section includes liver function and heterogeneity and metabolic adaptation. A grid shows outcomes: ideal outcome with shrinkage and stable survival and paradoxical outcome with primary resistance despite shrinkage.Diagram of tumor shrinkage, survival and responder paradox in cancer therapy.
Keywords: hepatocellular carcinoma, multimodal, targeted immunotherapy, responder, non-invasive, multimodal models, treatment response, survival, paradox, precision stratification
Introduction
Hepatocellular carcinoma (HCC) is the third leading cause of cancer-related deaths globally.1 For patients with unresectable HCC, the treatment landscape has undergone a major paradigm shift in the era of combination therapy. Combined interventional therapies, such as transarterial chemoembolization (TACE) and hepatic arterial infusion chemotherapy (HAIC), together with systemic targeted immunotherapy, have emerged as an important treatment framework and have improved clinical outcomes in this population.2,3 In routine practice, treatment response is commonly assessed using morphological criteria, most notably the modified Response Evaluation Criteria in Solid Tumors (mRECIST), which evaluates therapeutic efficacy based on changes in viable, arterially enhancing tumor tissue.4
However, clinical benefit remains highly heterogeneous.2,3 A major challenge is that radiographic tumor response does not always translate into durable survival benefit, a phenomenon often referred to as the “responder paradox.” This discordance suggests that local tumor regression alone may not fully capture the complex interplay between intrinsic tumor biology and systemic host status, highlighting the need for more refined risk stratification.5,6
This clinical discordance also underscores an important conceptual distinction between predictive and prognostic modeling. Predictive indicators generally reflect immediate, treatment-specific tumor sensitivity, such as short-term mRECIST response,7,8 whereas prognostic factors are associated with the long-term survival trajectory, which may be influenced by broader systemic variables such as liver functional reserve, inflammatory status, immune homeostasis, acquired resistance, and metastatic potential.7,9,10 Therefore, early treatment response and long-term survival may be driven by partially distinct biological and clinical dimensions. Previous radiomics and multimodal machine learning studies have made important contributions to HCC management by developing models to predict either treatment response or overall survival (OS) independently.11–13 However, focusing primarily on a single endpoint may not fully explain why some patients achieve early radiographic tumor regression but fail to obtain durable survival benefit. A modeling system that explicitly distinguishes these two endpoints could provide a more comprehensive view of patient trajectories and refine risk stratification.
Noninvasive multimodal data provides a foundation for this dual-endpoint prediction. Radiomics can quantify intratumoral heterogeneity and “tumor geometry”, which correlate with local treatment sensitivity.11,12,14 Meanwhile, clinical data—such as inflammatory markers and liver function—reflect the systemic environment that may influence long-term prognosis.15,16 While integrating these modalities has shown promise in various cancers, its utility in disentangling response versus survival in HCC combination therapy remains insufficiently explored.17
In this multicenter study, we developed the predictive radiomics integrated multimodal estimation (PRIME) system to independently predict treatment response (PRIME-R) and OS (PRIME-S). We utilized SHapley Additive exPlanations (SHAP) to visualize the divergence in feature importance between the two models. Finally, we leveraged matched imaging-transcriptomic data from The Cancer Imaging Archive (TCIA) to investigate the molecular mechanisms—specifically the balance between immune activation and metabolic adaptation—underlying these distinct clinical outcomes. Our goal is to provide a noninvasive framework for dual-endpoint risk stratification and future individualized management studies.
Materials and Methods
Cohort
This retrospective study was conducted at two tertiary hospitals in China: Shandong Cancer Hospital (the SCH cohort) and Qilu Hospital (the QL cohort). The study protocol was approved by the Ethics Committee of Scientific Research of Shandong Cancer Hospital (ID: SDTHEC202506027, June 18, 2025) and adhered to the principles of the Declaration of Helsinki and Istanbul. Informed consent was waived due to the retrospective nature of the study. This study was reported in compliance with the STROBE criteria.
Patient Enrollment, Treatment Response Evaluation and Follow-Up
Between January 2020 and January 2024, 113 consecutive patients with unresectable HCC were enrolled from the SCH cohort and 133 from the QL cohort. Patients were followed up every 4–12 weeks, including imaging assessments to evaluate treatment response at 3 months. The follow-up period ended on September 28, 2025. The key inclusion criteria were: (1) clinical or histopathological diagnosis of HCC; (2) preserved liver function (Child-Pugh grade A or B) and Eastern Cooperative Oncology Group performance status (ECOG-PS) score 0–1; (3) received combined interventional therapy and targeted immunotherapy; and (4) underwent baseline dual-phase CECT within 1 month prior to treatment. Patients were primarily excluded if they had infiltrative HCC with ill-defined boundaries, concurrent malignancies, received less than two cycles of systemic therapy, lacked essential clinical/imaging data, or were lost to follow-up. Patients from the SCH cohort were randomly stratified into training and internal validation cohorts (7:3 ratio) balanced by treatment outcomes, while all patients from the QL cohort served as the external validation cohort. Tumor response was evaluated at 3 months post-treatment according to the mRECIST by two experienced hepatobiliary surgeons (DXW and PFS),4 based on changes in arterial phase-enhancing target lesions on CECT or MRI. Detailed response assessment criteria are provided in the Supplementary Methods.
Treatment Regimen
Detailed information on systemic and interventional treatment regimens—including drug types, dosing schedules, adjustments, and criteria for continuation—is provided in the Supplementary Methods.
Clinical and Imaging Data Collection
Clinical and imaging data were retrieved from the electronic medical record systems of both centers. Clinical variables included demographics, laboratory tests, tumor characteristics, treatment features, and composite indices. Relative changes in key parameters at one month post-treatment were also calculated. Detailed definitions are provided in the Supplementary Methods. The extent of missing data for each variable was thoroughly evaluated prior to analysis. Missing clinical data were handled using median imputation via the SimpleImputer class from the scikit-learn package, where missing entries were replaced with the corresponding column median. Features with >30% missing values were entirely excluded from the analysis. Radiomics data consisted of contrast-enhanced CT (CECT) images in DICOM format. Both arterial and portal venous phase images were retrieved. Acquisition parameters are summarized in the Supplementary Methods.
Image Preprocessing, Tumor Segmentation, and Radiomics Feature Extraction
The image preprocessing workflow included DICOM format standardization and de-identification. To ensure reproducibility across different CT scanners, all images were resampled to an isotropic voxel spacing of 1×1×1 mm using interpolation, and intensity normalization was applied. Three-dimensional regions of interest (ROIs) were initially segmented using the deep learning-based MedSAM model,18,19 followed by meticulous manual refinement by two experienced hepatobiliary surgeons using 3D Slicer software. Radiomics features—including first-order statistics, shape, and texture features from original images, as well as images processed with Laplacian of Gaussian (LoG, σ=4.0) and wavelet transforms—were extracted using the PyRadiomics Python package.20 To ensure extraction robustness, inter- and intra-observer reproducibility was assessed using the intraclass correlation coefficient (ICC). Only highly reproducible features with an ICC > 0.75 were retained for subsequent modeling. Following this reproducibility filter, a combined total of 1,675 radiomics features (851 from the arterial phase and 824 from the venous phase) were retained for advanced feature selection.
Data Preprocessing and Feature Selection
Data preprocessing and feature selection were performed exclusively on the training set to prevent data leakage. A unified yet task-specific pipeline was implemented. Features were standardized using z-score normalization. For classification, radiomics features with low variance (<0.01) were removed. Clinical features underwent univariate logistic regression (p < 0.05 retained). Subsequently, Elastic Net regularization (five-fold cross-validation, l1_ratio=0.5, “saga” solver) was applied to select the most relevant features (coefficient > 1e-4). For survival analysis (Survival), features with low variance (<0.1) were excluded. Preliminary screening used Cox proportional hazards regression with L1 regularization, followed by Elastic Net regularization to select the top ten features based on coefficient magnitude.
Model Selection and Hyperparameter Tuning
For response classification, five ensemble algorithms—Bagging, Boosting, Stacking, Rotation Forest, and Gradient Boosting with Randomness (GTBR)—were evaluated to identify the optimal radiomics model. Performance was assessed via five-fold cross-validation using the Area Under the Curve (AUC). For survival prediction, three algorithms were evaluated: Random Survival Forests (RSF), Gradient Boosting Survival Analysis (GBSA), and FastSurvivalSVM (FSVM). The concordance index (C-index) was the primary metric. The best-performing models were selected for hyperparameter tuning using grid search. Detailed parameter grids are in the Supplementary Methods.
Multimodal Fusion Strategies
We employed both early and late fusion strategies. Late fusion (decision-level fusion) was the primary strategy for the PRIME system. For PRIME-R, probability outputs from the optimal clinical and radiomics base models were concatenated and fed into a logistic regression meta-classifier. For PRIME-S, complementary prognostic information was integrated using Bayesian Model Averaging. Early fusion (feature-level fusion) involved concatenating features at the input stage. Detailed algorithms are described in the Supplementary Methods.
External Validation and Model Interpretation
Model generalizability was assessed using the independent QL cohort. All parameters and weights from the training cohort were applied directly to the external validation data. To interpret the models, SHAP values were computed using a five-fold cross-validation averaging strategy,21 providing unbiased estimates of feature importance and directionality.
Risk Classification and Survival Analysis
Patients were stratified into high- and low-risk groups based on the median risk score from the training set. Kaplan-Meier (KM) survival curves were estimated, and differences were assessed using the Log rank test. Hazard ratios (HR) and 95% confidence intervals (CI) were estimated using Cox proportional hazards regression.
Transcriptomic and Pathway Analysis
Integrative analysis was performed using The Cancer Genome Atlas Liver Hepatocellular Carcinoma (TCGA-LIHC) cohort and the TCIA database, which provides matched imaging and RNA sequencing data (N = 33).22 Differential gene expression analysis identified genes associated with radiomics-based risk status. Enrichment analyses (GO, KEGG, GSEA) were performed to uncover biological pathways. The immune microenvironment was characterized using ssGSEA.23,24
Statistical Analysis
Categorical variables were summarized as counts (percentages) and continuous variables as means ± SD or medians (IQR). Comparisons used chi-square, Fisher’s exact, Student’s t-test, or Mann–Whitney U-test as appropriate. Spearman correlation assessed feature redundancy (|r| < 0.50 considered weak). Model performance was evaluated using AUC (classification) and C-index (survival). Time-dependent AUC (AUC-t) and Brier scores assessed dynamic accuracy. Calibration curves were used to assess agreement between predicted and observed outcomes. Decision curve analysis (DCA) evaluated clinical utility. All tests were two-sided (p < 0.05 significant). Furthermore, information regarding whether patients received subsequent anti-tumor therapy after progression was extracted from the clinical database. To assess the potential influence of subsequent therapy, multivariable Cox regression analyses were performed before and after adding subsequent therapy as a covariate. Analysis used R (v4.4.0) and Python (v3.11.7).
Results
Patient Characteristics and Treatment Landscapes
The patient enrollment process and the overall study workflow are illustrated in Figures 1 and 2, respectively. Baseline demographics and clinical characteristics were well-balanced between the training/internal validation cohort (SCH, n = 113) and the external validation cohort (QL, n = 133). Key liver function parameters, including cirrhosis prevalence, Child-Pugh scores, and albumin-bilirubin (ALBI) grades, showed no significant inter-cohort differences. Similarly, tumor burden indicators such as diameter, tumor number, portal vein tumor thrombus (PVTT) classification, and barcelona clinic liver cancer (BCLC) stage were comparable (Table 1). Treatment strategies were consistent across centers, with patients receiving interventional therapies (TACE and/or HAIC) combined with immunotherapy (primarily camrelizumab, tislelizumab, or sintilimab) and targeted agents (predominantly lenvatinib). Clinical outcomes were also comparable, with similar objective response rate (ORR) (47% vs. 49%) and disease control rate (DCR) (75% vs. 77%). The median follow-up time for the entire study cohort, calculated using the reverse Kaplan–Meier method, was 26.3 months (95% CI: 23.9–28.5). The median OS was 596 days for the SCH cohort and 627 days for the QL cohort.
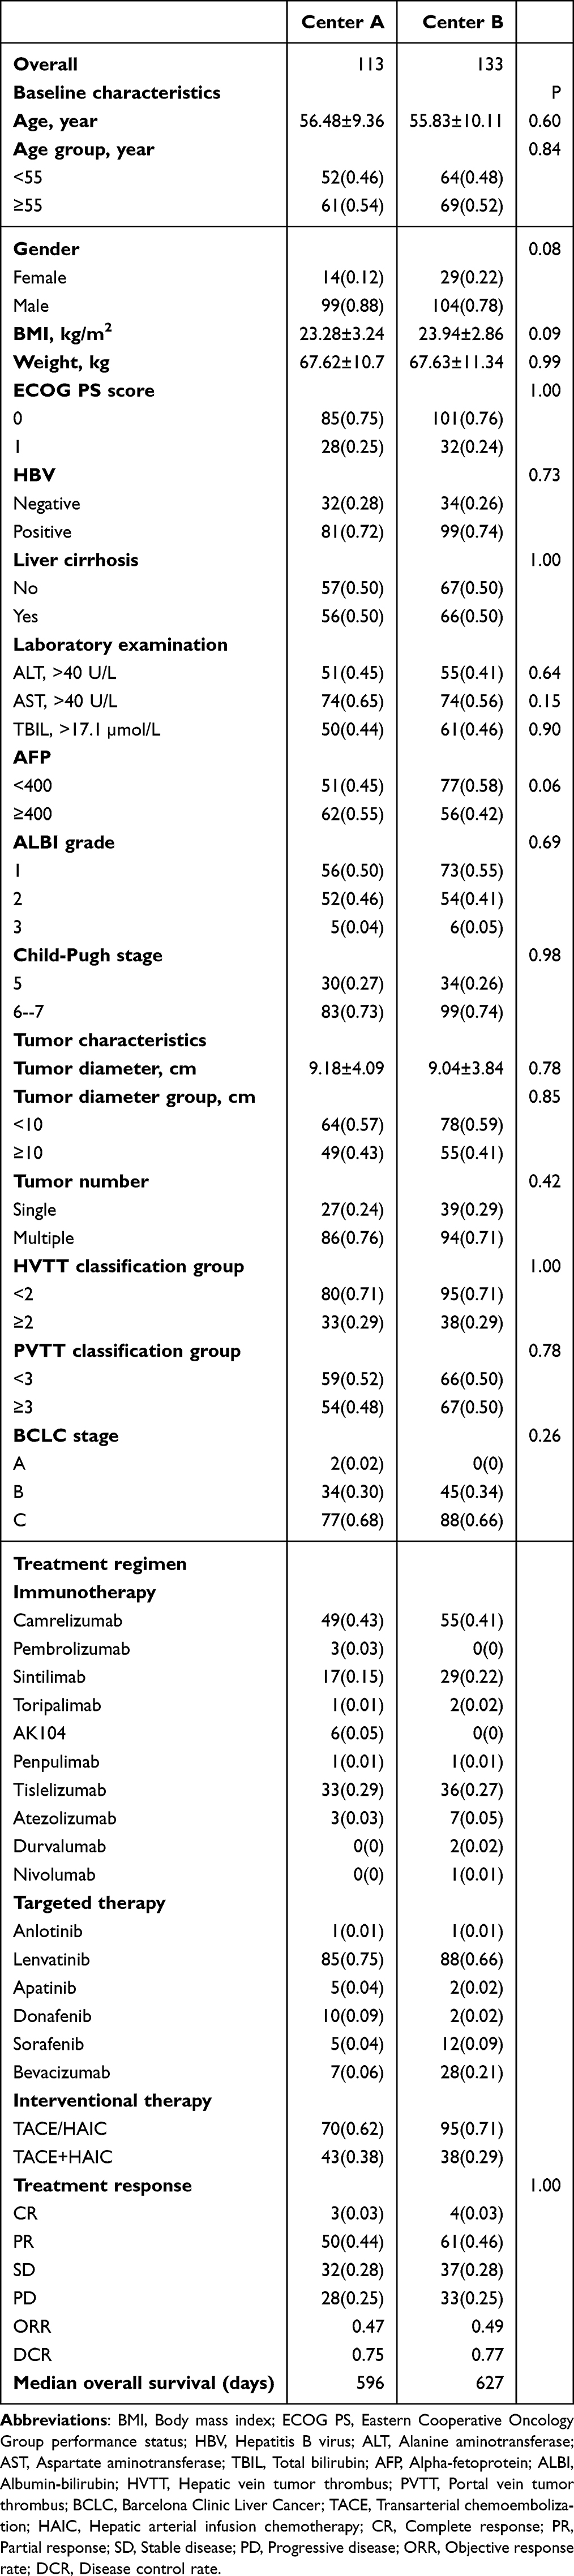 |
Table 1 Characteristics of the Included 246 Patients |
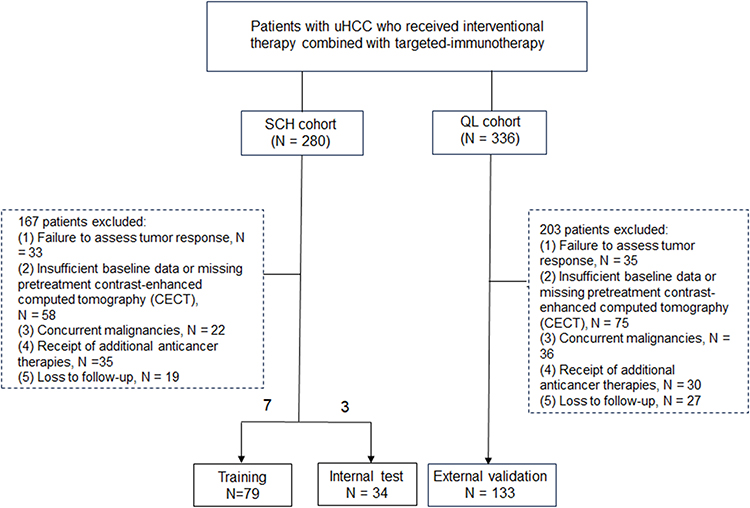 |
Figure 1 Flowchart of patient selection. Screening, inclusion, and exclusion process for patients with unresectable hepatocellular carcinoma (uHCC) receiving combined interventional and targeted immunotherapy across two centers. The final cohort was divided into training, internal test, and external validation sets. Abbreviation: CECT: contrast-enhanced computed tomography. |
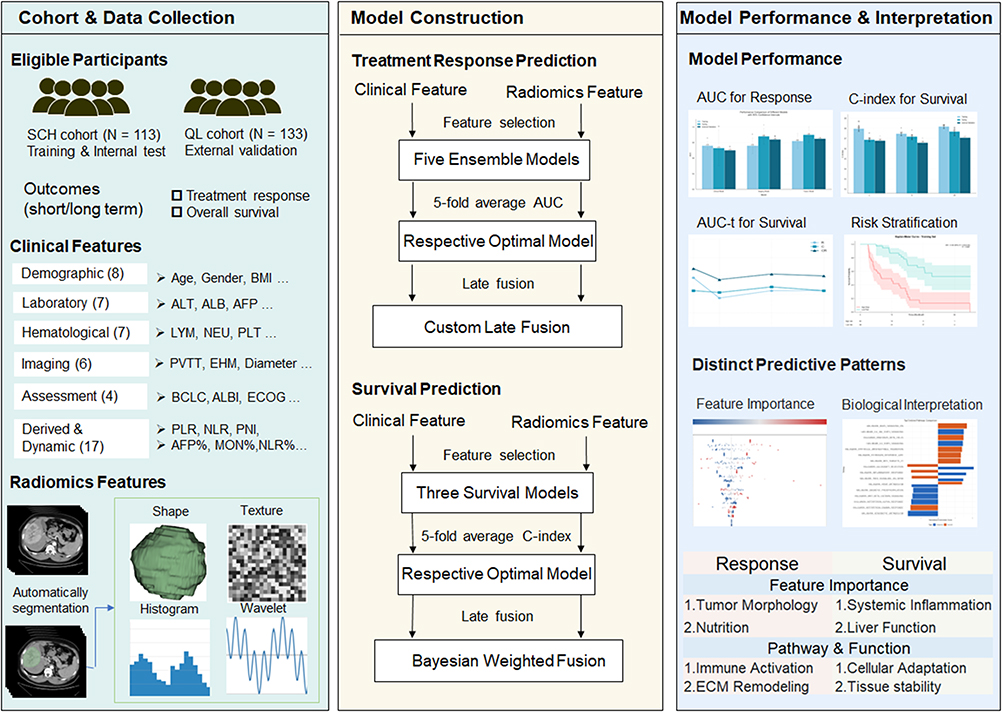 |
Figure 2 Workflow of the PRIME system construction and validation. The workflow includes three main components: cohort and data collection, model construction, and model performance and interpretation. Clinical data and dual-phase radiomics features were collected from eligible patients and used to develop the PRIME-R model for treatment response prediction and the PRIME-S model for survival prediction. Model performance was evaluated using discrimination, calibration, clinical utility, and risk stratification analyses, followed by interpretation using SHAP and transcriptomic pathway analysis. Abbreviations: AUC, area under the curve; AUC-t, time-dependent area under the curve; C-index, concordance index; ECM, extracellular matrix; SHAP, SHapley Additive exPlanations. |
The PRIME System Identifies Distinct Predictors for Response and Survival
PRIME-R: Tumor Geometry and Texture Drive Treatment Response
To construct the response prediction model (PRIME-R), feature selection identified ten radiomics biomarkers and nine clinical predictors. Radiomics features were predominantly characterized by tumor geometry and morphology as well as advanced textural heterogeneity derived from wavelet transformations (Supplementary Figure 1). In contrast, clinical feature selection identified predictors such as ECOG-PS and AFP, with the prognostic nutritional index (PNI) showing the most significant difference between responders and non-responders (p < 0.01) (Supplementary Figure 2). Notably, correlation matrices demonstrated predominantly weak associations between selected clinical and radiomic features (|r| < 0.50), suggesting limited redundancy and high complementarity between the two modalities (Figure 3, Figure 4A and Figure 4B).
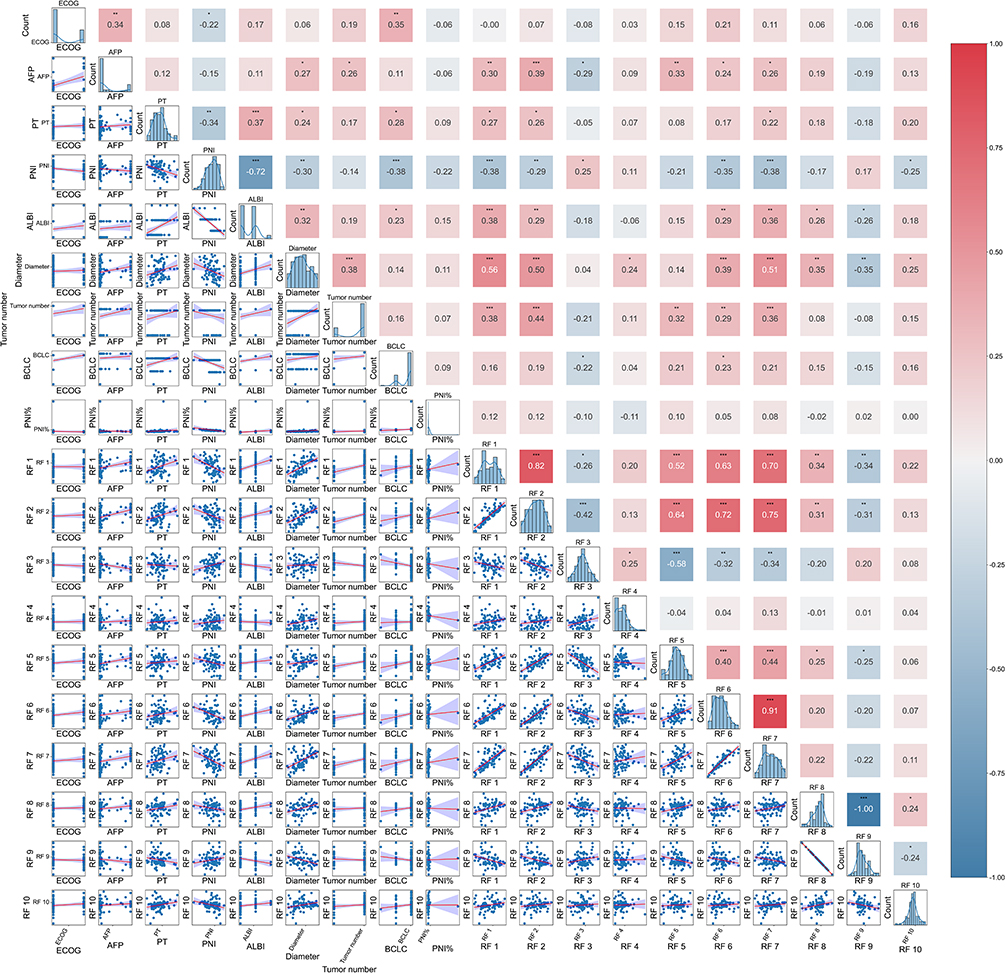 |
Figure 3 Correlation matrix of features selected for the PRIME-R model. Pairwise Pearson correlation analysis of the final selected clinical and radiomics predictors for treatment response. The upper triangle displays correlation coefficients (red: positive; blue: negative), while the lower triangle shows scatter plots of feature relationships. Statistical significance is indicated as follows: * P < 0.05, ** P < 0.01, *** P < 0.001. RF, radiomics feature; detailed RF definitions are provided in the Supplementary Materials. Abbreviation: PNI, prognostic nutritional index. |
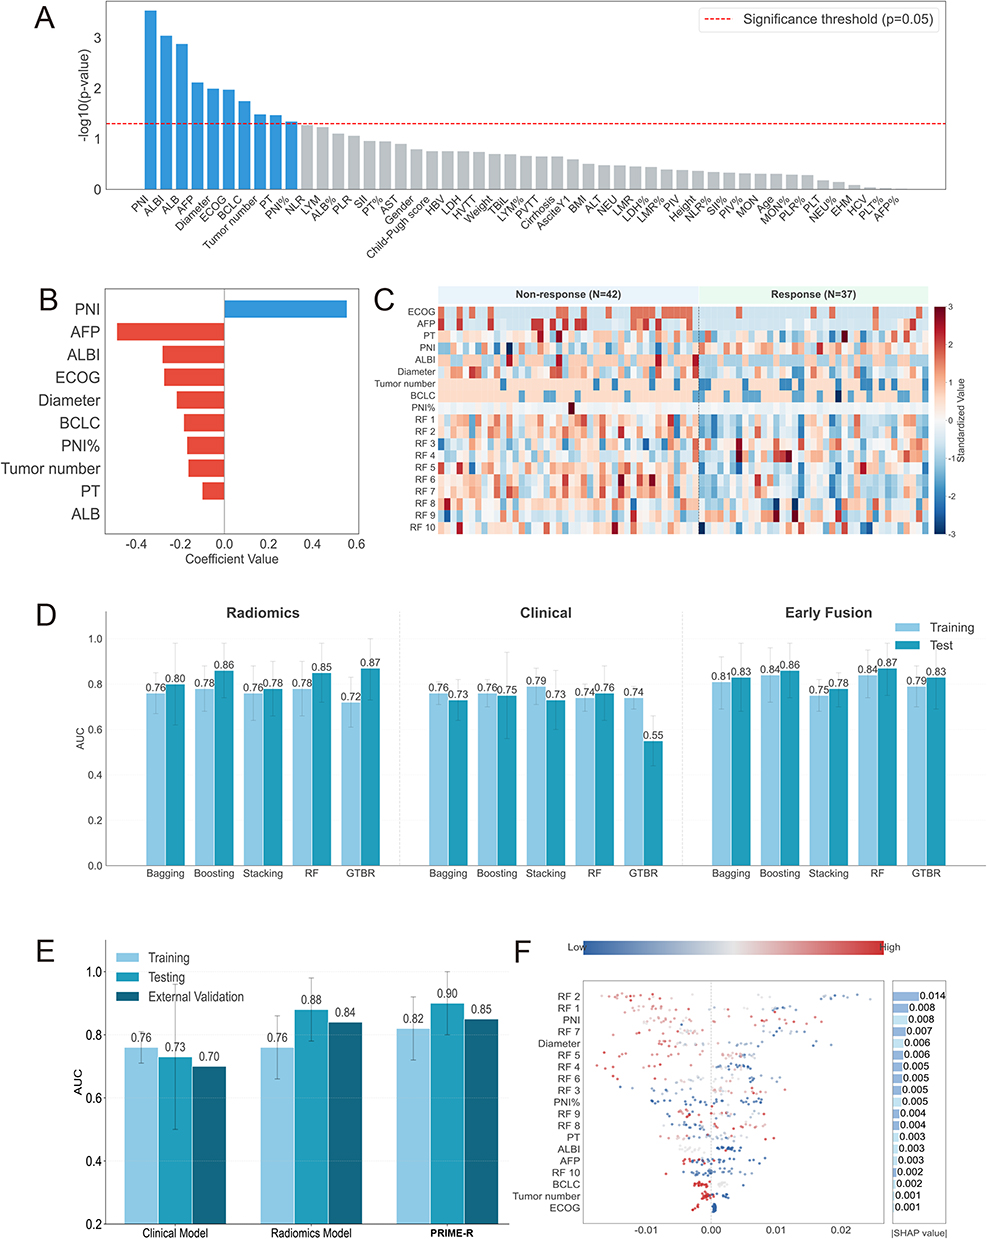 |
Figure 4 Development and performance of the PRIME-R (Response) model. (A and B) Clinical feature selection via univariate logistic regression (A) and elastic net regression (B). (C) Heatmap comparing selected features between responders and non-responders. (D) Performance comparison of various machine learning algorithms and early fusion strategies. (E) ROC curves of the standalone clinical, radiomics, and the final PRIME-R models in training, testing, and external validation cohorts. (F) SHAP summary plot ranking feature importance for PRIME-R (1: Maximum3D Diameter; 6: MajorAxisLength). Abbreviations: PRIME-R, Predictive Radiomics-Integrated Multimodal Estimation for Response; RF, Radiomics Feature. |
Further analysis within the training cohort revealed distinctive feature patterns between non-responders (n = 42) and responders (n = 37). Heatmap visualization confirmed that shape-based radiomics features, particularly maximum 3D diameter and major axis length (both p < 0.001), exhibited the strongest discriminative ability, reflecting the physical impact of tumor size and geometry on local therapeutic efficacy (Figure 4C).
In model development, we compared multiple machine learning algorithms and fusion strategies. While early fusion strategies achieved promising results (Figure 4D), the late-fusion PRIME-R model demonstrated superior predictive capability. In the internal test set, PRIME-R achieved an AUC of 0.90. Crucially, this robust performance was maintained in the external validation cohort with an AUC of 0.85, outperforming both the standalone clinical (AUC = 0.70) and radiomics (AUC = 0.84) models (Figure 4E). Calibration analysis showed that PRIME-R exhibited the most balanced calibration pattern across probability thresholds (Supplementary Figure 3), and DCA validated its superior net benefit in guiding treatment decisions (Supplementary Figure 4). The interpretability of the PRIME-R model was subsequently visualized using SHAP analysis (Figure 4F), which is detailed in SHAP Analysis Reveals Divergent Predictive Logic.
PRIME-S: Systemic Inflammation and Liver Function Predict Survival
For overall survival prediction (PRIME-S), the feature landscape shifted significantly towards systemic host factors. Ten clinical features were retained, predominantly reflecting systemic inflammation and hepatic reserve, including monocyte count (MON), dynamic changes in MON, ALBI grade, cirrhosis status, and hepatitis B virus (HBV) infection (Figure 5A). Radiomics features selected for survival were mainly related to intratumoral texture rather than the macro-morphology that dominated the response model (Figure 5B). Correlation analysis confirmed limited inter-modal correlations, with most coefficients falling below 0.30 (Supplementary Figure 5).
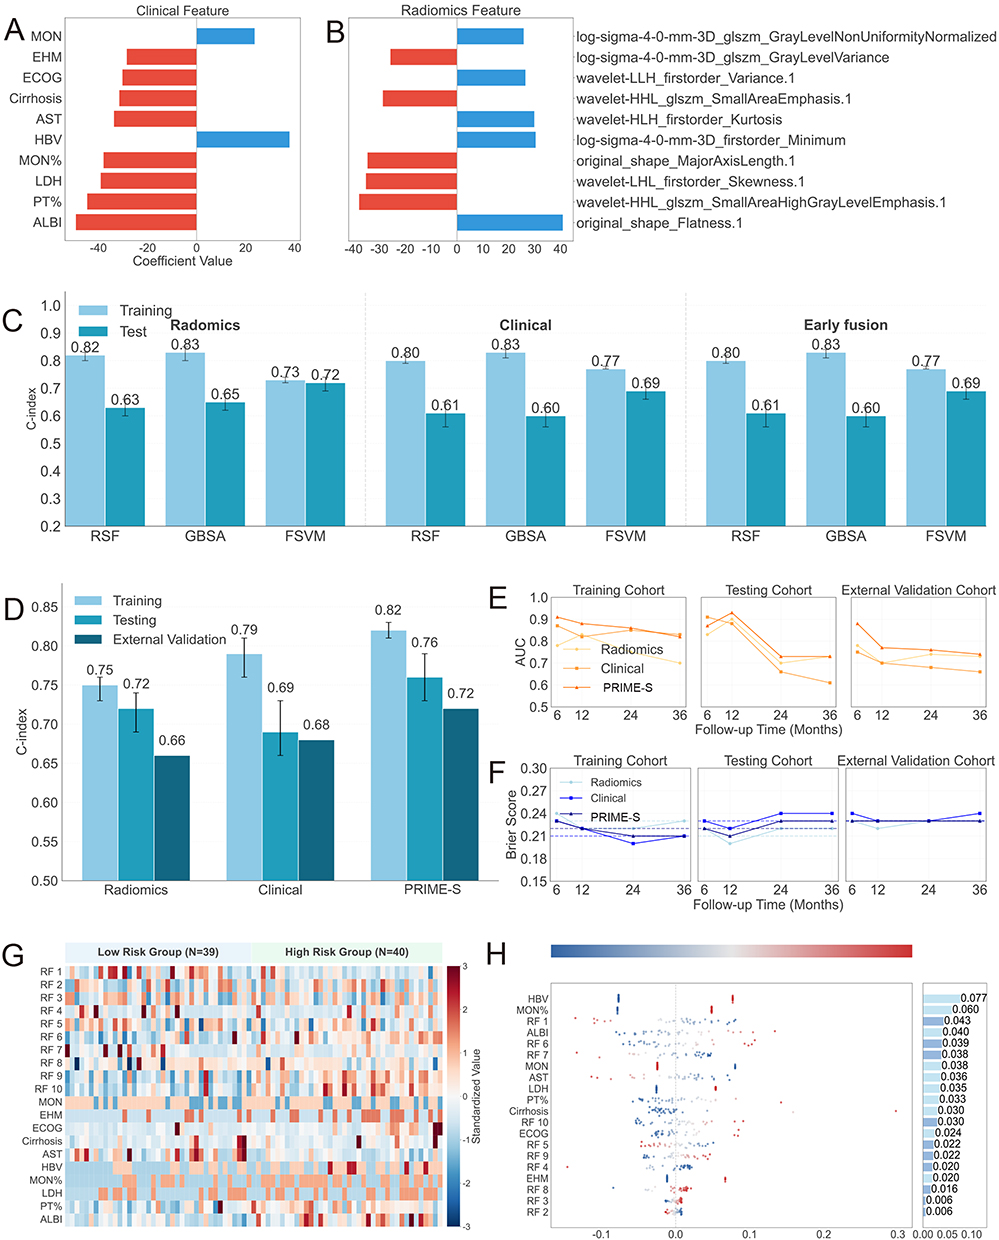 |
Figure 5 Development and performance of the PRIME-S (Survival) model. (A and B) Top 10 clinical (A) and radiomics (B) features selected via Cox-L1 and elastic net regression. (C) C-index comparison of unimodal and early fusion models (RSF, GBSA, FSVM). (D) C-index of the final PRIME-S model versus single-modality models across all cohorts. (E and F) Time-dependent AUC (E) and Brier scores (F) for PRIME-S at 6, 12, 24, and 36 months. (G) Heatmap of feature distribution stratified by PRIME-S risk groups. (H) SHAP summary plot ranking feature importance for PRIME-S. Abbreviations: PRIME-S, Predictive Radiomics-Integrated Multimodal Estimation for Survival; MON, monocyte count; RF, Radiomics Feature. |
The PRIME-S model (late fusion via Bayesian Model Averaging) achieved a C-index of 0.76 (95% CI: 0.73–0.79) in the internal test set, surpassing single-modality approaches and early fusion strategies (Figure 5C and D). This performance advantage was sustained in the external validation cohort, where PRIME-S achieved a C-index of 0.72 and a mean time-dependent AUC of 0.79 (Figure 5E). Additionally, the PRIME-S model demonstrated the lowest Brier scores across follow-up time points (integrated Brier score = 0.23), indicating superior calibration and prediction accuracy (Figure 5F). Distinct patterns in feature distribution between high- and low-risk groups were further visualized, highlighting the contribution of elevated inflammatory markers and texture heterogeneity to poor prognosis (Figure 5G). Additionally, SHAP analysis was employed to rank the overall feature importance for survival prediction (Figure 5H), the biological rationale of which is explored in SHAP Analysis Reveals Divergent Predictive Logic.
Robust Risk Stratification and Feature Divergence
PRIME-S effectively stratified patients into high- and low-risk survival groups based on the median risk score. Significant HR were observed in the training set (HR = 5.88, 95% CI: 2.97–11.62, P < 0.001) and confirmed in the internal test set (Figure 6A and B) and external validation cohort (HR = 3.31, 95% CI: 2.06–5.31, P < 0.001) (Figure 6C). Notably, this stratification capacity remained robust across different treatment regimens (monotherapy vs. combination) (Figure 6D–I) and key clinical subgroups, including age, tumor burden, and extrahepatic metastasis (Supplementary Figures 6–9). Collectively, these findings highlight a clear divergence: short-term response appears more closely associated with local tumor geometry, whereas long-term survival appears more strongly linked to systemic physiological reserve. In the pooled cohort, 113 patients (45.9%) received subsequent anti-tumor therapy after progression. PRIME-S remained strongly associated with overall survival after subsequent therapy adjustment (HR = 3.41, 95% CI: 2.29–5.07, P < 0.001), with only minimal attenuation in effect size compared with the model without such adjustment (HR = 3.53, 95% CI: 2.37–5.23, P < 0.001; Supplementary Figure 10).
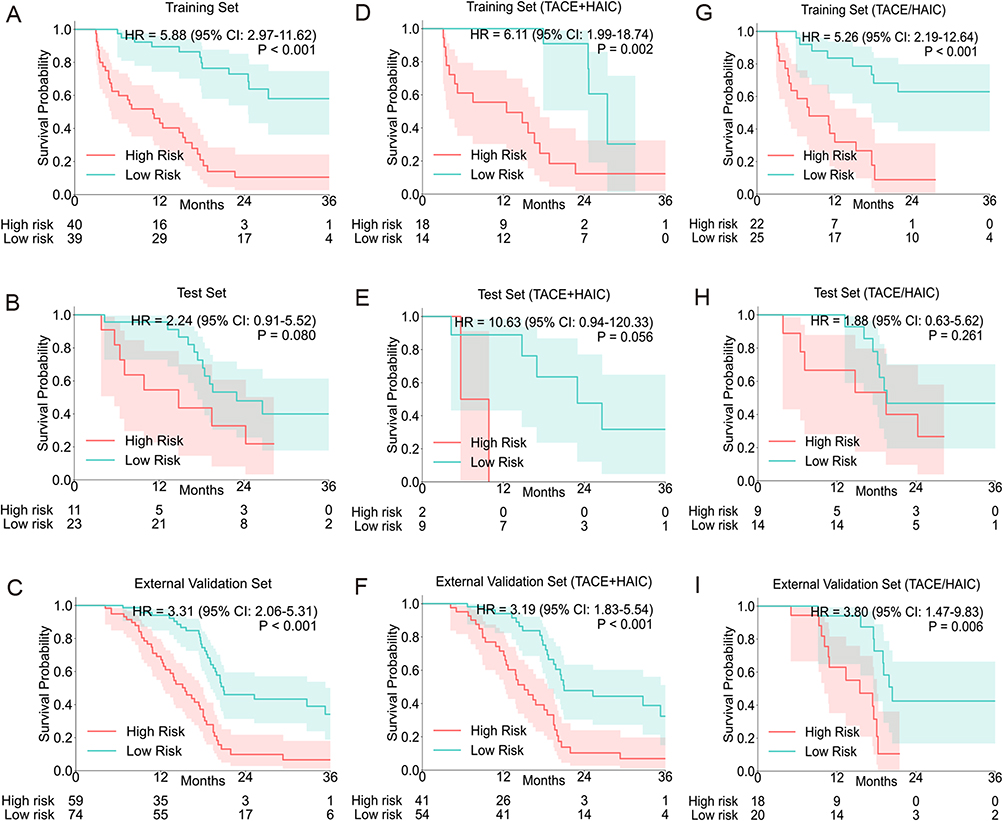 |
Figure 6 Kaplan–Meier survival stratification by the PRIME-S model. (A–C) Survival curves for high- vs. low-risk groups defined by PRIME-S scores in the training (A), internal test (B), and external validation (C) cohorts. (D–F) Stratification in the subgroup receiving combined TACE+HAIC. (G–I) Stratification in the subgroup receiving monotherapy (TACE or HAIC). P-values were calculated using the Log rank test. |
Mechanistic Insights: From Macroscopic Interpretation to Molecular Pathways
SHAP Analysis Reveals Divergent Predictive Logic
To elucidate the decision-making process of the PRIME system, SHAP were employed to rank feature importance. This analysis visually confirmed the macroscopic divergence between the two endpoints.
For PRIME-R, the model prioritized local tumor characteristics. Shape-based features, specifically maximum 3D diameter, emerged as the top predictor (mean |SHAP value| = 0.014), followed by maximum 2D diameter and sphericity. PNI was a notable clinical contributor (SHAP value = 0.008), suggesting a synergy between local tumor burden and nutritional-immune status in determining immediate therapeutic efficacy (Figure 4F).
In contrast, the interpretive landscape for PRIME-S was dominated by systemic indicators. The dynamic change in MON emerged as the strongest predictor (SHAP value = 0.077), underscoring the critical role of systemic inflammation. This was followed by HBV status (0.060) and liver function markers such as ALBI grade (0.040), aspartate aminotransferase (AST), and dynamic changes in prothrombin time (PT). While radiomics features contributed to the model, their influence was secondary to these host-related factors (Figure 5H). Generally, elevated post-treatment monocytes and compromised hepatic reserve were associated with poorer survival, whereas favorable tumor morphology correlated with higher response probability.
Transcriptomic Profiling Confirms Biological Divergence
To elucidate the molecular underpinnings of this prediction dissociation, we analyzed matched imaging-transcriptomic data from the TCIA/TCGA cohort. Differential gene expression analysis identified 733 genes associated with PRIME-R predicted response (Figure 7A) and 819 genes associated with PRIME-S predicted survival risk (Figure 7B).
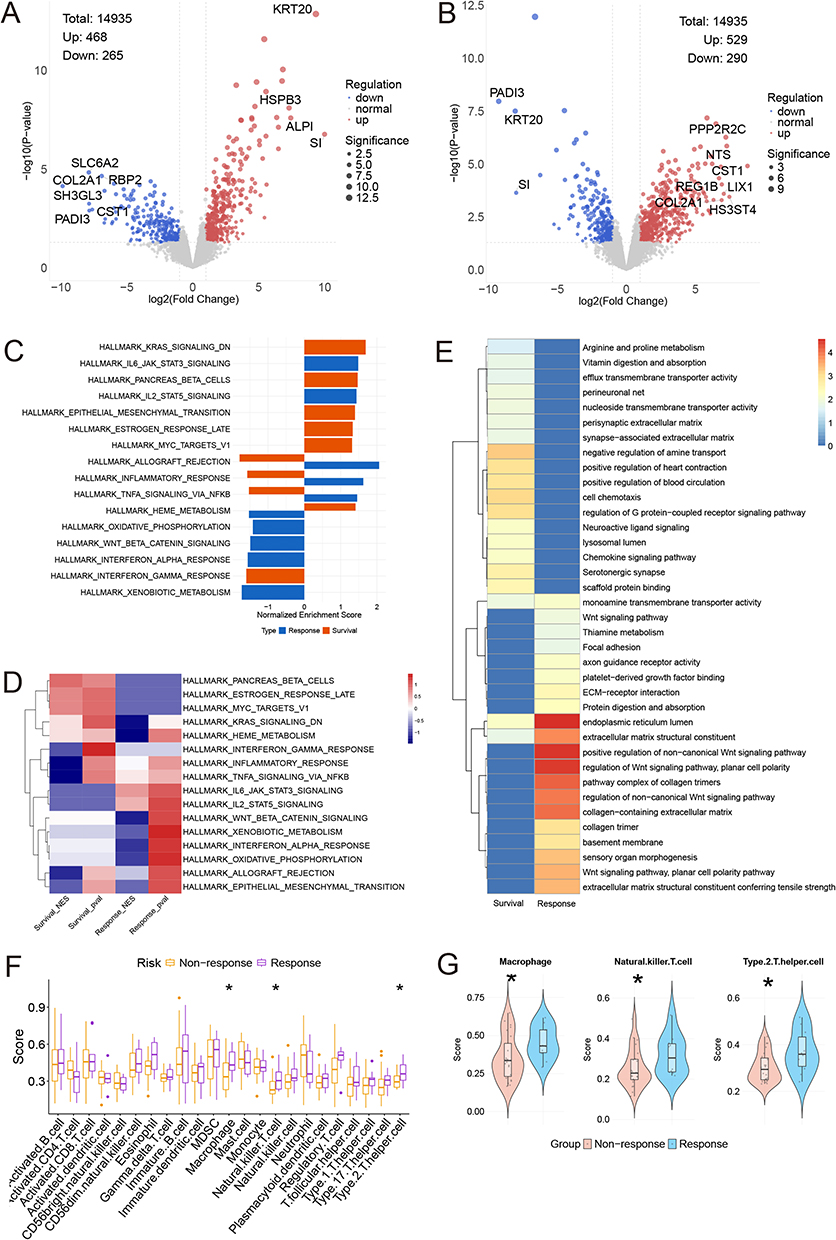 |
Figure 7 Transcriptomic and immune profiling of PRIME-predicted subgroups. (A and B) Volcano plots of differentially expressed genes between PRIME-predicted subgroups for response (A) and survival (B) in the TCIA cohort. Red, blue, and gray dots represent upregulated, downregulated, and non-significant genes, respectively. Dot size indicates statistical significance. (C) Comparative GSEA pathway enrichment, with blue representing response-associated pathways and Orange representing survival-associated pathways. (D) Heatmap of leading-edge genes from representative pathways. (E) KEGG/GO enrichment comparison. (F and G) Immune cell infiltration analysis showing significant differences in cell abundance between predicted responders and non-responders (F) and their specific distributions (G). Statistical significance is indicated as follows: *P < 0.05. |
Pathway enrichment analyses (GSEA, KEGG, GO) revealed that treatment response was predominantly driven by acute immune activation and tissue remodeling. Enriched pathways in the responder group included the inflammatory response, IL6-JAK-STAT3 signaling, TNF-α signaling via NF-κB, and interferon-alpha response. Additionally, pathways related to extracellular matrix organization—such as collagen structure and basement membrane organization—were significantly upregulated (Figure 7C and D). Immune cell infiltration analysis corroborating these findings showed a significantly higher abundance of macrophages, natural killer T cells, and Type 2 T helper cells in the responder group (Figure 7F and G).
Conversely, survival-associated pathways reflected a different biological program centered on cellular adaptation and metabolic stability. The high-risk survival group was characterized by the upregulation of signal transduction pathways, epithelial-mesenchymal transition (EMT), and metabolic processes including heme metabolism, thiamine metabolism, and protein digestion. Notably, several pathways exhibited distinct or opposing enrichment patterns between the two endpoints; for instance, while inflammatory signaling was positively enriched in responders, it showed variable associations with long-term survival, highlighting the complex interplay between acute anti-tumor immunity and chronic inflammation-driven progression (Figure 7E). Furthermore, unlike the response model, no significant differences in immune cell populations were observed between the high- and low-risk survival groups, reinforcing that survival is driven more by intrinsic tumor biology and metabolic adaptation than by immune infiltration alone (Supplementary Figure 11).
Discussion
In this multicenter study, we developed and validated the PRIME system to address a critical challenge in the era of combination therapy for HCC: the frequent discordance between short-term radiographic response and long-term survival benefit. While previous studies have often conflated these endpoints or relied on single-modality data, our work provides a systematic dual-endpoint evaluation. Our most significant finding is the distinct predictive patterns of features. We demonstrated that treatment response appears more closely associated with local tumor geometry and texture, reflecting the physical accessibility of interventional agents. In contrast, OS seems more strongly linked to systemic host factors and immune status. The superior performance of our late-fusion models over unimodal approaches confirms that neither radiomics nor clinical data alone is sufficient; rather, their integration captures the non-redundant information necessary to provide insights into the responder paradox.16,17,25
The divergent feature patterns identified by PRIME-R and PRIME-S offer potential pathophysiological insights. For PRIME-R, the dominance of shape-based radiomics features suggests that baseline tumor phenotype is the important contributor of immediate therapeutic efficacy. This is biologically plausible, as interventional therapies like TACE and HAIC rely on hemodynamics; tumors with regular geometry and intact capsules are more amenable to complete embolization and drug retention, whereas infiltrative or irregular tumors often harbor complex vascular supplies that facilitate residual disease.14,26 The contribution of PNI in this model further highlights that local efficacy is modulated by the patient’s systemic inflammatory and nutritional status. Conversely, PRIME-S was driven heavily by systemic indicators, with post-treatment MON emerging as the top predictor. Elevated monocytes may be a surrogate for high infiltration of M2-polarized tumor-associated macrophages, which foster an immunosuppressive microenvironment and promote metastasis, thereby shortening survival regardless of local tumor shrinkage.27,28 Similarly, the inclusion of ALBI and PT underscores that in unresectable HCC, the important factor for life expectancy is often the hepatic functional reserve required to tolerate continuous systemic therapy, rather than tumor burden alone.29
Clinically, the PRIME system supports a more nuanced framework from generalized assessment to a precision management strategy based on distinct risk profiles. By identifying the mismatch between response potential and survival probability, these profiles may help generate hypotheses for future studies evaluating tailored surveillance, liver-function preservation, and treatment adaptation. For instance, patients identified as “responder/low survival” (High PRIME-R, Low PRIME-S) represent a high-risk subgroup prone to the “responder paradox.” Although their tumors may shrink initially, their systemic frailty or immunosuppressive status puts them at risk of early failure. For these patients, radiographic tumor regression should be interpreted prudently, as it may not translate into survival benefit; they may require closer surveillance, early supportive care to protect liver function, or adjuvant immunomodulatory therapies to reverse systemic suppression.30 Conversely, patients with “non-responder/high survival” profiles may have biologically indolent tumors that, while resistant to significant shrinkage, do not progress rapidly. In such cases, maintaining stable disease while preserving quality of life may be a more rational goal than pursuing aggressive tumor reduction that could compromise hepatic reserve. This nuanced stratification supports the development of endpoint-specific clinical trials and decision-making frameworks.
Our integrated pathway analysis elucidates the molecular mechanisms driving the observed dissociation between response and survival. Pathways associated with favorable PRIME-R scores (responders) showed strong enrichment in acute immune activation and extracellular matrix remodeling. This suggests that immediate tumor regression may be associated with a “hot” immune microenvironment and structural permissiveness to facilitate drug efficacy and tumor necrosis.31,32 In contrast, the molecular landscape of the high-risk survival group was dominated by pathways associated with tumor aggressiveness and therapeutic resistance, including KRAS signaling and metabolic adaptation, such as heme30 and amino acid metabolism.33–35 This suggests that while an inflamed microenvironment facilitates initial tumor shrinkage, long-term survival may be influenced by the tumor’s intrinsic capacity for progression and survival under stress. Notably, TNF-α signaling showed opposing associations—correlating positively with response but negatively with survival. This aligns with evidence that while TNF-α can induce acute apoptosis, its chronic activation often fuels hepatic inflammation and tumor progression via the MAPK11 axis.36,37 These findings may inform future studies evaluating adaptive therapeutic strategies over the treatment course, with attention shifting from inducing acute immune clearance to targeting metabolic survival pathways.
Several limitations of this study merit consideration. First, although the PRIME system was validated in an external cohort, the retrospective design and relatively limited sample size warrant further confirmation in large-scale prospective multicenter studies. The requirement for standardized dual-phase CT data and complete clinical information may have introduced selection bias, and patients with decompensated liver function, poor performance status, or infiltrative HCC were not included. Therefore, the applicability of our findings to more severe clinical scenarios should be interpreted with caution. Second, although standardized image preprocessing was performed, variability in CT acquisition protocols across centers remains a potential source of bias. Third, treatment heterogeneity, including variations in systemic agents, interventional modalities, and subsequent therapies after progression, may have influenced overall survival. However, adjustment for subsequent therapy did not materially affect the independent prognostic value of PRIME-S. Finally, the matched imaging-transcriptomic analysis was based on a limited TCGA-LIHC cohort. Although the biological consistency between radiomic patterns and transcriptomic signatures supports the proposed interpretation, further validation with larger matched datasets and longitudinal surveillance data is warranted.
Conclusion
In conclusion, the PRIME system provides a noninvasive framework to independently predict treatment response and OS in unresectable HCC. By distinguishing the associations of local tumor geometry and systemic host status with different clinical endpoints, this study offers valuable insights into the responder paradox and supports the rationale for dual-endpoint assessment. These findings remain exploratory and warrant prospective validation before broader clinical application.
Abbreviations
AFP, alpha-fetoprotein; ALBI, albumin-bilirubin; AST, aspartate aminotransferase; AUC, area under the receiver operating characteristic curve; AUC-t, time-dependent area under the curve; BCLC, Barcelona Clinic Liver Cancer; BMA, Bayesian Model Averaging; CECT, contrast-enhanced computed tomography; CI, confidence interval; CR, complete response; DCR, disease control rate; ECOG-PS, Eastern Cooperative Oncology Group performance status; EHM, extrahepatic metastasis; FSVM, FastSurvivalSVM; GBSA, gradient boosting survival analysis; GO, Gene Ontology; GSEA, gene set enrichment analysis; GTBR, gradient boosting with randomness; HAIC, hepatic arterial infusion chemotherapy; HBV, hepatitis B virus; HCC, hepatocellular carcinoma; HR, hazard ratio; IBS, integrated brier score; KEGG, Kyoto Encyclopedia of Genes and Genomes; LDH, lactate dehydrogenase; LIHC, Liver Hepatocellular Carcinoma; mRECIST, modified Response Evaluation Criteria in Solid Tumors; MON, monocyte count; MRI, magnetic resonance imaging; ORR, objective response rate; OS, overall survival; PRIME, predictive radiomics-integrated multimodal estimation;PD, progressive disease; PNI, prognostic nutritional index; PR, partial response; PT, prothrombin time; RSF, random survival forest; SHAP, SHapley Additive exPlanations; ssGSEA, single-sample gene set enrichment analysis; TACE, transarterial chemoembolization; TCGA, The Cancer Genome Atlas; TCIA, The Cancer Imaging Archive.
Data Sharing Statement
The clinical datasets used and/or analyzed during the current study are available from the corresponding author, Dr. Tao Li, upon reasonable request. The matched transcriptomic and imaging data were obtained from the publicly available The Cancer Imaging Archive (TCIA) and The Cancer Genome Atlas (TCGA) repositories.22 The study source code can be found at https://github.com/LuDDDDDDH/codeformultimodal.
Ethics Approval and Consent to Participate
The studies involving humans were approved by the Ethics Committee of Scientific Research of Shandong Cancer Hospital (ID: SDTHEC202506027). The studies were conducted in accordance with the local legislation and institutional requirements. The Ethics Committee of Scientific Research of Shandong Cancer Hospital exempted patients from informed consent for this retrospective observational study. Patient data confidentiality was strictly maintained and ensured in accordance with the Declaration of Helsinki throughout the study.
Acknowledgments
The authors would like to thank The Cancer Genome Atlas (TCGA) for providing the transcriptomic data and imaging data used in this study.
Author Contributions
DHL: conceptualization, methodology, formal analysis, data curation, writing—original draft, visualization. PFS: methodology, data curation, writing - review & editing, investigation. HL: methodology, software, investigation. ZL, ZHZ, QHC, DLZ, QH, JSJ, YXW: data curation, investigation. ZRD: resources, investigation, supervision. DXW, TL: conceptualization, methodology, software, validation, writing—review and editing, supervision, project administration, funding acquisition. All authors made a significant contribution to the work reported, whether that is in the conception, study design, execution, acquisition of data, analysis and interpretation, or in all these areas; took part in drafting, revising or critically reviewing the article; gave final approval of the version to be published; have agreed on the journal to which the article has been submitted; and agree to be accountable for all aspects of the work.
Funding
This work was supported by the Noncommunicable Chronic Diseases-National Science and Technology Major Project (Grant No. 2026ZD0553200-2026ZD0553203), China Postdoctoral Science Foundation (Grant No. 2025M782095), National Natural Science Foundation of China (Grant No. 82203000), Major basic research of Shandong Provincial Natural Science Foundation (Grant No. ZR2021ZD26), Founds for Independent Cultivation of Innovative Team from Universities in Jinan (Grant No. 2020GXRC023), the Taishan Scholars Program of Shandong Province (tstp20221158, tsqnz20221164), and Shandong Provincial Natural Science Foundation (ZR2022QH300).
Disclosure
The authors report no conflicts of interest in this work.
References
1. Bray F, Laversanne M, Sung H, et al. Global cancer statistics 2022: GLOBOCAN estimates of incidence and mortality worldwide for 36 cancers in 185 countries. CA a Cancer J Clin. 2024;74(3):229–18. doi:10.3322/caac.21834
2. Kudo M, Ren Z, Guo Y, et al. Transarterial chemoembolisation combined with lenvatinib plus pembrolizumab versus dual placebo for unresectable, non-metastatic hepatocellular carcinoma (LEAP-012): a multicentre, randomised, double-blind, Phase 3 study. Lancet. 2025;405(10474):203–215. doi:10.1016/S0140-6736(24)02575-3
3. Sangro B, Kudo M, Erinjeri JP, et al. Durvalumab with or without bevacizumab with transarterial chemoembolisation in hepatocellular carcinoma (EMERALD-1): a multiregional, randomised, double-blind, placebo-controlled, phase 3 study. Lancet. 2025;405(10474):216–232. doi:10.1016/S0140-6736(24)02551-0
4. Lencioni R, Llovet JM. Modified RECIST (mRECIST) assessment for hepatocellular carcinoma. Semin Liver Dis. 2010;30(1):52–60. doi:10.1055/s-0030-1247132
5. Lencioni R, Montal R, Torres F, et al. Objective response by mRECIST as a predictor and potential surrogate end-point of overall survival in advanced HCC. J Hepatol. 2017;66(6):1166–1172. doi:10.1016/j.jhep.2017.01.012
6. Lim M, Espinoza M, Huang Y-H, Franses J, Zhu H, Hsiehchen D. Complete response to immunotherapy in patients with hepatocellular carcinoma. JAMA Network Open. 2025;8(2):e2461735. doi:10.1001/jamanetworkopen.2024.61735
7. Pienta KJ, Goodin PL, Amend SR. Defeating lethal cancer: interrupting the ecologic and evolutionary basis of death from malignancy. CA a Cancer J Clin. 2025;75(3):183–202. doi:10.3322/caac.70000
8. Sibai M, Cervilla S, Grases D, et al. The spatial landscape of cancer hallmarks reveals patterns of tumor ecological dynamics and drug sensitivity. Cell Rep. 2025;44(2):115229. doi:10.1016/j.celrep.2024.115229
9. Valastyan S, Weinberg RA. Tumor metastasis: molecular insights and evolving paradigms. Cell. 2011;147(2):275–292. doi:10.1016/j.cell.2011.09.024
10. Bhattacharya R, Brown JS, Gatenby RA, Ibrahim-Hashim A. A gene for all seasons: the evolutionary consequences of HIF-1 in carcinogenesis, tumor growth and metastasis. Semin Cancer Biol. 2024;102-103:17–24. doi:10.1016/j.semcancer.2024.06.003
11. Lin D-F, Li H-L, Liu T, et al. Radiomic signatures associated with tumor immune heterogeneity predict survival in locally recurrent nasopharyngeal carcinoma. J Natl Cancer Inst. 2024;116(8):1294–1302. doi:10.1093/jnci/djae081
12. Bernatowicz K, Amat R, Prior O, et al. Radiomics signature for dynamic monitoring of tumor inflamed microenvironment and immunotherapy response prediction. J Immunother Cancer. 2025;13(1):e009140. doi:10.1136/jitc-2024-009140
13. Vithayathil M, Koku D, Campani C, et al. Machine learning based radiomic models outperform clinical biomarkers in predicting outcomes after immunotherapy for hepatocellular carcinoma. J Hepatol. 2025;83(4):959–970. doi:10.1016/j.jhep.2025.04.017
14. Xie Y, Wang F, Wei J, et al. Noninvasive prognostic classification of ITH in HCC with multi-omics insights and therapeutic implications. Sci Adv. 2025;11(18):eads8323. doi:10.1126/sciadv.ads8323
15. Yoo S-K, Fitzgerald CW, Cho BA, et al. Prediction of checkpoint inhibitor immunotherapy efficacy for cancer using routine blood tests and clinical data. Nat Med. 2025;31(3):869–880. doi:10.1038/s41591-024-03398-5
16. Johannet P, Sawyers A, Qian Y, et al. Baseline prognostic nutritional index and changes in pretreatment body mass index associate with immunotherapy response in patients with advanced cancer. J Immunother Cancer. 2020;8(2):e001674. doi:10.1136/jitc-2020-001674
17. Captier N, Lerousseau M, Orlhac F, et al. Integration of clinical, pathological, radiological, and transcriptomic data improves prediction for first-line immunotherapy outcome in metastatic non-small cell lung cancer. Nat Commun. 2025;16(1):614. doi:10.1038/s41467-025-55847-5
18. Ma J, He Y, Li F, Han L, You C, Wang B. Segment anything in medical images. Nat Commun. 2024;15(1):654. doi:10.1038/s41467-024-44824-z
19. Wu X, You J, Zhang S, Zhang B. Pretreatment CT-based machine learning radiomics model predicts response in unresectable hepatocellular carcinoma treated with lenvatinib plus PD-1 inhibitors and interventional therapy. J Immunother Cancer. 2024;12(9):e010330. doi:10.1136/jitc-2024-010330
20. van Griethuysen JJM, Fedorov A, Parmar C, et al. Computational radiomics system to decode the radiographic phenotype. Cancer Res. 2017;77(21):e104–e107. doi:10.1158/0008-5472.CAN-17-0339
21. Lundberg SM, Lee SI, et al. A unified approach to interpreting model predictions. In: Guyon I, Luxburg UV, Bengio S, editors. Advances in Neural Information Processing Systems. Neural Information Processing Systems (nips); 2017:Vol. 30.
22. Ally A, Balasundaram M, Carlsen R. Comprehensive and integrative genomic characterization of hepatocellular carcinoma. Cell. 2017;169(7):1327. doi:10.1016/j.cell.2017.05.046
23. Subramanian A, Tamayo P, Mootha VK, et al. Gene set enrichment analysis: a knowledge-based approach for interpreting genome-wide expression profiles. Proc Natl Acad Sci USA. 2005;102(43):15545–15550. doi:10.1073/pnas.0506580102
24. Liberzon A, Birger C, Thorvaldsdottir H, Ghandi M, Mesirov JP, Tamayo P. The molecular signatures database hallmark gene set collection. Cell Syst. 2015;1(6):417–425. doi:10.1016/j.cels.2015.12.004
25. Yu Y, Ning K, Liu X, et al. Effectiveness of prognostic nutritional index in predicting overall survival and evaluating immunotherapy response in anaplastic thyroid carcinoma. Endocrine. 2024;86(1):246–254. doi:10.1007/s12020-024-03826-z
26. Aerts HJWL, Velazquez ER, Leijenaar RTH, et al. Decoding tumour phenotype by noninvasive imaging using a quantitative radiomics approach. Nat Commun. 2014;5(1):4006. doi:10.1038/ncomms5006
27. Lu Y, Sun Q, Guan Q, et al. The XOR-IDH3α axis controls macrophage polarization in hepatocellular carcinoma. J Hepatol. 2023;79(5):1172–1184. doi:10.1016/j.jhep.2023.06.022
28. Liu M, Zhou J, Liu X, et al. Targeting monocyte-intrinsic enhancer reprogramming improves immunotherapy efficacy in hepatocellular carcinoma. Gut. 2020;69(2):365–379. doi:10.1136/gutjnl-2018-317257
29. Campani C, Bamba-Funck J, Campion B, et al. Baseline ALBI score and early variation of serum AFP predicts outcomes in patients with HCC treated by atezolizumab–bevacizumab. Liver Int. 2023;43(3):708–717. doi:10.1111/liv.15487
30. Kim J, Yu L, Chen W, et al. Wild-type p53 promotes cancer metabolic switch by inducing PUMA-dependent suppression of oxidative phosphorylation. Cancer Cell. 2019;35(2):191–203.e8. doi:10.1016/j.ccell.2018.12.012
31. Propper DJ, Balkwill FR. Harnessing cytokines and chemokines for cancer therapy. Nat Rev Clin Oncol. 2022;19(4):237–253. doi:10.1038/s41571-021-00588-9
32. Yuan Z, Li Y, Zhang S, et al. Extracellular matrix remodeling in tumor progression and immune escape: from mechanisms to treatments. Mol Cancer. 2023;22(1):48. doi:10.1186/s12943-023-01744-8
33. Chiu DK-C, Zhang X, Cheng BY-L, et al. Tumor-derived erythropoietin acts as an immunosuppressive switch in cancer immunity. Science. 2025;388(6745):eadr3026. doi:10.1126/science.adr3026
34. Nussinov R, Yavuz BR, Jang H. Molecular principles underlying aggressive cancers. Signal Transduct Target Ther. 2025;10(1):42. doi:10.1038/s41392-025-02129-7
35. Tharp KM, Kersten K, Maller O, et al. Tumor-associated macrophages restrict CD8+ T cell function through collagen deposition and metabolic reprogramming of the breast cancer microenvironment. Nat Cancer. 2024;5(7):1045–1062. doi:10.1038/s43018-024-00775-4
36. Zhu J, Jin M, Wang J, et al. TNFα induces Ca2+ influx to accelerate extrinsic apoptosis in hepatocellular carcinoma cells. J Exp Clin Cancer Res. 2018;37(1):43. doi:10.1186/s13046-018-0714-6
37. Qi D, Lu M, Xu P, et al. Transcription factor ETV4 promotes the development of hepatocellular carcinoma by driving hepatic TNF-α signaling. Cancer Commun. 2023;43(12):1354–1372. doi:10.1002/cac2.12482
 © 2026 The Author(s). This work is published and licensed by Dove Medical Press Limited. The
full terms of this license are available at https://www.dovepress.com/terms
and incorporate the Creative Commons Attribution
- Non Commercial (unported, 4.0) License.
By accessing the work you hereby accept the Terms. Non-commercial uses of the work are permitted
without any further permission from Dove Medical Press Limited, provided the work is properly
attributed. For permission for commercial use of this work, please see paragraphs 4.2 and 5 of our Terms.
© 2026 The Author(s). This work is published and licensed by Dove Medical Press Limited. The
full terms of this license are available at https://www.dovepress.com/terms
and incorporate the Creative Commons Attribution
- Non Commercial (unported, 4.0) License.
By accessing the work you hereby accept the Terms. Non-commercial uses of the work are permitted
without any further permission from Dove Medical Press Limited, provided the work is properly
attributed. For permission for commercial use of this work, please see paragraphs 4.2 and 5 of our Terms.