Back to Journals » Nature and Science of Sleep » Volume 14
Multi-Night at-Home Evaluation of Improved Sleep Detection and Classification with a Memory-Enhanced Consumer Sleep Tracker
Authors Ghorbani S, Golkashani HA ![]() , Chee NIYN, Teo TB, Dicom AR, Yilmaz G, Leong RLF, Ong JL
, Chee NIYN, Teo TB, Dicom AR, Yilmaz G, Leong RLF, Ong JL ![]() , Chee MWL
, Chee MWL ![]()
Received 2 February 2022
Accepted for publication 31 March 2022
Published 14 April 2022 Volume 2022:14 Pages 645—660
DOI https://doi.org/10.2147/NSS.S359789
Checked for plagiarism Yes
Review by Single anonymous peer review
Peer reviewer comments 2
Editor who approved publication: Dr Sarah L Appleton
Shohreh Ghorbani,* Hosein Aghayan Golkashani,* Nicholas IYN Chee, Teck Boon Teo, Andrew Roshan Dicom, Gizem Yilmaz, Ruth LF Leong, Ju Lynn Ong, Michael WL Chee
Centre for Sleep and Cognition, Yong Loo Lin School of Medicine, National University of Singapore, Singapore
*These authors contributed equally to this work
Correspondence: Michael WL Chee, Centre for Sleep and Cognition, Yong Loo Lin School of Medicine, National University of Singapore, MD1 Level 13 Rm 05B, 117549, Singapore, Tel +65 66013199, Email [email protected]
Purpose: To evaluate the benefits of applying an improved sleep detection and staging algorithm on minimally processed multi-sensor wearable data collected from older generation hardware.
Patients and Methods: 58 healthy, East Asian adults aged 23– 69 years (M = 37.10, SD = 13.03, 32 males), each underwent 3 nights of PSG at home, wearing 2nd Generation Oura Rings equipped with additional memory to store raw data from accelerometer, infra-red photoplethysmography and temperature sensors. 2-stage and 4-stage sleep classifications using a new machine-learning algorithm (Gen3) trained on a diverse and independent dataset were compared to the existing consumer algorithm (Gen2) for whole-night and epoch-by-epoch metrics.
Results: Gen 3 outperformed its predecessor with a mean (SD) accuracy of 92.6% (0.04), sensitivity of 94.9% (0.03), and specificity of 78.5% (0.11); corresponding to a 3%, 2.8% and 6.2% improvement from Gen2 across the three nights, with Cohen’s d values > 0.39, t values > 2.69, and p values < 0.01. Notably, Gen 3 showed robust performance comparable to PSG in its assessment of sleep latency, light sleep, rapid eye movement (REM), and wake after sleep onset (WASO) duration. Participants < 40 years of age benefited more from the upgrade with less measurement bias for total sleep time (TST), WASO, light sleep and sleep efficiency compared to those ≥ 40 years. Males showed greater improvements on TST and REM sleep measurement bias compared to females, while females benefitted more for deep sleep measures compared to males.
Conclusion: These results affirm the benefits of applying machine learning and a diverse training dataset to improve sleep measurement of a consumer wearable device. Importantly, collecting raw data with appropriate hardware allows for future advancements in algorithm development or sleep physiology to be retrospectively applied to enhance the value of longitudinal sleep studies.
Keywords: consumer wearable, sleep tracking, validation, sleep staging, sleep detection
Plain Language Summary
Consumer grade sleep-tracking wearables have improved significantly only a few years after their introduction. Sensor technology is relatively mature so improvements in performance will necessarily emerge from new directions. We showcase a machine-learning improved algorithm trained on a large diverse dataset that yields superior sleep classification and staging performance when applied to retrospectively collected wearable data. We ascertain who benefits more from these improvements. Storing multi-modal sensor data in raw form will help future-proof investment in large-scale longitudinal population studies on sleep and could help redefine current thinking about sleep physiology and health.
Introduction
Sleep is a modifiable health risk factor that a growing number of persons wish to measure objectively. The last few years have seen an explosive increase in the development and adoption of affordable wearable or bedside devices to measure sleep.1–4 Daily reports of sleep behaviour when coupled with thoughtfully designed user interfaces, provide a valuable means of monitoring sleep across years, yielding information about weekly, monthly, seasonal, and yearly fluctuations that could contain useful diagnostic and predictive information.5–7
The largest contributor to sleep detection in wearables was from accelerometer data.8 This is a mature technology that has been evaluated using wrist actigraphy in a wide range of studies covering the entire age spectrum,9–11 involving persons with both normal,12,13 and disordered sleep.14–16 Research actigraphs are generally more expensive and until recently, did not include wireless, cloud-based data management that is standard in consumer wearables. Additionally, actigraphy is limited in its ability to capture motionless wake which can lead to bias in actigraphic sleep-wake estimations. As such, additional information beyond that which is captured in traditional actigraphy is beneficial to improve estimation accuracy.
The transition from wake to sleep is accompanied by slower, shallower and more regular respiration,17 decreased heart rate18 together with an increase in heart rate variability,19,20 as well as a rise in distal skin temperature.21,22 Newer generation wearables measure heart rate and heart rate variability using photoplethysmography (PPG) and some also sense temperature. Combining these additional physiological signals with motion data has resulted in improved sleep-wake estimation and sleep stage classification ability.3,7,23,24
Physicians are increasingly being asked about how to interpret data collected from wearables worn by their patients.25 Earlier consumer wearables had relatively poor and variable performance, but newer devices have shown greater accuracy and consistency of sleep assessment which continue to improve.2,5,26,27 To guide their own usage of collected data, most users, clinicians, and researchers, are interested in improvements of two major areas, the detection of sleep and wake, from which bedtime, waketime, wake after sleep onset, total sleep time and sleep efficiency are derived, and secondly, the accuracy and consistency of sleep staging, particularly of slow wave sleep and REM. Researchers intending to use consumer wearables are additionally concerned about whether their collected data can benefit from continued refinements to data collection or processing that may help “future-proof” legacy data.
In the current work, we report improvements using the third generation Oura Ring algorithm (Gen3) for sleep detection and staging. The updated algorithm arose from combined adjustments to raw sensor data usage, improved diversity of training data and improved machine learning.28 These refinements were retrospectively applied to data collected from modified second generation hardware equipped with enhanced memory to collect raw sensor data. Both the detection (2-stage classification) and staging of sleep (4-stage classification) were evaluated using data collected over multiple nights in a home setting, from Asian adults (to establish generalizability over a different racial group) across a wide age range who were not involved in the training data used for algorithm development.
Materials and Methods
Participants and Study Protocol
Sixty participants aged 23–69 years were recruited for the three-night protocol. Participants were screened and those who reported pre-existing sleep, neurological or psychiatric disorders, excessive daytime sleepiness (Epworth Sleepiness Scale29 scores > 10), on wake-promoting medications, and whose body mass index (BMI) > 35 kg/m2 were excluded, resulting in a final sample of 58 (M = 37.10, SD = 13.03, 32 males). Informed consent was obtained before data collection. The Institutional Review Board of the National University of Singapore approved the protocol was in accordance with the principles in the Declaration of Helsinki.
Trained research assistants visited participants’ homes approximately 2 hours before each participant’s habitual bedtime to set up all sleep recording equipment before leaving. Data was typically collected over consecutive nights, but where data collection had to be repeated or rescheduled due to device issues/scheduling conflicts (~7% of records), replacement nights were conducted within a 1-month period. In total, data from 174 nights were collected. Due to technical issues, 17 PSG recordings and Oura Ring measurements were excluded from the final analyses. PSG recordings were excluded either due to early termination of recordings or insufficient data quality for sleep staging due to electrodes falling off during the night. Excluded Oura recordings were due to missing sleep stage data, likely as a result of poor ring fit or movement during the night that impeded PPG recording.
Polysomnography
Polysomnography was collected across all three nights. Electroencephalography was recorded from two channels (C3 and C4) according to the international 10–20 system via the SOMNOtouch devices (SOMNOmedics GmbH, Randersacker, Germany) during overnight sleep. Channels were referenced to the contralateral mastoids. The common ground and reference electrodes were placed at Fpz and Cz, respectively. Electro-oculography (EOG; right and left outer canthi) and submental electromyography (EMG) were also recorded. Finger pulse oximetry and electrocardiogram measures were also obtained. EEG signals were sampled at 256 Hz and impedance was kept at less than 5KΩ for EEG and below 10KΩ for EOG and EMG channels. PSG signals were confined to the period between lights-off and lights-on based on bedtime and wake time reported by participants prior to scoring. Data was autoscored with the Z3Score algorithm (https://z3score.com)30 and visually inspected by trained technicians who did not have access to the Oura data. Scoring of sleep was performed based on standards set by the American Academy of Sleep Medicine (AASM). WASO, REM sleep, N1, N2 and N3 were calculated based on 30-second epochs according to the AASM manual criteria.31
Oura Ring
The Oura Ring (Oura Health Oy, Oulu, Finland) measures heart rate, body temperature, and movement via infrared photoplethysmography (PPG), a temperature sensor, and a 3-D accelerometer.27 Heart rate variability and respiratory rate are inferred measures.
Two “memory” rings (2M) provided by Oura Health were worn on the right and left hands on the same finger that provided the best fit. These had the same sensors as the commercially available 2nd Generation Oura Ring, but had additional flash memory that enabled recording minimally processed sensor data for the retrospective application of the Gen 3 algorithm (hereafter referred to as “Gen 3”) to the collected data. It also allowed the comparison of these results with those obtained from Gen 2 algorithm. Gen 3 was developed using newer machine learning methods on accelerometer, temperature, heart rate, and HRV data collected across 3 diverse samples that varied in racial composition and age.28
Thirty second epoch-by-epoch data was subsequently processed. Sleep epochs were classified into four categories: wake, light, deep, and REM sleep. TST in both Oura and PSG records were defined as total time spent in light sleep (PSG stages N1 and N2), deep sleep (PSG stage N3) and REM sleep. For both Oura and PSG, sleep onset latency (SOL) was defined as the duration between lights-off and the first instance of two consecutively staged sleep epochs, regardless of sleep stage. To ensure accurate PSG-device synchronization, all device time stamps were synchronized with an Internet Time Server. Lights-off and on times were based on the wake and bed-time timings logged by the participants each night and both PSG and Oura data were truncated to match this sleep period.
Discrepancy Analyses
To visualise discrepancies between Gen2, Gen3 and PSG measurements, Bland–Altman plots were generated for each night based on a standardized framework.32 A negative bias represents underestimation by the device compared to PSG. Furthermore, we examined whether bias changed as a function of measurement’s size and the homoscedasticity for each sleep stage. Bland–Altman plots demonstrating device setting-PSG biases for TST, WASO, and sleep-stage analyses are presented in Figures 1 and 2, respectively.
 |
Figure 1 Bland–Altman plots for TST in Gen 2 Gen 3 algorithms. Solid red lines indicate bias. Solid grey lines indicate the 95% level of agreements. Dotted lines indicate 95% CIs. Black points are observations, and the density diagram to the right of each plot represents the distribution of the bias. |
 |
Figure 2 Continue. |
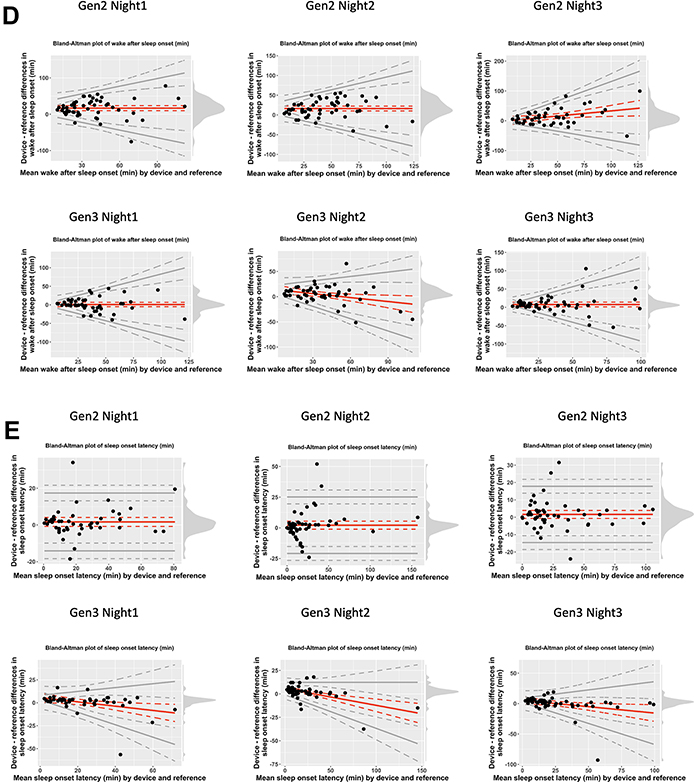 |
Figure 2 Bland–Altman Plots for (A) Light sleep, (B) Deep sleep, (C) REM, (D) WASO, (E) SOL in Gen2 and Gen3 algorithms. Solid red lines indicate bias. Solid grey lines indicate the 95% level of agreements. Dotted lines indicate 95% CIs. Black points are observations, and the density diagram to the right of each plot represents the distribution of the bias. |
We also examined if improvements in sleep measurement differed by sex and age group (<40y vs ≥40y). A linear mixed model analysis was employed for each sleep metric bias (Oura - PSG); with age (<40y vs ≥40y), sex (male/female), BMI, hand (right, left), nights (night 1, night 2, night 3) and Oura algorithm (Gen2, Gen3) as fixed factors. Subjects were treated as a random factor, and PSG-assessed total sleep time was included as a covariate. Interactions of age, sex and BMI with Oura algorithm were also investigated. As we did not find a significant main effect of hand, F(1,510) < 5.68, p > 0.18, only results for the right hand are reported.
A significant main effect of night was observed for TST, REM, WASO and sleep efficiency measurements, F(1,513) > 5.13, p < 0.004, driven by lower measurement bias in the first night, potentially due to decreased TST and increased WASO which could be attributed to a first-night effect.33,34 Each nightly record was thus reported separately. Analyses were performed with and without outliers (subjects with > 3 SD TST bias) to verify that significant interactions were not driven by outliers. Linear mixed model analyses were followed by post-hoc paired t-tests for each sleep measurement bias on each night.
Epoch by Epoch (EBE) Analysis
As 30s epoch-by-epoch data was also available from the Oura Ring, EBE analyses – the preferred approach to assess accuracy of binary (2-stage) and categorical (4-stage) classification32 were performed. Commonly reported agreement metrics of sensitivity (ability of device to correctly identify “sleep”), specificity (ability of device to correctly identify “wake”) and overall accuracy were calculated per subject/night following the equations below, and then averaged across all subjects to obtain group values for each night.
Sensitivity: True Sleep/(False Wake + True Sleep)
Specificity: True Wake/(True Wake + False Sleep)
Accuracy: (True Sleep + True Wake)/Total Epochs
For 4-stage classification metrics, sensitivity (proportion of epochs correctly classified as a given sleep stage), specificity (proportion of epochs correctly not classified as a given sleep stage) as well as accuracy (proportion of correctly classified epochs for a given sleep stage over total epochs) were also computed in a similar manner.
In addition, for 4-stage classification we also inspected Cohen’s kappa coefficient which takes into account agreement metrics occurring by chance as well as the prevalence- and bias-adjusted kappa (PABAK) that adjusts for imbalances in the relative frequency of occurrence of the different sleep stage/wake epochs and bias between PSG and Oura metrics using the equations below:35
Kappa=(Po-Pe)/(1-Pe)
Po: Probability of agreement
Pe: Probability of disagreement (chance)
PABAK=(2 Pe - 0.5)/(1-0.5)=2Po-1
Kappa values are usually interpreted as follows: ≤ 0 indicating no agreement, 0.01–0.20 as none to slight, 0.21–0.40 as fair, 0.41–0.60 as moderate, 0.61–0.80 as substantial, and 0.81–1.00 as almost perfect agreement.
Paired sample t-tests were performed to compare sensitivity, specificity, accuracy, kappa and PABAK scores between Gen2 and Gen3 algorithms. The Cohen’s D effect sizes, t and P values are presented as the minimal value for each of the 3 nights.
Finally, to inspect sources of misclassification, confusion matrices were constructed. These were first generated per subject/night, by dividing values in each cell with the corresponding marginal frequency of the reference PSG measure. Next, confusion matrices were averaged across all subjects to generate group level matrices for each night.
Statistical analyses and data processing were performed using SPSS 27.0 (IBM Corp., Armonk, New York), MATLAB version R2017b (The Math Works, Inc., Natick, MA) and R version 4.1.1 (2021-08-10).
Results
The final sample comprised 58 participants (32 males) aged 23–69 years (M = 37.10, SD = 13.03) with BMI ranging from 17.66–30.48 kg/m2 (M = 22.73, SD = 2.88). PSG-derived sleep architecture for young, <40y (N = 42) and mid-aged, ≥40y (N = 16) adults for each night are presented in Table 1.
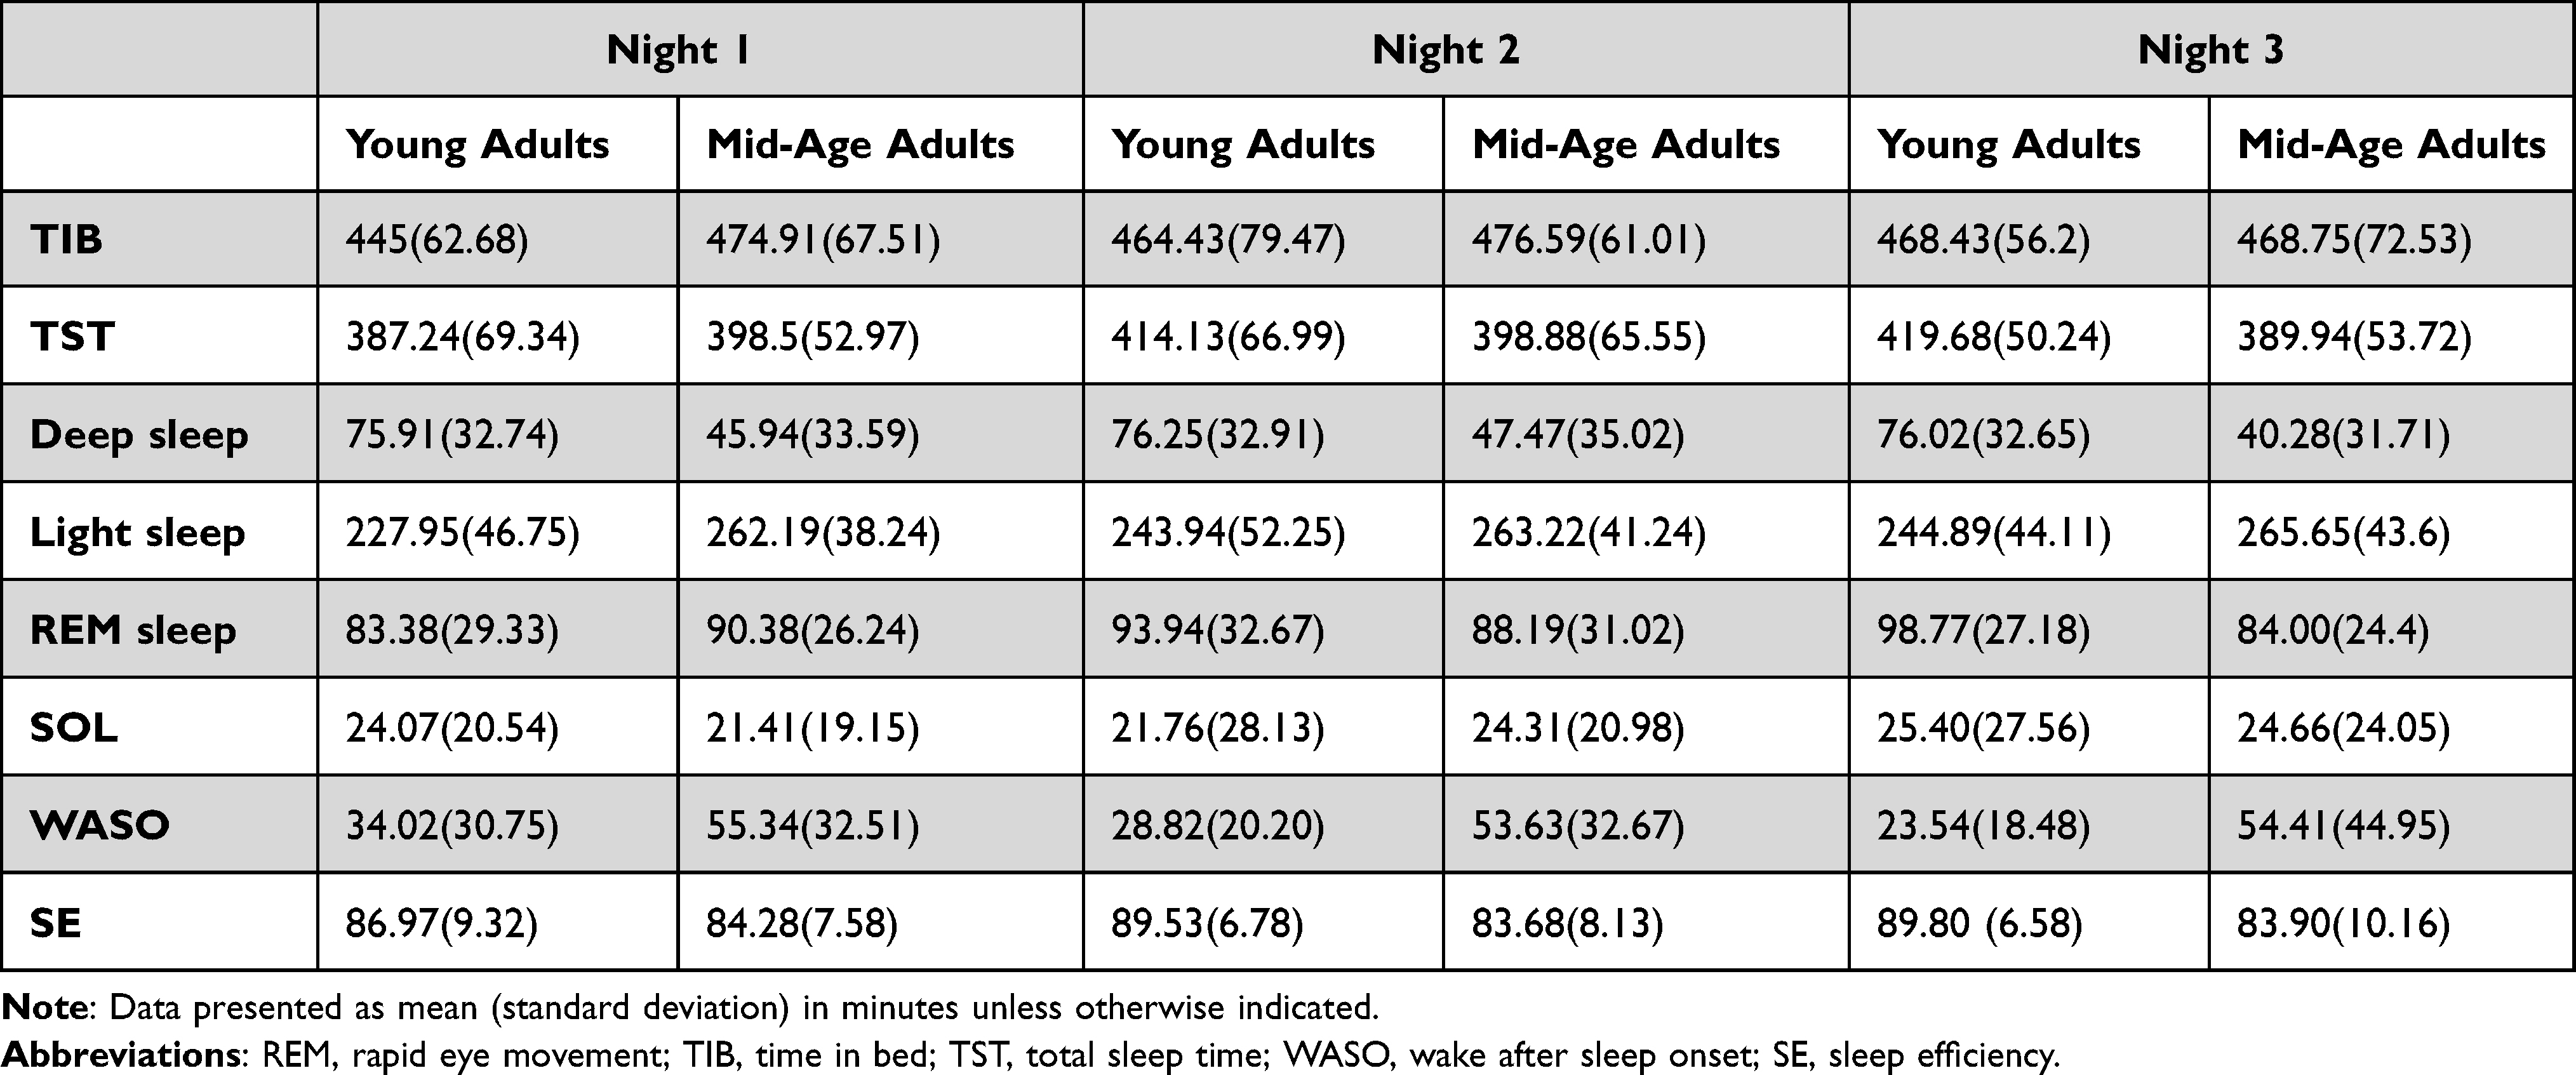 |
Table 1 Polysomnography-Determined Sleep Architecture Across the Nights |
2-Stage Classification Performance
Gen3 showed significantly improved 2-stage sleep-wake classification with a mean (SD) accuracy of 92.6% (0.04) compared with 89.6% (0.05) accuracy of Gen2 across the three nights, with d values > 0.49, t values > 3.70, and p values < 0.001. Additionally, sensitivity and specificity improved by 2.8% to increase the mean from 92.1% (0.05), and 6.2% from 72.3 (0.11), respectively, ds > 0.39, ts > 2.69, ps ≤ 0.01 (Table 2). TST bias also decreased significantly across the nights by a minimum duration of 10 minutes, ds > 0.43, ts > 3.13, ps < 0.01 (Table 3, Figure 1).
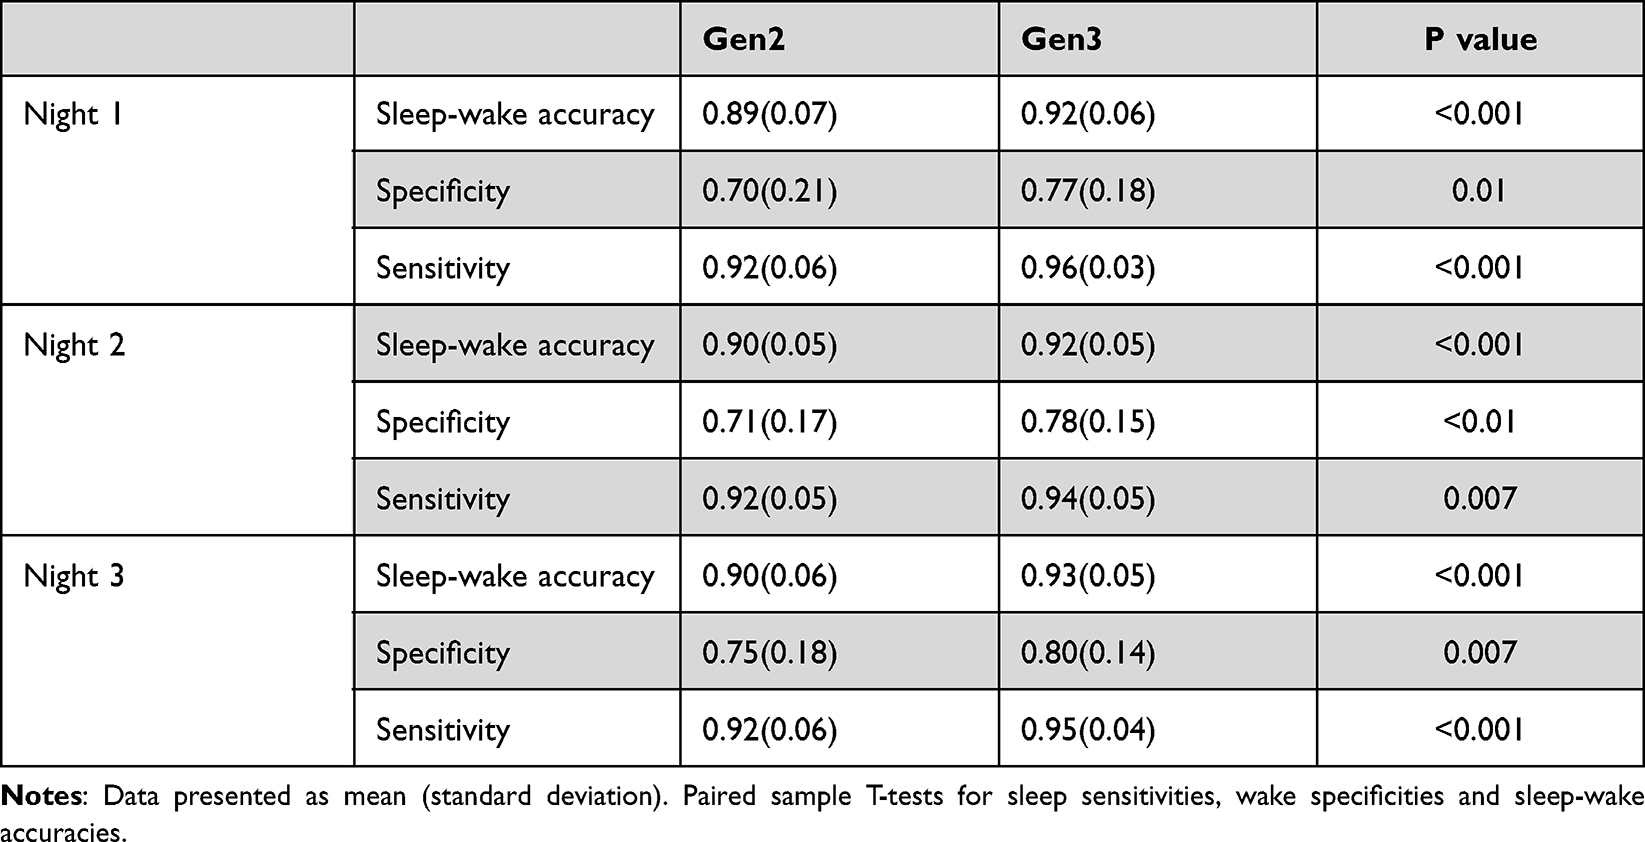 |
Table 2 Epoch by Epoch Agreement Metrics, for Oura Ring Gen2 and Gen3 Algorithms Referenced to PSG |
 |
Table 3 Biases from PSG for Oura Ring Gen2 and Gen3 Algorithms Across 3 Nights |
4-Stage Sleep Classification Performance
Gen3 significantly outperformed Gen2 for all sleep measures, except for SOL, across all 3 nights, ds > 0.36, ts > 2.61, ps < 0.01 (Table 3). Notably, Gen3 performed on par with PSG for light sleep and SOL across all nights, ts < 1.47, ps > 0.14 (Table 3), and for REM sleep and WASO on 2 nights, ts < 1.70, ps > 0.09. While deep sleep was significantly overestimated by Gen2 across all nights (40.8–49.9 minutes), ds > 0.84, ts > 6.05, ps < 0.001; it was significantly underestimated by Gen3 – although to a lesser extent (13.8–14.6 minutes) on 2 nights, ds > 0.46, ts > 3.29, ps < 0.01. Bland-Altman plots for sleep stages are illustrated in Figure 2A–E), and an example hypnogram from one participant is shown in Figure 3 for sleep stages derived using the PSG, Gen2 and Gen3 algorithms.
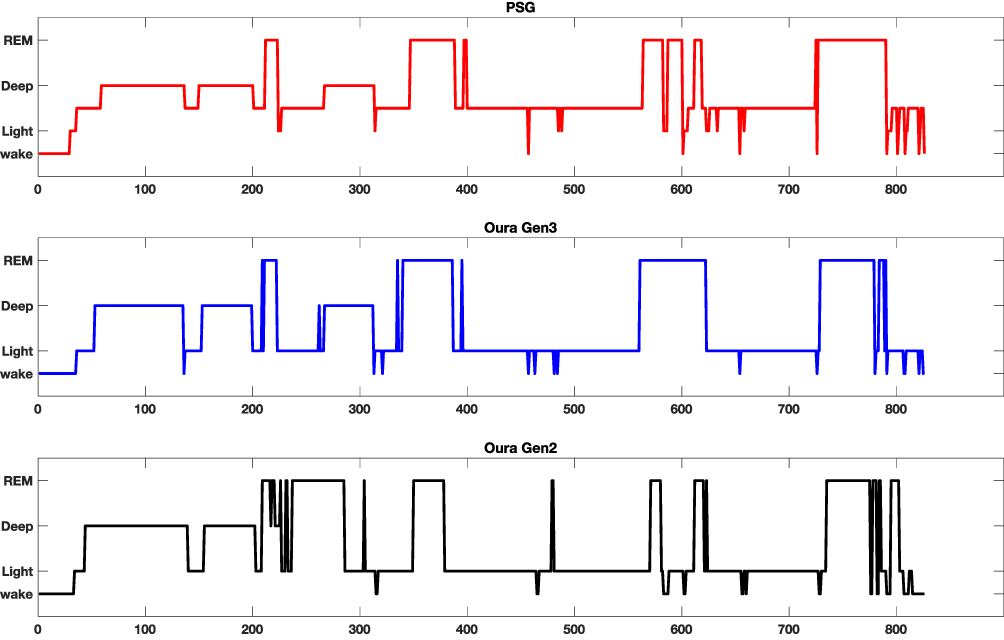 |
Figure 3 Illustrative hypnogram from a single participant showing agreement of PSG, Oura Gen2 and Gen3 sleep staging. Abbreviation: REM, rapid eye movement sleep. |
Gen3 showed significantly improved 4-stage classification with 4-stage mean (SD) accuracy of 76.4% (0.06) over Gen 2ʹs 62.3% (0.07) accuracy, ds > 1.48, ts > 10.95, ps < 0.001. Gen3 algorithm also significantly outperformed Gen2 for all sleep accuracy measures (ds > 0.67, ts > 5.05, ps < 0.001, Table 4), kappa (ds > 0.97, ts > 6.22, ps < 0.001, Table 5) and PABAK values (ds > 0.67, ts > 5.06, ps < 0.001, Table 5) – with moderate to ceiling levels of agreement values (0.56–0.85) shown for Gen3. Epoch by epoch sensitivity and specificity of sleep stages are illustrated in Supplementary Figures S1 and S2.
 |
Table 4 Sleep Stages Accuracy Metrics, Referenced to PSG for Gen2 and Gen3 Algorithms |
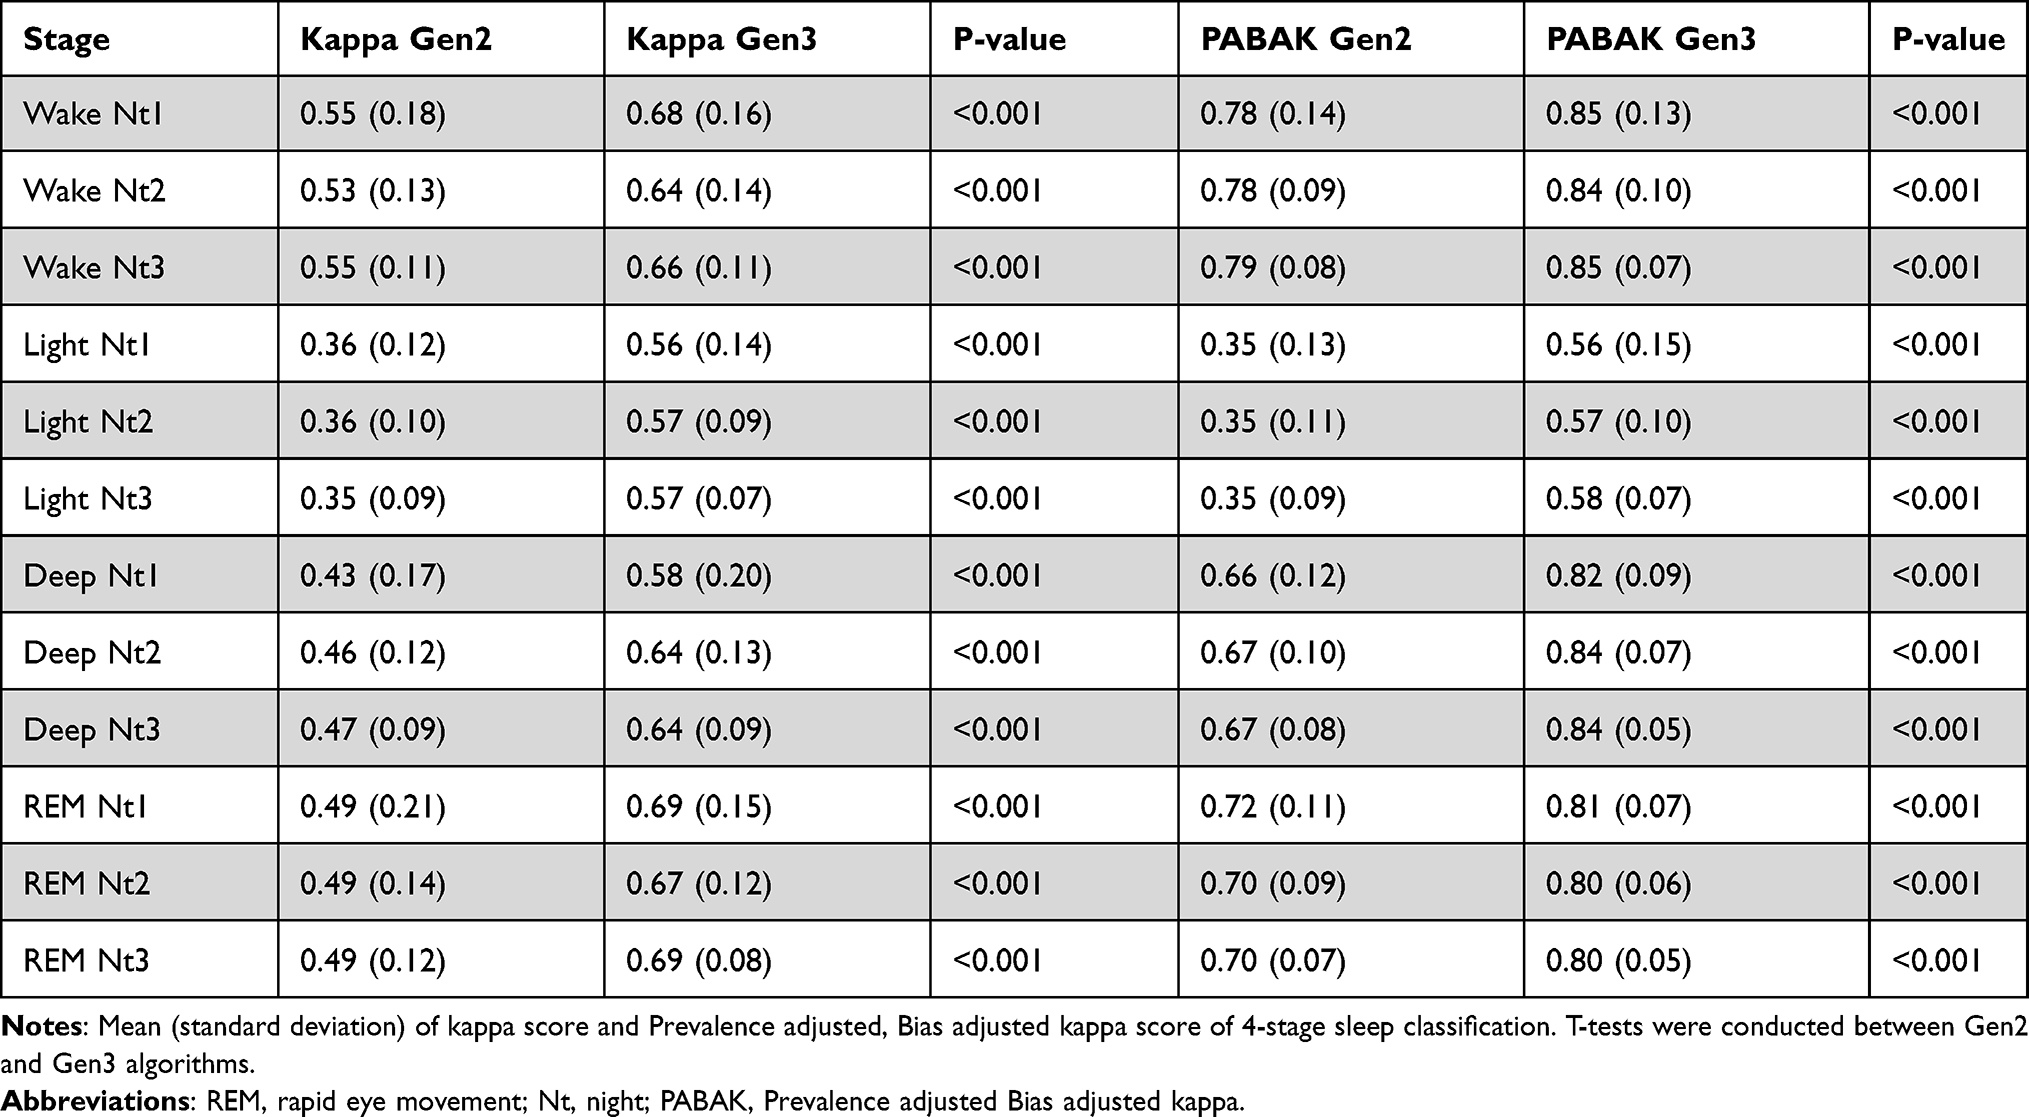 |
Table 5 Kappa and PABAK for 4-Stage Sleep Classification |
When inspecting confusion matrices, it is apparent that both Gen2 and Gen3 algorithms tended to misclassify deep sleep as light sleep (Tables S1 and S2). This occurred 19–28% of the time for Gen2, compared with 34–38% of the time in Gen3. However, although Gen2 classified deep sleep more accurately than Gen3, this came at the cost of poorer classification in wake, light, and REM sleep, resulting in poorer overall performance of the Gen2.
Age and Sex Influences on Sleep Staging Accuracy
Linear mixed model analyses on biases for TST and sleep efficiency showed a significant age group by algorithm interaction (F(1,508) > 10.13, p < 0.002); as well as a significant sex by algorithm interaction (F(1,508) > 4.32, p < 0.04), whereby the Gen3 algorithm outperformed Gen2 in males and in younger participants (Figure 4). For biases of WASO and light sleep, significant interactions of age and algorithm were observed (F(1,510) > 5.68, p < 0.02) wherein younger subjects had higher gains in performance with the Gen3 algorithm (Figure 5). For biases of REM and deep sleep, significant interactions of sex and algorithm (F(1,509) > 5.68, p < 0.03) were driven by better performance of the Gen3 algorithm in males for REM sleep measurement and females for deep sleep (Figure 6). LMM analyses for biases of light and deep sleep also revealed a significant interaction of BMI and algorithm (F(1,510) > 4.08, p < 0.04). However, this effect size was too small to be of clinical significance, and thus not further discussed.
 |
Figure 4 Estimated marginal means of (A) total sleep time and (B) sleep efficiency bias (PSG-Oura) by age group and sex. P < 0.001 ***. Abbreviation: TST, Total sleep time. |
 |
Figure 5 Light sleep and WASO measurement bias in young and old participants. P < 0.01 *; P < 0.001 ***. Abbreviation: WASO, Wake after sleep onset. |
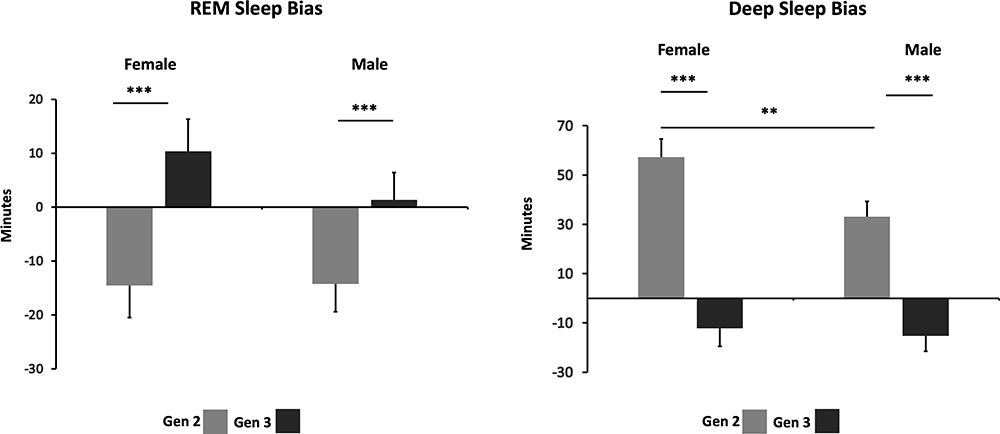 |
Figure 6 REM sleep and deep sleep measurement bias in males and females. P < 0.05 **; P < 0.001 ***. Abbreviation: REM, rapid eye movement sleep. |
Discussion
The present study demonstrates how methodological improvements to sleep classification inferred from movement, heart rate and temperature data acquired through a memory-enhanced consumer sleep tracking device boosted the accuracy of detection and staging of sleep, across a range of ages and over 3 nights of in-home recording. The retrospectively applied algorithm significantly outperformed its predecessor in almost all sleep measurements and was comparable to PSG in its assessment of sleep onset latency, light sleep duration, WASO and REM sleep. Young participants (<40 years) benefited more from the update, with significantly less measurement bias for TST, WASO, light sleep and sleep efficiency compared to those ≥40 years. Males showed greater improvements on TST and REM sleep measurement bias compared to females, while females benefitted more for deep sleep measures compared to males.
Illustrating the rapid improvement in consumer sleep trackers, the Oura Ring has gone through 3 major hardware and algorithm upgrades since its introduction in 2018. The performance of Gen3 reported here in field settings is superior to the reported sensitivity, specificity, and 4-stage classification accuracy of several current generation (as of mid 2021) consumer wearable devices that use PPG and accelerometry.36–39 Improvements from the larger manufacturers are made possible by the application of machine learning to increasingly larger, more diverse and representative datasets.40,41
In particular, the Gen3 algorithm was developed with machine learning using features derived from accelerometry, PPG-derived heart rate variability, temperature, combined with sensor-independent circadian features of sleep that model endogenous circadian rhythms and homeostatic sleep drive.28 Due to large inter-individual differences in physiological measurements, normalization of these features on a per night basis also allowed for better discrimination of sleep stages within an individual. Finally, a large and diverse dataset was used to develop the Gen3 algorithm – utilizing training data from 3400 hours of sleep across 106 persons ranging in age from adolescents to adults ranging from 15–73 years of age from USA, Finland and Singapore.28
In general, improvements in the Gen3 algorithm were greater for younger participants under 40 years old. Younger persons may move more while sleeping compared to mid-age persons, giving rise to an overestimation of WASO and underestimation of total sleep time.42,43 Sex differences in sleep identification could be also related to greater motor activity during sleep observed in males.42,44 Adjusting sensitivity to motion has been shown to improve accelerometry-based sleep-wake classification.44 Interestingly, we did not find a difference between ring metrics worn on either hand, suggesting that hand placement may not matter for sleep assessment - unlike activity trackers that typically show increased step counts when worn on the dominant hand.45
Despite improvements in N2 and REM sleep staging accuracy, classification of N3 sleep remains a challenge particularly for mid-age adults and older. This difficulty is tied to existing limitations in PSG sleep staging rules for groups exhibiting heterogeneous age-related changes in sleep physiology. For example, approximately 50% of older adults manifest slow waves that morphologically resemble those in younger persons but which do not meet AASM voltage criteria of 75 µV, making scoring ambiguous and inconsistent.46 Overall, even the gold-standard PSG is subject to classification errors and inter-scorer differences. There is an average agreement of 80% between human scorers of PSG, and the labels of N3 and N1 in particular tend to demonstrate lower agreement than N2, and REM. This is particularly an issue for N1 for which inter-rater agreement is in the 50% range, and sleep latency is often computed to onset of N2.47–49
To deal with fundamental issues in measurement of slow wave sleep in older persons, some groups have suggested the use of slow-wave activity (SWA) quantification which would preserve the measurement of slow waves by eliminating the current separation of NREM sleep into N2 and N3. Treating NREM sleep as a continuum instead of discrete stages has been advocated46 and tested out in a recent clinical trial.50 This approach has also been used in studies involving acoustic stimulation to boost slow oscillations.51 Recent observations concerning heart rate changes in response to slow oscillations and sigma activity (in the frequency of sleep spindles) also motivate removal of the artificial boundary in NREM sleep classification.52,53 Remapping sleep measurement using autonomic features to microarchitectural features represents an opportunity to advance sleep physiology. A further consideration is the decline in autonomic function in older adults,54 particularly vagal influences during sleep55 that could affect HRV measures used to discriminate NREM and REM sleep.56
While sleep detection and staging improvements are progressive and desirable, they also present a concern with regard to data harmonization in longitudinal population health studies spanning several years or even decades. The initial investment in data collection can be protected by collecting and storing minimally processed sensor data at a temporal resolution that is a good trade-off between data quality, power consumption and speed of wireless data transmission for storage and analysis afforded by the technology of the day. The improved results obtained here were based on applying an updated analysis package to previously collected data and were made possible because the hardware had significantly more on-board memory. This approach should be carefully considered by all groups interested in long-term, population health studies.
Limitations and Future Directions
Additional refinements in sleep/wake identification and sleep staging relative to PSG may be achieved by including age and sex in future models. Additionally, as participants involved in the training dataset28 as well as the present study were pre-selected to be healthy, generalizability of our results to persons with medical conditions, particularly those with sleep or cardiovascular disorders needs to be systematically evaluated. Moreover, only C3 and C4 electrodes were used in this study, which may have limited the detection of slow waves in elderly subjects.
As of the time of writing, Oura has not finalized the “Gen 3” methodology for sleep stage classification in its commercial product and results of the finally released version may differ from those reported here. If anything, this underscores our points that methodology is still improving and it is valuable to collect data in a manner that allows retrospective applications of such constant developments.
Conclusion
We provided a multi-night, in-field demonstration of the benefits of applying machine learning on large and diverse training data to refine sleep/wake detection and sleep staging in previously collected, minimally processed data. These findings provide clear evidence for the potential of consumer grade tools to collect data on sleep in population health studies that can be upgraded over time as our understanding of sleep physiology and its correlation with health and wellbeing evolve.
Data Sharing Statement
Anonymized data are available from the authors (Dr. Ong Ju Lynn [email protected], and Dr. Golkashani [email protected]) upon reasonable request, subject to review by an ethics committee.
Acknowledgments
We would like to thank Hannu Kinnunen, for his thoughtful comments and discussions. We also thank Shamsul Azrin Bin Jamaludin, Chua Xin Yu, Nicole Yu, Christina Chen, Lau Te Yang, Kian Wong, Zhenghao Pu, Alyssa Ng and Centre for Sleep and Cognition research staff for their help in data collection and sleep scoring.
Funding
Oura Health provided the “memory” rings used for this research. This work was supported by a grant awarded to Michael Chee from the National Medical Research Council Singapore (STAR19may-0001), and support funds for the Centre for Sleep and Cognition at the Yong Loo Lin School of Medicine, National University of Singapore. Dr. Chee’s laboratory receives funding support from Oura Health for the testing of Oura devices and for co-development of new methods to measure sleep and sleep related physiology.
Disclosure
Michael Chee and Ju Lynn Ong have a patent for the Z3-score framework. The authors report other conflicts of interest in this work.
References
1. Liang J, Xian D, Liu X, et al. Usability study of mainstream wearable fitness devices: feature analysis and system usability scale evaluation. JMIR mhealth uhealth. 2018;6(11):e11066. doi:10.2196/11066
2. Kwon S, Kim H, Yeo WH. Recent advances in wearable sensors and portable electronics for sleep monitoring. iScience. 2021;24(5):102461. doi:10.1016/j.isci.2021.102461
3. de Zambotti M, Cellini N, Goldstone A, Colrain IM, Baker FC. Wearable sleep technology in clinical and research settings. Med Sci Sports Exerc. 2019;51(7):1538–1557. doi:10.1249/MSS.0000000000001947
4. Chong KPL, Guo JZ, Deng X, Woo BKP. Consumer perceptions of wearable technology devices: retrospective review and analysis. JMIR mhealth uhealth. 2020;8(4):e17544. doi:10.2196/17544
5. Perez-Pozuelo I, Zhai B, Palotti J, et al. The future of sleep health: a data-driven revolution in sleep science and medicine. NPJ Digit Med. 2020;3(1):42. doi:10.1038/s41746-020-0244-4
6. Grandner MA, Lujan MR, Ghani SB. Sleep-tracking technology in scientific research: looking to the future. Sleep. 2021;44(5). doi:10.1093/sleep/zsab071
7. de Zambotti M, Cellini N, Menghini L, Sarlo M, Baker FC. Sensors capabilities, performance, and use of consumer sleep technology. Sleep Med Clin. 2020;15(1):1–30. doi:10.1016/j.jsmc.2019.11.003
8. Van de Water ALEXANDERTM, Holmes A, Hurley DA. Objective measurements of sleep for non-laboratory settings as alternatives to polysomnography - A systematic review. J Sleep Res. 2011;20(1pt2):183–200. doi:10.1111/j.1365-2869.2009.00814.x
9. Meltzer LJ, Hiruma LS, Avis K, Montgomery-Downs H, Valentin J. Comparison of a commercial accelerometer with polysomnography and actigraphy in children and adolescents. Sleep. 2015;38(8):1323–1330. doi:10.5665/sleep.4918
10. Schoch SF, Kurth S, Werner H. Actigraphy in sleep research with infants and young children: current practices and future benefits of standardized reporting. J Sleep Res. 2021;30(3):e13134. doi:10.1111/jsr.13134
11. Neikrug AB, Chen IY, Palmer JR, et al. Characterizing behavioral activity rhythms in older adults using actigraphy. Sensors. 2020;20(2):549. doi:10.3390/s20020549
12. Ancoli-Israel S, Cole R, Alessi C, Chambers M, Moorcroft W, Pollak CP. The role of actigraphy in the study of sleep and circadian rhythms. Sleep. 2003;26(3):342–392. doi:10.1093/sleep/26.3.342
13. Sadeh A. The role and validity of actigraphy in sleep medicine: an update. Sleep Med Rev. 2011;15(4):259–267. doi:10.1016/j.smrv.2010.10.001
14. Smith MT, McCrae CS, Cheung J, et al. Use of actigraphy for the evaluation of sleep disorders and circadian rhythm sleep-wake disorders: an American academy of sleep medicine systematic review, meta-analysis, and GRADE assessment. J Clin Sleep Med. 2018;14(7):1209–1230. doi:10.5664/jcsm.7228
15. Lewis C, Lewis K, Kitchiner N, Isaac S, Jones I, Bisson JI. Sleep disturbance in post-traumatic stress disorder (PTSD): a systematic review and meta-analysis of actigraphy studies. Eur J Psychotraumatol. 2020;11(1):1767349. doi:10.1080/20008198.2020.1767349
16. De Crescenzo F, Licchelli S, Ciabattini M, et al. The use of actigraphy in the monitoring of sleep and activity in ADHD: a meta-analysis. Sleep Med Rev. 2016;26:9–20. doi:10.1016/j.smrv.2015.04.002
17. Colrain IM, Trinder J, Fraser G, Wilson GV. Ventilation during sleep onset. J Appl Physiol. 1987;63(5):2067–2074. doi:10.1152/jappl.1987.63.5.2067
18. Burgess HJ, Kleiman J, Trinder J. Cardiac activity during sleep onset. Psychophysiology. 1999;36(3):298–306. doi:10.1017/s0048577299980198
19. Toscani L, Gangemi PF, Parigi A, et al. Human heart rate variability and sleep stages. Ital J Neurol Sci. 1996;17(6):437–439. doi:10.1007/BF01997720
20. Xiao M, Yan H, Song J, Yang Y, Yang X. Sleep stages classification based on heart rate variability and random forest. Biomed Signal Process Control. 2013;8(6):624–633. doi:10.1016/j.bspc.2013.06.001
21. Raymann RJ, Swaab DF, Van Someren EJ. Skin temperature and sleep-onset latency: changes with age and insomnia. Physiol Behav. 2007;90(2–3):257–266. doi:10.1016/j.physbeh.2006.09.008
22. Cuesta M, Boudreau P, Cermakian N, Boivin DB. Skin temperature rhythms in humans respond to changes in the timing of sleep and light. J Biol Rhythms. 2017;32(3):257–273. doi:10.1177/0748730417702974
23. Beattie Z, Oyang Y, Statan A, et al. Estimation of sleep stages in a healthy adult population from optical plethysmography and accelerometer signals. Physiol Meas. 2017;38(11):1968–1979. doi:10.1088/1361-6579/aa9047
24. Rentz LE, Ulman HK, Galster SM. Deconstructing commercial wearable technology: contributions toward accurate and free-living monitoring of sleep. Sensors. 2021;21(15):5071. doi:10.3390/s21155071
25. Khosla S, Deak MC, Gault D, et al. Consumer sleep technology: an American academy of sleep medicine position statement. J Clin Sleep Med. 2018;14(5):877–880. doi:10.5664/jcsm.7128
26. Chinoy ED, Cuellar JA, Huwa KE, et al. Performance of seven consumer sleep-tracking devices compared with polysomnography. Sleep. 2021;44(5). doi:10.1093/sleep/zsaa291
27. Roberts DM, Schade MM, Mathew GM, Gartenberg D, Buxton OM. Detecting sleep using heart rate and motion data from multisensor consumer-grade wearables, relative to wrist actigraphy and polysomnography. Sleep. 2020;43(7). doi:10.1093/sleep/zsaa045
28. Altini M, Kinnunen H. The promise of sleep: a multi-sensor approach for accurate sleep stage detection using the Oura Ring. Sensors. 2021;21(13). doi:10.3390/s21134302
29. Johns MW. A new method for measuring daytime sleepiness: the Epworth sleepiness scale. sleep. 1991;14(6):540–545. doi:10.1093/sleep/14.6.540
30. Patanaik A, Ong JL, Gooley JJ, Ancoli-Israel S, Chee MWL. An end-to-end framework for real-time automatic sleep stage classification. Sleep. 2018;41(5). doi:10.1093/sleep/zsy041
31. Ibert C, Ancoli-Israel S, Chesson A, The QS. AASM Manual for the Scoring of Sleep and Associated Events: Rules, Terminology and Technical Specification. Westchester: American Academy of Sleep Medicine; 2007.
32. Menghini L, Cellini N, Goldstone A, Baker FC, de Zambotti M. A standardized framework for testing the performance of sleep-tracking technology: step-by-step guidelines and open-source code. Sleep. 2021;44(2). doi:10.1093/sleep/zsaa170
33. Lorenzo JL, Barbanoj MJ. Variability of sleep parameters across multiple laboratory sessions in healthy young subjects: the “very first night effect”. Psychophysiology. 2002;39(4):409–413. doi:10.1111/1469-8986.3940409
34. Tamaki M, Nittono H, Hayashi M, Hori T. Examination of the first-night effect during the sleep-onset period. Sleep. 2005;28(2):195–202. doi:10.1093/sleep/28.2.195
35. Byrt T, Bishop J, Carlin JB. Bias, prevalence and kappa. J Clin Epidemiol. 1993;46(5):423–429. doi:10.1016/0895-4356(93)90018-v
36. Haghayegh S, Khoshnevis S, Smolensky MH, Diller KR, Castriotta RJ. Accuracy of wristband fitbit models in assessing sleep: systematic review and meta-analysis. J Med Internet Res. 2019;21(11):e16273. doi:10.2196/16273
37. Miller DJ, Lastella M, Scanlan AT, et al. A validation study of the WHOOP strap against polysomnography to assess sleep. J Sports Sci. 2020;38(22):2631–2636. doi:10.1080/02640414.2020.1797448
38. Walch O, Huang Y, Forger D, Goldstein C. Sleep stage prediction with raw acceleration and photoplethysmography heart rate data derived from a consumer wearable device. Sleep. 2019;42(12). doi:10.1093/sleep/zsz180
39. Stone JD, Rentz LE, Forsey J, et al. Evaluations of commercial sleep technologies for objective monitoring during routine sleeping conditions. Nat Sci Sleep. 2020;12:821–842. doi:10.2147/NSS.S270705
40. Liang Z, Martell MAC. Achieving accurate ubiquitous sleep sensing with consumer wearable activity wristbands using multi-class imbalanced classification. IEEE; 2019:768–775.
41. Liang Z, Chapa-Martell MA. Combining resampling and machine learning to improve sleep-wake detection of Fitbit wristbands. IEEE; 2019:1–3.
42. Meltzer LJ, Short M, Booster GD, et al. Pediatric motor activity during sleep as measured by actigraphy. Sleep. 2019;42(1). doi:10.1093/sleep/zsy196
43. Short MA, Gradisar M, Lack LC, Wright H, Carskadon MA. The discrepancy between actigraphic and sleep diary measures of sleep in adolescents. Sleep Med. 2012;13(4):378–384. doi:10.1016/j.sleep.2011.11.005
44. Lee XK, Chee N, Ong JL, et al. Validation of a consumer sleep wearable device with actigraphy and polysomnography in adolescents across sleep opportunity manipulations. J Clin Sleep Med. 2019;15(9):1337–1346. doi:10.5664/jcsm.7932
45. Park S, Toth LP, Hibbing PR, et al. Dominant vs. non-dominant wrist placement of activity monitors: impact on steps per day. JMPB. 2019;2(2):118–123. doi:10.1123/jmpb.2018-0060
46. Muehlroth BE, Werkle-Bergner M. Understanding the interplay of sleep and aging: methodological challenges. Psychophysiology. 2020;57(3):e13523. doi:10.1111/psyp.13523
47. Basner M, Griefahn B, Penzel T. Inter-rater agreement in sleep stage classification between centers with different backgrounds. Somnologie. 2008;12(1):75–84. doi:10.1007/s11818-008-0327-y
48. Rosenberg RS, Van Hout S. The American academy of sleep medicine inter-scorer reliability program: sleep stage scoring. J Clin Sleep Med. 2013;9(1):81–87. doi:10.5664/jcsm.2350
49. Danker‐Hopfe H, Kunz D, Gruber G, et al. Interrater reliability between scorers from eight European sleep laboratories in subjects with different sleep disorders. J Sleep Res. 2004;13(1):63–69. doi:10.1046/j.1365-2869.2003.00375.x
50. Lucey BP, Wisch J, Boerwinkle AH, et al. Sleep and longitudinal cognitive performance in preclinical and early symptomatic Alzheimer’s disease. Brain. 2021;144(9):2852–2862. doi:10.1093/brain/awab272
51. Papalambros NA, Santostasi G, Malkani RG, et al. Acoustic enhancement of sleep slow oscillations and concomitant memory improvement in older adults. Front Hum Neurosci. 2017;11:109. doi:10.3389/fnhum.2017.00109
52. Mikutta C, Wenke M, Spiegelhalder K, et al. Co-ordination of brain and heart oscillations during non-rapid eye movement sleep. J Sleep Res. 2021;31(2):e13466. doi:10.1111/jsr.13466
53. Naji M, Krishnan GP, McDevitt EA, Bazhenov M, Mednick SC. Coupling of autonomic and central events during sleep benefits declarative memory consolidation. Neurobiol Learn Mem. 2019;157:139–150. doi:10.1016/j.nlm.2018.12.008
54. Lipsitz LA, Novak V. Aging and the autonomic nervous system. In: Primer on the Autonomic Nervous System. Elsevier; 2012:271–273.
55. Chen PC, Sattari N, Whitehurst LN, Mednick SC. Age-related losses in cardiac autonomic activity during a daytime nap. Psychophysiology. 2021;58(7):e13701. doi:10.1111/psyp.13701
56. de Zambotti M, Trinder J, Silvani A, Colrain IM, Baker FC. Dynamic coupling between the central and autonomic nervous systems during sleep: a review. Neurosci Biobehav Rev. 2018;90:84–103. doi:10.1016/j.neubiorev.2018.03.027
 © 2022 The Author(s). This work is published and licensed by Dove Medical Press Limited. The
full terms of this license are available at https://www.dovepress.com/terms
and incorporate the Creative Commons Attribution
- Non Commercial (unported, 3.0) License.
By accessing the work you hereby accept the Terms. Non-commercial uses of the work are permitted
without any further permission from Dove Medical Press Limited, provided the work is properly
attributed. For permission for commercial use of this work, please see paragraphs 4.2 and 5 of our Terms.
© 2022 The Author(s). This work is published and licensed by Dove Medical Press Limited. The
full terms of this license are available at https://www.dovepress.com/terms
and incorporate the Creative Commons Attribution
- Non Commercial (unported, 3.0) License.
By accessing the work you hereby accept the Terms. Non-commercial uses of the work are permitted
without any further permission from Dove Medical Press Limited, provided the work is properly
attributed. For permission for commercial use of this work, please see paragraphs 4.2 and 5 of our Terms.