Back to Journals » Clinical and Experimental Gastroenterology » Volume 18
Multi-Components in Modified Tongyou Decoction Targeting Akt/mTOR to Modulate Esophageal Cancer Cell Autophagy via Network Pharmacology Integrated with Experimental Verification
Authors Tian Y, Zhang J, Yu Y, Hegyi G, Csaszi AI ![]() , Zhang W, Yan X, Kong L, Jia Y
, Zhang W, Yan X, Kong L, Jia Y ![]()
Received 14 August 2025
Accepted for publication 10 December 2025
Published 18 December 2025 Volume 2025:18 Pages 305—325
DOI https://doi.org/10.2147/CEG.S560771
Checked for plagiarism Yes
Review by Single anonymous peer review
Peer reviewer comments 2
Editor who approved publication: Professor Vipul Yagnik
Yingying Tian,1,* Jing Zhang,1,* Yueyue Yu,1 Gabriella Hegyi,2 Andras Istvan Csaszi,2 Wenli Zhang,3 Xin Yan,1 Lingyu Kong,4 Yongsen Jia1
1Chinese Medicine School, North China University of Science and Technology, Tangshan, Hebei, 063210, People’s Republic of China; 2Faculty of Health Science, University of Pecs, Baranya, 7621, Hungary; 3Comprehensive Test and Analysis Center, North China University of Science and Technology, Tangshan, Hebei, 063210, People’s Republic of China; 4Affiliated Hospital, North China University of Science and Technology, Tangshan, Hebei, 063000, People’s Republic of China
*These authors contributed equally to this work
Correspondence: Yongsen Jia, Chinese Medicine School, North China University of Science and Technology, 21# Bohai Road, Tangshan, Hebei, 063210, People’s Republic of China, Email [email protected]
Objective: To identify active components of Modified Tongyou Decoction (MTD) acting on esophageal cancer (EC) cell autophagy and their potential targets on Akt/mTOR pathway via network pharmacology integrated with experimental validation in vitro.
Methods: Data mining of EC-related target genes was performed. Protein-protein interaction (PPI) network and core target analysis were conducted, followed by analysis of the relevant autophagy pathway. Active compound docking with key targets was performed. Medicated serum of MTD was prepared from Sprague–Dawley (SD) rats that received intragastric administration of low (LD), medium (MD), and high-dose (HD) MTD. Concentrations of the top active compounds in the serum were measured with HPLC. EC TE-1 cells were cultured in medicated serum. Autophagic acidic vesicles and autophagosomes were observed. Protein expression of autophagy-related and Akt/ mTOR pathway molecules was assayed. Protein expression of LC3 was determined. mRNA expression of Beclin-1 was measured.
Results: The top four active compounds were quercetin, baicalein, luteolin, and β-sitosterol. The top four targets were TP53, CTNB1, EGFR, and Akt. Akt and mTOR were intersecting molecules involved in the EC autophagy pathway. The top compounds co-targeted Akt equally. Concentrations of the top compounds in the medicated serum accounted for 14– 15%. MD increased the fluorescence intensity of acidic autophagy vesicles. LD and MD promoted an increase in autophagosomes. HD strongly affected Beclin-1, LC3, Akt, and mTOR. MD inhibited protein expression of p62 but promoted LC3 fluorescence intensity. These three doses had equal effects on mRNA expression of Beclin-1.
Conclusion: MTD specifically promotes EC autophagy depending on multiple components and specifically targets Akt/mTOR signaling pathway. MTD shows clear activity in EC cell autophagy regulated by the Akt/mTOR pathway.
Keywords: esophageal cancer, modified Tongyou decoction, cell autophagy, Akt/mTOR pathway, network pharmacology, molecular docking
Introduction
According to the International Agency for Research on Cancer in 2024, there are approximately 250,000 new cases of esophageal cancer (EC) per year, globally, of which Chinese cases account for more than half.1,2 Current treatments mainly include surgery, endoscopy, radiation, targeted drugs, immunotherapy and integrated therapy. Although these methods have reliable effects, they are accompanied by unavoidable side effects.
Chinese polyherbal formula is one of complementary therapeutical approaches for EC. Li Dongyuan, a famous medical scholar in the Jin-Yuan Dynasty, created the Tongyou Decoction, which has been used for EC in clinics for hundreds of years. Based on this formulation, with Chinese Medical Pharmacology theory, Modified Tongyou Decoction (MTD) was developed and patented in China.3 Studies have shown that MTD integrated thermotherapy and radiotherapy inhibit EC development, promote quality of life and improve five-year survival rates in clinics.4,5 A series of laboratory studies proved that MTD played a key role in treating EC related to protein kinase B (PKB, Akt), nuclear transcription factor–kappaB (NF–κB) signaling pathways, and related molecular biological processes.6,7 Furthermore, studies showed that MTD can inhibit vasculogenesis, cell invasion, and metastasis by affecting EMT-related and NF-κB/HIF-1α signaling pathways.8,9 All the above comprehensively elucidated the potential mechanism of MTD with multiple targets in EC treatment.
EC cell autophagy is a process of cell death, that is, re-utilization in lysosomes after intracellular proteins or organelles are destroyed.10 Chinese herbs are promising for promoting autophagy in EC cells.11 Studies have reported that herbal ingredients activate autophagy by blocking the Akt/mammalian target of rapamycin (mTOR) pathway and play an inhibitory role in EC cells.12
Although the mentioned studies offered evidence on MTD anti-EC activity, specific compounds of MTD remain undefined in EC cell autophagy. Exploring active components precisely and their targets on cell autophagy will enrich molecular mechanism of the formula anti-EC.
Under the condition that systematic biology theory is combined with Chinese Medicine, network pharmacology has developed and progressed in recent years. This research method offers a scientific way to elucidate active compounds in Chinese herbs and their targets.
Based on network pharmacology, the study explored molecular mechanism by which MTD improves EC TE-1 cells autophagy in vitro.
Materials and Methods
There are two parts in sequence about the study. In silico, network pharmacology is conducted to find the top active compounds in MTD and the correlated targets, followed by molecular docking to find the key molecules close-binding to the top active compounds. In vitro, medicated serum of MTD was prepared and the active compounds were determined with HPLC. TE-1 cells were cultured with the serum, followed by comprehensive molecular biological assays to validate the finding in silico.
Screening Active Compounds and Targets of MTD
The relevant MTD comprised the following herbs: Prunus persica (L). Batsch (Prunus davidiana [Carrière] Franch, Tao Ren, TR); Carthamus tinctorius L. (Hong Hua, HH); Areca catechu L. (Bing Lang, BL); Actaea cimicifuga L. (Actaea dahurica [Turcz. ex Fisch. and C.A.Mey.] Franch; Actaea heracleifolia (Kom). J. Compton, Sheng Ma, SM); and Scleromitrion diffusum (Willd). R.J. Wang (Bai Hua She She Cao, BHSSC), Scutellaria barbata D. Don. (Portulaca grandiflora Hook, Ban Zhi Lian, BZL). The names of the six Chinese herbs were verified using Medicinal Plant Names Services (http://mpns.kew.org). To explore the TCM Systems Pharmacology Database (TCMSP, https://tcmsp.91medicine.cn/#/home), “Tao Ren,” “Hong Hua,” “Ban Zhi Lian,” “Bai Hua She She Cao,” “Sheng Ma,” and “Bin Lang” were used as keywords to search for chemical compositions under the entry “Herb name.” Oral Bioavailability (OB) ≥30% and drug-likeness (DL) ≥0.18 were set as screening criteria. The Simplified Molecular Input Line Entry (SMILE) names of the major compounds were obtained from PubChem (https://pubchem.ncbi.nlm.nih.gov/) and those of the insufficient supplements from NovoPro Bio (https://novopro.cn) were combined. The SMILE name was introduced in Swiss Target Prediction (http://swisstargetprediction.ch/index.php) to limit the study object to Homo sapiens, and a probability of >0 was adopted for screening to remove other irrelevant genes and obtain the main target proteins of MTD.
Data Mining on EC-Related Target Genes
Target genes associated with EC were retrieved using the keyword “Esophageal cancer” in the human genome-annotated card database (http://genecards.org). The obtained targets were recorded in EXCEL, and the “MEDIAN” function was used to screen the relevance score. The same process was conducted using the Online Mendelian Inheritance in Man (OMIM) database. To obtain the common target genes of the two databases, the collected target genes were screened and duplicated genes were deleted.
“Drug–Disease” Target Mapping and Protein–Protein Interaction (PPI) Network Construction
The corresponding targets of the active compounds in MTD were titled “drugs,” and the targets related to EC were titled “diseases.” Active compounds and potential targets were obtained using Venny 2.1.0 of BioinfoGP (https://bioinfogp.cnb.csic.es/tools/venny). A Venn diagram was then constructed.
The intersection targets of “drug–disease” were imported into the online STRING platform, the study species was limited to “Homo sapiens” and “minimum required interaction score≥0.9”, and the interrupted nodes of the network were hidden. The saved tsv format was imported into Cytoscape3.9.1 software, and the CentiscaPe2.2 tool was used to analyze network topological parameters, including degree, betweenness, and closeness centrality. The built-in Molecular Complex Detection (MCODE) tool was used to perform cluster analysis on the network; K-Core was set to 2.0, and module scores of >2 were clustered and sorted. Intersection target proteins were imported into the STRING database to construct the PPI network.
Construction and Analysis of the “Herbs in MTD - Active Compounds - Predicted Targets” Network
Active compounds and intersection targets were predicted using “Herbs in MTD - active compounds - predicted targets.” The network was analyzed using Cytoscape3.9.1. Key compounds were screened based on the connections between the active compounds and intersection targets.
Core Targets Enrichment Analysis
The “drug–disease” core targets were imported into the Metascape database for Gene Ontology (GO) and Kyoto Encyclopedia of Genes and Genomes (KEGG). The top 10 GO terms were imported into a micro-bioinformatics database (http://www.bioinformatics.com.cn). The top 30 pathways were selected for visual representation, bubble plots were created, and KEGG visualizations for core target genes and corresponding bubble charts were constructed.
Molecular Docking for MTD Compounds and Key Target Proteins
Molecular docking was used to determine the relationships between the core target proteins screened from the PPI network and the top active compounds using Cytoscape 3.9.1. The 2D structural diagram of the active compounds from PubChem (https://pubchem.ncbi.nlm.nih.gov/) and the 3D structural diagram from the RCSB Protein Data Bank (PDB; http://www.rcsb.org/) were downloaded. These two types of diagram were uploaded to AutoDock Tools 1.5.7 for molecular docking. Conformations were screened and visualized using PyMOL.
Preparation of Medicated Serum
Six herbs used in the MTD were purchased from Tongrentang Pharmacy Co. Ltd: Prunus persica (L). Batsch. (Tao Ren, TR) 5 g; Carthamus tinctorius L. (Hong Hua, HH) 15 g; Areca catechu L. (Bing Lang, BL) 5 g; Actaea cimicifuga L. (Sheng Ma, SM) 10 g; Scleromitrion diffusum (Willd). R.J.Wang. (Bai Hua She She Cao, BHSSC) 15 g; and Scutellaria barbata D. Don. (Ban Zhi Lian, BZL) 15 g. All herbs were soaked in MilliQ water (volume ratio of herbs to water: 1:8) for 2 h, followed by being boiled in an earthenware pot for 20 min, and the decoction was then collected. The total volume was modulated to 200mL using MilliQ water.
Ten Sprague–Dawley (SD) rats (male, average weight 200±20 g, 8 weeks of age) were purchased from the China National Institutes for Food and Drug Control (License no. 111251231100147017). The rats were divided into five groups: two rats for each of the positive controls (PC, XiaoAiPing Tablet [XAP], Xinsifang Pharmaceutical Co, 230707); that is, the low dose (LD), medium dose (MD), and high dose (HD) MTD groups. The remaining two received 0.9% saline for model control (MC). According to the dosage of raw herbs and XAP for adults in the clinic, the equivalent doses for rats in the MD and PC groups were calculated using a 6.3 multiplier. The HD, MD, and LD ratios were 2:1:0.5, respectively. Each rat received gastric irrigation of 1mL/100g weight. After 7 days, all rats received Intraperitoneal anesthesia with 5% pentobarbital sodium, average dose 40mg/kg weight. Blood was sampled via the abdominal aorta, and the medicated serum was separated.
Determination of Content of the 4 Core Active Compounds in Medicated Serum of MTD
The amount of quercetin, baicalein, and luteolin (standard samples: quercetin, CAS, 117-39-5, Lots, Q4951; baicalein, CAS, 21967-41-9; Lots, 572667; luteolin, CAS, 491-70-3, Lots, L9283; Sigma-Aldrich) in the medicated serum of the LD, MD, and HD rats were determined using UHPLC-MS/MS (SCIEX, Exion LC-6500+, Kromasil 100-5-C18 column, 4.6 mm×150 mm, 5μm). The mobile phase was a methanol (A)-0.1% methane acid–water solution (B) for gradient elution (0–20 min,35% A; 20–40 min,45% A), and the flow rate was set to 1.0mL/min. The sample size was 5μL, and the column temperature was 25 °C. The content of β-sitosterol (standard samples: CAS, 83-46-5, Lots, S1270; Sigma-Aldrich) was also determined using HPLC (Waters Symmetry C18 column, 4.6 mm×250 mm, 5μm), PDA detection at a wavelength of 205 nm, and methanol–water mobile phase with a volume ratio of 92:8.
The mass spectrometry parameters were as follows: ion source, ESI source; positive ion mode scan; detection mode, multiple reaction monitoring; voltage: 5500V; nebulizer gas pressure, 55 psi; heating gas pressure, 50 psi; curtain gas pressure, 30 psi; solvent gas temperature, 550°C.
Cells Culture and Grouping
TE-1 cells (CSTR:19375.09.3101HUMTCHu89) were obtained from the National Collection of Authenticated Cell Cultures, Shanghai Cell Bank of the Chinese Academy of Science.
The cells were cultured in RPMI1640 medium (Shanghai XP Biomed Ltd., C3001-0500) containing 10% fetal bovine serum (FBS, Shanghai XP Biomed Ltd., C04001-050X10) at 37 °C and 5% CO2. The culture medium was replaced every 24 h. The cells were observed under a microscope after convergence to 80–90%, and continued to be cultured in an incubator.
TE-1 cells were used as a blank control (BC) for model control (MC) in the PC, LD, MD, and HD groups. Cells in the BC group were cultured in RPMI1640 complete medium. Cells in the remaining groups were starved for 24 h. The cells in the medication groups were cultured in RPMI1640 medium containing 20% medicated serum. The serum of control rats was used for MC at the same concentration.
Acridine Orange Staining
The TE-1 cells were incubated in 24-well plates. For cell adhesion and starvation for autophagy modeling, three doses of MTD and XAP functioning for 24 h, cells were stained according to the protocol of the acridine orange staining kit (Report Biotech, RP-RS1001). Orange and orange-red fluorescent signals were observed.
Autophagosome Observation with Transmission Electron Microscope (TEM)
The TE-1 cells were incubated in a six-well plate. Cells were starved for autophagy modeling. MTD and XAP functioned for 24 h. The cells were then scraped and centrifuged. Precooled 2.5% glutaraldehyde was mixed with the cells and maintained at 4 °C for 10 h away from sunlight. Cells were treated with the reaction system, as shown in Table 1. The samples were kept overnight in an oven at 60 °C and then sliced. Uranium-acetate-lead citrate (3%) was then added to the samples. Transmission electron microscopy (TEM) was used to observe autophagosomes.
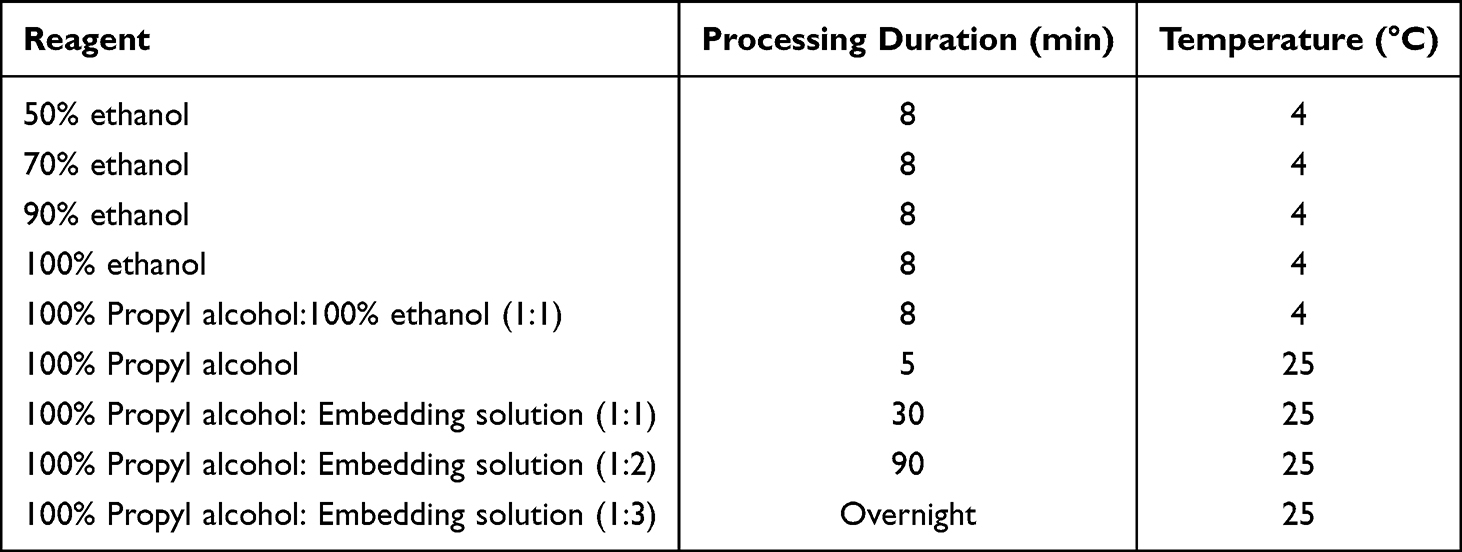 |
Table 1 Reaction System for Cell Dehydration |
Western Blot
After TE-1 cell adhesion and starvation for autophagy modeling, MTD, and XAP functioning for 24 h, cell proteins were extracted following protease inhibitor instructions. Protein concentration was determined following the BCA kit protocol (Report Biotech, RP-RW0201), and loading buffer (Report Biotech, RP-RW301) was added to the sample and stored at −20 °C. Before determination, the samples were thawed at room temperature, and protein denaturation was conducted at 100 °C. Routine electrophoresis (electrophoresis buffer, ZOMANBIO, ZS305), electroporation (electroporation buffer, ZOMANBIO, ZS401B), PVDF (Immobilon-P, IPVH00010), blocking, and antigen–antibody reactions were performed. Primary antibodies against β-actin (Sigma-Aldrich, A5316), Beclin-1(Sigma-Aldrich, PRS3613), p62 (Sigma-Aldrich, P0067), LC3I (Sigma-Aldrich, L8918), Akt (Sigma-Aldrich, SAB4500799), and mTOR (HA, ET1608-5) were added at working concentrations according to kit instructions, incubated at 4 °C overnight, and TBST (TBST Wash Buffer, Batch, ZS405-3) was used to clean the PVDF membrane. This was followed by incubation with the secondary antibody (IgG Antibody, Anti-mouse, Report Biotech, S1001; IgM Antibody, Anti-rabbit, Report Biotech, S1002) at room temperature for 2 h. ECL (Report Biotech, RW0601) luminescence staining was then performed, and image analysis followed using a gel imager. ImageJ was used for gray value analysis, and β-actin was used as an internal parameter to calculate relative protein expression.
Immunofluorescence Assay
TE-1 cells were incubated in 24-well plates. After cell adhesion, starvation for autophagy modeling, MTD, and XAP functioning for 24 h, the RPMI1640 medium was discarded. To each well was added 1mL of 4% paraformaldehyde (Report Biotech, RS0030), and the cells were fixed at room temperature and punched with 0.5% Triton X-100 (Report Biotech, RS0015) at room temperature for 30 min. Prepared BSA (Report Biotech, RP-RW0502) was used for sealing. The primary antibody, LC3 (Report Biotech, RP-RA1143, 1:200), was added and incubated at 4 °C overnight. Excess liquid was blotted with absorbent paper, and a fluorescent secondary antibody (anti-rabbit IgG H+L Antibody DyLight 488 Conjugated, Report, S6002, 1:200) was added and incubated in a wet box at 37 °C for 2 h away from light. DAPI containing a fluorescent quencher (anti-fade reagent, Report, RC10059) was incubated for 5 min and then nucleated. The fluorescence intensity of LC3 was observed using a fluorescence microscope.
RT-qPCR
The TE-1 cells were incubated in a six-well plate. After cell adhesion, starvation for autophagy modeling, and MTD and XAP functioning for 24 h, RNA was extracted from the cells using an RNA extraction kit (ZHONGSHTONTRU, ZS-M11005), followed by reverse transcription (ZHONGSHI TONTRU, ZS-M14003). cDNA was synthesized with a super-brilliant Thermostable First Strand cDNA Synthesis Kit (ZHONGSHI, ZS-M14003M-50T). After the PCR reagent (ZAPASYBR Green qPCR premix (2x), ZHONGSHI, ZS-M13002m) was added, the 8 tubes were successively placed into an instrument for PCR annealing and amplification, and the data were derived. A three-step RT-qPCR reaction program was used:
Stage 1: 95 °C 30s
Stage 2: 95 °C 30s, 60 °C 20s 40 cycles
Stage 3: The 2−ΔΔCT method was used to calculate the relative gene expression.
The primer sequences (synthetic primer/PROMER IPAGE11-59, INVITROGEN, and A13839-1) for Beclin-1 and β-actin are listed in Table 2.
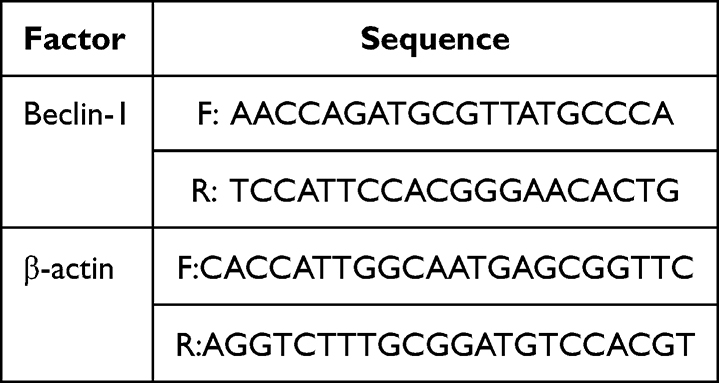 |
Table 2 Primer Sequence |
Statistical Methods
Data were analyzed using GraphPad Prism 9.5. For processing of quantitative results, gray value and optical density analyses were performed using ImageJ software. One-way analysis of variance (ANOVA) was used to determine the homogeneity of variance among multiple groups. Assuming that the data followed a normal distribution, the Student’s t-test was applied to compare the differences between each pair of groups. Statistical significance was set at p <0.05.
Results
Active Compounds in MTD and Predicted Targets
A total of 867 active compounds were obtained from the six herbs in the MTD. A total of 986 predicted protein targets were identified. The numbers were ascertained with deletions in duplicates, as shown in Table 3. Nine joint compounds were identified (Table 4).
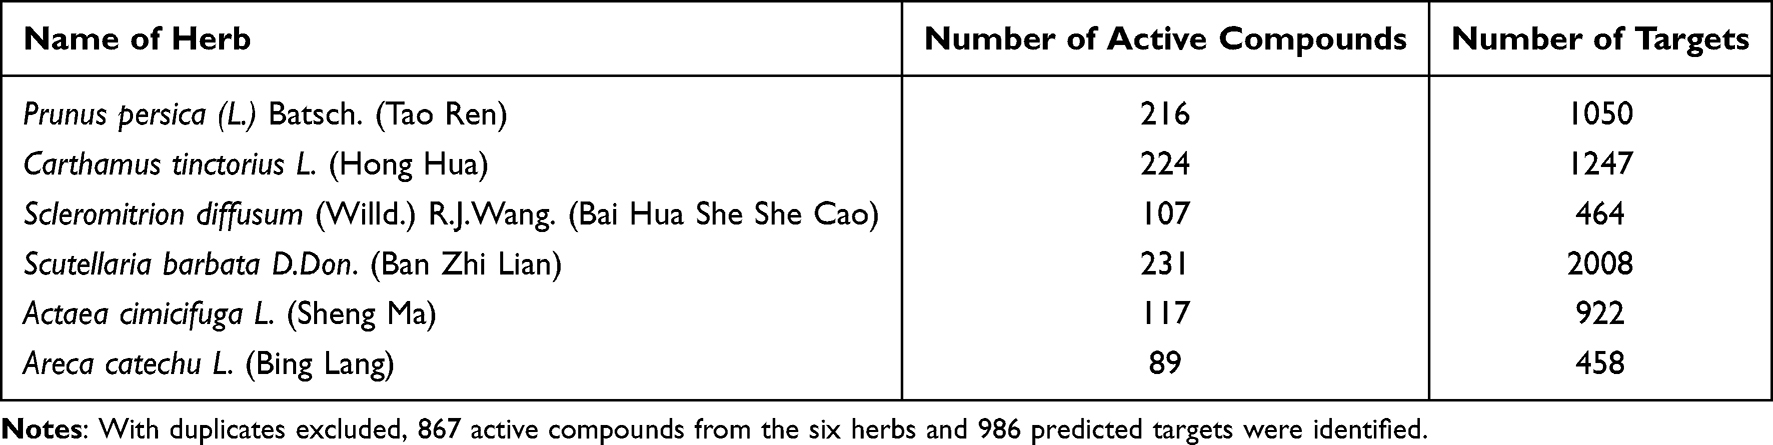 |
Table 3 Number of Active Compounds in MTD and Corresponding Targets |
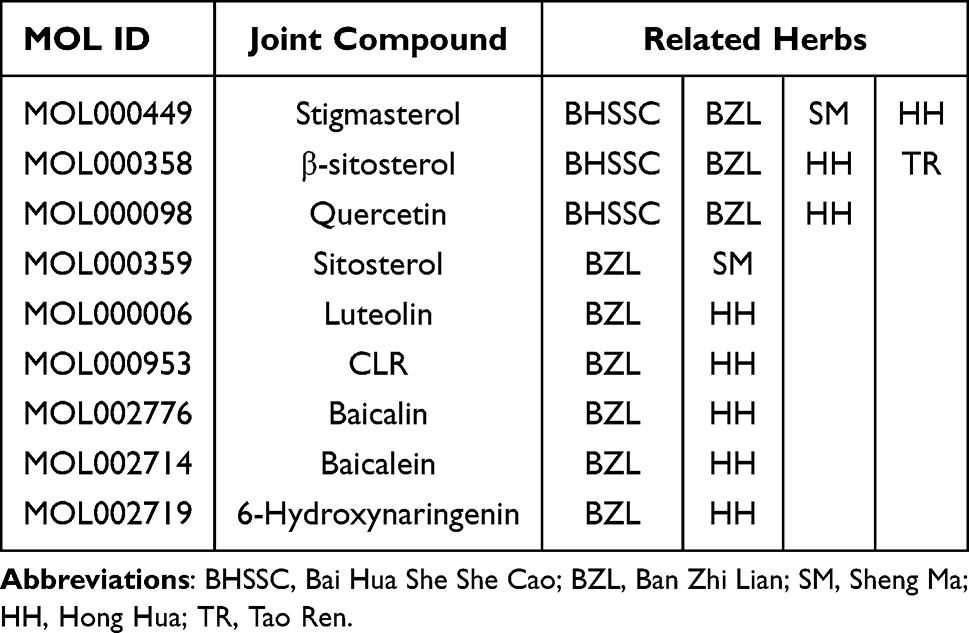 |
Table 4 Joint Active Compounds in MTD |
EC-Related Target Genes
With “esophagus cancer” as the keyword, 22,534 disease targets were obtained in the Genecards database and 286 disease targets were obtained in the OMIM database. As there were too many targets with scores higher than the median, they were set as potential targets for EC. The “MEDIAN” function was used to screen relevance score. Targets with relevance scores of >22.519 were identified as potential targets for EC. By combining the data from the two databases, duplicate targets were deleted and 684 EC-related targets were obtained.
“Drug–Disease” Target Mapping and PPI Network
A total of 867 active compounds in the MTD, 986 predicted targets, and 684 EC-related targets were uploaded to Venny 2.1.0, and 117 compound targets were obtained, as shown in Figure 1.
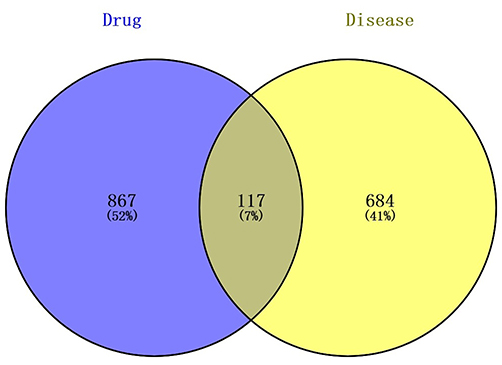 |
Figure 1 Venn diagram of active compounds and disease targets. Relationship of Composite targets between MTD and EC was ascertained with the Venny 2.1.0 online. The “drug” part meant compounds from 6 herbs contained in MTD; The “disease” meant protein targets relating to EC; Intersection data was 117, counting for 7% out of the common part between MTD and EC. |
A total of 117 intersection targets were imported into the online STRING platform and a PPI network was constructed (Figure 2). When the critical value was set, the top four target proteins were obtained—TP53, CTNB1, EGFR, and Akt—and showed strong interactions with others, indicating that they are important targets in the treatment of EC with MTD (Table 5).
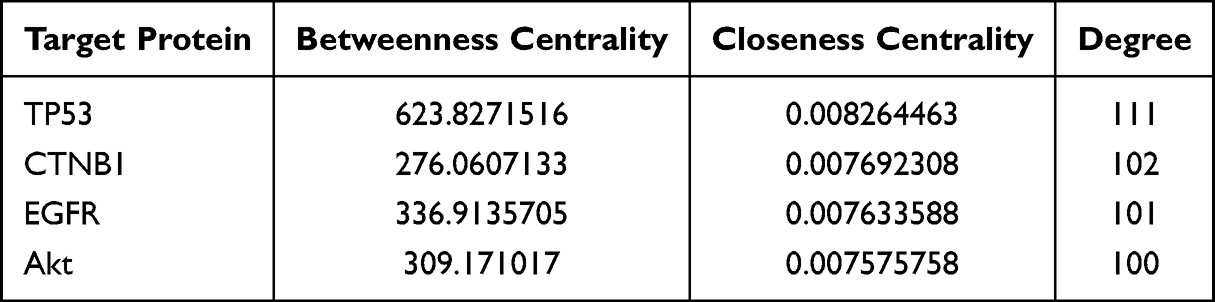 |
Table 5 Key Proteins of MTD Anti-EC (Top 4, Degree≧100) |
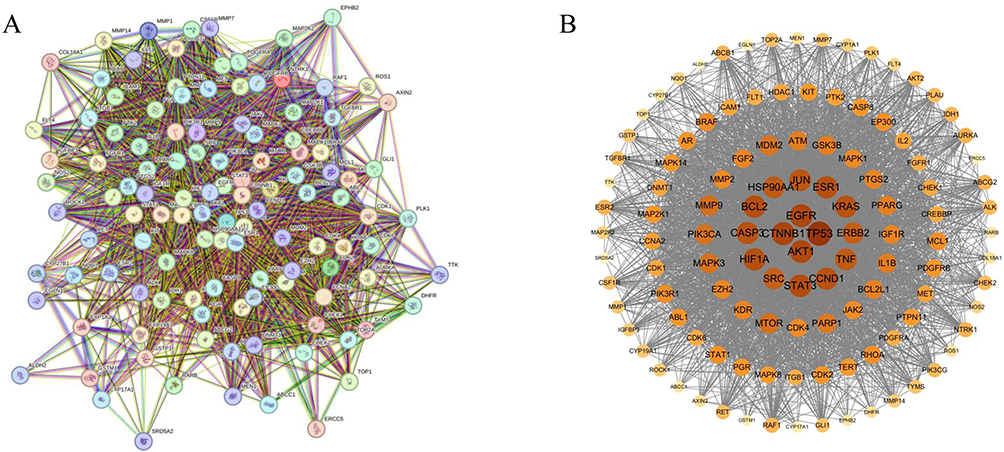 |
Figure 2 Protein-protein interaction (PPI) network of MTD anti-EC. (A) the PPI network diagram of the intersection target of MTD and EC. (B) the visualization of the PPI network diagram. The network showed that there were 117 nodes and 3304 edges. Relations among intersection targets were analyzed with Molecular Complex Detection in Cytoscape3.9.1. On condition that Betweenness centrality>65.1965812, Closeness centrality>0.005653586, Degree > 52.03418803, 33 key targets and 507 protein interactions were obtained. |
The MCODE algorithm grouped the modules into three categories according to score level, which involved 85 protein interactions. The results are presented in Figure 3 and Table 6.
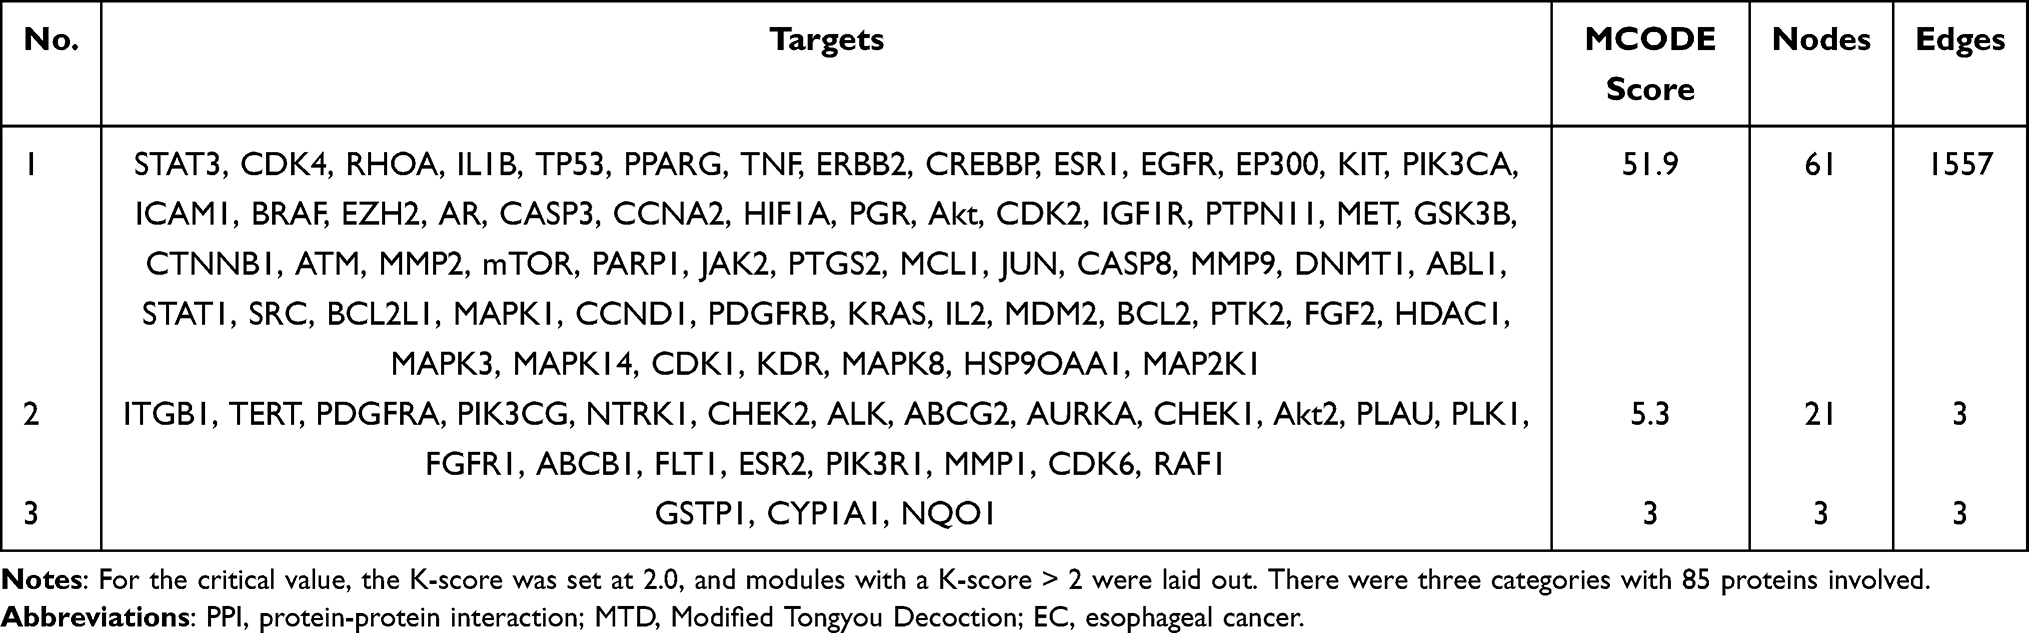 |
Table 6 Modules of PPI Network on Interaction Targets of MTD Anti-EC |
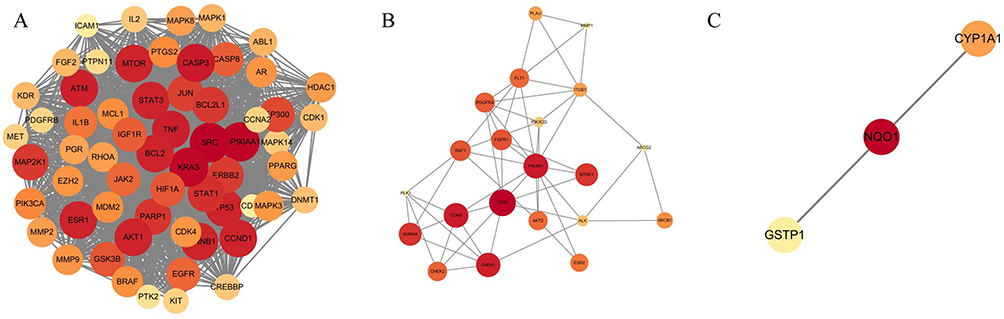 |
Figure 3 Modules of PPI network (MCODE algorithm, K score>2). The results of cluster analysis was conducted with Cytoscape built-in MCODE algorithm to show potential proteins which interacted between MTD and EC, K score was set >2, according to the MCODE score value, (A) for the highest, (B) for the medium and (C) for the lowest. |
Network of “Herbs in MTD - Active Compounds - Predicted Targets”
Based on the herbs, compounds, and intersection targets in the MTD, Cytoscape 3.9.1 was used to visualize the network structure, with a total of 891 nodes and 6235 edges, as shown in Figure 4. The top ten active compounds were recorded according to their degree values, as shown in Table 7. Quercetin, baicalein, luteolin, and β-sitosterol were ranked in the 1st to 4th places.
 |
Table 7 Top 10 Compounds in MTD with Cytoscape3.9.1 (Degree >100) |
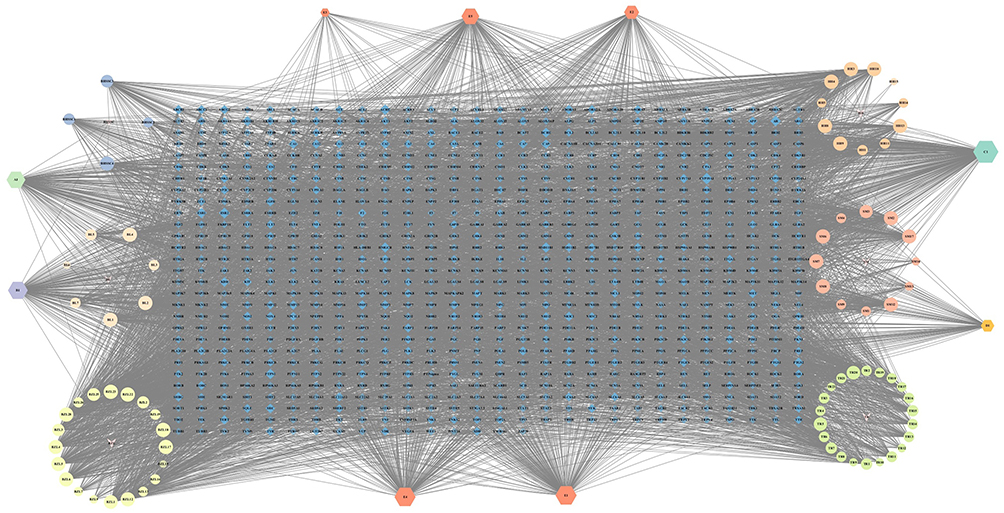 |
Figure 4 Network of Active ingredient in MTD reacting to predicted targets. The diamond shape was the target point, the area of the node meant its degree value. The larger the area was, the more important the node was. The “V” shape meant the drug, and the drug was marked with the pinyin acronym of Chinese. The circular nodes in different colors meant the active compounds of different drugs, and the size of the node area meant the correlation between the component and the key target. The larger the area was, the stronger the correlation was. The regular hexagon meant the mutual functioning compounds of the drug, The name was a capital letter plus a number. |
Core Targets of MTD and Related Pathways
A column diagram showing MTD and correlative pathways was generated using GO enrichment. In total, 2269 terms were statistically significant (p <0.05), of which 2056 were biological process (BP) terms, 57 were cellular component (CC) terms, and 156 were molecular function (MF) terms. The results showed that positive regulation of the apoptotic process, cell migration, and gene expression were in the top 10 of BP; receptor complex, nucleus, and nucleoplasm were in the top 10 of CC; and transcription factor binding, protein tyrosine kinase activity, and ATP binding were in the top 10 of MF. The results are shown in Figure 5.
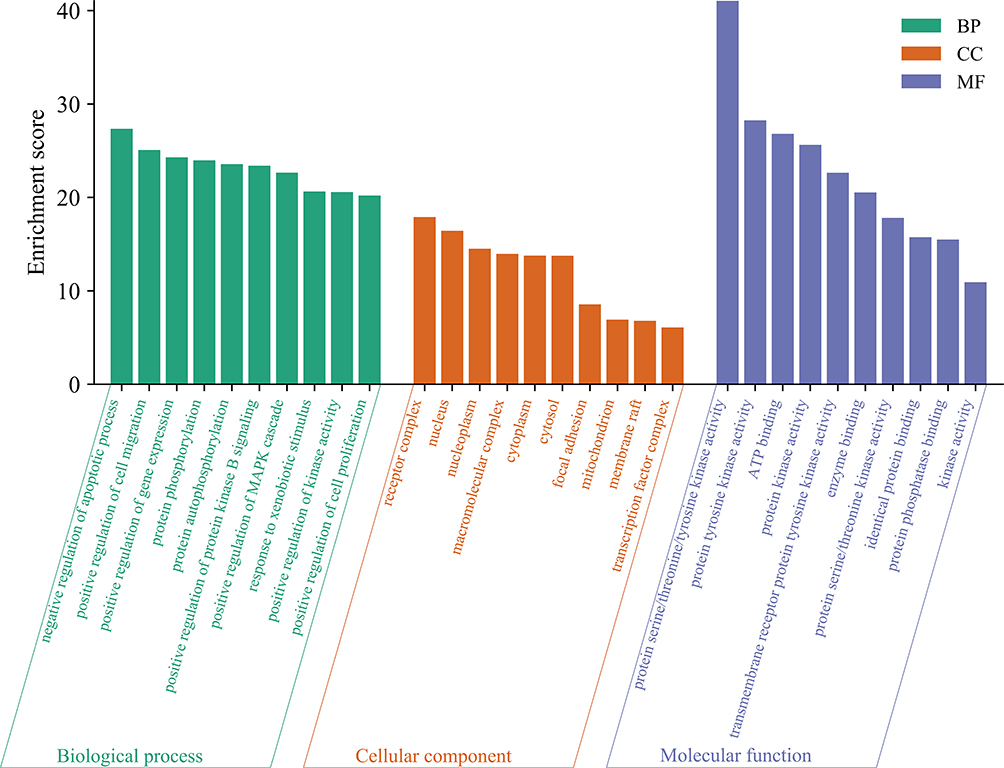 |
Figure 5 Analysis of GO pathway enrichment. Targets of MTD to EC were analyzed from 3 aspects, including biological process (BP), cellular component (CC) and molecular function (MF). The column height reflected correlation between EC treatment with MTD. The higher the column was, the closer the relation was. The top 10 terms of BP, CC and MF were presented. |
KEGG analysis was performed on 1885 intersections among the target genes, resulting in the identification of 93 pathways (p <0.05). The top 30 pathways were selected for visual analysis using the bioinformatic mapping website (http://www.bioinformatics.com.cn/) to draw bubble graphs. The results indicated that the pathways in cancer were at the top, and the PI3K-Akt mTOR signaling pathways played important roles in the pathogenesis of EC. The results are shown in Figure 6.
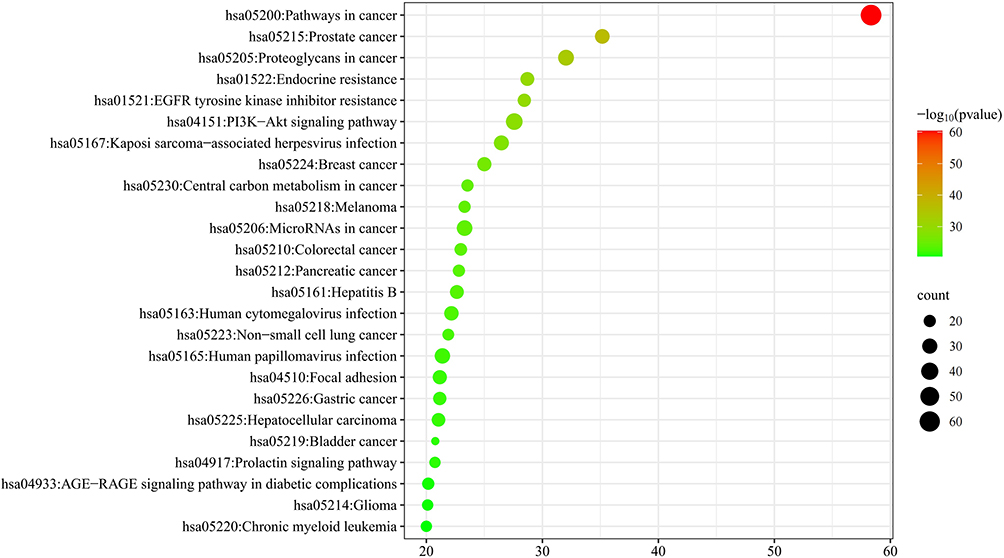 |
Figure 6 Analysis of KEGG pathway enrichment. Targets of MTD for pathways were analyzed with KEGG analysis. The larger the bubble was, the more genes were enriched. The darker the bubble color was, the smaller the P value and the higher the confidence were. The top 30 terms were presented. |
MTD Compounds Docking with Key Target Proteins
In-depth molecular docking studies were conducted to comprehensively explore the effects of the top four active compounds (quercetin, luteolin, baicalin, and β-sitosterol) on key targets (TP53, CTNB1, EGFR, and Akt). The binding energies are listed in Tables 8 and 9.
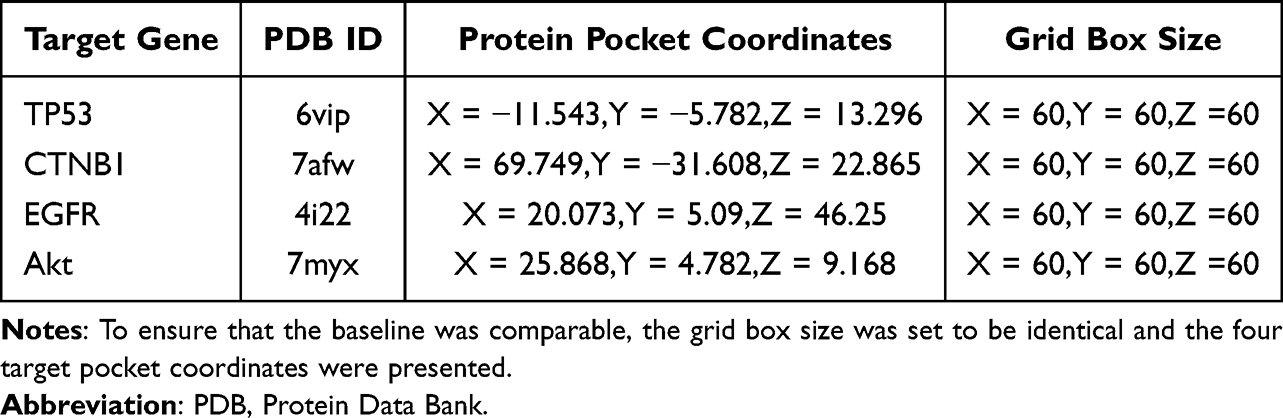 |
Table 8 Protein Pocket Coordinates and Grid Box Sizes for Target Gene |
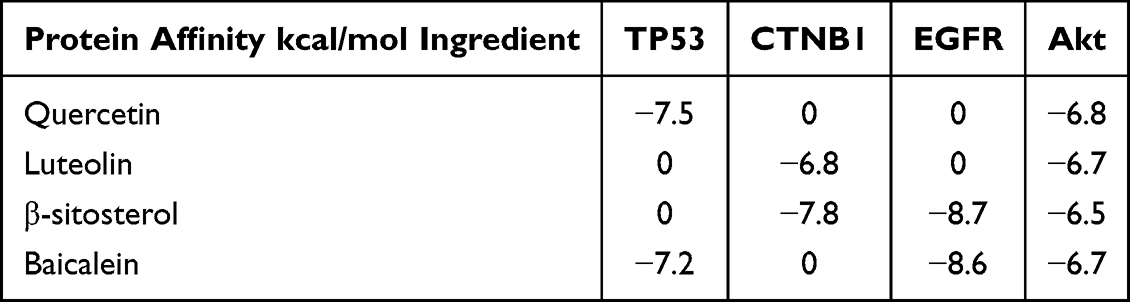 |
Table 9 Affinity Value of the Groups of Main Ligands with Receptors |
Quercetin and baicalein showed a strong affinity for TP53. Luteolin and β-sitosterol showed strong affinities for CTNB1. β-sitosterol and baicalein bound strongly to EGFR. Notably, these four compounds showed high binding energies for Akt. The interactions between these compounds and targets with high binding energies, focused on Akt, were visualized using PyMOL. The results are shown in Figure 7.
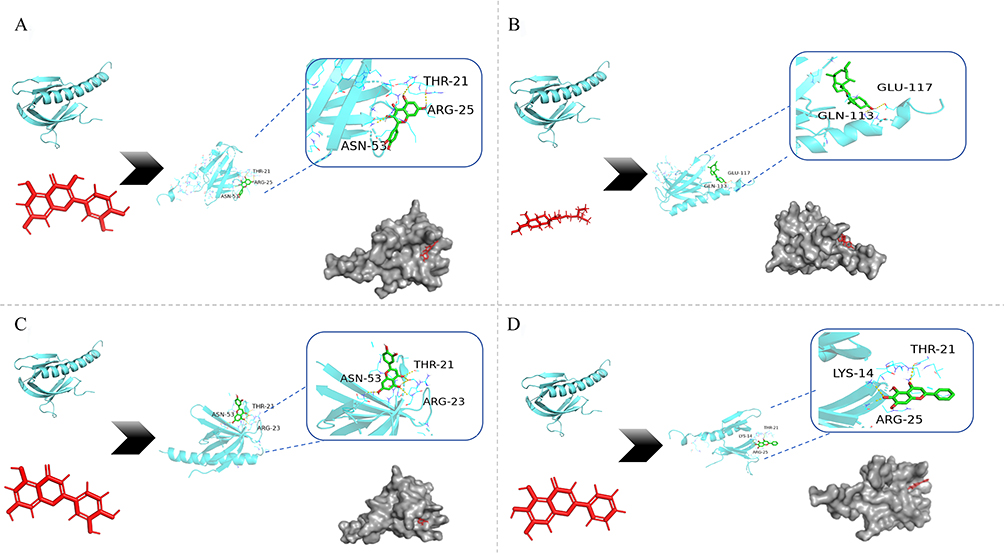 |
Figure 7 Molecular docking of the main compounds and protein targets. The red parts meant active compound molecules. The gray parts meant the macro-molecular protein pocket. The green parts meant the binding map of molecules and proteins, in which the yellow dotted lines were the hydrogen bond, the text parts were the residue name. (A) quercetin docking Akt; (B) β-sitosterol docking Akt; (C) luteolin docking Akt; (D) baicalein docking Akt. |
Contents of Four Core Active Compounds in the Medicated Sera of MTD
The four core active compounds in the medicated sera of LD, MD, and HD were identified using HPLC and compared with standard samples. The constituent ratios of quercetin, baicalein, luteolin, and β-sitosterol ranged in a steady interval, as shown in Figure 8. The 3 doses exhibited the same characteristics, and the total proportion of the four compounds accounted for 14–15%. These results are consistent with those of network pharmacology.
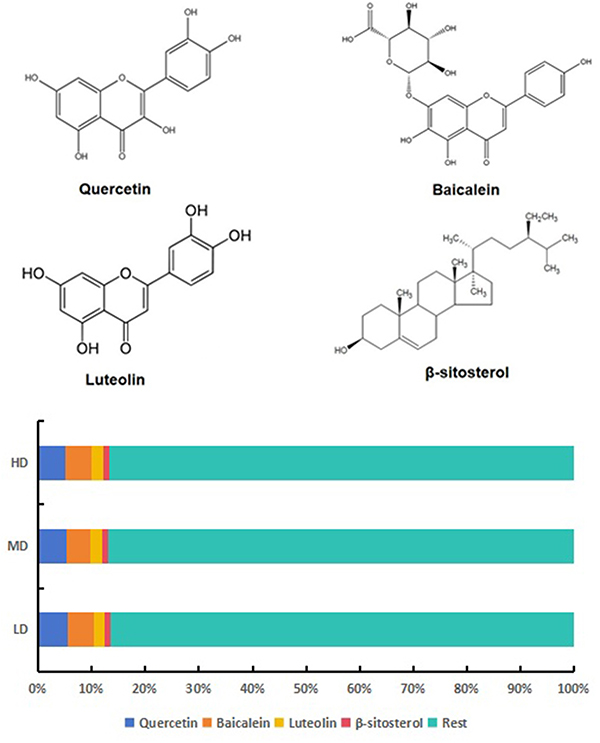 |
Figure 8 Concentrations of the top active compounds in medicated serum of MTD. Quercetin accounted for 5–6%, Baicalein 4–5%, Luteolin 2–3% and β-sitosterol 0.9–1.5% in the LD, MD and HD. The total share of them ranged between 14–15%, showing the same character. |
Effect of MTD on Formation of Autophagy Acidic Vesicles
Autophagic acidic vesicles with orange fluorescence were observed. The fluorescence intensity in the PC, LD, MD, and HD groups increased to different degrees (p<0.05, p<0.001, p<0.0001, respectively) compared to that in the BC group, indicating that the level of autophagy increased markedly. The intensity in the PC, LD, MD, and HD groups increased compared to that in the MC (p<0.001 and p<0.0001, respectively), and the intensity in the MD group increased significantly (p<0.0001), as shown in Figures 9 and 10.
 |
Figure 9 Autophagy acidic vesicles of TE-1 cells treated by MTD with acridine Orange staining. Acridine orange staining reagent expressed with red fluorescence. The red lights were weak in BC Group, by contrast, lights strengthened in MC Group and the 4 medication groups. Different images were snapped with a microscope (20×). Compared with that in MC Group, the fluorescence expression intensity in BC Group weakened, while the intensity in PC, LD, MD, and HD groups all strengthened, notably function of MD being the strongest one. |
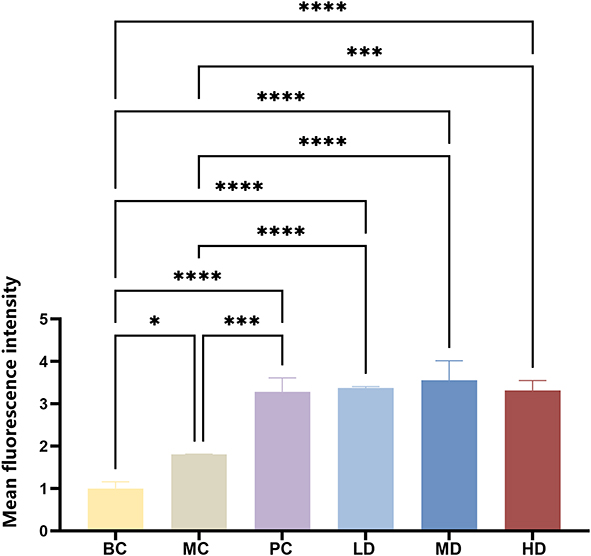 |
Figure 10 Intensity of acridine Orange staining treated by MTD. Lights density were weak in BC Group, by contrast, the density enhanced in MC Group and the 4 medications groups. Obviously, the fluorescence expression of group MD was the strongest. The one-way ANOVA method was used to test the uniformity of variance, and Student’s t-test was used to test the statistical differences between every two groups, with * p<0.05, *** p<0.001 and ****p<0.0001. |
Effect of MTD on Autophagosome Formation
TEM images showed that the cell membrane was intact in the BC group and the cell nuclei, mitochondria, endoplasmic reticulum, and other organelles were intact and clearly visible without autophagosomes. The ultrastructure of autophagosomes wrapped in a double-layer membrane was observed in the MC, PC, LD, MD, and HD groups. Compared with the MC group, there were different degrees of cellular vacuolation in the medication groups, among which vacuolation was specific and significant in the PC and LD groups, the number of autophagosomes increased and was more intense in LD group, as shown in Figure 11.
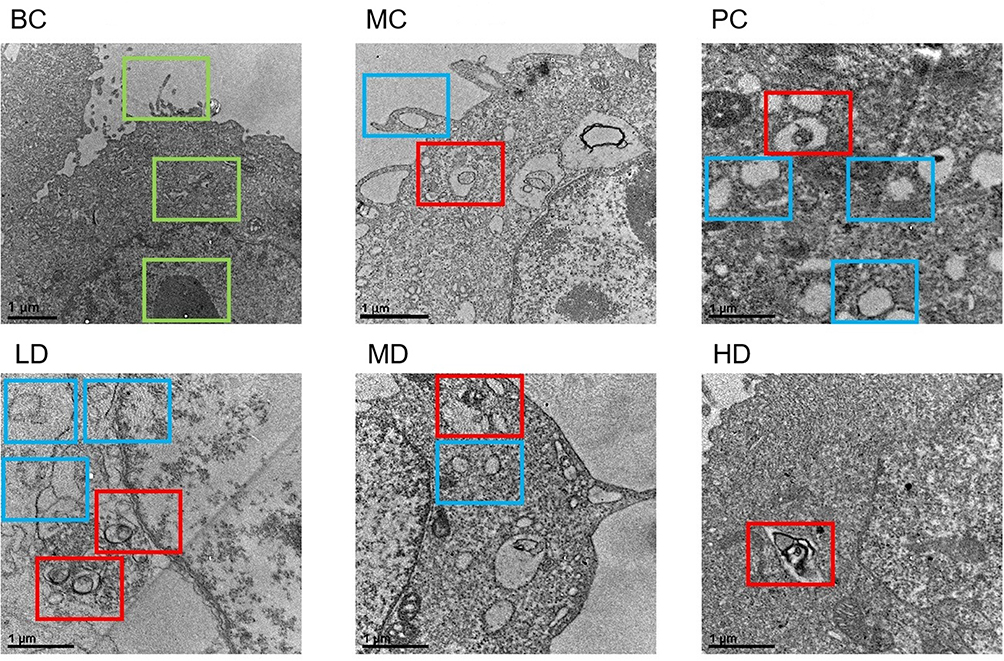 |
Figure 11 Autophagosome treated by MTD with TEM. In BC Group, as the green square box showed, Normal cellular structures emerged, including cell villi, mitochondria and nuclei. In MC, PC, LD, MD, and HD groups, there were autophagosomes wrapped in a double-layer membrane. Compared with that in BC Group, The part framed by the blue square box showed that cellular vacuolation emerged in the rest 5 groups, among which there were significant in PC and LD groups. Compared with that in MC Group, the part framed by the red square box showed that autophagosomes emerged in PC, LD, MD and HD groups, among which the autophagosomes increased and were significant in LD group. Images were taken with TEM (50000×). |
Effect of MTD on Protein Expression of the Autophagy-Related and Akt/mTOR Signaling Pathway
Western blot showed that p62 expression in MC, PC, LD, MD and HD groups decreased compared with that in the BC group (p<0.05). Notably, the expression in PC, LD, MD and HD groups significantly decreased compared with that in MC group (p<0.0001) and MD showed the strongest ability. Beclin-1 expression in the four treatment groups was higher than that in the BC group (p<0.05, p<0.01, p<0.001, p<0.0001), and the expression was markedly higher in the HD group than in the MC group (p<0.001). LC3II/LC3I in the PC, LD, MD, and HD groups were overexpressed to different degrees compared to that in the MC group (p<0.05, p<0.01, p<0.001, respectively), and the effect of HD was stronger than that of PC (p<0.05). Expression of Akt and mTOR in MC, PC, LD, MD and HD groups decreased compared with that in BC group (p<0.05, p<0.01, p<0.001, p<0.0001, respectively). HD showed the strongest effect compared with that in the PC group (p<0.01). As shown in Figures 12 and 13.
 |
Figure 12 Protein expression of autophagy-related molecules treated by MTD with Western blot. Effect of MTD on proteins expression of p62, Beclin-1, LC3I, LC3II, Akt and mTOR in TE-1 cells. |
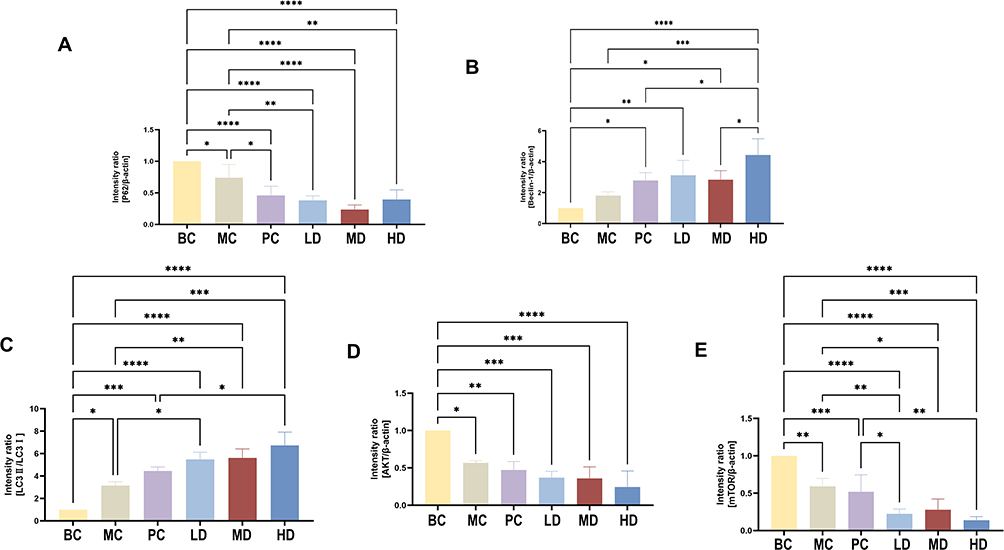 |
Figure 13 Relative grayscale value of protein expression of autophagy-related molecules. (A), Compared with that MC Group, MD showed the strongest effect on expression of p62 protein. (B), Compared with that in MC Group, protein expression of Beclin-1 in HD Group was the highest. (C), Compared with that in MC Group, expression ratio of LC3II and LC3I in HD Group was the highest. (D), Compared with that in MC Group, expression of Akt in HD Group was the lowest. (E), Compared with that in MC Group, expression of mTOR protein in the HD Group was the lowest. The one-way ANOVA was used to test the uniformity of variance, and Student’s t-test was used to test statistical differences between every two groups, with * p<0.05, ** p<0.01, *** p<0.001 and **** p< 0.0001. |
Effect of MTD on Fluorescence Expression of the LC3 Protein
Immunofluorescence assays showed that LC3 fluorescence expression in the MC, PC, LD, MD, and HD groups increased to different degrees compared to that in the BC group (p<0.001 and p<0.0001, respectively). Compared to the MC group, the expression in the PC, LD, MD, and HD groups increased (p<0.01 and p<0.0001, respectively), among which XAP function was the weakest. Notably, MD function was the strongest, showing statistical significance compared with that in the PC group (p<0.0001). As shown in Figures 14 and 15.
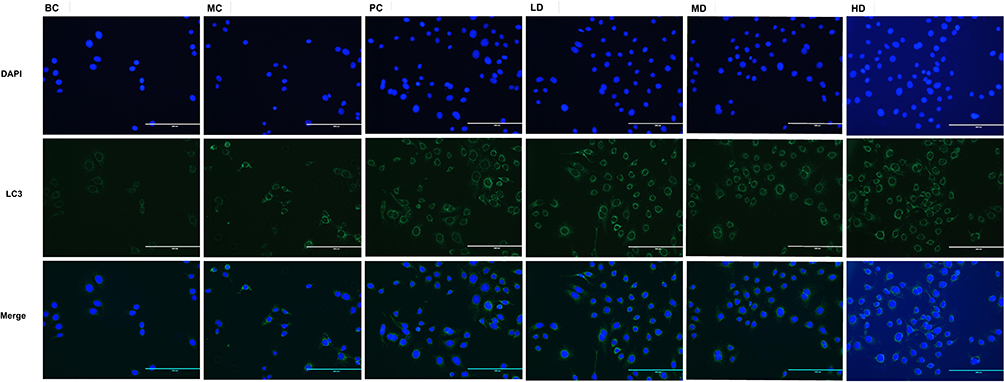 |
Figure 14 Fluorescence expression of LC3 treated with MTD. The green represented LC3 fluorescence expression. The green lights were weak in BC Group, by contrast, both lights enhanced in MC Group and the 4 medications groups. Different images were snapped with a microscope (20×). |
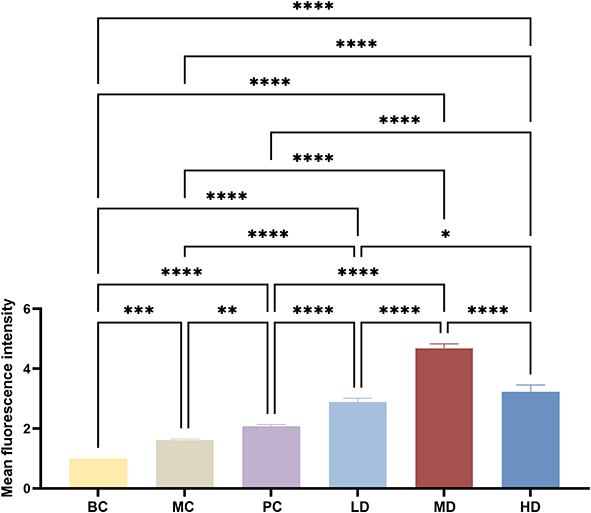 |
Figure 15 Semi-quantitative analysis on fluorescence intensity of LC3 treated with MTD. Compared with that in BC Group, the fluorescence expression values in the MC, PC, LD, MD, and HD groups all increased, notably the MD showed the strongest ability. The one-way ANOVA was used to test the uniformity of variance, and the Student’s t-test was used to test the statistical differences between every two groups, with * p<0.05, ** p<0.01, *** p<0.001, and ****p< 0.0001. |
Effect of MTD on mRNA Expression of Beclin-1
RT-qPCR showed that the Beclin-1 mRNA expression levels in the MC, PC, LD, MD, and HD groups were higher than those in the BC group (p<0.05, p<0.001, p<0.0001). Expression in the LD, MD, and HD groups increased notably compared with that in the MC group (p<0.05); however, XAP in the PC Group showed no significant difference. As shown in Figure 16.
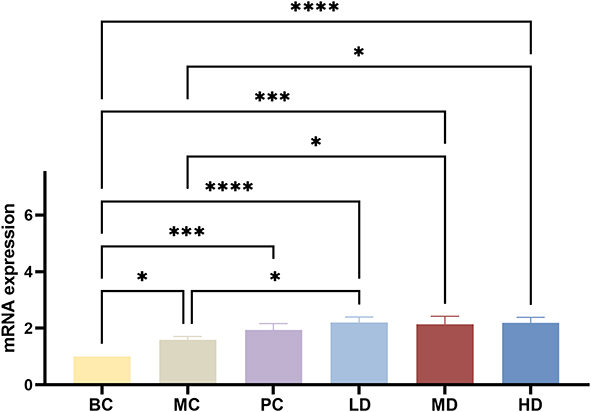 |
Figure 16 mRNA expression of Beclin-1 treated with MTD. 3 doses of MTD promoted the mRNA expression of Beclin-1 at different degrees. The one-way ANOVA was used to test the uniformity of variance, and the Student’s t-test was used to test the statistical differences between every two groups, with * p<0.05, *** p<0.001 and ****p< 0.0001. |
Discussion
Studies have shown that TCM is characterized by multiple components and targets on anti-EC,13,14 such as reducing toxic side effects caused by radiotherapy and chemotherapy, improving quality of life, and reducing the risk of recurrence and metastasis.15
According to TCM theory, an imbalance of Qi movement in the digestive tract causes Qi stagnation and blood stasis, resulting in EC pathogenesis.16 Consequently, promoting Qi and removing blood stasis is an important therapeutic method for treating EC, based on which MTD is created. Our research has confirmed that MTD can inhibit the proliferation and migration of EC cells;17 however, the active compounds and functional targets remain undefined.
Network pharmacology was conducted to identify the specific compounds of MTD and their targets in EC. With PPI network, GO and KEGG analysis and “Herbs in MTD - Active compounds - predicted targets” visual network, it showed that MTD functions in EC cell autophagy via Akt/mTOR signaling pathway, and the correlated top four active compounds are quercetin, luteolin, baicalein, and β-sitosterol. Quercetin is a common flavonoid and plays a key role in inhibiting invasion and angiogenesis of EC cells.18,19 In particular, it is a therapeutic agent in terms of inducing autophagy of tumor cells.20 Luteolin is a polyphenolic flavone, modulating autophagy by diminishing viability and proliferation of tumor cells.21 Baicalein is an active polyphenolic compound, regulating various cell-signaling pathways, close relating to autophagy.22 β-Sitosterol, a typical phytosterol, plays a role in cancer prevention and treatment by enhancing apoptosis and inhibiting invasion and metastasis.23
Molecular docking results showed that the four active compounds docked to Akt equally. In particular, Akt regulates EC cell autophagy at transcriptional level and its downstream molecule, mTOR inhibits autophagy by phosphorylating specific sites of relevant proteins, such as LC3, ubiquitin-binding protein p62 and Beclin-1, in the formation and maturation of autophagosomes.24–26 LC3 and p62 are key proteins in autophagosome formation, and they are recruited into the autophagosome membrane.27 During autophagy, LC3I is activated and binds to phosphatidylethanolamine to convert to LC3II, which helps to promote the maturation of autophagosomes.28 Beclin-1, an important regulator for autophagosome, forms a complex with type III phosphatidylinositol 3 kinase, which can regulate the localization of autophagy precursors and thus regulate autophagy activity.29,30
To offer scientific evidence regarding the pharmacokinetics of MTD and to avoid unknown factors influencing the biological behavior of EC cells, medicated serum was prepared in three doses. MD is the equivalent dose for adults in clinic, so the four core active compounds were determined by HPLC with MD. The results indicated that quercetin, luteolin, baicalein, and β-sitosterol were enriched, which confirmed the results of the network pharmacology.
To objectively explore the mechanism of MTD, the herbal tablet XAP, which was approved as a Chinese patent medicine for EC therapy in the clinic,31 was used as a PC. XAP was obtained from Marsdenia tenacissima (Roxb). Wight et Arn and anti-cancer ingredients were Tenacissoside I, H and G.32 With observation on autophagic acidic vesicles, the effect of MD was stronger than that of XAP. Autophagosome formation provides direct evidence for cell autophagy consequently, LD and XAP promoted autophagosome formation strongly with TEM. Western blot analysis showed that for p62, MD had the strongest function. HD had the strongest effect on Beclin-1, LC3II/LC3I, Akt, and mTOR. Immunofluorescence assays showed that three doses of MTD and XAP affected LC3 protein expression, and MD exerted the strongest effect. RT-qPCR results suggested that Three doses of MTD and XAP affected Beclin-1 mRNA expression. The experiment indicated that MTD improved autophagy in TE-1 cells. HD and MD exerted strong effects on protein and mRNA expression of autophagy-related molecules regulated by the Akt/mTOR pathway.
Based on the analysis in silico, The present study only conducted experiment in vitro with small sample size and there is a promising research with in vivo tumor model, which will be initiated in the near future.
Conclusion
Network pharmacology showed that MTD exerts function on EC cells autophagy with multi-components through targeting Akt and its downstream molecules. With in vitro experimental validation, MTD induces cell autophagy with regulating Akt/mTOR pathway.
Data Sharing Statement
All data generated or analyzed during this study are included in this article. Further inquiries can be directed to the corresponding author.
Ethics Approval
Application of human TE-1 cell line for in vitro was approved by Ethics Committee of North China University of Science and Technology (IRB# 2025124). Animal experiments were approved by Laboratory Animal Ethical and Welfare Committee of the North China University of Science and Technology (IRB# 2023-SY-027).
Acknowledgments
We are greatly indebted to the staff of Hebei Key Laboratory of Integrated Traditional Chinese and Western Medicine and Central Laboratory, North China University of Science and Technology, for providing experimental conditions.
Author Contributions
All authors made a significant contribution to the work reported, whether that is in the conception, study design, execution, acquisition of data, analysis and interpretation, or in all these areas; took part in drafting, revising or critically reviewing the article; gave final approval of the version to be published; have agreed on the journal to which the article has been submitted; and agree to be accountable for all aspects of the work.
Funding
This study was supported by grants from the Natural Science Funds of Hebei Province of China [Grant no. H2021209030, H2017209053] and the Basic Innovation Research Team of Tangshan, Hebei Province of China [Grant no. 21130204D].
Disclosure
The authors declare no conflicts of interest.
References
1. Bray F, Laversanne M, Sung H, et al. Global cancer statistics 2022: GLOBOCAN estimates of incidence and mortality worldwide for 36 cancers in 185 countries. CA Cancer J Clin. 2024;74(3):229–263. doi:10.3322/caac.21834
2. Siegel RL, Miller KD, Fuchs HE, et al. Cancer statistics, 2022. CA Cancer J Clin. 2022;72(1):7–33. doi:10.3322/caac.21708
3. Jia YS, Ma HX, Wang ZW, et al. Herbal compounds of activating blood and promoting Qi movement for treating esophageal cancer[P]. CN201110308544.0. 2013-04-10.
4. Chen SS, Jia YS, Du N, et al. Effect of Tonglian Decoction integrated conformation radiotherapy on TNF-α, IL-2R and CP from serum of esophageal cancer patients in middle-late stage. Liaoning J TCM. 2014;41(3):472–473.
5. Chen SS, Jia YS, Tian FL, et al. Study on Tonglian Decoction integrated with microwave hyperthermia affecting serum p53 and survivin expression of esophageal cancer patients compared with simple microwave hyperthermia. Jiangsu TCM. 2014;46(3):34–35.
6. Jia YS, Hu XQ, Li JA, et al. Tonglian Decoction arrests the cell cycle in S-phase by targeting the nuclear factor-kappa B signal pathway in esophageal carcinoma Eca109 cells. Chin J Integr Med. 2016;22(5):384–389. doi:10.1007/s11655-016-2096-3
7. Jia YS, Qin LJ, Jiang CH, et al. Anti-cancer activity of Tonglian decoction against esophageal cancer cell proliferation through regulation of the cell cycle and PI3K/Akt signaling pathway. J Tradi Chin Med Sci. 2015;2(2):120–126.
8. Wang Q, Tian YY, Kong LY, et al. Mechanism of Modified Tongyou Decoction and its Separated Formulae Inhibiting Vasculogenic Mimicry in Esophageal Cancer TE-1 Cells via NF-κB/HIF-1α Axis. Integr Cancer Ther. 2025;24:15347354251332590. doi:10.1177/15347354251332590
9. Jia YS, Yan X, Cao Y, et al. Anticancer Activity of Modified Tongyou Decoction on Eca109 Esophageal Cancer Cell Invasion and Metastasis through Regulation of the Epithelial-Mesenchymal Transition Mediated by the HIF-1α -Snail Axis. Evid Based Complement Alternat Med. 2020;2020(1):3053506. doi:10.1155/2020/3053506
10. Mei K, Chen Z, Tan F, et al. miR-221 is a prognostic marker and promotes the proliferation and migration of esophageal squamous cell carcinoma by inhibiting autophagy. Discov Oncol. 2025;16(1):445. doi:10.1007/s12672-025-02223-w
11. Yang HC, Xun J, Jiang XL, et al. Research progress on the mechanism of action of traditional Chinese medicine in the treatment of esophageal cancer. Chin J Surg Integrated Tradit Western Med. 2019;30(03):419–423.
12. Liu H, Zhao J, Fu R, et al. The ginsenoside Rk3 exerts anti-esophageal cancer activity in vitro and in vivo by mediating apoptosis and autophagy through regulation of the PI3K/Akt/mTOR pathway. PLoS One. 2019;14(5):e0216759. doi:10.1371/journal.pone.0216759
13. Cao L, Wang X, Zhu G, et al. Traditional Chinese Medicine Therapy for Esophageal Cancer: a Literature Review. Integr Cancer Ther. 2021;20:15347354211061720. doi:10.1177/15347354211061720
14. Yue GG, Li L, Lee JK, et al. Multiple modulatory activities of Andrographis paniculata on immune responses and xenograft growth in esophageal cancer preclinical models. Phytomedicine. 2019;60:152886. doi:10.1016/j.phymed.2019.152886
15. Chen X, Deng L, Jiang X, et al. Chinese herbal medicine for oesophageal cancer. Cochrane Database Syst Rev. 2016;2016(1):CD004520. doi:10.1002/14651858.CD004520.pub7
16. Wu Z, Zhao Y, Yu F, et al. Qigefang Inhibits Migration, Invasion, and Metastasis of ESCC by Inhibiting Gas6/Axl Signaling Pathway. Recent Pat Anticancer Drug Discov. 2021;16(2):285–294. doi:10.2174/1574892816666210521152337
17. Song W, Chang Q, Chen H, et al. Effects of Modified Tongyou Decoction on mTOR/HIF-1α pathway and tumor hypoxia-related factors in esophageal cancer Eca-109 cells. Mod J Integr Traditional Chinese and Western Med. 2020;29(06):579–584.
18. Singh P, Arif Y, Bajguz A, et al. The role of quercetin in plants. Plant Physiol Biochem. 2021;166:10–19. doi:10.1016/j.plaphy.2021.05.023
19. Liu Y, Li CL, Xu QQ, et al. Quercetin inhibits invasion and angiogenesis of esophageal cancer cells. Pathol Res Pract. 2021;222:153455. doi:10.1016/j.prp.2021.153455
20. Moon JH, Eo SK, Lee JH, et al. Quercetin-induced autophagy flux enhances TRAIL-mediated tumor cell death. Oncol Rep. 2015;34(1):375–381. doi:10.3892/or.2015.3991
21. Ashrafizadeh M, Ahmadi Z, Farkhondeh T, et al. Autophagy regulation using luteolin: new insight into its anti-tumor activity. Cancer Cell Int. 2020;20(1):537. doi:10.1186/s12935-020-01634-9
22. Rahmani AH, Almatroudi A, Khan AA, et al. The Multifaceted Role of Baicalein in Cancer Management through Modulation of Cell Signalling Pathways. Molecules. 2022;27(22):8023. doi:10.3390/molecules27228023
23. Wang H, Wang Z, Zhang Z, et al. β-Sitosterol as a Promising Anticancer Agent for Chemoprevention and Chemotherapy: mechanisms of Action and Future Prospects. Adv Nutr. 2023;14(5):1085–1110. doi:10.1016/j.advnut.2023.05.013
24. Xu Z, Han X, Ou D, et al. Targeting PI3K/AKT/mTOR-mediated autophagy for tumor therapy. Appl Microbiol Biotechnol. 2020;104(2):575–587. doi:10.1007/s00253-019-10257-8
25. Hou G, Jia A, Yang L, et al. OP16 induces deadly autophagy and apoptosis of cells by inhibiting Akt in esophageal squamous cell carcinoma. Mol Cell Biochem. 2020;472(1–2):219–230. doi:10.1007/s11010-020-03800-z
26. Du L, Wang D, Nagle PW, et al. Role of mTOR through Autophagy in Esophageal Cancer Stemness. Cancers (Basel). 2022;14(7):1806. doi:10.3390/cancers14071806
27. Jiang P, Mizushima N. LC3- and p62-based biochemical methods for the analysis of autophagy progression in mammalian cells. Methods. 2015;75:13–18. doi:10.1016/j.ymeth.2014.11.021
28. Kong LY, Xi Z, Ma WT, et al. Effects of Notch signal on the expressions of HIF-α and autophagy- related genes Beclin1, LC3I, LC3II in oxygen-glucose deprivation induced myocardial cell injury. Chin J Appl Physiol. 2019;35(2):165–168. doi:10.12047/j.cjap.5729.2019.036
29. Prerna K, Dubey VK. Beclin1-mediated interplay between autophagy and apoptosis: new understanding. Int J Biol Macromol. 2022;204:258–273. doi:10.1016/j.ijbiomac.2022.02.005
30. Xu HD, Qin ZH. Beclin 1, Bcl-2 and Autophagy. Adv Exp Med Biol. 2019;1206:109–126.
31. Liu Z, Dong Y, Zhu M, et al. Xiaoaiping injection as adjunct therapy for patients with advanced esophageal carcinoma: a protocol for a systematic review and meta-analysis. Medicine. 2020;99(26):e20984. doi:10.1097/MD.0000000000020984
32. Wang P, Yang J, Zhu Z, et al. Marsdenia tenacissima: a Review of Traditional Uses, Phytochemistry and Pharmacology. Am J Chin Med. 2018;2018:1–32.
 © 2025 The Author(s). This work is published and licensed by Dove Medical Press Limited. The
full terms of this license are available at https://www.dovepress.com/terms
and incorporate the Creative Commons Attribution
- Non Commercial (unported, 4.0) License.
By accessing the work you hereby accept the Terms. Non-commercial uses of the work are permitted
without any further permission from Dove Medical Press Limited, provided the work is properly
attributed. For permission for commercial use of this work, please see paragraphs 4.2 and 5 of our Terms.
© 2025 The Author(s). This work is published and licensed by Dove Medical Press Limited. The
full terms of this license are available at https://www.dovepress.com/terms
and incorporate the Creative Commons Attribution
- Non Commercial (unported, 4.0) License.
By accessing the work you hereby accept the Terms. Non-commercial uses of the work are permitted
without any further permission from Dove Medical Press Limited, provided the work is properly
attributed. For permission for commercial use of this work, please see paragraphs 4.2 and 5 of our Terms.
Recommended articles
Anti-Inflammatory Effects and Molecular Mechanisms of Shenmai Injection in Treating Acute Pancreatitis: Network Pharmacology Analysis and Experimental Verification
He Y, Hu C, Liu S, Xu M, Liang G, Du D, Liu T, Cai F, Chen Z, Tan Q, Deng L, Xia Q
Drug Design, Development and Therapy 2022, 16:2479-2495
Published Date: 2 August 2022
A Novel Approach Based on Gut Microbiota Analysis and Network Pharmacology to Explain the Mechanisms of Action of Cichorium intybus L. Formula in the Improvement of Hyperuricemic Nephropathy in Rats

Amatjan M, Li N, He P, Zhang B, Mai X, Jiang Q, Xie H, Shao X
Drug Design, Development and Therapy 2023, 17:107-128
Published Date: 20 January 2023
Network Pharmacology and Experimental Validation to Explore That Celastrol Targeting PTEN is the Potential Mechanism of Tripterygium wilfordii (Lév.) Hutch Against IgA Nephropathy

Zhao J, Liu H, Xia M, Chen Q, Wan L, Leng B, Tang C, Chen G, Liu Y, Zhang L, Liu H
Drug Design, Development and Therapy 2023, 17:887-900
Published Date: 23 March 2023
Investigating the Mechanism of Action of Schisandra chinensis Combined with Coenzyme Q10 in the Treatment of Heart Failure Based on PI3K-AKT Pathway

Wen S, Yang K, Bai Y, Wu Y, Liu D, Wu X, Zhang X, Sun J
Drug Design, Development and Therapy 2023, 17:939-957
Published Date: 27 March 2023
Network Pharmacology Analysis of the Mechanisms Underlying the Therapeutic Effects of Yangjing Zhongyu Tang on Thin Endometrium
Zhang L, Li H, Zhang L, Zu Z, Xu D, Zhang J
Drug Design, Development and Therapy 2023, 17:1805-1818
Published Date: 17 June 2023