Back to Journals » Journal of Inflammation Research » Volume 19
Multi-Cohort Transcriptomics Combined with Mendelian Randomization Identifies PPARGC1A, NAAA and GIPC2 as NLRP3 Inflammasome-Related Key Genes in Ulcerative Colitis
Received 14 December 2025
Accepted for publication 5 June 2026
Published 10 June 2026 Volume 2026:19 583575
DOI https://doi.org/10.2147/JIR.S583575
Checked for plagiarism Yes
Review by Single anonymous peer review
Peer reviewer comments 3
Editor who approved publication: Dr Alberto Caminero
Jian Cheng, Yangfeng Huang
Department of Traditional Chinese Medicine, Sichuan Provincial People’s Hospital, School of Medicine,University of Electronic Science and Technology of China, Chengdu, Sichuan, People’s Republic of China
Correspondence: Yangfeng Huang
Department of Traditional Chinese Medicine, Sichuan Provincial People’s Hospital, School of Medicine,University of Electronic Science and Technology of China, No. 32, West Section 2, 1st Ring Road, Qingyang District Chengdu, Sichuan, 610072, People’s Republic of China
, Email [email protected]
Background: Ulcerative Colitis (UC), a subtype of inflammatory bowel disease with unclear specific pathogenesis, was associated with recurrent inflammatory infections, genetics, and immunodeficiency. This study aimed to analyze the potential pathogenesis of NLRP3 inflammasome (NLRP3-INF)-mediated UC via transcriptomics combined with Mendelian Randomization (MR), explore the causal relationship between NLRP3-INF, related target genes and UC, and provide insights for mining UC therapeutic targets.
Methods: Gene expression data (GSE87473 as training set, GSE75214 as validation set, GSE87466 as external validation set) were obtained. Differential expression analysis and Weighted Gene Co-expression Network Analysis (WGCNA) were performed to screen differentially expressed genes (DEGs) and NLRP3-INF related genes (NLRP3-RGs) related module genes. Candidate genes were obtained by intersecting DEGs with module genes. MR analysis was conducted between candidate genes and UC. Receiver Operating Characteristic (ROC) analysis and expression validation were used to confirm key genes; immune infiltration drug prediction; and molecular dynamics (MD) simulation analyses were carried out, and the expression of key genes was further verified in the UC mouse model.
Results: A total of 942 DEGs were screened. WGCNA identified eight modules, with the MEyellow module (813 genes) highly correlated with NLRP3-RGs. A total of 307 candidate genes were obtained. Nine candidate key genes were screened through MR analysis; after validation, PPARGC1A (Peroxisome proliferator-activated receptor gamma coactivator 1-alpha), NAAA (N-acylethanolamine acid amidase), and GIPC2 (GIPC PDZ domain containing family member 2) (significantly downregulated in UC) were confirmed as key genes. They were correlated immune cells such as M0 macrophages and activated CD4+ T cells; Molecular docking revealed a binding free energy of − 8.7 kcal/mol between PPARGC1A and Rosiglitazone, indicating favorable binding affinity. Molecular dynamics simulations confirmed the binding conformation remained stable over 100 ns Animal experiments confirmed lower expression of the three key genes in the model group.
Conclusion: PPARGC1A, NAAA, and GIPC2 were identified through bioinformatics analyses as key genes for NLRP3-INF-mediated UC, which could serve as potential biomarkers and provide a basis for UC pathogenesis research and therapeutic target development.
Keywords: ulcerative colitis, NLRP3 inflammasome, transcriptomics, mendelian randomization analysis, key genes
Introduction
Ulcerative Colitis (UC) belongs to a subtype of inflammatory bowel disease, but its specific pathogenesis is unknown,And studies have shown that it may be related to recurrent inflammatory infections, genetics, immunodeficiency and other factors.1 The site of disease mainly involves the rectum, the left half of the colon and even the entire colon. It is a chronic non-specific intestinal inflammatory disease characterized by repeated chronic inflammatory episodes, abdominal pain and diarrhea, and mucus, pus and blood stools. In severe cases, it can be complicated by intestinal perforation and cancer.2 In view of the fact that this disease is difficult to cure and prone to cancer, and with the increasing incidence of UC year by year, the age of onset is getting younger and younger, which is a serious threat to people’s health. Therefore, finding a therapeutic regimen that can effectively mitigate and inhibit the progression of the disease in order to optimize the clinical diagnosis and treatment of UC has become a public healthproblem that needs to be addressed urgently.3
NLRP3 inflammasome (INF), a macromolecular protein complex with pro-inflammatory effects, is a hot topic in current research on inflammatory response. It is mainly composed of apoptosis-as-sociated speck-like protein containing a CARD (ASC) and pro-cysteinyl aspartate specific proteinase-1 (pro- Caspase-1) are widely expressed in subpopulations of granulocytes, macrophages, T-lymphocytes, and B-lymphocytes.4 Recruitment of pro-Caspase-1 to the CARD structural domain of ASC leads to the assembly of NLRP3-INF and activation of caspase-1, which releases inflammatory factors to induce inflammatory responses, whereas activated caspase-1 induces the cellular pyroptosis pathway, thus NLRP3-INF is critical for regulating host immune defense against infectious microorganisms and cellular damage.5 Moderate activation of NLRP3-INF-induced inflammation facilitates the clearance of microbial infections and promotes the repair of damaged tissues, but over-activation of NLRP3-INF leads to excessive inflammatory damage in the host and thus induces disease.6 The current study demonstrates that NLRP3, as an intrinsic immune receptor, triggers the activation of caspase-1 and the secretion of interleukin-1β (IL-1β) and interleukin-18 (IL-18) in response to microbes, which are closely related to the pathogenesis of UC.7 NLRP3-INF has also been regarded as a key intestinal homeostatic regulatory factors. Abnormal immune responses to intestinal flora are widely believed to underlie the development of UC. IL-1β serves as a key effector molecule downstream of NLRP3 inflammasome activation in intestinal tissue. Elevated IL-1β levels trigger the activation of MAPK and NF-κB signaling cascades, subsequently enhancing the expression of various pro-inflammatory mediators including cytokines and chemokines.8 Research indicates that intestinal IL-18 production is mediated by NLRP3 inflammasome activity, with IL-18 playing a regulatory role in epithelial cell proliferation and tissue repair following intestinal injury. Furthermore, genetic variations within the IL-18 locus have been identified as susceptibility factors for UC. These findings collectively highlight the critical involvement of NLRP3 inflammasome in modulating intestinal mucosal immune responses, with impaired mucosal immunity representing a potential primary mechanism underlying UC development.9 Despite these advances, critical gaps remain: (1) the specific NLRP3-regulated genes driving UC pathogenesis are poorly defined; (2) causal links between these genes and UC risk lack rigorous validation; (3) strategies to modulate these targets in the inflamed gut remain unexplored. Addressing these gaps is essential to translate NLRP3 biology into actionable therapies.
Recent transcriptomic studies have identified widespread dysregulation of NLRP3 inflammasome-related pathways in ulcerative colitis (UC), yet distinguishing primary drivers from secondary inflammatory responses remains challenging. To move beyond correlation, Mendelian randomization (MR) has emerged as a robust epidemiological tool to infer causality. By leveraging genetic variants as instrumental variables, MR can validate whether specific NLRP3-associated genes exert direct causal effects on UC risk, minimizing confounding inherent in observational studies.10 While transcriptomics identifies differentially expressed genes associated with ulcerative colitis (UC), these findings are limited to correlation and cannot establish causality. To overcome this, we employ Mendelian Randomization (MR), a causal inference method that uses genetic variants as instrumental variables to test the causal relationship between exposure factors (eg., gene expression) and UC risk. MR relies on three core assumptions: (1) genetic variants are strongly associated with the exposure; (2) genetic variants are independent of confounders; (3) genetic variants affect UC risk only through the exposure (no horizontal pleiotropy). Given the gut-specific nature of UC, we prioritize colon/immune cell eQTLs to ensure the relevance of identified targets to intestinal pathology.11,12
Therefore, this study integrates multi-cohort transcriptomics, WGCNA, MR-based causal prioritization, and immune deconvolution to systematically dissect NLRP3 inflammasome-mediated UC pathogenesis. Following the identification of candidate targets, we further explored their translational potential by evaluating druggability and delivery strategies. Notably, emerging nanocarrier systems (eg., pH-responsive hydrogels, mucus-penetrating nanoparticles) offer viable approaches for targeted delivery of small molecules or nucleic acids to the inflamed colon, as demonstrated in recent studies.13,14 Finally, experimental validation in a DSS-induced mouse model was conducted to bridge computational predictions with preclinical feasibility.
Materials and Methods
Data Collection
This study followed the STROBE-MR (Strengthening the Reporting of Observational Studies in Epidemiology-Mendelian Randomization Extension) guideline.15 This study utilized gene expression data from the Gene Expression Omnibus (GEO) database (https://www.ncbi.nlm.nih.gov/gds). Specifically, the GSE87473 (GPL13158) was employed as training set, which included 106 samples of ulcerative coliti (UC) intestinal mucosa tissue and 21 samples of normal intestinal mucosa. The GSE75214 (GPL6244), the validation set, consisted of 74 samples of UC intestinal mucosa tissue and 22 samples of normal intestinal mucosa. The GSE87466 (GPL13158) dataset, used as an external validation set, includes 87 UC mucosal samples and 21 normal mucosal samples. Thirty NLRP3-inflammasome related genes (NLRP3-RGs) were derived from the literature.16
Difference Expression Analysis
For the GSE87473 dataset, we identified differentially expressed genes (DEGs) by employing the limma package (v 1.36.0).17 Genes meeting the criteria of adjusted P-value < 0.05 and |log2(fold change)| > 1 were classified as DEGs. Visual representations of the DEGs, including volcano plots and heatmaps, were generated using the ggplot2 package (v 3.3.6)18 and ComplexHeatmap package (v 2.14.0).19
Single Sample Gene Set Enrichment Analysis (ssGSEA)
To evaluate NLRP3-related gene (NLRP3-RG) activity in the GSE87473 dataset, we computed ssGSEA scores using the GSVA package (v 1.7–9).20 The ssGSEA algorithm was applied based on the NLRP3-RG signature to derive enrichment scores for each sample. Statistical comparisons of NLRP3-RG-associated ssGSEA scores between groups were performed with a significance threshold of P < 0.05, and results were illustrated through differential distribution plots.
Weighted Gene Co-Expression Network Analysis (WGCNA)
The original chip data (CEL files) were subjected to RMA (Robust Multi-array Average) normalization using the affy package (v1.76.0), and batch effects between datasets GSE87473, GSE75214, and GSE87466 were corrected employing the ComBat function from the sva package (v3.46.0). Using the WGCNA package (v 3.4.3),21 the samples in GSE87473 were clustered based on expression levels using Euclidean distance for hierarchical clustering (deepSplit = 2), and outliers from the sample were removed. The optimal soft-thresholding was identified at 14, and the R-squared value was set at R2 > 0.85, mergeCutHeight = 0.3, using Pearson correlation for gene clustering. According to the criteria of the hierarchical dynamic tree cut, the minimum number of genes for each gene module was established at 30. Using the NLRP3-RGs related ssGSEA scores as the phenotype, the association between the phenotype and modules was constructed. Ultimately, modules related to the NLRP3-RGs in UC were identified, and the genes within these modules were extracted.
Identification and Functional Enrichment of Candidate Genes
Candidate genes were identified by intersecting DEGs with WGCNA module genes to obtain NLRP3-RG-associated differential genes. Functional annotation was performed through Gene Ontology (GO) and Kyoto Encyclopedia of Genes and Genomes (KEGG) pathway analyses using the clusterProfiler package (v 3.14.3),22 with adjusted P < 0.05 as the significance threshold. Protein-protein interaction (PPI) networks were constructed via the STRING database (minimum confidence score: 0.4) and visualized using Cytoscape software (v 3.8.2).23
Screening of Instrumental Variables
MR analysis was conducted to explore potential causal relationships between candidate genes and UC. The MR framework requires three fundamental assumptions: (1) genetic variants demonstrate significant association with exposure variables; (2) genetic variants remain independent of confounding factors; (3) genetic variants affect outcomes exclusively through exposure variables without alternative pathways. Expression quantitative trait loci (eQTL) GWAS data for candidate genes and UC GWAS data (ebi-a-GCST90038684) were obtained from the IEU Open GWAS database (https://gwas.mrcieu.ac.uk/). The UC dataset comprised 9,587,836 SNPs from 484,598 samples (2,515 UC cases; 482,083 controls). Using the TwoSampleMR package (v 0.5.6),24 we employed the extract_instruments function to identify SNPs significantly associated with exposures (P < 5×10⁻⁸). Linkage disequilibrium (LD) pruning was performed with clump=TRUE settings (r2 = 0.001, kb = 10,000). F-statistics were calculated to verify instrument strength, with F > 10 indicating sufficient robustness. SNPs uncorrelated with outcomes were retained for MR analysis.
MR Analysis
Effect allele harmonization was performed using the harmonise_data function from the TwoSampleMR package. Five MR methods were applied: MR-Egger,25 Weighted median,26 Inverse variance weighted (IVW),27 Simple mode and Weighted mode.28 The IVW method served as the primary analytical approach due to its superior causal inference performance (P < 0.05). Odds ratios (OR) > 1 indicated risk factors, while OR < 1 suggested protective effects. Scatter plots generated via mr_scatter_plot function illustrated exposure-outcome correlations. Forest plots created through mr_forest_plot function displayed diagnostic performance. Funnel plots produced using mr_funnel_plot function assessed causal effect distribution randomness.
Comprehensive sensitivity analyses were subsequently performed. Heterogeneity assessment utilized the mr_heterogeneity function, calculating Cochran’s Q value and corresponding P-value (Q_pval). Q_pval < 0.05 indicated significant heterogeneity, warranting random-effects IVW modeling; Q_pval > 0.05 indicated homogeneity, permitting fixed-effects IVW modeling.29 Horizontal pleiotropy was evaluated using mr_pleiotropy_test and run_mr_presso functions, with P > 0.05 indicating absence of pleiotropy. Exposures showing horizontal pleiotropy (P < 0.05) were excluded from subsequent analyses.30 Leave-one-out (LOO) sensitivity testing systematically removed individual SNPs to assess their influence on outcomes. Steiger directional testing31 examined potential reverse causation. Genes passing reverse causality assessment were designated as candidate key genes (P < 0.05) for downstream analysis. The final P-values for the IVW results were corrected using bonferroni method (significance threshold P < 1.63×10⁻⁴, derived from 0.05/307 parallel tests), with BH-FDR (q < 0.05) as supplementary, with additional calculation of the 95% confidence intervals for the OR values. Robustly significant causal association genes were selected by applying sensitivity filtering criteria (nsnp> 2, Q_pval> 0.05, pval.pleio> 0.05, and Steiger direction correct). To further exclude confounding due to linkage disequilibrium (LD), the coloc package32 was employed to perform co-localization analysis of the aforementioned genes (eQTL side screening P <1×10⁻⁴), with PP.H4> 0.75 defined as strong evidence for shared causal variants.
ROC Analysis and Expression Validation of the Candidate Key Genes
Diagnostic value assessment of candidate key genes employed the pROC package (v 1.18.0)33 to generate Receiver Operating Characteristic (ROC) curves in GSE87473. Area Under the Curve (AUC) values quantified discriminatory capacity between UC and normal control samples. Validation ROC curves were constructed in GSE75214.
Expression patterns of candidate key genes were evaluated using Wilcoxon rank-sum tests in both GSE87473 and GSE75214 datasets. Genes demonstrating concordance with MR findings were designated as key genes. To verify the heterogeneity of identified key genes, expression validation was extended to the GSE87466 dataset.
Analysis of Key Genes
Internal connections among key genes were explored through co-expression network construction using the GeneMAnia database (http://genemania.org/). Functional similarity assessment employed the GOSemSim package34 with criteria of |correlation coefficient| > 0.3 and P < 0.05. Spearman correlation analyses between individual key genes and genome-wide transcripts were conducted in GSE87473 using the psych package (v 2.2.9).35 Diabetic pathogenic genes were retrieved from GeneCards (https://www.genecards.org/), and their expression differences in UC versus controls were analyzed (P < 0.05). Correlations between UC-associated differentially expressed pathogenic genes and key genes were examined (|correlation coefficient| > 0.3, P < 0.05).
Gene Set Enrichment Analysis (GSEA) was performed using clusterProfiler package (v 3.14.3). The KEGG pathway gene set “c2.cp.kegg.v7.4.symbols.gmt” downloaded from the GSEA website (http://www.gsea-msigdb.org/gsea/) served as the reference. The CIBERSORT algorithm quantified infiltration levels of 20 immune cell types in GSE87473. Spearman correlation analysis between differential immune cells and key genes was conducted using the psych package (v 2.2.9), applying thresholds of |correlation coefficient| > 0.3 and P < 0.05.
Molecular Regulation Network and Drug Prediction
Transcription factors (TFs) targeting key genes were identified through NetworkAnalyst (networkanalyst.ca). MicroRNAs (miRNAs) associated with key genes were retrieved from the miRNet database (https://www.mirnet.ca). The integrated TF-key gene-miRNA regulatory network was visualized using Cytoscape (v 3.8.2). Potential therapeutic compounds were identified via the Comparative Toxicogenomics Database (CTD) (http://ctdbase.org). Drug-key gene interaction networks were constructed and visualized in Cytoscape (v 3.8.2) (Shannon et al 2003). Three-dimensional drug structures were obtained from PubChem (https://pubchem.ncbi.nlm.nih.gov/), while protein crystal structures were retrieved from the Protein Data Bank (PDB) (https://www.rcsb.org/) for molecular docking studies.
Molecular Dynamics (MD) Simulation
To validate binding stability and rationality between drugs and key genes, molecular dynamics (MD) simulations were executed. Protein sequences were acquired from the NCBI database, restricting searches to human species. Molecular dynamics (MD) simulations were performed using GROMACS 2024.2 for 100 ns under NPT ensemble (300 K, 1 bar), with integration time step = 2 fs, hydrogen bonds constrained via LINCS algorithm, long-range electrostatics handled by PME (cutoff = 1.0 nm). All parameters followed GROMACS default units (nm, ps, fs, K, bar, mol/L), with no unit conversion errors. The AMBER14SB force field parameterized proteins, while the AMBER gaff force field generated parameters for small-molecule ligands. Periodic boundary conditions were established, and simulation boxes were optimized and solvated. System electroneutrality was maintained by replacing water molecules with Na⁺ and Cl− ions at 0.15 mol/L concentration. Energy minimization utilized the steepest descent algorithm. Production simulations incorporated random seeds for duplicate runs to ensure reproducibility.
Animal Studies
This study was conducted and reported in accordance with the ARRIVE (Animal Research: Reporting of In Vivo Experiments) guidelines 2.0 (https://arriveguidelines.org). All animal experiments were designed and performed in compliance with ARRIVE recommendations to ensure transparency, reproducibility, and statistical methods are provided in the paper. The study protocol was reviewed and approved by the Ethics Committee of Sichuan Provincial People’s Hospital (Approval No. 2024600, September 29, 2024), and all procedures adhered to the institutional guidelines for the humane care and use of laboratory animals. For animal care, health checks were conducted twice a day (morning and evening) to record the mental state, appetite, water intake, and fecal condition of mice. Mice with abnormalities were promptly isolated, and veterinarians were contacted. For environmental cleaning, cage replacement and sterilized corn cob bedding replacement were performed twice a week (cages were autoclaved at 121 °C and 103kPa for 20 minutes). The outer surface of cages and the ground were disinfected with 0.5% peracetic acid daily, and the breeding room was fumigated with formaldehyde-potassium permanganate every two weeks. Meanwhile, 5% of mouse samples were collected monthly for pathogen detection to ensure compliance with the specific pathogen-free (SPF) standard. For feeding, SPF-grade complete pellet feed for mice conforming to GB 14924.3–2010 was used (containing ingredients such as crude protein ≥ 20%, without antibiotics or hormones). The feed was stored at 4 °C; mice were allowed ad libitum access to feed, with feed supplemented daily and feed boxes replaced weekly. Drinking water was sterile deionized water (supplied via automatic water dispensers, which were sterilized weekly). A UC model was induced by providing sterile water supplemented with 3% DSS as drinking water, which was freshly prepared and filter-sterilized daily. For housing, 420mm × 260mm × 180mm individually ventilated cages (IVC) were used, with 3–4 mice of the same gender and group per cage. Mice in the blank group and model group were housed in separate areas, with information labeled clearly. For environmental enrichment, paper tunnels (100mm × 30mm) and wooden chew sticks (50mm × 10mm) were placed in each cage and replaced weekly. Meanwhile, housing mice in the same cage met their social needs, and special tools were used for gentle handling during operations to minimize stress. Details of experimental interventions were as follows: Ten 6–8 week-old SPF-grade female C57BL/6 mice (weighing 18–20g) were randomly divided into the blank group and model group (5 mice per group) using a random number table The experiment was initiated after the mice had acclimatized to the environment for 3 days: the blank group was given sterile deionized water, while the model group was given sterile water containing 3% DSS (36000–50000Da) for 7 consecutive days. During this period, the model group mice were observed daily for colitis symptoms such as diarrhea, hematochezia, and weight loss, and the onset time and severity of the symptoms were recorded. On the 8th day, after 12 hours of fasting, sampling was conducted. Mice were first euthanized, followed by blood collection (via eyeball enucleation; serum was separated by centrifugation at 3000 rpm for 15 minutes and stored at −80 °C), colon collection (1.5cm of the colon was stored in RNA preservation solution after separation, and the remaining part was fixed), and hippocampus collection (quick-frozen in liquid nitrogen and stored at −80 °C). No analgesics were used in this experiment. The reasons were: the operations caused no invasive pain; mice were quickly euthanized before sampling and had no perception of pain; additionally, analgesics might have interfered with the detection results of PPARGC1A, NAAA, and GIPC2 genes, affecting the scientific validity of the study. Cervical dislocation was used for euthanasia. Operators had received professional training. Before the operation, a sterile workbench and gloves were prepared. The left hand was used to fix the mouse’s head, and the right hand was used to pull the tail to separate the cervical vertebrae instantly (completed within 10 seconds). Euthanasia was confirmed successful when no breathing or heartbeat was detected. Mouse carcasses were placed in biohazard bags with labeled information and disposed of by high-temperature incineration in accordance with regulations. The preset criteria for early euthanasia were: weight loss exceeding 20% with no recovery within 2 days, severe diarrhea with hematochezia unrelieved for 24 hours, listlessness with inability to eat or drink, paralysis, infection, or acute illness/accidental injury. During the experiment, there were no abnormalities in the blank group; the model group only showed mild symptoms, which did not meet the early euthanasia criteria. All mice were euthanized as planned. On the 8th day, samples were collected. A 0.5-cm segment of the colon near the anus was taken from each mouse, fixed with paraformaldehyde and then used for immunohistofluorescence (IHF). Subsequently, two 1.5-cm segments of the colon were taken and frozen for storage, which were used for Western blotting (WB) and polymerase chain reaction (PCR) respectively.
Western Blot Analysis
Protein extraction and quantification employed the BCA Protein Assay Kit (Bofi, China, BF0026). Following denaturation at 100°C for 10 minutes, proteins underwent SDS-PAGE separation (Bofi, China, BF0006) and electrotransfer onto PVDF membranes (Millipore) at 300 mA for 90 minutes. Membranes were sectioned, blocked with 5% skim milk, and incubated overnight at 4°C with primary antibodies: anti-GAPDH (Huaan Bio, ET1601-4), anti-GIPC2 (Affinity, DF6357), anti-NAAA (Solarbio, K113596P), and anti-PPARGC1A (Bioss, bs-1832R). Following washing, membranes received species-appropriate secondary antibodies for 1 hour at room temperature. Immunoreactivity was detected using ECL substrate (Bofi, China, BF0023) and visualized via ChemiDoc MP Imager System (Tanon, 4800).
RNA Extraction and Real-Time Quantitative Polymerase Chain Reaction (qPCR)
Total RNA isolation utilized the TriQuick Reagent Kit (Solarbio) per manufacturer instructions. First-strand cDNA synthesis from 1 μg RNA employed the Evo M-MLV RT Mix Kit with gDNA Clean for qPCR Ver.2 (Aikere). Quantitative PCR employed PerfectStart® Green qPCR SuperMix Kit (Aikere) on ABI QuantStudio 1 System (Thermo) with cycling conditions: 94°C for 2 minutes; 45 cycles of 94°C for 5 seconds and 60°C for 30 seconds. GAPDH normalization and 2−ΔΔCt analysis were performed with triplicate technical replicates. Primer sequences from NCBI (https://www.ncbi.nlm.nih.gov/) are listed in Supplemental Table S1.
Immunohistochemistry of Paraffin Sections
Paraffin sections underwent deparaffinization in xylene (Chengdu Kelong Chemicals) and rehydration through graded ethanols (Chengdu Kelong Chemicals). Microwave-assisted (Midea, M1-L213B) antigen retrieval in citrate buffer (pH 6.0, Sevendo Biotech, G1201) consisted of heating to boiling followed by 8 minutes medium heat and 8 minutes low heat. After three 5-minute PBS washes (Biosharp, G4202), endogenous peroxidase blocking utilized 3% H2O2 (Jiangxi Baiyiweishi) for 15 minutes in darkness. Following additional PBS washes, sections received 5% goat serum (Biosharp, BL210A) blocking for 30 minutes at room temperature. Overnight incubation at 4°C with primary antibodies [anti-GIPC2 (Affinity, DF6357), anti-NAAA (Solarbio, K113596P), anti-PPARGC1A (Bioss, bs-1832R)] preceded three 5-minute PBS washes and 30-minute incubation with goat anti-rabbit IgG secondary antibody (Lianke Bio, GRA0072, 1:200) at 37°C. DAB chromogenic development (Solarbio, DA1016) was terminated with distilled water rinsing. Harris hematoxylin counterstaining (Leagene, DH0020) for 3 minutes was followed by tap water washing, 1% HCl-alcohol differentiation (Sichuan Xilong Science), and ammonia solution blueing (Chengdu Kelong Chemicals). Sections underwent ethanol dehydration, xylene clearing (Chengdu Kelong Chemicals), and neutral gum mounting (Sinopharm Chemical Reagent). Image acquisition and analysis utilized Pannoramic SCAN II scanner (3DHISTECH Kft).
Statistical Analysis
All statistical analyses were performed in R language (v 4.1.0). Between-group comparisons employed Wilcoxon rank-sum tests with statistical significance defined as P < 0.05.
Results
Identification of Differentially Expressed Genes (DEGs) in UC
A total of 942 DEGs, with 507 upregulated and 435 downregulated, were screened in GSE87473. In the log2 (FoldChange) sorted list, the top 10 upregulated genes were MEP1B, CYP2B6, GBA3, ABCG2, AQP8, PNLIPRP2, HMGCS2, CWH43, PCK1 and CLDN8. Conversely, the top 10 downregulated genes in the same ranking were DUOX2, SLC6A14, CXCL1, MMP3, TNIP3, S100A8, IL8, DEFB4A, CHI3L1 and KLK10 (Figure 1A and B).
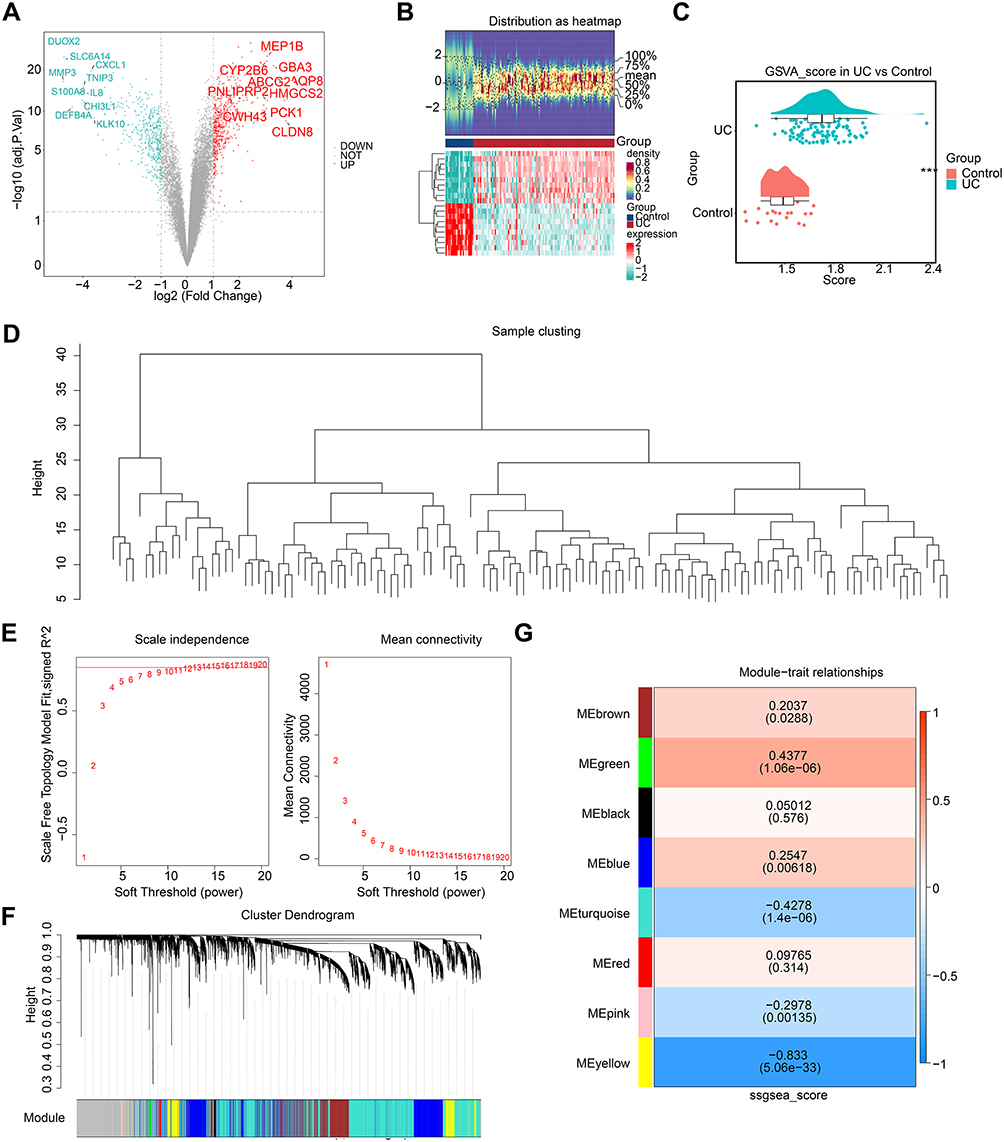 |
Figure 1 Differentially expressed genes between the UC group and the Normal group. (A) Volcano plot of differential gene analysis. Red dots represent upregulated genes, green dots represent downregulated genes, and grey dots represent genes with no significant difference or smallfold changes. (B) Heatmap of differential gene analysis. The upper half displays a heatmap of expression density, while the lower half shows the expression heatmap. (C) Boxplot of GSVA scores based on NLRP3-RGs between UC and Control samples. (D)Hierarchical clustering analysis. (E) The scale-free fit index (left panel) and mean connectivity (right panel) for various soft-thresholding powers. (F) Cluster dendrogram of genes enriched based on dissimilarity measure and assignment modules. The upper half displays a hierarchical clustering dendrogram of genes, while the lower half shows the gene modules. (G) Heatmap of the correlation between module genes and UC. The horizontal axis represents the groups, the values in the heatmap indicate the correlation, and the values in parentheses denote the p-values, with red indicating a positive correlation and green indicating a negative correlation. Statistical significance: ***P < 0.001. |
Construction of WGCNA Modules Associated with NLRP3 Inflammasome
The NLRP3-RGs related ssGSEA scores showed significant differences between UC and Control samples, with the NLRP3-RGs related ssGSEA scores in UC being higher (Figure 1C). Clustering was performed on all samples of GSE87473, and there were no obvious outlier samples (Figure 1C). Additionally, it was observed that the network built with a soft-thresholding value of 14 and an R2 value of approximately 0.85 more accurately reflected a scale-free topological structure (Figure 1E). On this basis, a total of 8 modules related to UC were identified (Figure 1F). Additionally, the MEyellow module, which contained 813 module genes, had a higher correlation with the UC module (Figure 1G).
Functional Enrichment Analysis of 307 Candidate Genes
The intersection of 942 DEGs and 813 genes from the NLRP3-RGs related module yielded a total of 307 NLRP3-RGs related differential genes, which were also referred to as 307 candidate genes (Figure 2A). To understand the molecular function and mechanism, we analyzed the candidate genes for GO and KEGG enrichment. They were mainly enriched in GO enrichment analysis in response to exogenous stimuli, organic acid catabolic process, glucuronosyltransferases, flavin adenine dinucleotide binding, phosphoric monoester hydrolase activity, and cell basement membrane signaling pathway were among various signaling pathways (Figure 2B). They were mainly enriched in KEGG enrichment analysis in the following pathways: chemical carcinogenesis-receptor activation, cAMP signaling pathway, retinol metabolism, peroxisome, and steroid hormone biosynthesis signaling pathway (Figure 2C). Ultimately, a PPI network was established, which included 198 nodes and 445 interactions. These included the following relationship pairs: CNGA1-CDHR1, FZD5-PDE6A, CNTN3-INPP5J, etc (Figure 2D).
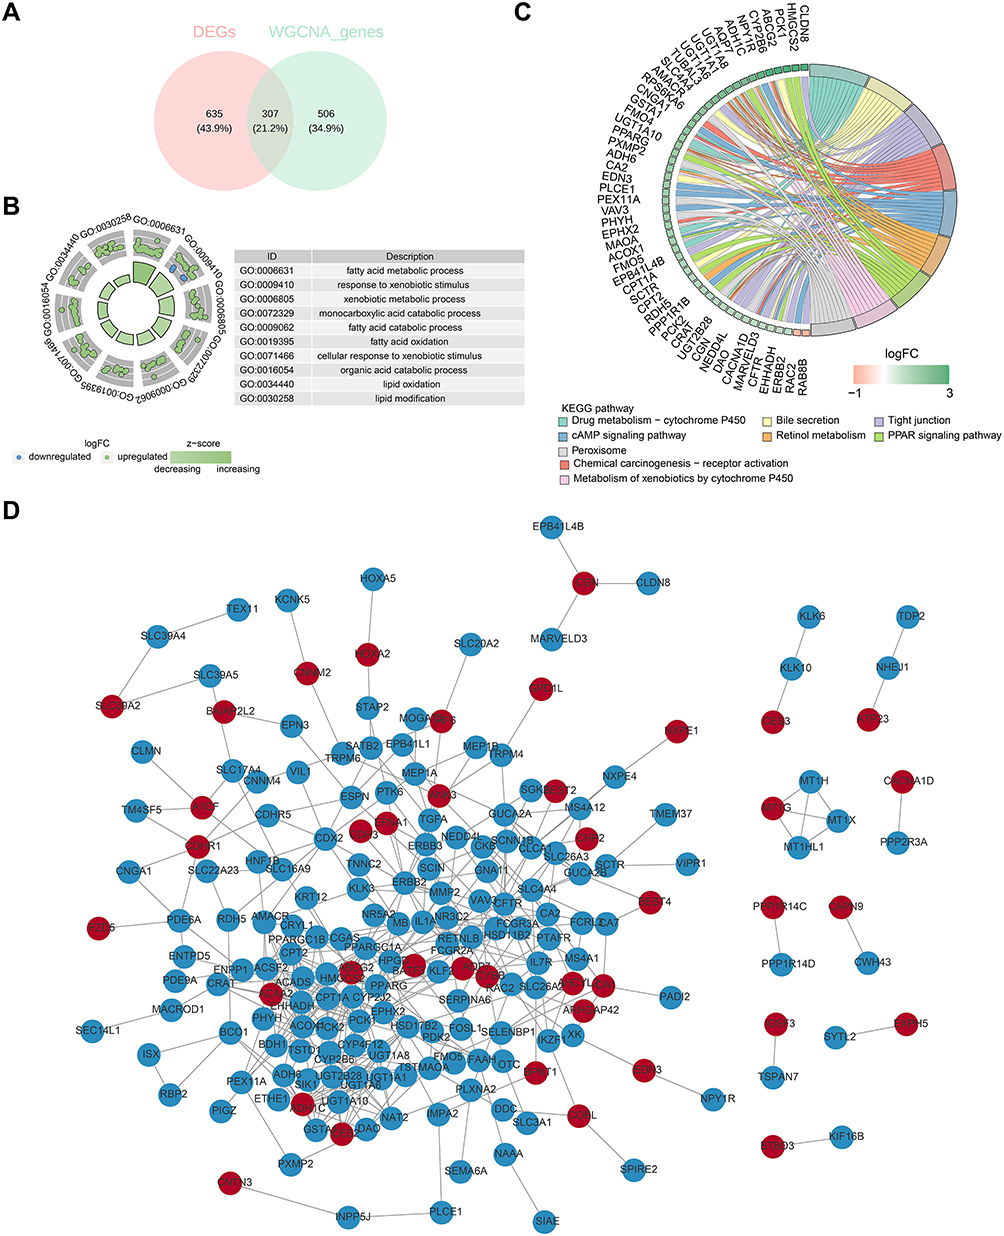 |
Figure 2 Identification and enrichment analysis of candidate genes. (A) Venn diagram of candidate gene. (B) GO enrichment results of differential candidate genes. The horizontal axis represents the enrichment factor, the vertical axis represents the pathway names, the size of the dots indicates the number of enriched genes in the pathway, and the colour represents the range of p-values. (C) KEGG enrichment results of differential candidate genes. Lines of different colours represent different pathway names, with gene names on the left side. (D) The protein-protein interaction network of candidate genes. |
Prioritization of Nine Candidate Key Genes via Mendelian Randomization (MR)
In the IEU OpenGWAS database, exposure factors for the 307 candidate genes were obtained. Subsequently, through gene-to-Ensembl ID conversion, 290 exposure factors were retained. After being subjected to a process of filtration and examination, PPARGC1A, PADI2, TEX11, SEC14L1, TST, GIPC2, NAAA, SLC16A9, and SERPINA6 exhibited notable correlations with the end results (Supplemental Table S2). Elaborately, the genes (PPARGC1A, TEX11, SEC14L1, GIPC2, NAAA, and SERPINA6) were inversely related to UC, while PADI2, TST, and SLC16A9 showed a positive correlation with UC (Figure 3). Additionally, under the IVW method, the elevation of these six exposure factors — PPARGC1A, TEX11, SEC14L1, GIPC2, NAAA, and SERPINA6 — reduced the risk of developing UC. The increase of the four exposure factors — PADI2, TST, GIPC2, and SLC16A9 - increased the risk of UC (Supplemental Figure S1). Moreover, the SNP distribution was generally symmetric and evenly numbered, indicating the chosen instrumental variables complied with Mendel’s second law (Supplemental Figure S2). In sensitivity analysis, the heterogeneity Q_pval for all nine genes was greater than 0.05, indicating no evidence of heterogeneity (Supplemental Table S3). And they did not exhibit horizontal pleiotropy. That is to say, the genes that were ultimately retained were: PPARGC1A, TEX11, SEC14L1, GIPC2, NAAA, SERPINA6, PADI2, TST, and SLC16A9 (Supplemental Table S4). And there was no significant skew in the distribution of all SNPs (Figure 4). Moreover, the SNP r2.exposure for all nine genes was greater than the SNP r2.outcome, and the result for the correct causal direction was TRUE, hence these nine genes were designated as candidate key genes (Supplemental Table S5). The co-localization analysis results showed that the PP.H4 values for all candidate genes were below 0.002 (range: 7.85×10⁻⁵ to 1.36×10⁻³), with no gene reaching the significant co-localization threshold. This suggests that the gene expression regulatory signals and UC risk signals at these loci may be driven by distinct causal variants (Supplementary Table S6).
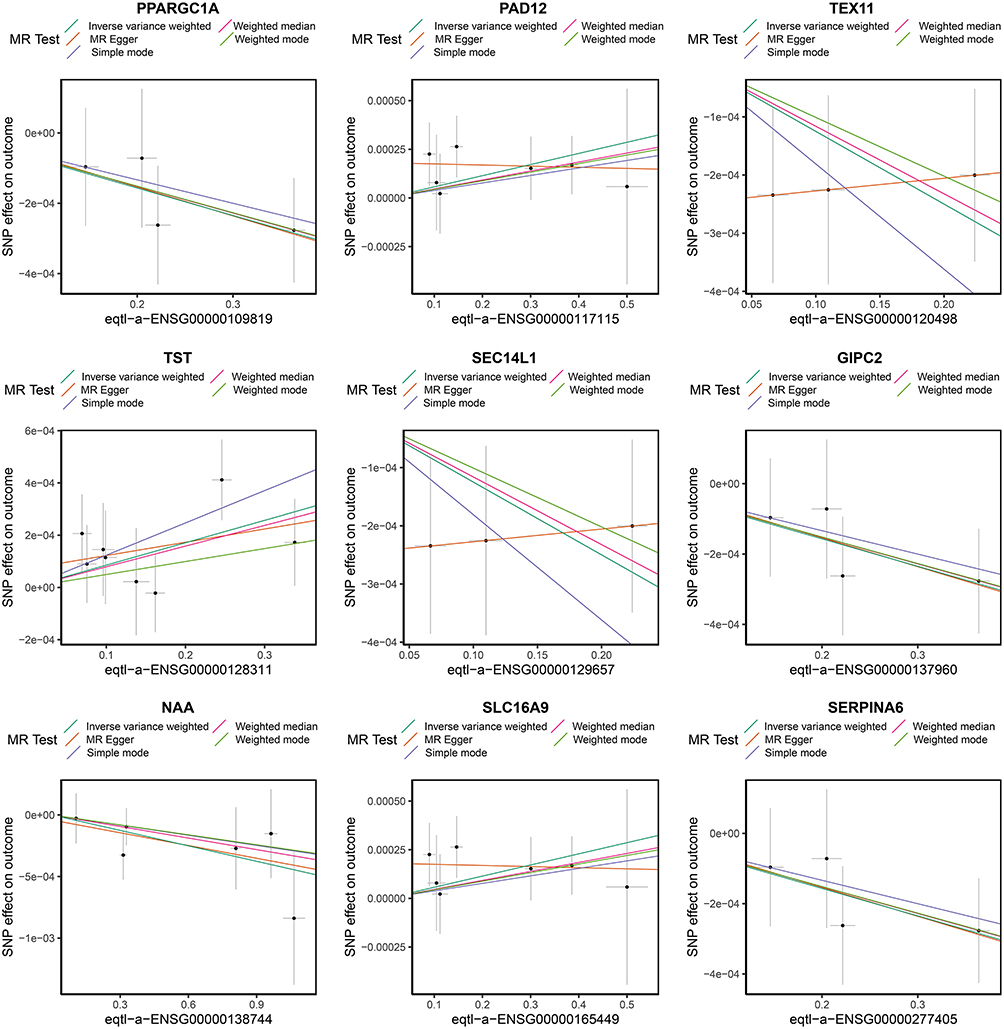 |
Figure 3 MR analysis scatter plot of candidate genes. Scatter plot illustrating the relationship between candidate genes (PPARGC1A, PAD12, TEX11, TST, SEC14L1, GIPC2,NAA, SLC16A9, and SERPINA6) and GWAS data of UC. Scatter plot: The x-axis represents the impact of SNPs on exposure, and the y-axis represents the impact of SNPs on outcomes. SNPs: single nucleotide polymorphisms. MR: Mendelian randomization. |
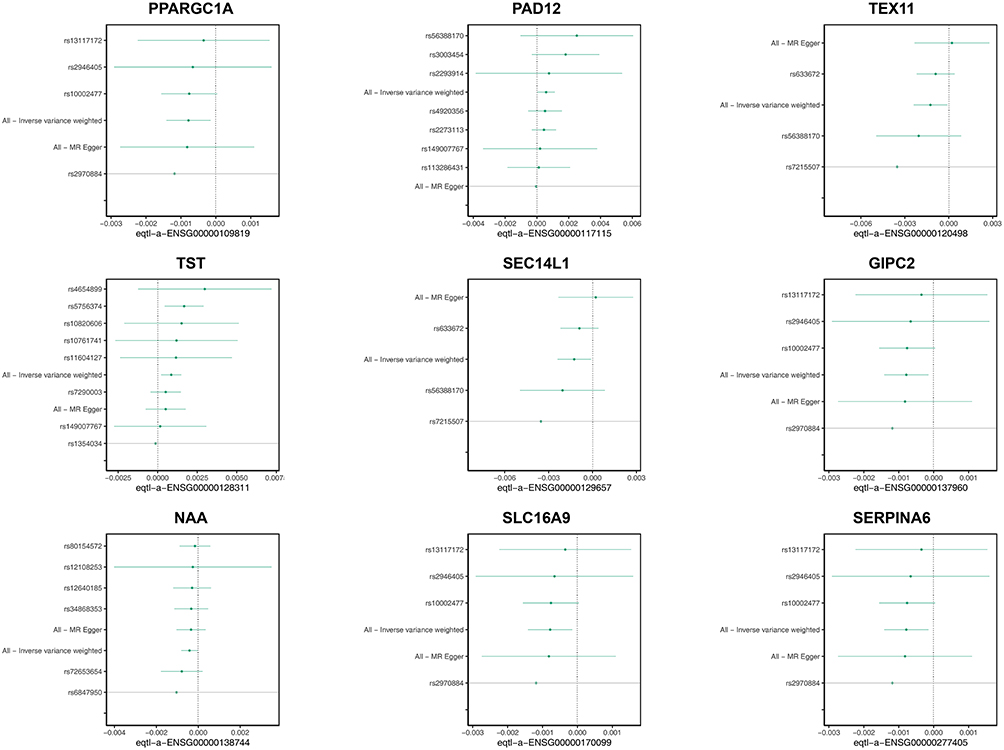 |
Figure 4 Retention analysis of candidate genes (PPARGC1A, PAD12, TEX11, TST, SEC14L1, GIPC2,NAA, SLC16A9, and SERPINA6). |
Validation and Identification of PPARGC1A, NAAA, and GIPC2 as Key Genes
To explore the diagnostic value of the above candidate key genes, corresponding ROC curves were plotted in GSE87473 and GSE75214. In GSE87473, the AUC values of the ROC curves for the nine genes were all greater than 0.7, indicating these genes could effectively distinguish UC (Supplemental Figure S3).
In GSE75214, the AUC values for five genes (PPARGC1A, SEC14L1, NAAA, PADI2, GIPC2) were greater than 0.7. However, the AUC values for the other genes (TEX11, TST, SLC16A9, and SERPINA6) were all less than 0.7, suggesting that these four genes lacked the ability to differentiate between disease and control samples (Supplemental Figure S4). Furthermore, in the analysis of candidate key genes expression across GSE87473 and GSE75214, SEC14L1 was identified as being upregulated, whereas PPARGC1A, NAAA, PADI2, and GIPC2 were recognized as being downregulated (Supplemental Figure S5). The OR values for PPARGC1A, NAAA, and GIPC2 were less than 1, and they were identified as downregulated genes. The expression validation results were consistent with the findings from the MR analysis. The OR value for PADI2 was greater than 1. However, it was also a downregulated gene, and the results from the MR analysis did not align with the expression validation findings. Similarly, the OR value for the SEC14L1 was less than 1, but it was an upregulated gene, and again, the MR results did not match the expression validation outcomes. Therefore, we selected and retained the genes (PPARGC1A, NAAA, and GIPC2) as our key genes. Meanwhile, the key genes also showed a significant decrease in expression in the UC group within the GSE87466 dataset (p < 0.05) (Supplemental Figure S6).
Mechanistic Insights Into Key Genes and Associated Pathways in UC
Utilizing GeneMANIA, we predicted functionally analogous genes for the key genes and obtained a list of 20 such genes. In the visualization, the key genes were placed in the inner circle, encircled by the outer circle which contained the genes predicted to be similar. They coincided to varying degrees in physical interactions, Co.expression, Predieted, 2o-loenlizntion Figure 5A). Further GOSemSim analysis revealed strong functional similarities among these three key genes (Figure 5B). In the comparative analysis of UC versus control samples, 46 diabetes-associated pathogenic genes were identified with significant differential expression. Notably, ENPP1 and PPARG were both found to be significantly and positively correlated with the key genes of this research (|cor| > 0.6 and p < 0.001). Conversely, PPARGC1A was observed to have significant negative correlations with IL2RA, SOD2, IL1RN, and SOCS1 (|cor| > 0.6 and p < 0.001). Additionally, NAAA exhibited a significant negative correlation with IL2RA (|cor| > 0.6 and p < 0.001), and GIPC2 was identified to have significant negative correlations with both FOXP3 and IL2RA (|cor| > 0.6 and p < 0.001) (Figure 5C). Additionally, PPARGC1A was predominantly enriched in various signaling pathways, including the hematopoietic cell lineage pathway, Leishmaniasis infection pathway, cytokine-cytokine receptor interaction pathway, oxidative phosphorylation pathway, fatty acid metabolism pathway, and cell adhesion molecules pathway (Figure 5D). NAAA was found to be predominantly linked to pathways such as the hematopoietic cell lineage, oxidative phosphorylation, as well as pathways related to Parkinson’s disease, and Alzheimer’s disease (Figure 5E). Lastly, GIPC2 showed a strong connection to pathways including the hematopoietic cell lineage, fatty acid metabolism, cell adhesion molecules, peroxisome, and systemic lupus erythematosus pathways, among others (Figure 5F).
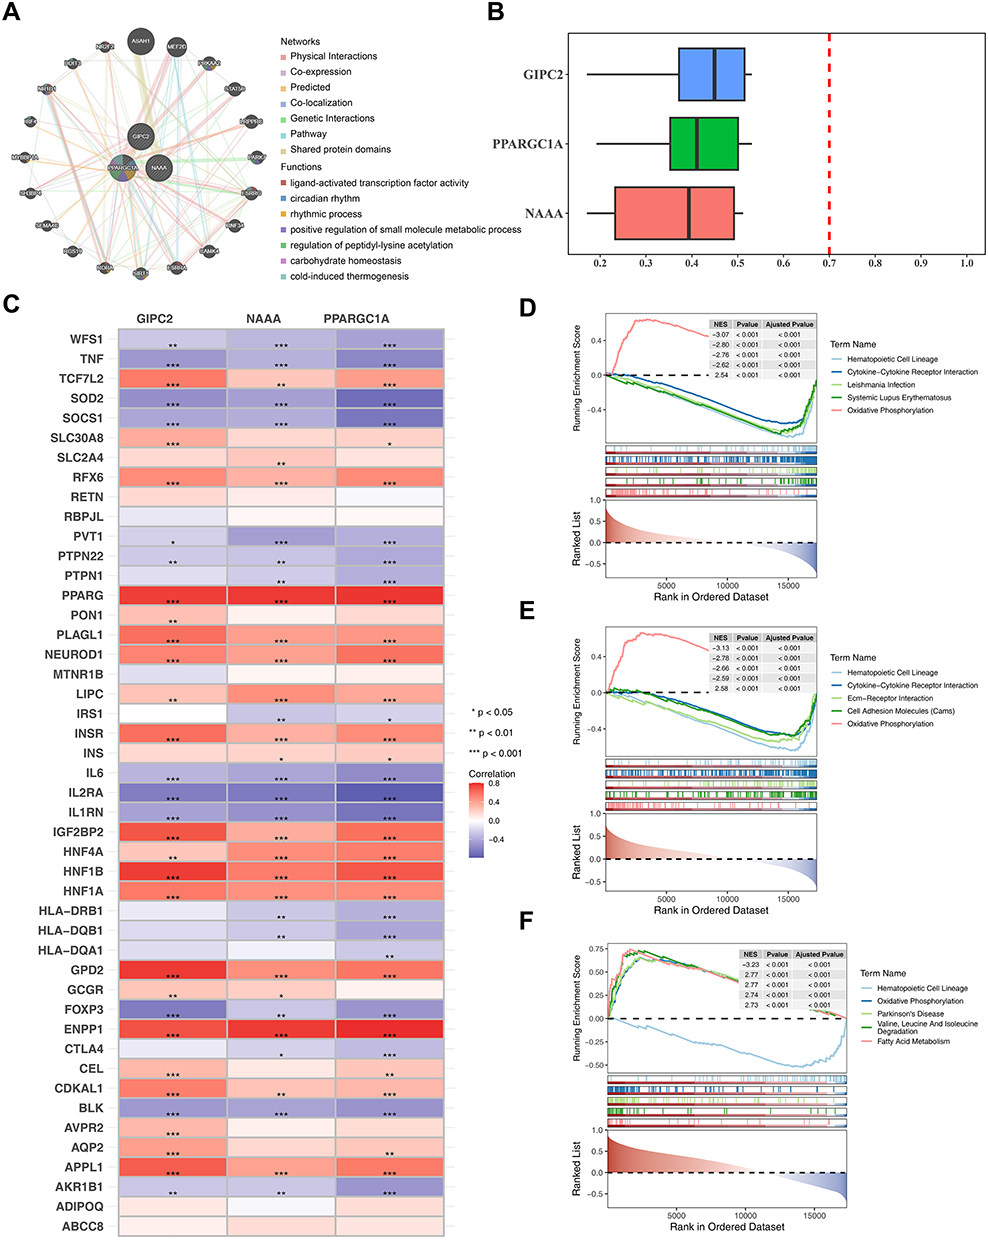 |
Figure 5 Analysis of functionally similar gene visualization of key genes. (A) Protein-protein interaction network. The connecting colors in the figure representing different modes of action, and the color in the circle indicating the functional signaling pathway that the gene is enriched in. (B) Box plot of functional similarity of key genes (C) Correlation analysis of key diabetes-associated genes.(D–F) Predominantly enriched in various signaling pathways of PPARGC1A, NAAAAND and GIPC2. Statistical significance: Blank = not significant, *P < 0.05, **P < 0.01, ***P < 0.001. |
Immune Infiltration Profiling Related to Key Genes
Immune infiltration was quantified using the CIBERSORT algorithm, which profiles 20 immune cell types in UC and control samples. A total of 11 immune cell subsets were significantly dysregulated in UC compared to controls (P < 0.05, Figure 6A). Given the established role of NLRP3 inflammasome in recruiting innate immune cells, we assessed correlations between key genes and immune infiltrates. Specifically, activated NK cells, activated mast cells, and M2 macrophages were positively correlated with the three key genes (|r| > 0.3, P< 0.05), while resting mast cells, M0 macrophages, and Neutrophil cells showed negative correlations (|r| > 0.3, P < 0.05), aligning with the pro-inflammatory microenvironment of UC (Figure 6B).
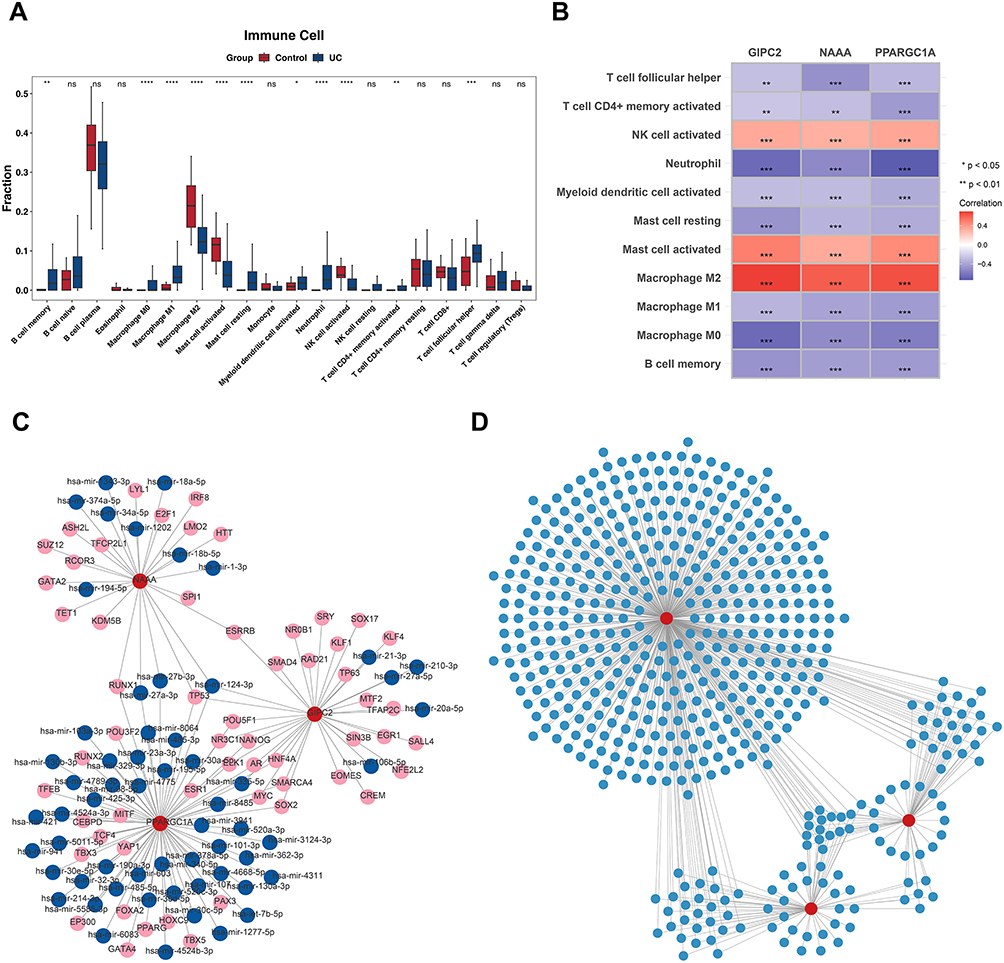 |
Figure 6 Immune-infiltration analysis. (A) The difference in 16 types of immune cells between the UC and control group. (B) Analysis of the correlation between different immune cells and between different immune functions. Red indicates a positive correlation, while blue indicates a negative correlation. (C) TF-key gene-miRNA regulatory network. (D) Key gene-corresponding drug network. Statistical significance: ns = no significant,*P < 0.05, **P < 0.01, ***P < 0.001, ****P < 0.0001. |
Prediction of Regulatory Networks and Therapeutic Compounds
To investigate the regulatory network regulating the key genes, 57 TFs and 60 miRNAs were identified through research. Subsequently, a TF-key gene-miRNA regulatory network was constructed, which contained 119 nodes and 134 edges. These included the following relationship pairs: SMAD4-GIPC2-hsa-mir-106b-5p, PAX3-PPARGC1-hsa-mir-130b-3p, TET1-NAAA-hsa-mir-1-3p, etc. (Figure 6C). Then, a total of 578 drugs were identified to be associated with the key genes. Following this, a network of key genes and corresponding drugs was established, comprising 527 nodes and 615 connections. These included the following relationship pairs: PPARGC1A-Metformin, NAAA-abrine, GIPC2-Pectins, etc. (Figure 6D).Utilized molecular docking to evaluate the interactions between the protein structures (Supplemental Table S7) and their respective compounds, the calculated binding energies revealed significant binding affinities between PPARGC1A and Rosiglitazone (Figure 7A), and between GIPC2 and Benzo(a)pyrene in the past study (Figure 7b).
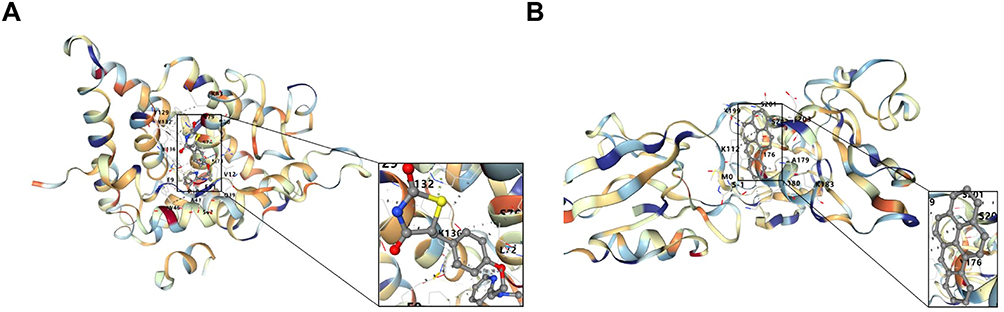 |
Figure 7 Molecular docking of PPARGC1A-Rosiglitazone and GIPC2-Benzo pyrene magnification of interaction residues showing types of bonds. (A) PPARGC1A-Rosiglitazone. The helical structure represents the protein structure of the gene. The small - molecule ligand is displayed as a stick model inside the protein structure. The black box marks the binding pocket (active site) region where the ligand interacts with the protein. The dotted lines represent the non - covalent interactions formed between the protein and the ligand. (B) GIPC2-Benzo pyrene. |
Subsequently, two MD simulations were conducted separately for the two proteins, PPARGC1A and GIPC2, and their corresponding compounds, with each simulation lasting 100 ns. Root Mean Square Deviation (RMSD) is used to characterize the distance of the same atom in different structures; the results showed that in both simulations, the RMSD values of the complexes formed by the two proteins and their ligands were within the range of 0–30 nm, indicating that their binding states were relatively stable (Figure 8A and B). Root Mean Square Fluctuation (RMSF) reflects the average change in atomic positions over time and can be used to evaluate the flexibility and movement intensity of protein amino acids throughout the simulation process. The results showed that within the duration of both simulations, the protein amino acids maintained good flexibility, and their binding states with the small-molecule drug ligands remained stable (Figure 8C and D). Energy results in molecular dynamics simulations are important indicators for evaluating simulation stability and system state. The results indicated that within the duration of both simulations, the energy fluctuation of the proteins was small, and the overall state remained stable (Figure 8E and F). The core analysis diagram for the binding stability of small-molecule ligands to target proteins is used to assess the binding tightness between different small-molecule compounds and their corresponding target proteins over the simulation time. The results of the first simulation showed that during the simulation, except for PPARGC1A_Resveratrol and PPARGC1A_Rotenone, the distance fluctuations of the other complexes were small, and they remained in a stable state. The results of the second simulation showed that during the simulation, except for GIPC2_bisphenol A, PPARGC1A_Resveratrol, and PPARGC1A_Rotenone, the distance fluctuations of the other complexes were small, and they remained in a stable state (Figure 9A and B). The dynamic tracking diagram of the binding distance between key amino acid residues of GIPC2 protein and specific small-molecule compounds showed that in the first simulation, the binding distance fluctuation was small and stable in the early and middle stages of the simulation, while large fluctuations occurred in the later stage. In the second simulation, the binding distance fluctuation was small and stable in the middle stage of the simulation, while large fluctuations occurred in the early and later stages (Figure 9C and D). The dynamic tracking diagram of the binding distance between key amino acid residues of PPARGC1A protein and specific small-molecule compounds showed that in both simulations, the binding distance showed a trend of being stable initially and then fluctuating upward, and after the upward trend, the distance fluctuation was roughly maintained within the range of 20–60 nm (Figure 9E and F). Molecular docking predicts the structural feasibility of this interaction. However, these in silico findings require experimental validation, such as surface plasmon resonance to quantify binding affinity and cellular assays to confirm functional effects, before they can inform targeted therapy development.
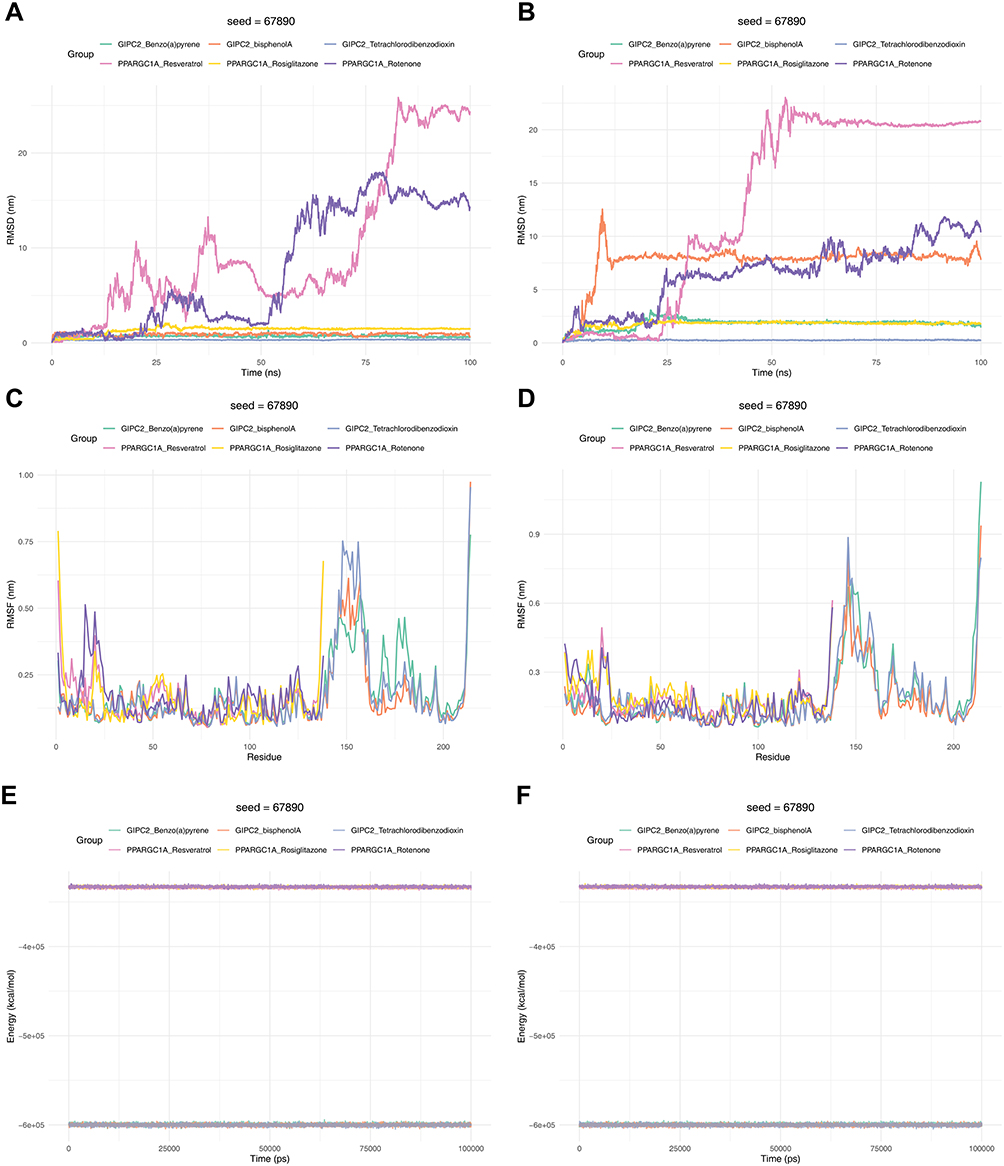 |
Figure 8 The results of molecular dynamics simulation. (A and B) root mean square deviation (RMSD) plot of the protein. A represents the results of the first simulation, and B represents the results of the second simulation. The x-axis represents time, and the y-axis represents RMSD. (C and D) Root Mean Square Fluctuation (RMSF) plot of the protein. C represents the results of the first simulation, and D represents the results of the second simulation. The x-axis represents residue number, and the y-axis represents RMSF. (E and F) Energy analysis of the protein. E represents the results of the first simulation, and F represents the results of the second simulation. The x-axis represents time, and the y-axis represents free energy. |
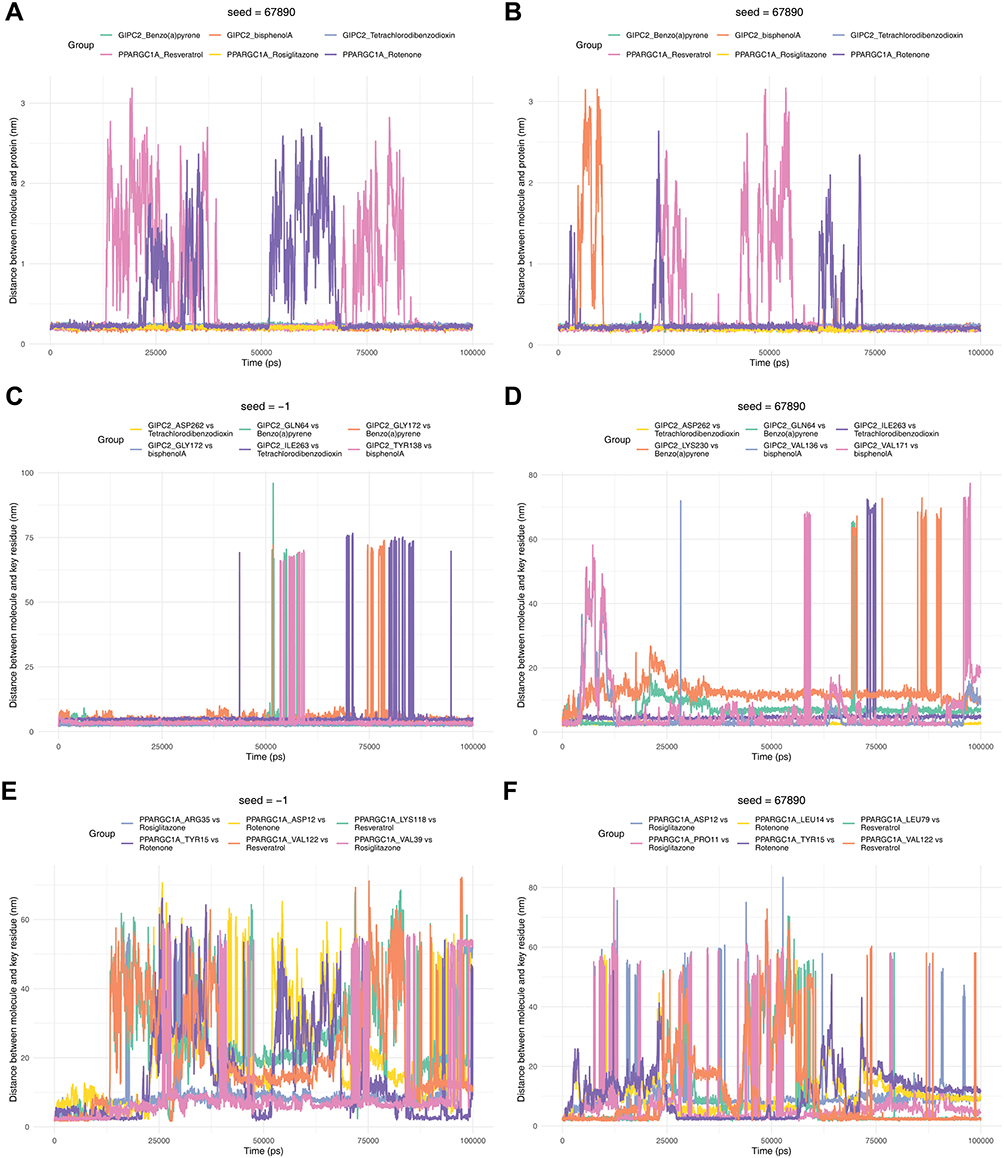 |
Figure 9 The distance between small molecule ligands and target proteins. (A and B) Distance between small-molecule ligand and target protein. The horizontal axis represents time, and the vertical axis represents ligand-protein distance. A represents the results of the first simulation, and B represents the results of the second simulation. (C and D) Binding distance between GIPC2 protein amino acid residues and small molecule. The horizontal axis represents time, and the vertical axis represents the distance between the molecule and key residues. C represents the results of the first simulation, and D represents the results of the second simulation. (E and F) Binding distance between PPARGC1A protein amino acid residues and small molecule. The horizontal axis represents time, and the vertical axis represents the distance between the molecule and key residues. E represents the results of the first simulation, and F represents the results of the second simulation. |
In Vivo Validation of Key Genes in the DSS-Induced Colitis Model
To experimentally validate the bioinformatic predictions that PPARGC1A, NAAA, and GIPC2 are suppressed in UC, we established a DSS-induced colitis mouse model. We hypothesized that the downregulation observed in human datasets would be recapitulated in this acute inflammatory setting. WB results showed a significant decrease in the expression of target proteins PPARGC1A, GIPC2, and NAAA in the model group compared to the normal group (Figure 10A). These findings support the association between the key genes and UC pathogenesis observed in bioinformatics analyses, though larger cohorts are needed to validate direct mechanistic links to the NLRP3 axis.
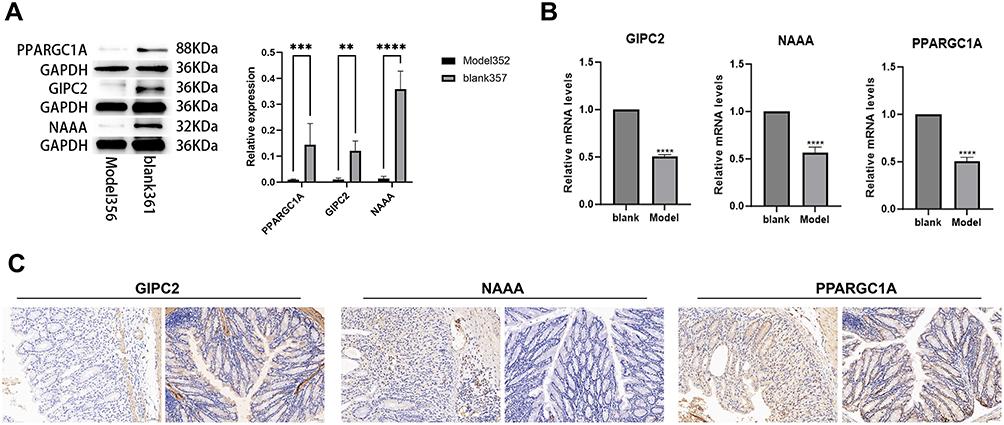 |
Figure 10 Immunohistochemistry of Paraffin Sections. (A) Western blots of PPARGC1A, GIPC2, and NAAA proteins in blank (normal) and model (DSS-induced colitis) mice. (B) qPCR analysis of corresponding mRNA levels. (C) Immunohistochemistry staining of these targets in blank (left) and model (right) groups. Statistical significance: **P < 0.01, ***P < 0.001, ****P < 0.0001. |
The qPCR results revealed that the expression levels of NAAA, PPARGC1A, and GIPC2 genes in the model group were significantly lower than those in the normal group, with the differences being statistically significant (P < 0.01) (Figure 10B).
Immunohistochemistry results showed that the positive area, tissue area, mean optical density, and positive rate (%) of GIPC2 in the model group were significantly lower than those in the normal group, with the differences being statistically significant (P < 0.01) (Figure 10C). Similarly, the positive area, mean optical density, and positive rate (%) of PPARGC1A in the model group were significantly lower than those in the normal group (P < 0.01). The positive area, mean optical density, and positive rate (%) of NAAA in the model group were also significantly lower than those in the normal group (P < 0.01).
Discussion
UC is a chronic inflammatory bowel disease whose pathogenesis involves abnormal activation of the immune system, dysbiosis of the intestinal flora, and other factors.36 NLRP3 inflammasome is an important inflammasome involved in the regulation of inflammatory response and apoptosis.37 In this study, we explored the potential mechanism of NLRP3-INF-mediated ulcerative colitis by transcriptomics and MR analysis methods, identified a set of candidate key genes, and explored the roles and regulatory mechanisms of these genes in disease development.
In this study, we searched for NLRP3-INF-associated key genes in UC by transcriptome and MR analysis methods, and explored the biological pathways and regulatory mechanisms involved in the key genes. We began by conducting differential gene expression analysis on transcriptome data from UC patients to identify DEGs between groups. Subsequently, GSVA on NLRP3 inflammasome-related genes to generate scores indicative of their activity across samples was performed.Using WGCNA, we correlated these scores with the genes to identify a module of NLRP3-RGs. We then intersected the DEGs from the training set with the NLRP3-RGs to reveal candidate key genes and the pathways they are involved in.
Additionally, we analyzed the protein interactions of these candidate key genes.hen we used the key candidate genes for MR analysis. From the GWAS data, we gathered 290 eQTL-GWAS variables to conduct MR analysis concerning 307 potential genes. The univariate MR analysis centered on UC as an endpoint revealed that nine genes—PPARGC1A, PADI2, TEX11, SEC14L1, TST, GIPC2, NAAA, SLC16A9, and SERPINA6—significantly link to ulcerative colitis. Moreover, the multivariate analysis confirmed the stability and reliability of these findings, guiding our subsequent investigations focusing on these impactful nine genes. Next, the ROC curve was used to evaluate the 9 key genes, identifying only 5 key genes with high diagnostic accuracy (AUC>0.7) in both the validation and training sets. In addition,Expression consistency and MR analysis results led to the identification of 3 key genes (PPARGC1A, GIPC2, and NAAA). In addition,Expression consistency and MR analysis results led to the identification of 3 key genes (PPARGC1A, GIPC2, and NAAA). Then, GSEA analysis was performed on the three key genes to precisely identify the pathways and functions. Subsequently, the GeneMANIA network was constructed to explore the internal linkage between the key genes, and the functional similarity between the key genes was explored. Using the CIBERSORT method, we compared immune cell infiltration characteristics between UC and control samples, identifying significant differences in 11 of 28 immune cell types. Correlations between immune cells and the 3 key genes were also analyzed, providing further insights into the roles of these genes in UC pathogenesis.
Among the 9 candidate key genes identified by MR analysis, PPARGC1A, which encodes a transcriptional co-activator, is known to play a crucial role in the regulation of immune responses and energy metabolism. It has been implicated in the pathogenesis of UC, potentially through the modulation of inflammatory factor expression.38 PADI2, a protein coenzyme, has been recognized for its importance in autoimmune diseases. It is involved in the regulation of inflammatory responses and may influence UC by modulating protein ubiquitination levels.39 Notably, PADI2 was found to be downregulated in UC samples, and the pan-PADI2 inhibitor CI-amidine demonstrated efficacy in reducing inflammation in a mouse model, suggesting distinct roles for PADI2 in inflammatory cells and differentiated epithelial cells.40 GIPC2 is integral to cell signaling and protein interactions, and while its specific role in inflammatory diseases requires further investigation, it is associated with cellular processes such as polarity and signal transduction, which may be regulatory in UC development.41 NAAA encodes an enzyme that has been confirmed to be involved in inflammation regulation and lipid metabolism. It may influence inflammatory responses by regulating the endocannabinoid system, thereby affecting the occurrence and development of ulcerative colitis (UC).41 The discovery of these candidate key genes provides new clues for the study of the pathological mechanisms of UC, and further experiments and studies will help to reveal the specific mechanisms of their roles in the development of the disease. Studies have shown that certain key genes are closely associated with the activation of NLRP3 inflammatory vesicles and inflammatory regulatory processes.42 PPARGC1A may influence NLRP3 inflammasome activation by regulating mitochondrial function and (Reactive Oxygen Species) ROS production.40 Its role in inflammatory regulation and immune response may be linked to the activation of NLRP3 inflammasome. GIPC2 fulfills a function in cell signalling and protein interactions and may be involved in inflammatory regulation by regulating the assembly and activation of NLRP3 inflammasome.43 Its relationship with the NLRP3 inflammatory vesicle needs to be further investigated to reveal its specific role in ulcerative colitis. NAAA functions as in inflammatory regulation and lipid metabolism, and may be involved in regulating the activation of the NLRP3 inflammatory vesicle and inflammatory response through modulation of the endogenous cannabinoid system.44 Its interaction with NLRP3 inflammatory vesicles may have an impact on the development of ulcerative colitis.45 It is noteworthy that although Mendelian randomization analysis supports a causal association between PPARGC1A/NAAA and UC (Bonferroni-corrected P < 1.63×10⁻⁴), and colocalization analysis (PP.H4 > 0.85) excludes confounding due to linkage disequilibrium, certain limitations remain. The eQTL data utilized in this study were primarily derived from blood samples, which may not fully represent the gene regulatory environment of colon tissue; furthermore, MR results reflect the long-term aggregate effects of genetic variation and cannot be directly equated with the transient effects of pharmacological interventions. Therefore, we consider PPARGC1A and others as “potential intervention targets” rather than validated clinical targets, and their specific molecular mechanisms in NLRP3 inflammasome activation still require clarification through gene knockout or overexpression experiments.
miRNAs and TFs with regulatory roles with key genes (PPARGC1A, GIPC2, NAAA) were also identified in the study. The interaction between these regulatory factors and key genes may fulfill a crucial function in the development of UC. The following are some of the miRNAs and TFs that have been reported to have regulatory roles and the possible regulatory mechanisms between them and key genes: MicroRNA-155 (miR-155) has been reported to exert a pivotal influence in inflammatory bowel disease (IBD) by potentially modulating the expression levels of key genes such as PPARGC1A and Through targeting the mRNAs of these genes, miR-155 is believed to influence their expression levels, thereby regulating inflammatory responses and immune processes. Furthermore, miR-155 may interact with other miRNAs, such as miR-21, to form a complex network impacting IBD development and progression. In terms of its mechanism of action, miR-155 is likely to downregulate the expression of PPARGC1A and, which are involved in cellular metabolism and inflammation, respectively. This may affect cellular metabolism and the modulation of inflammatory responses. Additionally, miR-155 may interact with pivotal TFs like NF-κB and STAT3, which are pivotal in inflammation regulation, to modulate inflammatory signaling pathways.The effects of miR-155 are not limited to a single cell type; its expression can be regulated in immune cells (eg., monocytes, lymphocytes) as well as intestinal epithelial cells, affecting inflammatory responses and immune processes Experimental validation of these regulatory mechanisms can be achieved through a combination of in vitro cell culture experiments, murine models, and clinical sample studies. Cell culture experiments can mimic the inflammatory state to observe the impact of miR-155 on gene expression, murine models can unveil the role of miR-155 in the pathogenesis of IBD, and clinical sample studies can confirm the expression levels of miR-155 in patient samples and their relevance to the disease.46 miR-21 also fulfill a crucial function in inflammatory diseases, and may be correlated with GIPC2. miR-21 may affect cell signalling and inflammatory regulation by regulating GIPC2, which may in turn affect UC development.47 NF-κB is an important TF that plays a key role in the inflammatory response and immune regulation.48 NF-κB may regulate the inflammatory process by modulating NAAA and influence the activity of the endogenous cannabinoid system.49 STAT3 is another important TF that has been implicated in inflammatory bowel disease.50 STAT3 may be associated with the expression of PPARGC1A, which is involved in inflammatory regulation and immune response by regulating PPARGC1A.51 Integrating the roles of miRNAs, TFs, and key genes in the regulatory network, biomarkers may regulate the developmental process of UC by influencing the expression levels of these regulators. For example, miR-155 and NF-κB may co-regulate the expression of NAAA, affecting the activity of the endogenous cannabinoid system, which in turn influences the inflammatory response and damage repair of intestinal tissues. The in-depth study of these regulatory networks can help to reveal the mechanism of biomarkers in UC and provide new ideas for the treatment and management of the disease.
To corroborate these observations, we employed WB, RT-qPCR, and immunohistochemistry. Western blot analysis demonstrated diminished PPARGC1A protein levels in the model group relative to controls, while GIPC2 and NAAA exhibited pronounced decreases. Gene expression profiling via RT-qPCR confirmed significantly reduced mRNA levels of NAAA, PPARGC1A, and GIPC2 in the model group (P < 0.01). Immunohistochemical quantification revealed that all three proteins-GIPC2, PPARGC1A, and NAAA-displayed markedly lower positively-stained areas, mean optical densities, and percentage positivity in the model group compared to controls (P < 0.01). These experimental results further confirmed the expression changes of PPARGC1A, GIPC2, and NAAA in UC, which were consistent with our transcriptomics and MR analysis results and provided strong evidence for these genes as potential biomarkers for UC. Some scholars have reported that the expression of PPARGC1A was downregulated in IBD clinical samples, the colons of DSS-induced colitis mice, and DSS-stimulated colonic epithelial cells.36 Based on the identified key genes, we speculate that certain drugs may have the potential to treat UC. Specifically, regulating key genes such as PPARGC1A, GIPC2, and NAAA through targeted drugs is a promising treatment intervention strategy. PPARγ agonists (such as pioglitazone) may affect inflammation and tissue repair by regulating the activity of PPARGC1A, which may enhance cellular energy metabolism and promote tissue regeneration, beneficial to the treatment of UC.In addition, kinase inhibitors targeting GIPC2 (which is involved in cell signal transduction) may regulate the inflammatory response by changing signal pathways. Furthermore, cannabinoid system regulators (including cannabinoid receptor antagonists) may regulate the inflammatory process by regulating the activity of NAAA, which may affect lipid metabolism and inflammatory regulation, providing a unique approach for the treatment of UC. These drug intervention measures provide a detailed method for affecting the dysregulated cellular functions in UC and may reduce inflammation and tissue damage, providing valuable insights for formulating targeted treatment strategies for this complex disease.This study presents three key innovations: First, we are the first to integrate multi-cohort transcriptomics with MR to move beyond correlation and establish causal links between NLRP3-related genes and UC risk, overcoming the limitation of prior studies relying solely on observational data. Second, we identified three novel key genes (PPARGC1A, NAAA, GIPC2) specifically associated with NLRP3 inflammasome activity in UC, none of which have been previously reported as causal drivers in this context. Third, we bridged computational predictions with preclinical validation by combining drug-binding simulations and DSS-induced mouse model experiments, providing a translational roadmap for targeting these genes in UC therapy.
This study provides valuable insights into the role of the NLRP3 inflammasome and its associated genes in ulcerative colitis (UC); however, several limitations should be acknowledged. First, the relatively small sample sizes of the transcriptomic datasets (GSE87473 and GSE75214) and animal experiments (eg., n = 5 mice per group) may reduce statistical power and limit the generalizability of the findings. Although the DSS-induced mouse model is widely utilized, it fails to fully recapitulate the complex immune and microbial interactions observed in human UC, thereby constraining its translational relevance. In addition, the MR analysis in this study relies on three core assumptions. Although we have minimized bias through strict single nucleotide polymorphism (SNP) screening and sensitivity analyses, there may still be unrecognized horizontal pleiotropy or residual linkage disequilibrium in the actual study, which could affect the accuracy of causal inference.Biologically, while Western blotting (WB), RT-qPCR, and immunohistochemical analyses validated the expression trends of candidate genes (eg., PPARGC1A, GIPC2, NAAA) in murine models, the absence of validation in human tissues hinders direct clinical applicability. Furthermore, the predicted regulatory networks involving transcription factors (TFs), miRNAs, and drug candidates, though insightful, remain hypothetical due to a lack of experimental validation (eg., luciferase assays or functional studies). Finally, this study focused on transcriptomic data without integrating proteomic or metabolomic layers, potentially overlooking post-transcriptional or metabolic contributors to UC pathogenesis.
To address these limitations, future research should expand sample sizes across diverse cohorts and validate key findings in human UC tissues. Advanced models, such as patient-derived organoids or multi-omics approaches, could enhance biological relevance and bridge the gap between preclinical and clinical studies. Functional experiments (eg., CRISPR-based gene editing) are warranted to elucidate the mechanistic roles of identified key genes in NLRP3 inflammasome regulation. Prospective clinical studies are also needed to evaluate the diagnostic and therapeutic potential of proposed biomarkers (eg., PPARGC1A, GIPC2) and drug candidates (eg., Rosiglitazone, Benzo(a)pyrene). Lastly, integrating proteomic and metabolomic data will provide a more comprehensive understanding of UC pathophysiology and refine targeted therapeutic strategies.
Conclusion
This study is the first to integrate multi-cohort transcriptomics with Mendelian randomization, identify three novel NLRP3 inflammasome-related key genes (PPARGC1A, NAAA, GIPC2) in ulcerative colitis, and bridge computational predictions with preclinical validation. In summary, our findings suggest the connection between UC and NLRP3 inflammasomes, revealing candidate key genes and associated regulatory pathways that offer novel insights into disease pathogenesis. This study provides new candidate diagnostic biomarkers and therapeutic targets for ulcerative colitis (UC), particularly highlighting the PPARGC1A-Rosiglitazone pair as a promising drug-target combination for preclinical development. Nevertheless, additional experimental verification and clinical investigation, such as protein-level quantification of NLRP3 axis markers in independent UC cohorts and gene perturbation experiments (eg., siRNA knockdown, CRISPR activation) in intestinal epithelial/organoid models, are required to establish the validity and therapeutic potential of these results. We remain committed to exploring these mechanisms to advance treatment strategies and clinical management of ulcerative colitis.
Data Sharing Statement
The datasets analysed during the current study are available in the Gene Expression Omnibus (GEO) database, GSE87473 and GSE75214 repository, https://www.ncbi.nlm.nih.gov/gds and genome-wide association study (GWAS) repository, https://gwas.mrcieu.ac.uk/. Data supporting the findings of this study are available from the corresponding author (Yangfeng Huang,[email protected]) upon reasonable request.
Ethics Approval and Consent to Participate
Our study was approved by the Ethics Review Committee of Sichuan Provincial People’s Hospital (Approval No. 2024600, Date: September 29, 2024). The gene expression data used in this study were obtained from the publicly available GEO database (https://www.ncbi.nlm.nih.gov/gds). According to the “Ethical Review Measures for Life Sciences and Medical Research Involving Human Subjects” issued by the National Health Commission of China, studies using publicly available human data without direct contact with subjects are exempt from additional ethical review. This study was conducted and reported in accordance with the ARRIVE (Animal Research: Reporting of In Vivo Experiments) guidelines 2.0 (https://arriveguidelines.org) and the Chinese “Guidelines for Ethical Review of Laboratory Animal Welfare” (GB/T 35892-2018).
Acknowledgments
We thank the entire team for their support and assistance with this study.
Author Contributions
Jian Cheng: Conceptualization, Data curation, Investigation, Writing - original draft.
Yangfeng Huang: Formal analysis, Methodology, Visualization, Supervision, Writing - review & editing. All authors took part in drafting, revising or critically reviewing the article; gave final approval of the version to be published; have agreed on the journal to which the article has been submitted; and agree to be accountable for all aspects of the work.
Funding
The authors declare that no funding was received for this study.
Disclosure
The authors declare no competing interests.
References
1. Kaenkumchorn T, Wahbeh G. Ulcerative Colitis. Gastroenterol Clin North Am. 2020;49(4):655–24. doi:10.1016/j.gtc.2020.07.001
2. Du L, Ha C. Epidemiology and pathogenesis of ulcerative colitis. Gastroenterol Clin North Am. 2020;49(4):643–654. doi:10.1016/j.gtc.2020.07.005
3. Jia L, Zhou H, Li W, Lv Z. Network pharmacology integrated molecular docking revealed the mechanism of jianpi yiqi taohua decoction against ulcerative colitis. Med Sci Monit. 2021;28. doi:10.12659/msm.933537.
4. Hayward JA, Mathur A, Ngo C, Man SM. Cytosolic recognition of microbes and pathogens: inflammasomes in action. Microbiol Mol Biol Rev. 2018;82(4). doi:10.1128/mmbr.00015-18
5. Kong R, Sun L, Li H, Wang D. The role of NLRP3 inflammasome in the pathogenesis of rheumatic disease. Autoimmunity. 2021;55(1):1–7. doi:10.1080/08916934.2021.1995860
6. Zhen Y, Zhang H. NLRP3 inflammasome and inflammatory bowel disease. Front Immunol. 2019;10. doi:10.3389/fimmu.2019.00276.
7. Nadatani Y, Huo X, Zhang X, et al. NOD-like receptor protein 3 inflammasome priming and activation in barrett’s epithelial cells. Cell Mol Gastroenterol Hepatol. 2016;2(4):439–453. doi:10.1016/j.jcmgh.2016.03.006
8. Pashenkov MV, Dagil YA, Pinegin BV. NOD1 and NOD2: molecular targets in prevention and treatment of infectious diseases. Int Immunopharmacol. 2018;54:385–400. doi:10.1016/j.intimp.2017.11.036
9. Ratsimandresy RA, Indramohan M, Dorfleutner A, Stehlik C. The AIM2 inflammasome is a central regulator of intestinal homeostasis through the IL-18/IL-22/STAT3 pathway. Cell Mol Immunol. 2016;14(1):127–142. doi:10.1038/cmi.2016.35
10. Taman H, Fenton CG, Hensel A IV, Florholmen E, Paulssen J, Paulssen RH. Transcriptomic landscape of treatment-naïve ulcerative colitis. J Crohns Colitis. 2018;12(3):327–336. doi:10.1093/ecco-jcc/jjx139
11. Davies NM, Holmes MV, Davey Smith G. Reading Mendelian randomisation studies: a guide, glossary, and checklist for clinicians. Br Med J. 2018;k601. doi:10.1136/bmj.k601
12. Freuer D, Linseisen J, Meisinger C. Association between inflammatory bowel disease and both psoriasis and psoriatic arthritis. JAMA Dermatol. 2022;158(11):1262. doi:10.1001/jamadermatol.2022.3682
13. Wan X, Zhang C, Lei P, et al. Precision therapeutics for inflammatory bowel disease: advancing ROS-responsive nanoparticles for targeted and multifunctional drug delivery. J Mat Chem B. 2025;13(10):3245–3269. doi:10.1039/d4tb02868f
14. Lei P, Yu H, Ma J, et al. Cell membrane nanomaterials composed of phospholipids and glycoproteins for drug delivery in inflammatory bowel disease: a review. Int J Biol Macromol. 2023;249:126000. doi:10.1016/j.ijbiomac.2023.126000
15. Skrivankova VW, Richmond RC, Woolf BAR, et al. Strengthening the reporting of observational studies in epidemiology using mendelian randomization: the strobe-mr statement. JAMA. 2021;326(16):1614–1621. doi:10.1001/jama.2021.18236
16. Ju M, Bi J, Wei Q, et al. Pan-cancer analysis of NLRP3 inflammasome with potential implications in prognosis and immunotherapy in human cancer. Brief Bioinform. 2021;22(4). doi:10.1093/bib/bbaa345
17. Ritchie ME, Phipson B, Wu D, et al. limma powers differential expression analyses for RNA-sequencing and microarray studies. Nucleic Acids Res. 2015;43(7):e47–e. doi:10.1093/nar/gkv007
18. Gustavsson EK, Zhang D, Reynolds RH, Garcia-Ruiz S, Ryten M. ggtranscript: an R package for the visualization and interpretation of transcript isoforms using ggplot2. Bioinformatics. 2022;38(15):3844–3846. doi:10.1093/bioinformatics/btac409
19. Gu Z, Eils R, Schlesner M. Complex heatmaps reveal patterns and correlations in multidimensional genomic data. Bioinformatics. 2016;32(18):2847–2849. doi:10.1093/bioinformatics/btw313
20. Hänzelmann S, Castelo R, Guinney J. GSVA: gene set variation analysis for microarray and RNA-seq data. BMC Bioinf. 2013;14. doi:10.1186/1471-2105-14-7.
21. Langfelder P, Horvath S. WGCNA: an R package for weighted correlation network analysis. BMC Bioinf. 2008;9(1). doi:10.1186/1471-2105-9-559
22. Wu T, Hu E, Xu S, et al. clusterProfiler 4.0: a universal enrichment tool for interpreting omics data. Innovation. 2021;2(3):100141. doi:10.1016/j.xinn.2021.100141
23. Shannon P, Markiel A, Ozier O, et al. Cytoscape: a software environment for integrated models of biomolecular interaction networks. Genome Res. 2003;13(11):2498–2504. doi:10.1101/gr.1239303
24. Hemani G, Zheng J, Elsworth B, et al. The MR-Base platform supports systematic causal inference across the human phenome. eLife. 2018;7. doi:10.7554/eLife.34408
25. Bowden J, Davey Smith G, Burgess S. Mendelian randomization with invalid instruments: effect estimation and bias detection through Egger regression. Int J Epidemiol. 2015;44(2):512–525. doi:10.1093/ije/dyv080
26. Bowden J, Davey Smith G, Haycock PC, Burgess S. Consistent estimation in mendelian randomization with some invalid instruments using a weighted median estimator. Genet Epidemiol. 2016;40(4):304–314. doi:10.1002/gepi.21965
27. Burgess S, Scott RA, Timpson NJ, Davey Smith G, Thompson SG. Using published data in Mendelian randomization: a blueprint for efficient identification of causal risk factors. Eur J Epidemiol. 2015;30(7):543–552. doi:10.1007/s10654-015-0011-z
28. Hartwig FP, Davey Smith G, Bowden J. Robust inference in summary data Mendelian randomization via the zero modal pleiotropy assumption. Int J Epidemiol. 2017;46(6):1985–1998. doi:10.1093/ije/dyx102
29. Qin Q, Zhao L, Ren A, et al. Systemic lupus erythematosus is causally associated with hypothyroidism, but not hyperthyroidism: a Mendelian randomization study. Front Immunol. 2023;14. doi:10.3389/fimmu.2023.1125415
30. Davey Smith G, Hemani G. Mendelian randomization: genetic anchors for causal inference in epidemiological studies. Hum Mol Genet. 2014;23:R89–R98. doi:10.1093/hmg/ddu328
31. Xiao G, He Q, Liu L, et al. Causality of genetically determined metabolites on anxiety disorders: a two-sample Mendelian randomization study. J Transl Med. 2022;20(1). doi:10.1186/s12967-022-03691-2
32. Rasooly D, Peloso GM, Giambartolomei C. Bayesian genetic colocalization test of two traits using coloc. Current Protocols. 2022;2(12):e627. doi:10.1002/cpz1.627
33. Robin X, Turck N, Hainard A, et al. pROC: an open-source package for R and S+ to analyze and compare ROC curves. BMC Bioinf. 2011;12(1). doi:10.1186/1471-2105-12-77
34. Yu G. Gene ontology semantic similarity analysis using gosemsim. stem cell transcriptional networks. Methods Mol Biol. 2020;207–215.
35. Robles-Jimenez LE, Aranda-Aguirre E, Castelan-Ortega OA, et al. Worldwide traceability of antibiotic residues from livestock in wastewater and soil: a systematic review. Animals. 2021;12(1):60. doi:10.3390/ani12010060
36. Han J, Li W, Shi G, et al. Atractylenolide III improves mitochondrial function and protects against ulcerative colitis by activating AMPK/SIRT1/PGC-1α. Mediat in Flamm. 2022;2022:1–17. doi:10.1155/2022/9129984
37. Wang M, Pan W, Xu Y, Zhang J, Wan J, Jiang H. Microglia-mediated neuroinflammation: a potential target for the treatment of cardiovascular diseases. J Inflamm Res. 2022;Volume 15:3083–3094. doi:10.2147/jir.S350109
38. Wu M-Y, Liu L, Wang E-J, et al. PI3KC3 complex subunit NRBF2 is required for apoptotic cell clearance to restrict intestinal inflammation. Autophagy. 2020;17(5):1096–1111. doi:10.1080/15548627.2020.1741332
39. Massironi S, Viganò C, Palermo A, et al. Inflammation and malnutrition in inflammatory bowel disease. Lancet Microbe. 2023;8(6):579–590. doi:10.1016/s2468-1253(23)00011-0
40. Liu C, Jiang Y, Liu G, et al. PPARGC1A affects inflammatory responses in photodynamic therapy (PDT)-treated inflammatory bowel disease (IBD). Biochem Pharmacol. 2022;202:115119. doi:10.1016/j.bcp.2022.115119
41. Dong Y, Huang Y, Fan C, et al. GIPC2 is an endocrine-specific tumor suppressor gene for both sporadic and hereditary tumors of RET- and SDHB-, but not VHL-associated clusters of pheochromocytoma/paraganglioma. Cell Death Dis. 2021;12(5). doi:10.1038/s41419-021-03731-7
42. Yao Y, Shen X, Zhou M, Tang B. Periodontal pathogens promote oral squamous cell carcinoma by regulating ATR and NLRP3 inflammasome. Front Oncol. 2021;11. doi:10.3389/fonc.2021.722797.
43. Zheng M, Kanneganti TD. The regulation of the ZBP1‐NLRP3 inflammasome and its implications in pyroptosis, apoptosis, and necroptosis (PANoptosis). Immunol Rev. 2020;297(1):26–38. doi:10.1111/imr.12909
44. Duan Y, Zhang L, Angosto-Bazarra D, Pelegrín P, Núñez G, He Y. RACK1 Mediates NLRP3 Inflammasome Activation by Promoting NLRP3 Active Conformation and Inflammasome Assembly. Cell Rep. 2020;33(7):108405. doi:10.1016/j.celrep.2020.108405
45. H-y W, Lin X, G-g H, et al. Atranorin inhibits NLRP3 inflammasome activation by targeting ASC and protects NLRP3 inflammasome-driven diseases. Acta Pharmacol Sin. 2023;44(8):1687–1700. doi:10.1038/s41401-023-01054-1
46. Liu Y, Dong Y, Zhu X, et al. MiR-155 inhibition ameliorates 2, 4, 6-Trinitrobenzenesulfonic acid (TNBS)-induced experimental colitis in rat via influencing the differentiation of Th17 cells by Jarid2. Int Immunopharmacol. 2018;64:401–410. doi:10.1016/j.intimp.2018.09.007
47. Zhang Y, Li J, Han X, et al. Qingchang Wenzhong Decoction ameliorates intestinal inflammation and intestinal barrier dysfunction in ulcerative colitis via the GC-C signaling pathway. J Ethnopharmacol. 2024;322:117503. doi:10.1016/j.jep.2023.117503
48. Shi X, Li T, Liu Y, et al. HSF1 protects sepsis-induced acute lung injury by inhibiting nlrp3 inflammasome activation. Front Immunol. 2022;13. doi:10.3389/fimmu.2022.781003
49. Tripathi RKP. A perspective review on fatty acid amide hydrolase (FAAH) inhibitors as potential therapeutic agents. Eur J Med Chem. 2020;188:111953. doi:10.1016/j.ejmech.2019.111953
50. Zhang Y, Tao M, Chen C, et al. BAFF Blockade Attenuates DSS-Induced Chronic Colitis via Inhibiting NLRP3 Inflammasome and NF-κB Activation. Front Immunol. 2022;13. doi:10.3389/fimmu.2022.783254
51. Kang Y, Zhang H, Zhao Y, et al. Telomere dysfunction disturbs macrophage mitochondrial metabolism and the NLRP3 Inflammasome through the PGC-1α/TNFAIP3 Axis. Cell Rep. 2018;22(13):3493–3506. doi:10.1016/j.celrep.2018.02.071
 © 2026 The Author(s). This work is published and licensed by Dove Medical Press Limited. The
full terms of this license are available at https://www.dovepress.com/terms
and incorporate the Creative Commons Attribution
- Non Commercial (unported, 4.0) License.
By accessing the work you hereby accept the Terms. Non-commercial uses of the work are permitted
without any further permission from Dove Medical Press Limited, provided the work is properly
attributed. For permission for commercial use of this work, please see paragraphs 4.2 and 5 of our Terms.
© 2026 The Author(s). This work is published and licensed by Dove Medical Press Limited. The
full terms of this license are available at https://www.dovepress.com/terms
and incorporate the Creative Commons Attribution
- Non Commercial (unported, 4.0) License.
By accessing the work you hereby accept the Terms. Non-commercial uses of the work are permitted
without any further permission from Dove Medical Press Limited, provided the work is properly
attributed. For permission for commercial use of this work, please see paragraphs 4.2 and 5 of our Terms.
Recommended articles
NLRP3 Mediates NOXs-Induced Iron Overload and Inflammation but Not Oxidative Damage in Colons of DSS-Treated Mice
Yu L, Wang M, Zhou Y, Qi J, Zheng Q, Song Z
Journal of Inflammation Research 2025, 18:4695-4708
Published Date: 4 April 2025
Bioinformatics and Experimental Validation of FLVCR1 and SOX4 in Regulating Mitochondria-Macrophage Crosstalk in Disc Degeneration
Zhou J, Zheng Y, Zheng X, Chen CY, Ding SC, Wang R
Journal of Inflammation Research 2025, 18:15101-15116
Published Date: 30 October 2025