Back to Journals » Diabetes, Metabolic Syndrome and Obesity » Volume 17
Methyl Cinnamate (MC) Alleviates Free Fatty Acids (FFAs) Induced Lipid Accumulation Through the AMPK Pathway in HepG2 Cells
Authors Fu Y, Li G ![]() , Feng Z, Liu J, Wang X
, Feng Z, Liu J, Wang X ![]() , Wang T, Liu J
, Wang T, Liu J
Received 21 November 2023
Accepted for publication 1 March 2024
Published 7 March 2024 Volume 2024:17 Pages 1183—1197
DOI https://doi.org/10.2147/DMSO.S449300
Checked for plagiarism Yes
Review by Single anonymous peer review
Peer reviewer comments 3
Editor who approved publication: Dr Konstantinos Tziomalos
Yingda Fu,1 Guangbing Li,1,2 Zichen Feng,1 Jun Liu,2 Xiaoyu Wang,1 Tao Wang,2 Jun Liu1,2
1Department of Hepatobiliary Surgery and Center of Organ Transplantation, Shandong Provincial Hospital, Cheeloo College of Medicine, Shandong University, Jinan, Shandong, People’s Republic of China; 2Department of Hepatobiliary Surgery and Center of Organ Transplantation, Shandong Provincial Hospital Affiliated to Shandong First Medical University, Jinan, Shandong, People’s Republic of China
Correspondence: Jun Liu, Department of Hepatobiliary Surgery and Center of Organ Transplantation, Shandong Provincial Hospital Affiliated to Shandong University, Jinan, Shandong, People’s Republic of China, Email [email protected]
Background: AMP-activated protein kinase (AMPK) plays a critical role in energy metabolism. Its activation leads to the phosphorylation of downstream proteins such as acetyl-CoA carboxylase (ACC) and sterol regulatory element-binding protein-1 (SREBP1), subsequently inhibiting de novo fatty acid synthesis, thereby reducing intracellular triglyceride accumulation. MC is a compound found in extracts from Zanthoxylum armatum DC plants. Research has shown that MC can inhibit the differentiation of 3T3-L1 adipocytes through the CAMKK2-AMPK pathway. However, the biological effect of MC in HepG2 cells remains unknown.
Methods: In this study, we utilized HepG2 cells to establish a model of MAFLD through FFAs stimulation. We investigated the biological effects of MC on HepG2 cells and studied its impact on lipid metabolism. Small interfering RNA was employed to explore the mechanism by which MC activates AMPK. Finally, molecular docking was conducted, establishing a model of the interaction between AMPK and MC.
Results: We observed that MC can alleviate triglyceride accumulation in HepG2 cells. We observed the elevated p-AMPK/AMPK, P-ACC/ ACC, and elevated CPT1a after treatment of MC in HepG2 cells. The interference of CAMKK2 mRNA did not impact the ability of MC to phosphorylate AMPK. Compound C attenuates the ability of MC to increase p-AMPK. Molecular docking results led us to hypothesize that MC directly interacts with AMPK, resulting in AMPK phosphorylation and improved lipid accumulation in HepG2 cells.
Keywords: AMPK, CAMKK2, FFAs, HepG2, methyl cinnamate, MAFLD
Introduction
MAFLD is a progressive disease, encompassing a continuum of pathological stages including fatty liver, metabolic-associated steatohepatitis, fibrosis, and cirrhosis, which is the risk factor of HCC. The nomenclature of this disease was changed from NAFLD to MAFLD in 2020 for better diagnosis and severity evaluation.1 In recent years, the incidence of MAFLD has been on the rise and is projected to reach 1.5 billion cases by 2030.2,3 MAFLD is a multisystem disease and is associated with a higher risk of cardiovascular disease (CVD)4,5 and chronic kidney disease (CKD).6,7 Moreover, when there is an excess of fatty acids, the following oxidative stress and ER stress would initiate hepatocellular injury and further stimulate Kupffer cells, prompting the release of various inflammatory cytokines.8,9 These inflammatory factors activate hepatic stellate cells, prompting their transformation into myofibroblast-like cells.10 These cells secrete collagen, contributing to the development of fibrosis and cirrhosis. In advanced stages, including cirrhosis and HCC, liver transplantation would be necessary,11 which strains the limited supply of available liver donors and poses a significant threat to patient survival and quality of life. Therefore, it is crucial to inhibit the progression of MAFLD and block the transition from fatty liver to liver fibrosis.
AMPK is a trimeric protein comprising α, β, and γ subunits. The α subunit, when phosphorylated, becomes catalytically active and phosphorylates downstream targets, while the β and γ subunits are regulatory units that bind AMP/ADP/ATP, influencing conformation and impacting α subunit phosphorylation by upstream kinases.12–15 AMPK activation is usually associated with phosphorylation at T183 in AMPKα1 and T172 in AMPKα2.16 An increased AMP/ATP ratio helps AMPK maintain its phosphorylated state, this activation of AMPK triggers a metabolic shift from anabolic processes to catabolic processes. AMPK signaling pathway plays a crucial role in metabolism. ACC is involved in de novo fatty acid synthesis, and CPT1a is involved in fatty acid β-oxidation. Activated AMPK can phosphorylate ACC17 to abolish its ability to produce malonyl-CoA,18 which is an initial substrate for de novo fatty acid biosynthesis. Concurrently, malonyl CoA serves as a potent inhibitor of CPT1a, a rate-limiting enzyme for fatty acid oxidation.19 In summary, AMPK plays a crucial role in MAFLD due to its ability to regulate energy metabolism.
Numerous studies strongly suggest that an excess of lipids is the primary factor contributing to the development of hepatic steatosis,11,20,21 therefore, cellular protection against lipid accumulation represents a vital strategy in both preventing and treating MAFLD. There are several medications available for the treatment of MAFLD. Pioglitazone and metformin can alleviate MAFLD by regulating glucose metabolism and lipid metabolism.22 Antioxidant agents like vitamin E can mitigate the progression of MAFLD from simple fatty liver to steatohepatitis.23 Cell-protective drugs like ursodeoxycholic acid can regulate lipid metabolism and the immune system to impede the progression of MAFLD and reduce cellular damage.24 Orlistat, as a weight loss medication, can reduce the absorption of triglycerides in the intestines, thereby alleviating fatty liver.25 Cell experiments have shown that compounds like berberine and resveratrol alleviate intracellular triglyceride accumulation by activating the AMPK pathway.26,27 In summary, these drugs either directly or indirectly influence lipid metabolism-related proteins, which ultimately affect lipid deposition in liver cells.
MC is a biologically active compound extracted from Zanthoxylum armatum DC.28 MC is a volatile compound widely used in food, cosmetics, and household products, and it has been approved by the FDA as a flavoring agent.28 MC is widely studied in many fields. Lilin et al found out that MC can improve dextran sulfate sodium-induced colitis in mice by inhibiting MAPK signaling pathway.29 Previous research has shown that the lipid-soluble extract from Zanthoxylum armatum DC can alleviate high-fat diet-induced fatty liver in mice.30 In a study using 3T3-L1 cells, it was found that treatment with MC upregulated the expression of CAMKK2 and p-AMPK during their differentiation process,31 inhibiting triglyceride deposition and reducing markers of mature adipocytes post-differentiation. In rat spinal cord cells, MC inhibits the formation of the mTOR complex by increasing AMPK phosphorylation, thereby reducing CCI-induced upregulation of pain receptors.32 In our research, we aim to investigate the biological effect of MC in HepG2 cells and prove MC can activate AMPK independent of CAMKK2 in HepG2 cells.
Methods
Reagents
PaImitic acid was obtained from MCE (NJ, USA). OIeic acid was obtained from Selleck (Shanghai, China). Antibodies against phosphorylated LKB1 at Ser428 (p-LKB1 Ser428) (138,386) were purchased from Abcam (UK). Antibodies against phosphorylated ACC at S79 (68,191) and ACC (109,368, 45,174) were purchased from Abcam (UK). Antibodies against phosphorylated AMPKα (p-AMPKα) (ab133448) and AMPKα (32,047) were purchased from Abcam (UK) and Wanleibio (Shenyang, China). Antibodies against CPT1A (220,789, 234,111), SREBP1c (28,481), SOD2, ADFP (108,323) and HMGCR (174,830) were purchased from Abcam (UK). Antibodies against β-actin were obtained from Proteintech (Wuhan, China). Antibodies against LKB1 (#3050) (A2122) and PPARγ were purchased from CST (Danvers, USA). Antibodies against CAMKK2 were purchased from Proteintech (Wuhan, China). MC were purchased from MCE (NJ, USA). Compound C was purchased from Proteintech (Wuhan, China). The experimental reagent methyl cinnamate was dissolved in DMSO (Solarbio, Beijing, China) to prepare a 500mM stock solution.
Cell Culture
The HepG2 cell line was obtained from Procell Life Science & Technology (China). Cells were cultured in Dulbecco’s modified Eagle’s medium (DMEM, Gibco, China) at 37°C with 5% CO2, the culture medium was supplemented with 10% fetal bovine serum (FBS; Gibco, Brazil). For cell passage, trypsin enzymatic digestion was employed, using trypsin enzyme provided by Gibco (USA). The PBS was purchased to wash the cultured cell line during cell passage.
CCK-8
Cell viability was assessed using the CCK-8 assay. HepG2 cells were seeded in a 96-well plate with 5000 cells per well. In addition to the control group, each well was treated with varying concentrations of MC and exposed to these concentrations for different durations: 24 hours, 48 hours, and 72 hours. After incubation, each well was washed with PBS, then added 110μL of prepared CCK8 solution to each well, then measured the absorbance at a wavelength of 450nm using a microplate reader within 1–4 hours. Cell viability was assessed using the CCK-8 assay.
Construction of a HepG2 Cell Fatty Liver Model
A mixture of free fatty acids (FFAs) was created using palmitic acid (PA), oleic acid (OA) and 15% bovine serum albumin (BSA), the ratio of palmitic acid to oleic acid is 1:2, 0.01% NaOH was used for dissolving. HepG2 cells were treated with FFAs mixture for 24h. The experimental groups were pretreated MC for 6h and treated with 0.25mM FFAs for the next 24h. No FBS was added to the culture medium in the experimental group.
Oil Red O Staining
To evaluate lipid accumulation in cultured HepG2 cells, an Oil Red O staining kit (Solarbio, Beijing, China) was employed. Initially, the cells were rinsed three times with PBS (Biosharp, China). Subsequently, the cells were fixed with a cell-fixative reagent for approximately 15 minutes. After fixation, 60% isopropanol was used to wash the cells for 5 minutes. Then the cells underwent Oil Red O staining for 20 minutes, which allowed for the visualization of lipid droplets. Finally, the cell nuclei were counterstained with hematoxylin for approximately 1 minute to provide contrast for further analysis.
Nile Red Staining
NiIe red staining was empIoyed to assess intracellular lipid content in HepG2 cells. Firstly, cells were washed 3 times with PBS and fixed with 4% Paraformaldehyde. Subsequently, they were exposed to a Nile red fluorescent stain solution (Solarbio, Beijing, China) for 15 minutes at 37°C. Following Nile red staining, cells were washed 3 times with PBS. The cells were then incubated with DAPl (Solarbio, Beijing, China) at room temperature for 10 minutes. Subsequently, they were washed with PBS to prepare for visualization and analysis. An inverted confocal fluorescence microscope was utilized to observe the fluorescence. The Nile red stain was excited at a wavelength of 530nm.
Protein Extraction
RIPA lysis buffer (Solarbio, Beijing, China) was obtained to extract the total protein in the cultured cells. The working reagent consisted of a mixture of RIPA, protease inhibitor, and phosphatase inhibitor in a ratio of 100:1:1. Cells were washed 3 times with PBS and then added RIPA mixture, placed on ice for 10min. Then collected the cell lysates and centrifuged at 12,000rpm for 10min. Then the middIe-IeveI clarified liquids was absorbed. A bicinchoninic acid kit (BCA, Beyotime, Shanghai, China) was utilized to measure the protein concentration. 5×loading buffer (Beyotime, Shanghai, China) was added in the middle-level protein lysates. And then the lysates was boiled at 95°C for 10min and stored in the −80 °C fridge.
Triglyceride Measurement
Intracellular triglyceride levels were measured using triglyceride measurement kit (Applygen, Beijing, China). Cells were washed 3 times in PBS, followed by addition of 100μL lysis buffer, vibrate for 10min and collect the lysates. After centrifugation at 12000rpm for 3min, take 2μL of the supernatant for BCA measurement. Heat the rest of the lysates at 70°C for 10min. After centrifugation at 5000rpm for 5min, the upper clarified liquid was used for absorbance measurement.
Western Blotting
A 10% gel was used for electrophoresis with 120V constant voltage. After the electrophoresis, the protein in the gels was transferred to a nitrocellulose (NC) membrane with 220mA constant current for 1h. Then the membranes were blocked with a rapid sealing solution (Seven, Beijing, China), then the membranes were incubated with primary antibodies for 12h at 4°C. The membranes were washed 3 times with 10×TBST (Seven, Beijing, China) and then incubated with secondary antibody (Proteintech, Wuhan, China) diluted to 1/5000 at room temperature for 1.5h. For membrane regeneration, 15mL of stripping buffer (CWBIO, Jiangsu, China) is added and incubated for 30 to 60 minutes, depending on the specific protein levels. After the stripping process, the membranes undergo blocking and application of the primary antibody once again.
RNA Extraction
RNA was extracted using the RNA extraction kit (Vazyme, Nanjing, China). Cells were washed with PBS three times. Buffer RL was added for 1 minute, and the lysates were transferred to gDNA-Filter Columns III and centrifuged at 12,000 rpm for 30 seconds. Half the lysate volume of ethanol was added, followed by centrifugation at 12,000 rpm for 1 minute. The samples were then transferred to RNA column III and centrifuged at 12,000 rpm for 30 seconds. Subsequently, 700 μL RW1 was added and centrifuged at 12,000 rpm for 30 seconds. This was followed by adding 700 μL RW2 and centrifuging at 12,000 rpm for 30 seconds. Another 500 μL RW2 was added and centrifuged at 12,000 rpm for 30 seconds. Finally, enzyme-free water was added to dissolve the RNA. The concentration was measured using a Nanodrop.
PCR
The extracted total RNA was reverse transcribed to cDNA using HiScript® III All-in-one RT SuperMix. The reverse transcription system contained 4 μL 5 × All-in-one qRT SuperMix and 1 μL enzyme mix. 1 μg RNA was added, and enzyme-free water was used to reach a 20 μL system volume. Reverse transcription was conducted at 50°C for 15 minutes. For the PCR experiment, 5 μL Sybergreen and 0.4 μL forward and reverse primers (Table 1) were added to an eight-tube strip. Then, cDNA and enzyme-free water were added to make a 10 μL PCR system. The mixture was centrifuged at 3,000 rpm for 3 minutes and then placed in the QuantStudio 3 system. The program was divided into 3 stages:
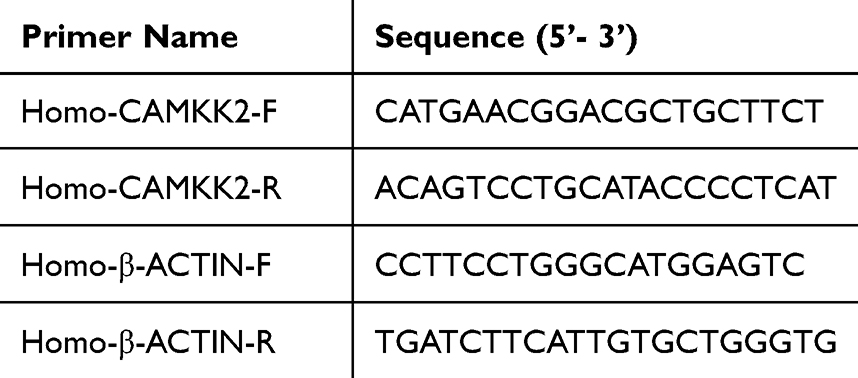 |
Table 1 Primer Sets for the RT-PCR |
Stage 1: 95°C for 5 seconds.
Stage 2: 95°C for 10 seconds and 60°C for 30 seconds, repeated 40 times.
Stage 3: 95°C for 15 seconds, 60°C for 30 seconds, 95°C for 15 seconds.
RNA Interference
The cells were seeded in a 6-well plate at a density of 20,000 cells per well and cultured in Dulbecco’s modified Eagle’s medium (DMEM, Gibco, China) at 37°C with 5% CO2. After 24 hours for cell adhesion, the cell culture media was aspirated, and the cells were washed twice with PBS. Subsequently, transfection was performed using siRNA (Table 2) interfering reagent (Tsingke, Beijing, China) and Lipo3000 transfection reagent premixed with MEM, allowing activation for 5 minutes. After mixing the reagents for 20 minutes, they were added to the cells in the 6-well plate. Following 12 hours, the media was replaced with fresh DMEM supplemented with FBS, and the cells were incubated for protein and RNA extraction. The entire transfection process was conducted under low light conditions to maintain reagent stability.
 |
Table 2 The Sequence of Small Interfere RNA |
Molecular Docking
To analyze the binding affinities and modes of interaction between the drug candidate and their targets, AutodockVina 1.2.2, a protein–ligand docking software was utilized. The molecular structure of MC was obtained from PubChem33 Compound (https://pubchem.ncbi.nlm.nih.gov/docs/citation-guidelines#section=Reusing-The-2D-or-3D-structure-image-of-A-compound-or-substance-record). The 3D coordinates of AMPKα1 (PDB ID, 5UFU;34 resolution, 3.45 Å, https://doi.org/10.2210/pdb5UFU/pdb) and AMPKα2 (PDB ID, 4CFF;35 resolution, 3.92 Å, https://doi.org/10.2210/pdb4CFF/pdb) were downloaded from the PDB (https://www.rcsb.org/pages/policies). For docking analysis, the protein and molecular files were converted into PDBQT format, and the water molecules were excluded, polar hydrogen atoms were added. The grid box was centered to cover the domain of each protein and accommodate free molecular movement. The grid box was set to 30 Å × 30 Å × 30 Å, and the grid point distance was 0.05 nm. Molecular docking studies were performed using Autodock Vina 1.2.2 (http://autodock.scripps.edu/).
Statistical Analysis
Statistical analyses were performed using GraphPad 9.5.1. All assays were performed on at least 3 separate experiments. Data are expressed as means ± s.e.m. Fiji was used to quantify oil red O staining and Western blot results. One-way analysis of variance (ANOVA) was utilized to determine the statistical significance. A P-value <0.05 was considered statistically significant.
Results
Cell Viability and AMPK Activation After Treatment in Different Concentrations of MC
The molecular formula of methyl cinnamate (Figure 1). We treated HepG2 cells with different concentrations of MC (12.5, 25, 50, 100, 200, 400, and 800μM) for 24, 48, 72 hours to investigate the cell viability after these treatment conditions. There was no significant difference in cell viability following treatment with the above concentrations after 24 and 48 hours (Figure 2A and B). The cell viability was >90% relative to the NC group (Figure 2A and B). However, in 72 hours treatment group, cell viability exhibited a significant decrease after treatment with MC at concentrations of 400μM and 800μM, the cell viability was <75% relative to the NC group (Figure 2C). To investigate the biological effect of MC in HepG2 cells, we treated MC in different concentrations and at different times for Western blot. The results indicate that the effect of MC on AMPK is dose-dependent and time-dependent (Figure 2D and E).
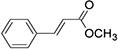 |
Figure 1 The molecular formula of methyl cinnamate. |
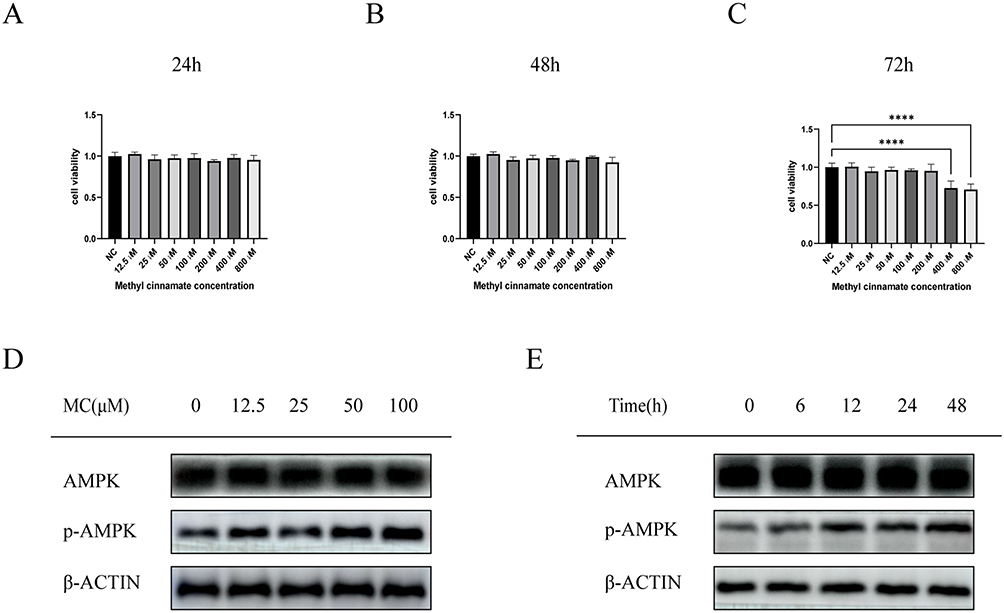 |
Figure 2 Cell viability and AMPK activation after treatment of MC. CCK8 was used to assess cell viability after MC treatment at different concentrations for 24 hours (A), 48 hours (B), and 72 hours (C). Significant decrease in cell viability occurred after 72 hours of treatment with 400μM and 800μM MC (C). The highest activation of AMPK was observed at 100μM (D), and in a 12-hour treatment, AMPK showed the highest activation (E). Graphs represent mean ± s.e.m. (n = 3 independent experiments), and P values were calculated by one-way ANOVA with Bonferroni correction. ****P < 0.0001. Abbreviation: MC, methyl cinnamate. |
MC Alleviates FFAs Induced Triglyceride Deposition
To study the impact of MC on lipid accumulation in HepG2 cells, we established a HepG2 lipid accumulation model using 0.25mM FFAs with oleic acid to palmitic acid ratio of 2:1.36 Oil Red O staining revealed a significant increase in adipose vacuoles in the FFAs group. No significant difference was observed between the FFAs group and the FFAs+DMSO group (Figure 3A). There was a significant decrease in lipid deposition in the presence of MC (Figure 3A). The relative lipid vacuole area in the FFAs+MC group was decreased by 45% compared to the FFAs group (Figure 3B), indicating MC has the potential to mitigate triglyceride accumulation induced by FFAs in HepG2 cells. We further validated the impact of MC on HepG2 cells using Nile Red staining (Figure 3C), which revealed a significant change in fluorescence intensity at a wavelength of 530nm between the FFAs group and the FFAs+MC group at a wavelength of 530nm. The relative fluorescence intensity of FFAs+MC group was decreased by >40% compared to the FFAs group (Figure 3D). The content of intracellular triglyceride (TG) was significantly decreased by MC (Figure 3D).
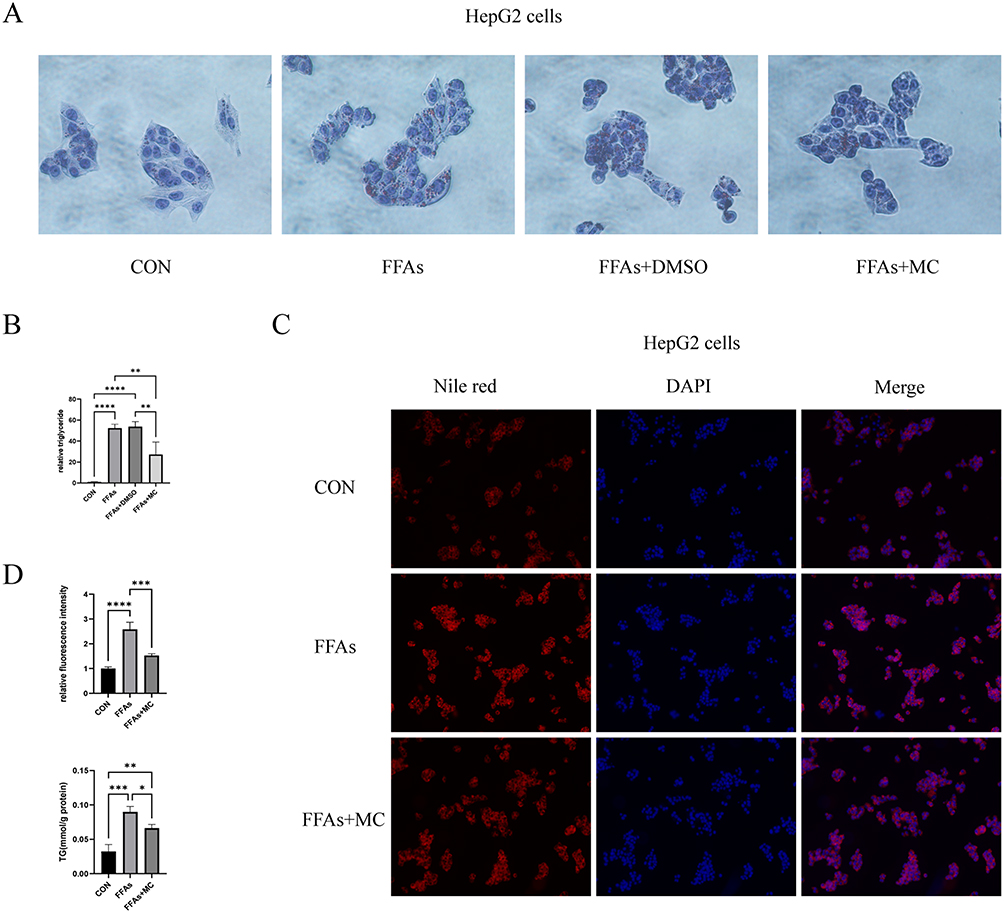 |
Figure 3 MC ameliorates FFAs induced triglyceride deposition. (A) Oil red O staining (40× magnification) exhibited lipid deposition in HepG2 cells. The left one was control group. The second one was treated with 0.25mM FFAs, the third one was treated with 0.25mM FFAs+DMSO, the right one was treated with 0.25mM FFAs+100μM MC. HepG2 cells were incubated with FFAs or MC for 24h. (B) Nile red staining (20× magnification) exhibited lipid deposition in HepG2 cells. (C) No significant differences were observed in the cells exposed to FFAs or DMSO + FFAs. MC significantly decreased the adipose vacuole. (D) MC significantly decreased fluorescence intensity. Graphs represent mean ± s.e.m. (n = 3 independent experiments), and P values were calculated by one-way ANOVA with Bonferroni correction. *P < 0.05, **P < 0.01, ***P < 0.001. ****P < 0.0001. Abbreviations: MC, methyl cinnamate; FFAs, free fatty acids. |
MC Alleviates FFAs Induced Triglyceride Deposition by Activating AMPK Pathway in HepG2 Cells
The phosphorylation of AMPKα1 at T183 and AMPKα2 at T172 accounts for the kinase activity of AMPK, enabling it to phosphorylate downstream proteins.37 In our study, the Western blot shows increased p-AMPK/AMPK and P-ACC/ACC (Figure 4A and B), indicating the phosphorylation of AMPK and ACC after treatment of MC. The expression of CPT1a was also increased (Figure 4A and B), which indicates enhanced processes of fatty acid oxidation. ACC possesses the capability to catalyze the conversion of acetyl-CoA into malonyl-CoA, which functions as an allosteric inhibitor of CPT1a. p-ACC is the inactivation form of ACC, a decrease in the ratio of p-ACC/ACC represents heightened activity of CPT1a.38,39 CPT1a facilitates the transport of long-chain fatty acids from the cytoplasm into the mitochondria, where they can be oxidized to generate ATP. After treatment of FFAs, the expression of Peroxisome Proliferator-Activated Receptor Gamma (PPARγ), a transcription factor closely related to lipid metabolism and proliferation,40 is significantly increased (Figure 4A and B). The expression of premature-SREBP1c (pre-SREBP1c) is significantly decreased, however, no significant changes in cleved-SREBP1c (c-SREBP1c) were observed (Figure 4A and B). In our study, no significant changes in HMGCR, ADFP, SOD2 were observed (Figure 4A and B). In our research, the elevated protein level of CPT1a and the increased p-ACC/ACC ratio can provide an explanation for MC’s anti-lipid function in HepG2 cells. To further explore whether MC’s anti-lipid effect is mediated through the AMPK pathway, AMPK inhibitor Compound C was utilised.41 In the FFAs+MC+CC group, there was a significant increase in relative lipid accumulation (Figure 5A) and a decrease in p-AMPK (Figure 5B) compared to the FFAs+MC group. The results indicate that Compound C attenuates the ability of MC to affect lipid metabolism and AMPK phosphorylation (Figure 5C and D).
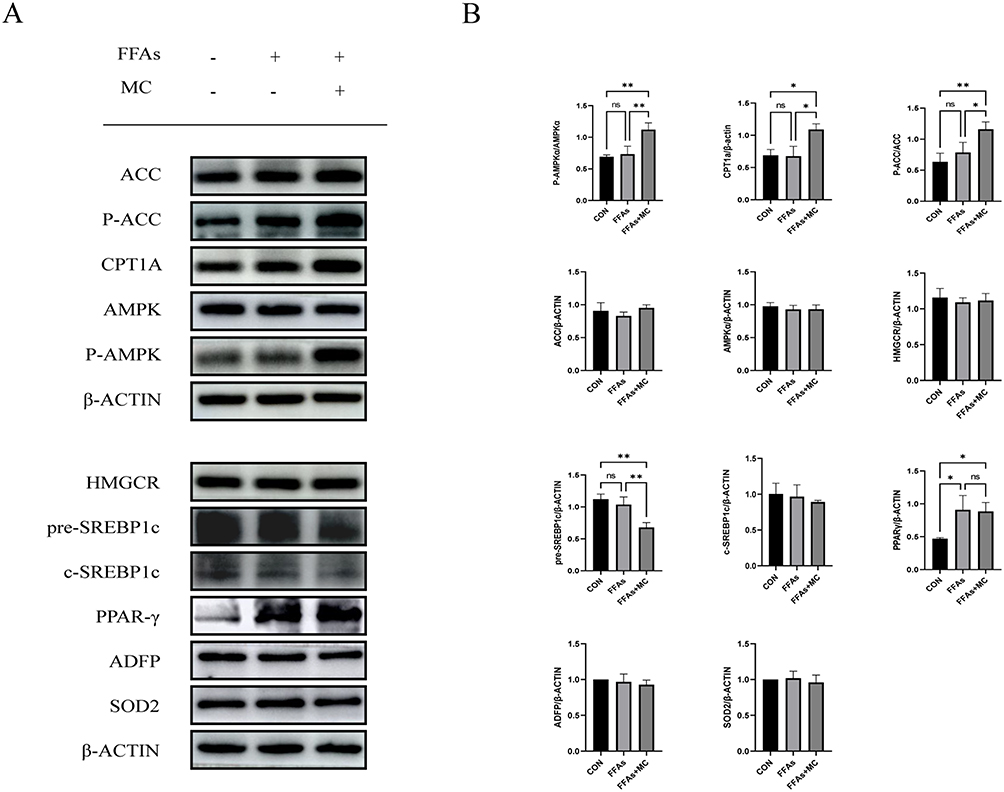 |
Figure 4 MC ameliorates FFAs induced triglyceride deposition by activating AMPK pathway in HepG2 cells. The left one was control group. The second one was treated with 0.25mM FFAs, the third one was treated with 0.25mM FFAs+100μM MC. (A) Western blot analysis of protein expression of p-ACC, ACC, HMGCR, pre-SREBP1c, c-SREBP1c, HMGCR, CPT1a, p-AMPK, AMPK, PPARγ, ADFP, SOD2 and β-ACTIN. (B)After treatment of MC, the relative protein levels of p-ACC, p-AMPKα, and CPT1a were significant increased, the relative protein level of pre-SREBP1c was significantly decreased. No significant changes were observed in AMPKα and ACC. No significant differences were observed in the expression of HMGCR, c-SREBP1c, ADFP and SOD2. The protein level of PPARγ is significantly increased after treatment of FFAs. The p-AMPK/AMPK and p-ACC/ACC ratio were significantly increased after 24h FFAs+MC treatment. And the content of intracellular TG is decreased. Graphs represent mean ± s.e.m. (n = 3 independent experiments), and P values were calculated by one-way ANOVA with Bonferroni correction. *P < 0.05, **P < 0.01. Abbreviations: MC, methyl cinnamate; FFAs, free fatty acids; TG, triglyceride. |
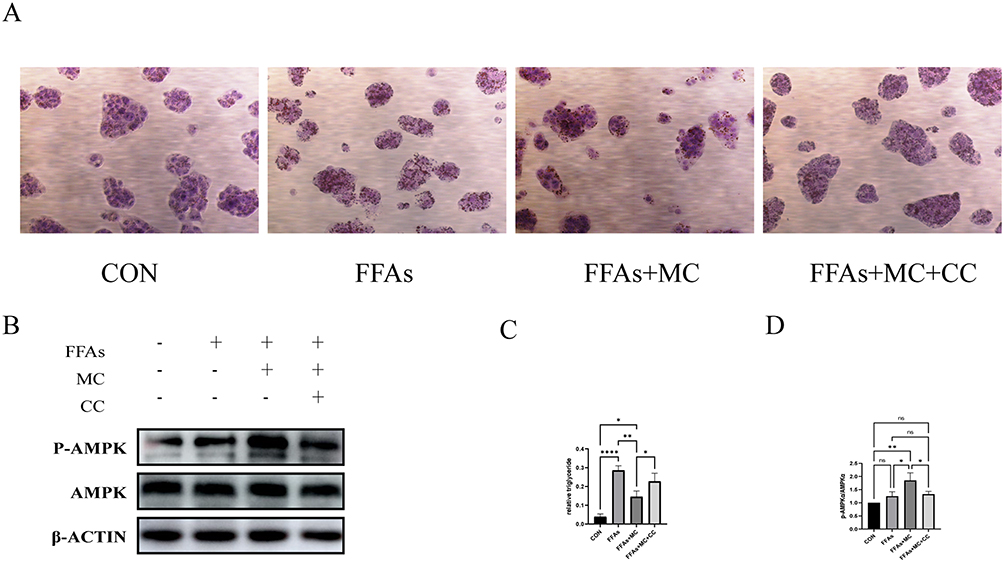 |
Figure 5 AMPK inhibitor Compound C attenuates the lipid metabolism effect of MC. The left one was control group. The second one was treated with 0.25mM FFAs, the third one was treated with 0.25mM FFAs+100μM MC, the fourth one was treated with 0.25mM FFAs+100μM MC+10μM CC. (A) Oil red O staining exhibited lipid deposition in HepG2 cells (40× magnification) in HepG2 cells. (B) Western blot analysis of protein expression of p-AMPK, AMPK and β-ACTIN. (C) Compound C significantly increased relative lipid accumulation compared to the FFAs+MC group. (D) Compound C significantly attenuated MC’s ability to increase p-AMPK. Graphs represent mean ± s.e.m. (n = 3 independent experiments), and P values were calculated by one-way ANOVA with Bonferroni correction. *P < 0.05, **P < 0.01, ****P < 0.0001. Abbreviations: MC, methyl cinnamate; FFAs, free fatty acids; CC, Compound C. |
The Treatment of MC Did Not Change the Expression of CAMKK2
CAMKK2 is an AMPKK that has the ability to phosphorylate AMPK independent of AMP. CAMKK2 gathers its phosphorylation ability when the intracellular Ca2+ is increased, and it depends on the combination of CAMKK2 with Ca2+/CAM. Previous studies show MC can increase CAMKK2 in 3T3-L1 cells.31 In our study, however, there was no statistically significant on CAMKK2 protein level (Figure 6A and B). Additionally, the PCR results showed no significant changes in mRNA level either (Figure 6B). Subsequently, we conducted the following experiments for further research. As far as we know, the other AMPKK is LKB1, however, its ability to phosphorylate AMPK is dependent on AMP42 and its phosphorylation.43,44 We tested the expression of p-LKB1 and LKB1 after treatment of MC (Figure 6C). Intriguingly, there was no significant change in p-LKB1/LKB1 ratio (Figure 6D). Therefore, next we will attempt to investigate whether the increase of p-AMPK/AMPK in HepG2 cells induced by MC is dependent on CAMKK2.
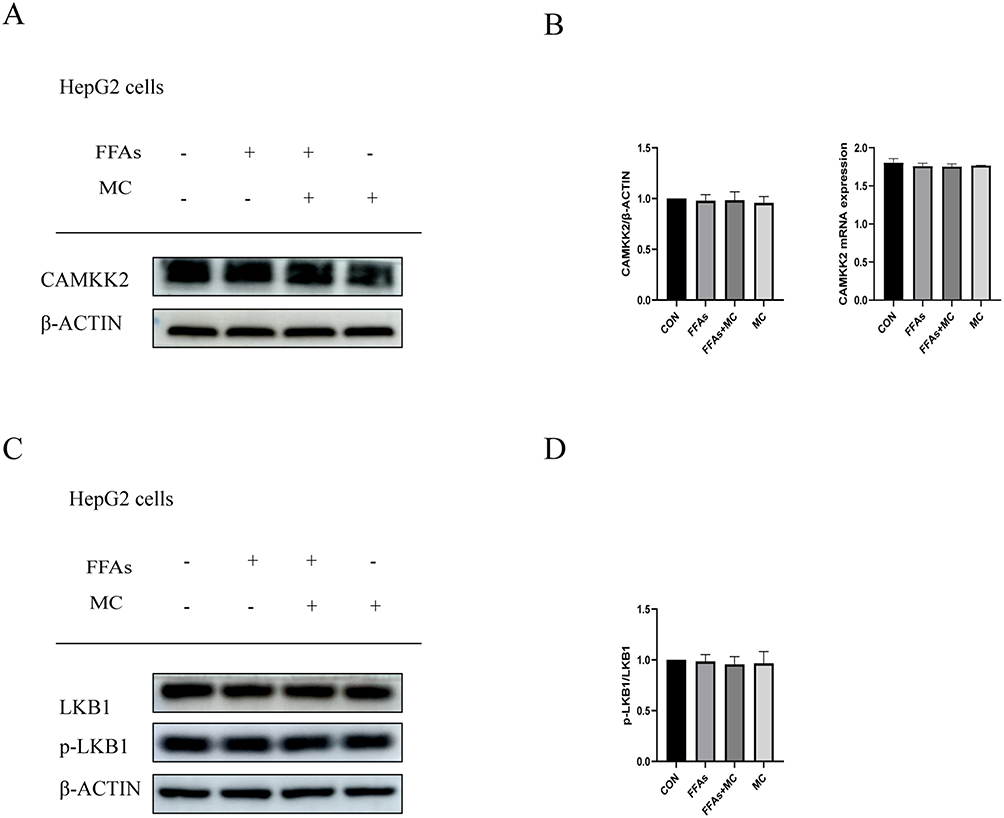 |
Figure 6 MC activates AMPK without altering the protein levels of upstream proteins CAMKK2 and LKB1. (A and B) After treatment of 100μM MC for 24h, no significant changes were observed in protein level and (B) mRNA level of CAMKK2. (C and D) No significant changes were observed in p-LKB1/LKB1 ratio. Graphs represent mean ± s.e.m. (n = 3 independent experiments), and P values were calculated by one-way ANOVA with Bonferroni correction. Abbreviations: MC, methyl cinnamate; FFAs, free fatty acids. |
CAMKK2 Has Marginal Effect on Methyl Cinnamate Induced AMPK Phosphorylation
To further investigate the mechanism through which MC activates AMPK, we conducted subsequent research using CAMKK2 small interference RNA to block the effect of CAMKK2 on AMPK, the expression of CAMKK2 was significantly decreased after treatment of small interference RNA (Figure 7A and B). After treatment of MC in CAMKK2 knock down group, the results indicated that the treatment of MC still demonstrated an increase in p-AMPK level (Figure 7C and D). In the end, we conducted molecular docking and noticed the stable predicted structures of MC binding to AMPKα1 and AMPKα2 (Figure 8A and B). They have binding energies of −6.613 kcal/mol and −5.814 kcal/mol, respectively, indicating a potential interaction between MC and AMPK.
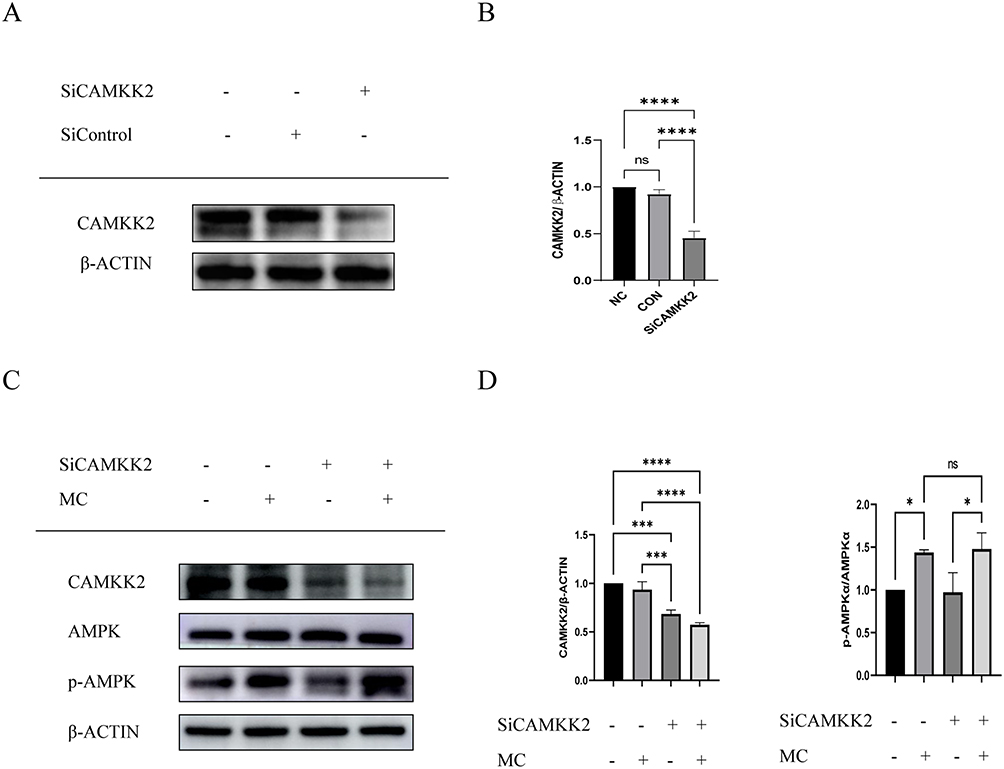 |
Figure 7 AMPK activation by MC is independent of CAMKK2 in HepG2 cells. (A and B) Small interfere RNA significantly decreased the expression of CAMKK2. (C and D) After treatment with MC, no significant changes in p-AMPKα/AMPKα were observed (C and D), regardless of CAMKK2 knockdown. Graphs represent mean ± s.e.m. (n = 3 independent experiments), and P values were calculated by one-way ANOVA with Bonferroni correction. *P < 0.05, ***P < 0.001. ****P < 0.0001. Abbreviation: MC, methyl cinnamate. |
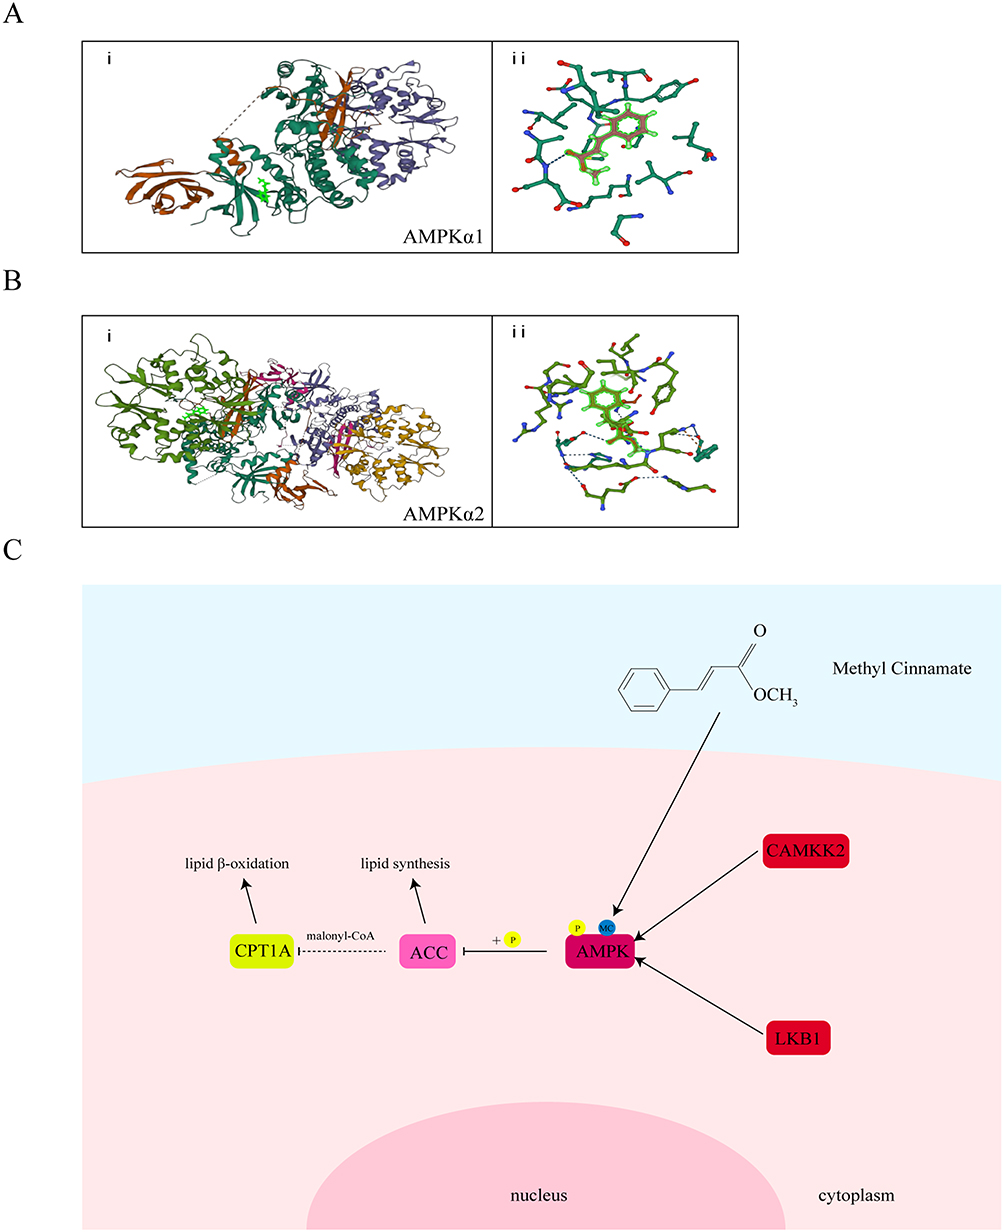 |
Figure 8 Molecular docking pattern of MC with AMPKα and schematic diagram. (Ai) The binding pattern of AMPKα1 to MC. (Aii) Two-dimensional interaction between AMPKα1 and MC. (Bi) The binding pattern of AMPKα2 to MC. (Bii) Two-dimensional interaction between AMPKα2 and MC. (C) MC directly interacts with AMPK, influencing its phosphorylation and subsequently regulating lipid metabolism. |
Discussion
For patients, MAFLD itself may not be inherently alarming, but the true concern lies in the consequences of excessive fat acid deposition. In obese patients, obesity contributes to insulin resistance and low-grade inflammation due to the response of adipocytes to fatty acids. Within the liver, insulin resistance potentiates fatty acid accumulation.45 The peroxidation of fatty acids, the response of Kupffer cells to adipokines, and the oxidative damage caused by fatty acids can all elevate levels of inflammatory factors. These factors lead to the release of extracellular matrix, resulting in fibrosis, cirrhosis, and carcinogenesis, compromising liver function and affecting the lifespan. The consequences of these pathological developments include impaired liver function and a direct impact on the overall lifespan of affected individuals. Thus, the management and control of triglyceride accumulation in the liver emerge as a critical factor in effectively addressing the progression of MAFLD. Our findings demonstrated that after treatment of MC, the lipid accumulation was attenuated in HepG2 cells.
In cell viability experiments, no significant changes were observed after 24 and 48 hours of treatment. However, after 72 hours of MC treatment with concentrations of 400μM and 800μM, cell viability significantly decreased, indicating the cytotoxicity of MC at specific concentrations in HepG2 cells. A previous study has shown that MC can inhibit MAPK pathway in mouse colon cells.29 MAPK responds to growth factors, thereby promoting cell growth, differentiation, and inflammatory responses, and plays a crucial role in the initiation and progression of cancer.46,47 This deserves further studies to investigate the cytotoxic of MC in HepG2 cells.
The AMP-activated protein kinase (AMPK) signaling pathway is a crucial regulatory pathway involved in energy metabolism.4,37 When cellular energy level decreases, high-energy phosphate bonds in ATP are consumed to produce AMP.48 AMP binds to the γ-subunit of AMPK to change the conformation, making it more susceptible to being phosphorylated by upstream AMP-activated kinase LKB1 and protecting it from being dephosphorylated by PP2C.42,49,50 AMPK plays a pivotal role in shifting cellular metabolism from anabolism to catabolism, resulting in reduced fatty acid synthesis and enhanced fatty acid oxidation to generate ATP. This process establishes a new dynamic balance as p-AMPK can be dephosphorylated by phosphatases.14
Our findings demonstrate that MC treatment leads to an increase in p-AMPK expression, which can improve lipid metabolism in HepG2 cells. The protein levels of p-AMPK/AMPK, P-ACC/ACC, and CPT1a are elevated, indicating decreased lipid synthesis and elevated fatty acid oxidation. The protein level of pre-SREBP1c was also increased after treatment of MC. However, no significant change in cleaved state of SREBP1c was observed. To further investigate whether MC affects lipid metabolism through the AMPK pathway, Compound C was used, revealing a decrease in p-AMPK and deteriorated lipid accumulation compared to FFAs+MC group. And we did not notice significant changes in other downstream proteins such as HMGCR and SOD2. MC is known to increase CAMKK2 and further phosphorylate AMPK in 3T3-L1 differentiation.31 However, in our study, the protein level of CAMKK2 did not significantly change. We investigated another upstream AMPK kinase (AMPKK), LKB1, and found that the p-LKB1/LKB1 ratio did not show significant change upon treatment of MC. Then we attempted CAMKK2 knockdown using small interfering RNA to investigate whether the activation of AMPK by MC is suppressed, and the results turned out that the knockdown of CAMKK2 did not impact the ability of MC to activate AMPK. After conducting a molecular docking of MC to AMPKα, we hypothesize that the mechanism through which MC activates AMPK is independent of CAMKK2. Instead, it potentially involves a direct interaction with AMPK or an allosteric enhancement, directly or indirectly facilitating its phosphorylation. Further research is warranted to elucidate the precise mechanisms through which MC activates AMPK.
MC is a volatile compound widely used in food, cosmetics, and household products, and it has been approved by the FDA as a flavoring agent.28 MC is widely studied in many fields. Lilin et al found out that MC can improve dextran sulfate sodium-induced colitis in mice by inhibiting MAPK signaling pathway.29 Gui et al presented the ability of MC to activate AMPK in spinal.32 Many studies have demonstrated that cinnamaldehyde possesses anti-diabetic properties and anti-lipid activity. However, it is highly unstable in the body and undergoes oxidation to form cinnamic acid, which is further esterified to MC. Its functionality is considered to be attributed to its metabolites.51 This may make it noteworthy in research on MC in diabetes and obesity.
In our study, we observed the anti-lipid property of MC and the activation of AMPK signaling pathway. Like all drugs, MC’s effect on AMPK is dependent on time and concentration. To test its efficiency and safety, it’s important to conduct animal experiments and determine the pharmacokinetics. Isotope labeling is needed to determine where this drug is located in vivo and to identify the metabolic products of MC.52 Based on MC’s multiple molecular biology actions, more experiments are needed to determine the indications and contraindications in the treatment of MAFLD.
Abbreviations
MC, methyl cinnamate; CC, compound c; FFAs, free fatty acids; CAMKK2, Ca2+/CAM activated protein kinase kinase 2; LKB1, liver kinase B1; AMPK, AMP-activated protein kinase; SCD1, stearoyl-CoA desaturase; CPT1a, carnitine palmitoyl transferase 1; ACC, acetyl-CoA carboxylase; CAM, calmodulin; HFD, high-fat diet; CVD, chronic vascular disease; CKD, chronic kidney disease; MAPK, mitogen-activated protein kinase; SREBP1c, sterol regulatory element-binding protein 1c; SOD2, superoxide dismutase 2; HMGCR, 3-hydroxy-3-methylglutaryl-CoA reductase; ADFP, adipose differentiation related protein; PPARγ, peroxisome proliferator-activated receptor gamma; TG, triglyceride.
Funding
This study was supported by grants from the National Natural Science Foundation of China (No. 81373172 and No. 81770646).
Disclosure
The authors declare that the study was conducted in the absence of any commercial or financial relationships that could be construed as a potential conflict of interest.
References
1. Eslam M, Newsome PN, Sarin SK, et al. A new definition for metabolic dysfunction-associated fatty liver disease: an international expert consensus statement. J Hepatol. 2020;73(1):202–209. doi:10.1016/j.jhep.2020.03.039
2. Loomba R, Friedman SL, Shulman GI. Mechanisms and disease consequences of nonalcoholic fatty liver disease. Cell. 2021;184(10):2537–2564. doi:10.1016/j.cell.2021.04.015
3. Moon AM, Singal AG, Tapper EB. Contemporary epidemiology of chronic liver disease and cirrhosis. Clin Gastroenterol Hepatol. 2020;18(12):2650–2666. doi:10.1016/j.cgh.2019.07.060
4. Byrne CD, Targher G. NAFLD: a multisystem disease. J Hepatol. 2015;62(1 Suppl):S47–64. doi:10.1016/j.jhep.2014.12.012
5. Targher G, Byrne CD, Tilg H. NAFLD and increased risk of cardiovascular disease: clinical associations, pathophysiological mechanisms and pharmacological implications. Gut. 2020;69(9):1691–1705. doi:10.1136/gutjnl-2020-320622
6. Mantovani A, Lombardi R, Cattazzo F, Zusi C, Cappelli D, Dalbeni A. MAFLD and CKD: an Updated Narrative Review. Int J Mol Sci. 2022;23(13). doi:10.3390/ijms23137007
7. Sun DQ, Jin Y, Wang TY, et al. MAFLD and risk of CKD. Metabolism. 2021;115:154433. doi:10.1016/j.metabol.2020.154433
8. Chen J, Deng X, Liu Y, et al. Kupffer cells in non-alcoholic fatty liver disease: friend or foe? Int J Biol Sci. 2020;16(13):2367–2378. doi:10.7150/ijbs.47143
9. Lee E, Korf H, Vidal-Puig A. An adipocentric perspective on the development and progression of non-alcoholic fatty liver disease. J Hepatol. 2023;78(5):1048–1062. doi:10.1016/j.jhep.2023.01.024
10. Peters KM, Wilson RB, Borradaile NM. Non-parenchymal hepatic cell lipotoxicity and the coordinated progression of non-alcoholic fatty liver disease and atherosclerosis. Curr Opin Lipidol. 2018;29(5):417–422. doi:10.1097/mol.0000000000000535
11. Nassir F. NAFLD: mechanisms, Treatments, and Biomarkers. Biomolecules. 2022;12(6). doi:10.3390/biom12060824
12. Hardie DG, Ross FA, Hawley SA. AMPK: a nutrient and energy sensor that maintains energy homeostasis. Nat Rev Mol Cell Biol. 2012;13(4):251–262. doi:10.1038/nrm3311
13. Hawley SA, Selbert MA, Goldstein EG, Edelman AM, Carling D, Hardie DG. 5’-AMP activates the AMP-activated protein kinase cascade, and Ca2+/calmodulin activates the calmodulin-dependent protein kinase I cascade, via three independent mechanisms. J Biol Chem. 1995;270(45):27186–27191. doi:10.1074/jbc.270.45.27186
14. Davies SP, Helps NR, Cohen PT, Hardie DG. 5’-AMP inhibits dephosphorylation, as well as promoting phosphorylation, of the AMP-activated protein kinase. Studies using bacterially expressed human protein phosphatase-2C alpha and native bovine protein phosphatase-2AC. FEBS Lett. 1995;377(3):421–425. doi:10.1016/0014-5793(95)01368-7
15. Marcelo KL, Means AR, York B. The Ca(2+)/Calmodulin/CaMKK2 Axis: nature’s Metabolic CaMshaft. Trends Endocrinol Metab. 2016;27(10):706–718. doi:10.1016/j.tem.2016.06.001
16. Hawley SA, Boudeau J, Reid JL, et al. Complexes between the LKB1 tumor suppressor, STRAD alpha/beta and MO25 alpha/beta are upstream kinases in the AMP-activated protein kinase cascade. J Biol. 2003;2(4):28. doi:10.1186/1475-4924-2-28
17. Hardie DG, Carling D. The AMP-activated protein kinase--fuel gauge of the mammalian cell? Eur J Biochem. 1997;246(2):259–273. doi:10.1111/j.1432-1033.1997.00259.x
18. Batchuluun B, Pinkosky SL, Steinberg GR. Lipogenesis inhibitors: therapeutic opportunities and challenges. Nat Rev Drug Discov. 2022;21(4):283–305. doi:10.1038/s41573-021-00367-2
19. McGarry JD, Brown NF. The mitochondrial carnitine palmitoyltransferase system. From concept to molecular analysis. Eur J Biochem. 1997;244(1):1–14. doi:10.1111/j.1432-1033.1997.00001.x
20. Monsénégo J, Mansouri A, Akkaoui M, et al. Enhancing liver mitochondrial fatty acid oxidation capacity in obese mice improves insulin sensitivity independently of hepatic steatosis. J Hepatol. 2012;56(3):632–639. doi:10.1016/j.jhep.2011.10.008
21. Li Y, Xu S, Mihaylova MM, et al. AMPK phosphorylates and inhibits SREBP activity to attenuate hepatic steatosis and atherosclerosis in diet-induced insulin-resistant mice. Cell Metab. 2011;13(4):376–388. doi:10.1016/j.cmet.2011.03.009
22. El-Mir MY, Nogueira V, Fontaine E, Avéret N, Rigoulet M, Leverve X. Dimethylbiguanide inhibits cell respiration via an indirect effect targeted on the respiratory chain complex I. J Biol Chem. 2000;275(1):223–228. doi:10.1074/jbc.275.1.223
23. Nagashimada M, Ota T. Role of vitamin E in nonalcoholic fatty liver disease. IUBMB Life. 2019;71(4):516–522. doi:10.1002/iub.1991
24. Sodum N, Kumar G, Bojja SL, Kumar N, Rao CM. Epigenetics in NAFLD/NASH: targets and therapy. Pharmacol Res. 2021;167:105484. doi:10.1016/j.phrs.2021.105484
25. Feng X, Lin Y, Zhuo S, et al. Treatment of obesity and metabolic-associated fatty liver disease with a diet or orlistat: a randomized controlled trial. Am J Clin Nutr. 2023;117(4):691–700. doi:10.1016/j.ajcnut.2023.02.008
26. Sun W, Liu P, Wang T, Wang X, Zheng W, Li J. Baicalein reduces hepatic fat accumulation by activating AMPK in oleic acid-induced HepG2 cells and high-fat diet-induced non-insulin-resistant mice. Food Funct. 2020;11(1):711–721. doi:10.1039/c9fo02237f
27. Zhu X, Bian H, Wang L, et al. Berberine attenuates nonalcoholic hepatic steatosis through the AMPK-SREBP-1c-SCD1 pathway. Free Radic Biol Med. 2019;141:192–204. doi:10.1016/j.freeradbiomed.2019.06.019
28. Bhatia SP, Wellington GA, Cocchiara J, Lalko J, Letizia CS, Api AM. Fragrance material review on methyl cinnamate. Food Chem Toxicol. 2007;45(Suppl 1):S113–119. doi:10.1016/j.fct.2007.09.077
29. E L, Li W, Hu Y, Deng L, Yao J, Zhou X. Methyl cinnamate protects against dextran sulfate sodium-induced colitis in mice by inhibiting the MAPK signaling pathway. Acta Biochim Biophys Sin. 2023. doi:10.3724/abbs.2023124
30. Alam F, Saqib QNU, Ashraf M. Zanthoxylum armatum DC extracts from fruit, bark and leaf induce hypolipidemic and hypoglycemic effects in mice- in vivo and in vitro study. BMC Complement Altern Med. 2018;18(1):68. doi:10.1186/s12906-018-2138-4
31. Chen YY, Lee MH, Hsu CC, Wei CL, Tsai YC. Methyl cinnamate inhibits adipocyte differentiation via activation of the CaMKK2-AMPK pathway in 3T3-L1 preadipocytes. J Agric Food Chem. 2012;60(4):955–963. doi:10.1021/jf203981x
32. Gui Y, Chen L, Duan S, Li G, Tang J, Li A. Methyl cinnamate alleviated CCI-induced upregulation of spinal AMPA receptors and pain hypersensitivity by targeting AMPK. Eur J Pharmacol. 2018;833:183–189. doi:10.1016/j.ejphar.2018.05.033
33. Kim S, Chen J, Cheng T, et al. PubChem 2023 update. Nucleic Acids Res. 2023;51(D1):D1373–d1380. doi:10.1093/nar/gkac956
34. Cokorinos EC, Delmore J, Reyes AR, et al. Activation of Skeletal Muscle AMPK Promotes Glucose Disposal and Glucose Lowering in Non-human Primates and Mice. Cell Metab. 2017;25(5):1147–1159.e1110. doi:10.1016/j.cmet.2017.04.010
35. Xiao B, Sanders MJ, Carmena D, et al. Structural basis of AMPK regulation by small molecule activators. Nat Commun. 2013;4:3017. doi:10.1038/ncomms4017
36. Gómez-Lechón MJ, Donato MT, Martínez-Romero A, Jiménez N, Castell JV, O’Connor JE. A human hepatocellular in vitro model to investigate steatosis. Chem Biol Interact. 2007;165(2):106–116. doi:10.1016/j.cbi.2006.11.004
37. Herzig S, Shaw RJ. AMPK: guardian of metabolism and mitochondrial homeostasis. Nat Rev Mol Cell Biol. 2018;19(2):121–135. doi:10.1038/nrm.2017.95
38. Fang K, Wu F, Chen G, et al. Diosgenin ameliorates palmitic acid-induced lipid accumulation via AMPK/ACC/CPT-1A and SREBP-1c/FAS signaling pathways in LO2 cells. BMC Complement Altern Med. 2019;19(1):255. doi:10.1186/s12906-019-2671-9
39. Yao Q, Li S, Cheng X, Zou Y, Shen Y, Zhang S. Yin Zhi Huang traditional Chinese herbal formula, ameliorates diet-induced obesity and hepatic steatosis by activating the AMPK/SREBP-1 and the AMPK/ACC/CPT1A pathways. Ann Transl Med. 2020;8(5):231. doi:10.21037/atm.2020.01.31
40. Zhang YL, Hernandez-Ono A, Siri P, et al. Aberrant hepatic expression of PPARgamma2 stimulates hepatic lipogenesis in a mouse model of obesity, insulin resistance, dyslipidemia, and hepatic steatosis. J Biol Chem. 2006;281(49):37603–37615. doi:10.1074/jbc.M604709200
41. Gai H, Zhou F, Zhang Y, et al. Coniferaldehyde ameliorates the lipid and glucose metabolism in palmitic acid-induced HepG2 cells via the LKB1/AMPK signaling pathway. J Food Sci. 2020;85(11):4050–4060. doi:10.1111/1750-3841.15482
42. Zhang YL, Guo H, Zhang CS, et al. AMP as a low-energy charge signal autonomously initiates assembly of AXIN-AMPK-LKB1 complex for AMPK activation. Cell Metab. 2013;18(4):546–555. doi:10.1016/j.cmet.2013.09.005
43. Kusmic C, L’Abbate A, Sambuceti G, et al. Improved myocardial perfusion in chronic diabetic mice by the up-regulation of pLKB1 and AMPK signaling. J Cell Biochem. 2010;109(5):1033–1044. doi:10.1002/jcb.22486
44. Wang X, Li G, Guo C, et al. Ethyl 2-[2,3,4-Trimethoxy-6-(1-Octanoyl)Phenyl] Acetate (TMPA) Ameliorates Lipid Accumulation by Disturbing the Combination of LKB1 with Nur77 and Activating the AMPK Pathway in HepG2 Cells and Mice Primary Hepatocytes. Diabetes Metab Syndr Obes. 2021;14:4165–4177. doi:10.2147/dmso.S321246
45. Sakurai Y, Kubota N, Yamauchi T, Kadowaki T. Role of Insulin Resistance in MAFLD. Int J Mol Sci. 2021;22(8). doi:10.3390/ijms22084156
46. Reddy D, Kumavath R, Ghosh P, Barh D. Lanatoside C Induces G2/M Cell Cycle Arrest and Suppresses Cancer Cell Growth by Attenuating MAPK, Wnt, JAK-STAT, and PI3K/AKT/mTOR Signaling Pathways. Biomolecules. 2019;9(12). doi:10.3390/biom9120792
47. Liu S, Xu X, Fang Z, et al. Piezo1 impairs hepatocellular tumor growth via deregulation of the MAPK-mediated YAP signaling pathway. Cell Calcium. 2021;95:102367. doi:10.1016/j.ceca.2021.102367
48. Ke R, Xu Q, Li C, Luo L, Huang D. Mechanisms of AMPK in the maintenance of ATP balance during energy metabolism. Cell Biol Int. 2018;42(4):384–392. doi:10.1002/cbin.10915
49. Green MF, Anderson KA, Means AR. Characterization of the CaMKKβ-AMPK signaling complex. Cell Signal. 2011;23(12):2005–2012. doi:10.1016/j.cellsig.2011.07.014
50. Suter M, Riek U, Tuerk R, Schlattner U, Wallimann T, Neumann D. Dissecting the role of 5’-AMP for allosteric stimulation, activation, and deactivation of AMP-activated protein kinase. J Biol Chem. 2006;281(43):32207–32216. doi:10.1074/jbc.M606357200
51. Zhu R, Liu H, Liu C, et al. Cinnamaldehyde in diabetes: a review of pharmacology, pharmacokinetics and safety. Pharmacol Res. 2017;122:78–89. doi:10.1016/j.phrs.2017.05.019
52. Parks EJ, Hellerstein MK. Thematic review series: patient-oriented research. Recent advances in liver triacylglycerol and fatty acid metabolism using stable isotope labeling techniques. J Lipid Res. 2006;47(8):1651–1660. doi:10.1194/jlr.R600018-JLR200
 © 2024 The Author(s). This work is published and licensed by Dove Medical Press Limited. The
full terms of this license are available at https://www.dovepress.com/terms
and incorporate the Creative Commons Attribution
- Non Commercial (unported, 3.0) License.
By accessing the work you hereby accept the Terms. Non-commercial uses of the work are permitted
without any further permission from Dove Medical Press Limited, provided the work is properly
attributed. For permission for commercial use of this work, please see paragraphs 4.2 and 5 of our Terms.
© 2024 The Author(s). This work is published and licensed by Dove Medical Press Limited. The
full terms of this license are available at https://www.dovepress.com/terms
and incorporate the Creative Commons Attribution
- Non Commercial (unported, 3.0) License.
By accessing the work you hereby accept the Terms. Non-commercial uses of the work are permitted
without any further permission from Dove Medical Press Limited, provided the work is properly
attributed. For permission for commercial use of this work, please see paragraphs 4.2 and 5 of our Terms.