Back to Journals » Cancer Management and Research » Volume 15
Metformin Induces a Caspase 3-Unrelated Apoptosis in Human Colorectal Cancer Cell Lines HCT116 and SW620
Authors Rosidi B, Priyatno D, Putra TP, Yusuf I
Received 19 August 2022
Accepted for publication 16 March 2023
Published 8 June 2023 Volume 2023:15 Pages 475—485
DOI https://doi.org/10.2147/CMAR.S385278
Checked for plagiarism Yes
Review by Single anonymous peer review
Peer reviewer comments 2
Editor who approved publication: Professor Kattesh Katti
Bustanur Rosidi,1 Diana Priyatno,1 Teguh Pribadi Putra,1 Irawan Yusuf1,2
1Division of Proteomics, Mochtar Riady Institute for Nanotechnology and Medical Science Group, University of Pelita Harapan, Tangerang, Banten, Indonesia; 2Faculty of Medicine, Hasanuddin University, Makassar, Indonesia
Correspondence: Bustanur Rosidi; Irawan Yusuf, Mochtar Riady Institute for Nanotechnology and Medical Science Group, University of Pelita Harapan, Jalan Boulevard Jenderal Sudirman 1688, Lippo Karawaci, Tangerang, Banten, 15811, Indonesia, Tel +62 21-54210123, Email [email protected]; [email protected]
Purpose: To study the effects of metformin on the proliferation and growth of human colorectal cancer cell lines HCT116 and SW620.
Materials and Methods: The antiproliferative effect of metformin was assayed using an MTS reagent and its ability to inhibit colony formation was demonstrated using a clonogenic assay. Flow cytometry using YO-PRO-1/PI was performed to examine the effects of metformin on apoptosis and cell death of HCT116 and SW620. Caspase 3 activities were measured in caspase-3 activity tests using a caspase-3 activity kit. Furthermore, Western blots were performed with anti-PARP1, anti-caspase 3, and anti-cleaved caspase 3 to confirm whether caspase activation was present or not.
Results: Both MTS proliferation assays and clonogenic assays showed that metformin inhibited the proliferation and growth of HCT116 and SW620 cells in a concentration-dependent manner. Flow cytometric analysis identified early apoptosis and metformin-induced cell death in both cell lines. However, caspase 3 activity could not be detected. Cleavage of both PARP1 and pro-caspase 3 was not observed in the Western blot, confirming the absence of caspase 3 activations.
Conclusion: This present study suggests a caspase 3-unrelated apoptosis mechanism of metformin-induced cell death in human colorectal cancer cell lines HCT116 and SW620.
Keywords: metformin, colorectal cancer, PARP1, anti-proliferative, apoptosis
Introduction
Colorectal cancer (CRC) remains a major cause of death from cancer. In most cases, this disease is still in an incurable stage. It is the third most common type of cancer and the second leading cause of cancer deaths worldwide. According to Globocan 2020, about 1.9 million new CRC cases and nearly 900,000 CRC deaths have been recorded worldwide.1 CRC therapies rely only on surgical removal of cancer, combined with subsequent chemotherapy, which is usually associated with uncomfortable side effects for patients.2,3 It is, therefore, desirable to find new strategies for therapies that help alleviate the discomfort of patients during post-surgical chemotherapy or to find chemopreventive alternatives to prevent the development of CRC.
Metformin is an antihyperglycemic biguanide drug that has been used as a first-line treatment for type 2 diabetes mellitus for decades. Metformin’s antihyperglycemic effect is due to its ability to lower blood glucose levels by improving glucose uptake in peripheral tissues and sensitizing these tissues to insulin.4,5 Metformin is also able to suppress the gluconeogenic activity of the liver and thus down-regulate the body’s glucose production.6,7 Eventually, the antihyperglycemic activity of metformin leads to a reduction in the level of circulating insulin.8,9
Over the past two decades, evidence has accumulated that metformin can reduce the risk of cancer and cancer-related mortality in diabetics.10,11 In one study, Currie et al showed that metformin reduced the incidence of colon or pancreatic cancer but had no effect on breast or prostate cancer.12 Several in vitro studies report anti-tumor activities of metformin in human cell lines such as hepatocellular carcinoma (HCC),13–15 breast, lung,16–18 pancreatic, and colon cancer cell lines.19,20
In this study, we aimed to investigate the effects of metformin on the proliferation and growth of two human colorectal cancer cell lines, HCT116 and SW620. HCT 116 is a human colorectal carcinoma cell line of Duke’s type A, initiated from a 48-year-old male. The cells are adherent with an epithelial morphology.21 On the other side, the SW620 cell line was derived from a colon cancer lymph node metastasis (Duke’s type C) from a 51-year-old male and has a rounded or spindle-shaped (Fibroblast-like) morphology.22,23 The antiproliferative effect of metformin was determined using an MTS (3-(4,5-dimethylthiazol-2-yl)-5-(3-carboxymethoxyphenyl)-2-(4-sulfophenyl)-2H-tetrazolium) reagent and the ability of metformin to suppress clonogenicity was demonstrated using a clonogenic assay. Flow cytometry using the YO-PRO-1/propidium iodide (PI) label was performed to assess metformin-induced apoptosis and cell death. Furthermore, the activation of caspase 3 was investigated using caspase 3 activity assay and Western blot analysis by detecting PARP1 and caspase 3 cleavage.
Materials and Methods
Reagents
Metformin (1,1-dimethyl biguanide hydrochloride) was purchased from Sigma (#D150959, Sigma-Aldrich, St. Louis, MO, USA) and dissolved in a serum-free medium to a stock solution of 1 M. Other chemicals and reagents were purchased from Sigma (Sigma-Aldrich, St. Louis, MO, USA) and Merck (Merck KGaA, Darmstadt, Germany).
Antibodies were purchased from Sigma (Sigma-Aldrich, St. Louis, MO, USA) and CST (Cell Signaling Technology, Beverly, MA, USA). The antibodies used for Western blots were anti-rabbit IgG-peroxidase (#A0545, Sigma), rabbit anti-GAPDH antibody (#G9545, Sigma), rabbit anti-β-actin antibody (#A2066, Sigma), anti-PARP antibody (#9542, CST), anti-caspase-3 antibody (#9662, CST) and anti-cleaved caspase-3 antibody (#9664, CST).
Cell Culture
The colon cancer cell lines HCT116 and SW620 were purchased from the American Type Culture Collection (ATCC, Manassas, VA, USA). Cells were cultured according to the ATCC protocol. Briefly, HCT116 was maintained in culture using McCoy 5a medium supplemented with 10% fetal bovine serum, and 1% penicillin-streptomycin (50 U/mL). Cells were grown in flasks or dishes and maintained in a humidified incubator (5% CO2 at 37°C) with a medium change every 2–3 days. SW620 was maintained in Leibovitz’s L-15 medium supplemented with 10% fetal bovine serum and 1% penicillin-streptomycin (50 U/mL) in a humidified incubator at 37°C (without 5% CO2) with a medium change every 2–3 days. All media and supplements were obtained from Gibco-Life Technologies (Carlsbad, CA, USA).
Proliferation Assay
The proliferation assay was performed using CellTiter 96®AQueous One Solution Kit (#G3580, Promega Corp., Madison, WI, USA) according to the manufacturer’s protocol. Assays were performed in triplicates, starting with 10,000 to 20,000 cells seeded 24 hours before treatment in 96-well flat-bottomed microplates (TPP, Trasadingen, Switzerland). After changing the medium, treatment with 0, 1, 2.5, 5, and 10 mM metformin followed, and the cells were incubated for a further 24, 48, and 72 hours. The cell culture was stopped by adding the MTS-PES (MTS – phenazine ethosulfate) solution and after 1–4 hours of incubation at 37°C, the absorbance of the formazan product was measured at 490 nm using an ELISA reader (Ultramark, Bio-Rad Laboratories, Hercules, California, USA). Cell viabilities (%) are defined by the percentage of viable cells compared to untreated control. Growth and proliferation determinations using water-soluble MTS were first used in the work of Cory et al24 and Riss et al.25
Clonogenic Assay
With some modifications, clonogenic assays were done according to the methods of Franken et al and Munshi et al26,27 Briefly, HCT116 cells were seeded in triplicate at a density of 250 cells/well in 12-well plates containing 1 mL of McCoy 5a complete medium and grown at 37°C in a 5% CO2 incubator. After 24 hours, a fresh medium containing 1, 2.5, 5, or 10 mM metformin was added and the cells were further cultured for another 14 days. Clonogenic assays for SW620 were done similarly, except that SW620 were seeded in 12- or 24-well plates at a density of 100–250 cells and cultured in Leibovitz’s complete medium in a 37°C incubator without CO2. After 10–12 days (HCT116) and 14 days (SW620), the medium was aspirated and the cell colonies were washed twice with PBS and stained with 0.5% crystal violet in 25% methanol for 15 min. Excess dye was removed by rinsing three times with tap water. After drying, the plates were scanned and colony numbers were counted. The survival rate (%) is calculated using the following formula: Survival rate (%) = (colony number of treated cells/colony number of control cells) x 100%.
Caspase 3 Activity Assay
Caspase activities were measured using a caspase activity kit for caspase-3 (#CASP-3C, Sigma-Aldrich, St. Louis, MO, USA). This is a colorimetric protease assay based on the spectrophotometric detection of the chromophore p-nitroanilide (pNA) after cleavage from the labeled caspase-3 specific substrate DEVD-pNA. All experiments were performed according to the manufacturer’s instructions. This caspase 3 activity assay is based on the protocol of Niles et al after modification.28
Flow Cytometry
For apoptosis analysis using flow cytometry, HCT116, and SW620 cells were grown in a 24-well plate to approximately 70–80% confluency. After treatment with 0, 5, 10, and 20 mM metformin, cells were cultured for an additional 24 or 48 hours before analysis. The cells were then labeled with YO-PRO-1 and propidium iodide using VybrantTM Apoptosis Assay Kit #4, YO-PROTM-1/Propidium Iodide (#V13243, Thermo Fisher Scientific, Waltham, MA, USA). The cell preparation procedure for flow cytometry followed the manufacturer’s instructions. Cells were analyzed immediately after staining using BD Accuri™ C6 flow cytometer (BD Biosciences, Franklin Lakes, NJ, USA). The use of YO-PRO-1/PI for apoptosis analysis using flow cytometry goes back to the work of Idziorek et al.29
Western Blot
Western blots were done according to Zakikhani et al and Voit et al30,31 with some modifications. Protein extraction for Western blots was performed from cells cultured in 100 mm dishes treated with 0, 5, 10, and 20 mM metformin for 48 hours after they had reached approximately 70–80% confluency. Cells were lysed by disruption in lysis buffer using a cell scraper. The lysis buffer used contains 50mM HEPES, 150mM NaCl, 2.5mM EGTA, 1.0mM EDTA, 1.0mM DTT, 0.1% Tween20, 10% glycerol, 10 mM β-glycerophosphate, 1.0 mM phenylmethylsulfonyl fluoride and protease inhibitor cocktails (#P8340 −1ML, Sigma) (10 μL in 1 mL lysis buffer). Cell lysates were collected after centrifugation and protein concentrations were determined using the Bradford method with Bio-Rad Protein Assay Kit II (#500-0002, Bio-Rad, Hercules, CA, USA).
The SDS PAGE was performed according to Laemmli’s method.32 Depending on the size of the proteins to be separated, 10–12% SDS gels were used. Proteins were transferred to a nitrocellulose membrane (#1620213, Bio-Rad, Hercules, CA, USA) by a semidry blotting procedure using a Bio-Rad Trans-Blot Turbo Transfer System (Bio-Rad, Hercules, CA, USA). After blocking with 5% milk in TBST (in 50 mM Tris, 200 mM NaCl, 0.2% Tween 20), the membrane was incubated in the first antibody solution diluted in 5% milk at 4°C overnight. Before incubation in secondary antibodies, the membrane was washed three times each for 5 minutes. Proteins bands were visualized using ECL Western blotting reagents (#RPN 2108, GE-Life Science, Piscataway, NJ, USA) and documented in a VersaDoc 4000MP Imaging System (Bio-Rad, Hercules, CA, USA) with the integrated corresponding imaging software (Quantity One®).
Statistical Analysis
Statistical analysis and graphing of the data were performed using GraphPad Prism 9.2.0.332 (free version) (GraphPad Software, San Diego, CA, USA). The normality of data distribution was verified by the Shapiro–Wilk test. A nonparametric Kruskal–Wallis test was applied, in case the analysis did not pass the normality distribution. Unless otherwise stated, the statistical significance of differences was calculated by one-way ANOVA. The comparison between groups was performed with Tukey’s post hoc test. Data are expressed as means ± SEM. Statistical significance was set at p < 0.05 for all differences assessed.
Results
Metformin Inhibits the Proliferation and Growth of Human Colorectal Cell Lines
To assess the effects of metformin on the proliferation of HCT116 and SW620 cell lines, we performed proliferation assays using an MTS reagent (CellTiter 96® AQueous One Solution Kit, #G3580, Promega Corp., Madison, WI, USA). This assay essentially assesses the cytotoxic effect of metformin on cell culture. Only viable cells with intact mitochondrial dehydrogenase enzymes can convert the MTS reagent into a product that can be measured colorimetrically with a spectrophotometer. The results of this assay show that metformin inhibits cell proliferation in both cell lines in a concentration-dependent manner (Figure 1). Metformin IC50 values for HCT116 were calculated to be 8 mM for 24 hours, 3.2 mM for 48 hours, and 2.9 for 72 hours of treatment. SW620, on the other hand, appears to be more sensitive to metformin treatment, as the average metformin IC50 calculated in this cell line was approximately 1.4 mM. A time-dependence of the metformin effect on cell proliferation can be observed between 24 and 48 hours, particularly in the case of HCT116. Although metformin effectively inhibited SW620 cell proliferation, the difference in inhibition between 24, 48, and 72 hours was not very significant.
 |
Figure 1 Metformin inhibited proliferation of human colorectal cell lines HCT116 (A) and SW620 (B). For this proliferation assays, 10,000 to 20,000 cells were seeded in 96-well plates, and after 24 hours of plating, treated with 0, 1, 2.5, 5, and 10mM metformin and cultured for 24, 48, and 72 hours. MTS reagent was added and absorbance of formazan product was read at 490 nm. The absorbance of untreated control was set at 100% viability. The concentration and time dependence were determined by two-way ANOVA. HCT116 (A) showed a very significant concentration and time dependence (P < 0.0001). SW620 (B) showed a very significant concentration dependence (P<0.0001) but no significant time dependence. The data are presented as the mean ± SD from three experiments. |
The clonogenic or colony formation assay determines a cell’s ability to proliferate indefinitely, preserving its reproductive ability to form a large colony or clone. This cell is then termed clonogenic.27 Figure 2 shows results from clonogenic assays. In both cell lines, 50% of colony formation was inhibited by metformin at a concentration of approximately 2 mM. Cell survival percentages continued to decrease with the increasing concentration of metformin (Figure 2).
 |
Figure 2 Clonogenic assay with HCT116 (A) and SW620 (B). 250 HCT 116 cells were seeded in 12-well plates and 200 SW620 cells were seeded in 24-well plates. After 24 hours medium was changed to a fresh medium containing 0, 1, 2.5, 5, and 10 mM metformin. Cells were incubated for 10–12 days (HCT116) or 14 days (SW620) and colonies stained with crystal violet were counted. The data are presented as the mean ± SD from at least three experiments. P-value of <0.001 is represented as *** and of <0.0001 as ****. |
Metformin Causes Apoptosis and Cell Death in a Dose-Dependent Manner
YO-PRO-1 (Invitrogen) is a green-emitting fluorochrome that can be combined with propidium iodide to identify dead cells. YO-PRO-1 is an alternative to Annexin V for staining early apoptotic cells in flow cytometry. Cells in early apoptosis are unable to pump out YO-PRO-1 but are still impermeable to other dead cells discriminating dyes, such as propidium iodide.29 Flow cytometry analysis of HCT116 treated with metformin for 48 hours results in an increase of both YO-PRO-1 and PI labeled cells with increasing metformin concentration (Figure 3). A significant increase in YO-PRO-1 labeling was observed after 48 hours of treatment with 10 and 20 mM metformin, while the proportion of YO-PRO-1 labeling did not increase significantly with 5 mM metformin treatment compared to the 0 mM control, particularly in the SW620 cells. On average, in SW620, the population of YO-PRO-1-labeled cells also increased with increasing metformin concentration, but the proportion was lower compared to the HCT116 cells (29.3% with 10 mM and 34.2% with 20 mM metformin for 48 hours in HCT116 compared to 5.5% and 8.0% in SW620). The population of dead cells (PI-labeled cells) was highest at 48 hours with 20 mM metformin (Figure 3A and B, lower panel).
 |
Figure 3 Metformin caused cell death in HCT116 (A) and SW620 (B) cell lines in a concentration-dependent manner. For flow cytometry analysis, cells were cultured in 12 well plates to 70–80% confluency, followed by treatment with 0–20 mM metformin for 48 hours. Cells were harvested and labeled with YO-PRO-1/PI (VybrantTM Apoptosis Assay Kit #4, #V13243, Thermofisher) according to the manufacturer’s instructions. Quadrants are defined using controls of unlabeled cells, cells labeled only with YO-PRO-1, and cells labeled only with PI. Necrotic cells, if any, are found in the upper left quadrant on the cytogram (UL), whereas the viable cells are in the lower left quadrant (LL). Cells in the early phase of apoptosis are in the lower right (LR) and those in the late apoptosis (“dead cells”) are in the upper right quadrant (UR). Flow cytograms show representative data from a single experiment (upper panel). Quantification of the percentage of viable, apoptotic, and dead cells was derived from three independent experiments. Data show mean values ±SD from three independent experiments (lower panel). Abbreviation: MET, metformin. |
No Caspase-3 Activities Were Detected in Metformin-Treated Cells
Caspase 3 is activated in the process of apoptosis. It is a downstream component of both the extrinsic and intrinsic apoptotic pathways.33,34 Should metformin kill HCT116 and SW620 via the apoptotic pathway, caspase 3 activity must be detectable in the protein lysate prepared from metformin-treated cells. A caspase-3 activity kit (Sigma, #CASP-3-C) was used to determine caspase-3 activity. This is a colorimetric protease assay based on the spectrophotometric detection of the chromophore p-nitroanilide (pNA) after its cleavage from the labeled substrate DEVD-pNA. A recombinant caspase-3 was included in the kit as a positive control for the caspase-3 reaction. HCT116 cells treated with 0.1 mM sodium deoxycholate (NaDOC) for 2 hours were used as an apoptosis-positive control. It is reported that apoptosis can be induced in HCT116 by treatment with 0.1–0.4 mM NaDOC.35,36
While in cell lysate isolated from HCT116 treated with 0.1 mM NaDOC for 2 h, the caspase-3 activities measured were comparable to those of 10 μL (= 0.05 μg) of recombinant caspase 3 (Figure 4), in lysates of both HCT116 and SW620 cells treated with metformin, almost no caspase-3 activities were detectable (Figure 4 and Supplementary Figure S1).
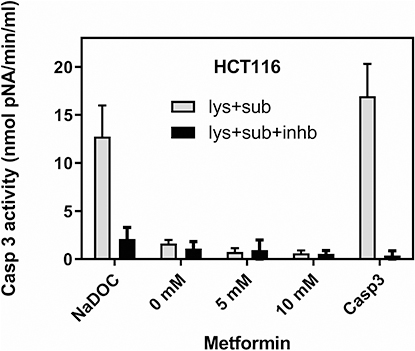 |
Figure 4 Metformin did not induce caspase 3 activity in HCT116 cells. For the caspase 3 activity assay, lysates were prepared from 107 untreated cells (0 mM metformin), cells treated with 5 mM and 10 mM metformin for 48 hrs. As an apoptosis-positive control, HCT116 cells were treated with 0.1 mM sodium deoxycholate (NaDOC) for 2 hours before protein isolation. Recombinant caspase 3 (a component of the kit) served as a positive control for the caspase 3 reaction (Casp3). Ten μL of lysates were applied in one reaction, and each was added with caspase 3 substrate (Ac-DEVD-pNA) and caspase 3 substrate + caspase 3 inhibitor (Ac-DEVD-CHO). Caspase 3 activity is presented in nmol pNA/min/mL (Caspase 3 Assay Kit, #CASP-3-C, Sigma). Data show mean values ±SD from three independent experiments. Abbreviations: lys, lysate; sub, substrate; inhb, inhibitor. |
Once activated, caspase 3 cuts its specific substrates. One of these substrates is PARP1. Upon proteolytic activation of caspase 3, PARP1 is cleaved to a product of 89 kDa in length. The cleavage of PARP1 can therefore serve as an apoptosis marker.37 Since it is well known that PARP1 is a substrate of caspase 3, Western blot analysis using anti-PARP1, which detects both full-length and cleavage products of PARP1, indirectly confirms the activation of caspase 3 if present. Caspase 3 itself exists in the cell as a pro-enzyme, pro-caspase 3 of about 32 kDa. Once apoptosis is initiated, a cascade of signals is triggered leading to cleavage of this pro-enzyme, leaving an activated product, the approximately 17–19 kDa active caspase 3.38,39
The anti-PARP1 antibody used in the Western blot analysis was able to detect both full-length (116 kDa) and cleaved PARP1 (86 kDa). In HCT116 (Figure 5A), a faint band of cleaved PARP1 was detected in the untreated control, indicating basal apoptotic activity within the cell population. Cleaved PARP1 was not detected in lysates prepared from metformin-treated cells, instead, the full-length PARP1 band appears to be enhanced at 5 and 10 mM metformin but decreased markedly at 20 mM metformin (Figure 5A). We did not observe this apparent enhancing effect at 5mM (and 10mM) metformin in every Western blot we performed. However, the protein band intensity always decreased with increasing metformin concentration. Metformin-dependent cleavage of PARP1 was not observed in any Western blots with an anti-PARP1 antibody. Neither enhancement nor disappearance of the full-length PARP1 bands was observed in the Western blot of SW620 cells. Cleaved PARP1 was also barely detectable (Supplementary Figure S2).
 |
Figure 5 Metformin did not induce PARP1 cleavage in HCT116 (A). Metformin also did not induce caspase 3 activation in HCT116 cells (B and C). Cells were treated with 0, 5, 10, and 20 mM metformin for 48 hours. As an apoptosis-positive control, HCT116 cells were treated with 0.1 and/or 0.2 mM of sodium deoxycholate (NaDOC) for 3 hours. Protein lysates were prepared as mentioned in Materials and Methods. Thirty μg proteins were loaded on 10–12% SDS PAGE and separated proteins were transferred onto nitrocellulose membranes. Antibody detections were performed using anti-PARP1 antibody (#9542, CST) in (1:1000) dilution in blocking buffer. Loading control used was β-actin (anti-β-actin antibody, #A2066, Sigma). For (B and C), antibody detections were performed using anti-caspase 3 and anti-cleaved caspase 3 antibodies (#9662, CST and #9664, CST) in (1:1000) dilution in blocking buffer. The data shown are representative of three independent experiments. |
Western blot analysis of HCT116 with anti-caspase 3 antibody showed a significant decrease of pro-caspase 3 with increasing metformin concentration (Figure 5B). Detection with an anti-cleaved antibody did not reveal that the activated caspase 3 was present in the protein lysates of metformin-treated cells (Figure 5C).
Discussion
Colorectal cancer (CRC) remains a very serious cause of death from cancer. In most cases, this disease is ultimately incurable. Surgical resection remains the only curative treatment that is most effective when performed at an early stage of the illness. Surgical removal of CRC is often combined with adjuvant radiation and chemotherapy with one or more chemotherapy drugs. However, chemotherapies are still accompanied by severe side effects and dose-limiting toxicity. Patients’ quality of life is worsened by drug-related adverse events, which may lead them to refuse to continue with potentially curative treatment.2 The toxicity due to a chemotherapeutic drug can be reduced by non-toxic chemo adjuvant compounds that potentiate the tumoricidal effects of the drugs in smaller doses. In efforts of developing therapeutic strategies for the treatment of CRC, it is therefore important to identify non-toxic chemo adjuvants among herbal medicines and well-established drugs (drug repurposing) that are known as safe and without severe side effects.40
Metformin has been used as a first-line medication for type 2 diabetes mellitus for decades.41 In contrast to anti-diabetics of the sulfonylurea type, the glucose-lowering effect of metformin does not cause hypoglycemia.42 It is also considered safe since the use of metformin is associated with a very low incidence of lactic acidosis compared to its precursors biguanides, buformin, and phenformin.41 As has been reported in recent years, metformin has the potential for the therapy of various other diseases than diabetes.43,44 There is evidence that metformin acts as an anti-aging factor and modulates microbiota, promoting good health.45 Its prospective use as a cancer chemopreventive agent has also been widely discussed.46 As inexpensive drug metformin has also a promising future as an anti-cancer or as an adjuvant agent in cancer chemotherapy.
In the current study, we have shown that metformin inhibited the proliferation and growth of colorectal cancer cell lines HCT116 and SW620 in a concentration and time-dependent manner. The results of the MTS proliferation assay showed that SW620 seemed to be more sensitive to metformin than HCT116. In clonogenic assays, however, both cell lines responded quite similarly to metformin treatment. A metformin concentration of 2.5 mM inhibited the growth of more than 50% of colonies compared to the control, in both cell lines (Figure 2).
Flow cytometric analysis was carried out to evaluate the mechanisms of this metformin-induced growth inhibition and cell killing. For this purpose, the cells were labeled with YO-PRO-1 and propidium iodide (PI). YO-PRO-1 is a cell impermeant cationic cyanine dye that can enter cells at the early stage of apoptosis. This dye is used as an alternative to annexin V and can discriminate dead cells from early apoptotic cells in combination with PI.47 YO-PRO-1 labeling increased in HCT116 cells with increasing metformin concentration, indicating metformin-induced apoptosis in this cell line. A correlation between apoptosis and metformin concentration is also observed in SW620 cells in a significantly lower proportion (Figure 3). The population of dead cells in both cell lines markedly increased in correlation with metformin concentration (PI labeling, Figure 3).
The apoptosis process was obviously initiated in these cell lines by treatment with metformin. However, an important feature of apoptosis was missing. No measurable caspase 3 activity has been detected (Figure 4 and Supplementary Figure S1). Caspases are proteases that play a crucial role during apoptosis and execute death signals by attacking their substrates leading ultimately to cell killing.33,34 Caspase 3 is an effector caspase of both intrinsic and extrinsic apoptosis pathways. The activation of caspase 3 is considered characteristic of apoptosis.48 Cleavage of pro-caspase 3, thus its activation, and of PARP1, a caspase 3 target, was also not observed (Figure 5A and Supplementary Figure S2). The lack of caspase-3 activity and its activation as well as the lack of PARP1 cleavage in this case indicates the absence of apoptosis in the classic sense. This implies that the underlying mechanism for the initiated apoptosis shown in the flow cytometry is unrelated to caspase 3.
Metformin has been shown to exert anti-proliferative effects in many types of cancer cells.9,17,30,49–51 Depending on the cell type, metformin has been reported to induce various types of cell death mechanisms. While it was reported that metformin induces apoptosis in lung adenocarcinoma, breast, pancreatic, and esophageal cancer cells,16,18,19,52 Ben-Sahra et al observed a caspase 3 independent mechanism in prostate cancer cells that were treated with metformin, leading to cell death due to G0/G1 cell cycle arrest.49 No DNA fragmentation and PARP1 cleavage were observed in the luminal A, B, or erbB2 subtypes of breast cancer cell lines, where metformin has been shown to inhibit cellular proliferation, and reduce colony formation and cause a cell cycle arrest.50 Another type of non-apoptotic cell death induced by metformin treatment has been described in endometrial cells, lymphoma, and melanoma. In these cells, metformin caused cell death through autophagy.53–55 In normal, non-cancerous cells metformin has been shown to have no effect on growth and proliferation.56–58
There are various reports explaining the mechanisms of cell death caused by metformin in different types of cancer cell lines. In addition to the different properties of the cell lines used in the studies, the conditions of the respective cell culture also play an essential role. Alhourani et al showed that depending on the concentration of glucose used in cell culture, cells may respond differently to metformin treatment.59 In addition to apoptosis, necrosis, and autophagy, cell death can be induced by the mechanism of endoplasmic reticulum stress as well as endoplasmic reticulum-associated degradation (ERAD).60,61 The reduced expression of PARP1 and pro-caspase 3 with increasing metformin concentration, as observed in Western blot, with no detectable cleaved form of these proteins (Figure 5), could be an indication of a possible death caused by uncontrolled autophagy or endoplasmic reticulum-associated degradation following endoplasmic reticulum stress. However, evidence for this hypothesis is still lacking.
Conclusion
We have shown herein that metformin induced cell death in human colorectal cancer cell lines HCT116 and SW620 through an apoptotic mechanism unrelated to caspase 3. Apoptosis was apparently initiated by metformin treatment, as demonstrated by flow cytometry. However, the observed cell death was per se not compliant with the characteristics of apoptosis in the classical sense. The actual mechanisms underlying metformin-induced cell death in these two cell lines remain to be elucidated.
Acknowledgments
This study was supported by the Mochtar Riady Institute for Nanotechnology. The authors thank Prof Dr. George Mathew, for his guidance, support, and fruitful discussions while conducting this study. Many thanks to Dr. Ivet Suriapranata for her help and suggestions during the preparation of the revised manuscript.
This study was approved by the Ethics Committee (EC) of the Mochtar Riady Institute for Nanotechnology (MRIN) (ethical approval number 012/MRIN-EC/01/2014).
Disclosure
The authors declare no conflicts of interest in this work.
References
1. Sung H, Ferlay J, Siegel RL, et al. Global cancer statistics 2020: GLOBOCAN estimates of incidence and mortality worldwide for 36 cancers in 185 countries. CA Cancer J Clin. 2021;71:209–249. doi:10.3322/caac.21660
2. Xie Y-H, Chen Y-X, Fang J-Y. Comprehensive review of targeted therapy for colorectal cancer. Signal Transduct Target Ther. 2020;5(1):22. doi:10.1038/s41392-020-0116-z
3. Aoullay Z, Slaoui M, Razine R, Er-Raki A, Meddah B, Cherrah Y. Therapeutic characteristics, chemotherapy-related toxicities and survivorship in colorectal cancer patients. Ethiop J Health Sci. 2020;30(1):65–74. doi:10.4314/ejhs.v30i1.9
4. An H, He L. Current understanding of metformin effect on the control of hyperglycemia in diabetes. J Endocrinol. 2016;228(3):R97–R106. doi:10.1530/JOE-15-0447
5. Viollet B, Guigas B, Garcia NS, Leclerc J, Foretz M, Andreelli F. Cellular and molecular mechanisms of metformin: an overview. Clin Sci. 2012;122(6):253–270. doi:10.1042/CS20110386
6. Madiraju AK, Erion DM, Rahimi Y, et al. Metformin suppresses gluconeogenesis by inhibiting mitochondrial glycerophosphate dehydrogenase. Nature. 2014;510(7506):542–546. doi:10.1038/nature13270
7. Madiraju AK, Qiu Y, Perry RJ, et al. Metformin inhibits gluconeogenesis via a redox-dependent mechanism in vivo. Nat Med. 2018;24(9):1384–1394. doi:10.1038/s41591-018-0125-4
8. Goodwin P, Pritchard K, Ennis M, Clemons M, Graham M, Fantus IG. Insulin-lowering effects of metformin in women with early breast cancer. Clin Breast Cancer. 2008;8(6):501–505. doi:10.3816/CBC.2008.n.060
9. Dowling RJO, Goodwin PJ, Stambolic V. Understanding the benefit of metformin use in cancer treatment. BMC Med. 2011;9:33. doi:10.1186/1741-7015-9-33
10. Safe S, Nair V, Karki K. Metformin-induced anticancer activities: recent insights:. Biol Chem. 2018;399(4):321–335. doi:10.1515/hsz-2017-0271
11. Aljofan M, Riethmacher D. Anticancer activity of metformin: a systematic review of the literature. Futur Sci OA. 2019;5(8):FSO410–FSO410. doi:10.2144/fsoa-2019-0053
12. Currie CJ, Poole CD, Gale EAM. The influence of glucose-lowering therapies on cancer risk in type 2 diabetes. Diabetologia. 2009;52(9):1766–1777. doi:10.1007/s00125-009-1440-6
13. Miyoshi H, Kato K, Iwama H, et al. Effect of the anti-diabetic drug metformin in hepatocellular carcinoma in vitro and in vivo. Int J Oncol. 2014;45(1):322–332. doi:10.3892/ijo.2014.2419
14. Qu Z, Zhang Y, Liao M, Chen Y, Zhao J, Pan Y. In vitro and in vivo antitumoral action of metformin on hepatocellular carcinoma. Hepatol Res. 2012;42(9):922–933. doi:10.1111/j.1872-034X.2012.01007.x
15. Xiong Y, Lu Q-J, Zhao J, Wu G-Y. Metformin inhibits growth of hepatocellular carcinoma cells by inducing apoptosis via mitochondrion-mediated pathway. Asian Pacific J Cancer Prev. 2012;13(7):3275–3279. doi:10.7314/APJCP.2012.13.7.3275
16. Queiroz EAIF, Puukila S, Eichler R, et al. Metformin induces apoptosis and cell cycle arrest mediated by oxidative stress, AMPK and FOXO3a in MCF-7 breast cancer cells. PLoS One. 2014;9(5):e98207. doi:10.1371/journal.pone.0098207
17. Zhuang Y, Miskimins WK. Cell cycle arrest in Metformin treated breast cancer cells involves activation of AMPK, downregulation of cyclin D1, and requires p27(Kip1) or p21(Cip1). J Mol Signal. 2008;3:18. doi:10.1186/1750-2187-3-18
18. Wang J, Gao Q, Wang D, Wang Z, Hu C. Metformin inhibits growth of lung adenocarcinoma cells by inducing apoptosis via the mitochondria‑mediated pathway. Oncol Lett. 2015;10(3):1343–1349. doi:10.3892/ol.2015.3450
19. Wang L-W, Li Z-S, Zou D-W, Jin Z-D, Gao J, Xu G-M. Metformin induces apoptosis of pancreatic cancer cells. World J Gastroenterol. 2008;14(47):7192–7198. doi:10.3748/wjg.14.7192
20. Buzzai M, Jones RG, Amaravadi RK, et al. Systemic treatment with the antidiabetic drug metformin selectively impairs p53-deficient tumor cell growth. Cancer Res. 2007;67(14):6745–6752. doi:10.1158/0008-5472.CAN-06-4447
21. Brattain MG, Fine WD, Khaled FM, Thompson J, Brattain DE. Heterogeneity of malignant cells from a human colonic carcinoma. Cancer Res. 1981;41(5):1751–1756.
22. Leibovitz A, Stinson JC, McCombs WB, McCoy CE, Mazur KC, Mabry ND. Classification of human colorectal adenocarcinoma cell lines. Cancer Res. 1976;36(12):4562–4569.
23. Ahmed D, Eide PW, Eilertsen IA, et al. Epigenetic and genetic features of 24 colon cancer cell lines. Oncogenesis. 2013;2(9):e71. doi:10.1038/oncsis.2013.35
24. Cory AH, Owen TC, Barltrop JA, Cory JG. Use of an aqueous soluble tetrazolium/formazan assay for cell growth assays in culture. Cancer Commun. 1991;3(7):207–212. doi:10.3727/095535491820873191
25. Riss TL, Moravec RA. Comparison of MTT, XTT, and a novel tetrazolium compound MTS for in vitro proliferation and chemosensitivity assays. Mol Biol Cell. 1992;3(Suppl):184A–184A.
26. Franken NAP, Rodermond HM, Stap J, Haveman J, van Bree C. Clonogenic assay of cells in vitro. Nat Protoc. 2006;1(5):2315–2319. doi:10.1038/nprot.2006.339
27. Munshi A, Hobbs M, Meyn RE. Clonogenic cell survival assay. In: Chemosensitivity. Springer; 2005:021–028.
28. Niles AL, Moravec RA, Riss TL. Caspase activity assays. Methods Mol Biol. 2008;414:137–150. doi:10.1007/978-1-59745-339-4_11
29. Idziorek T, Estaquier J, De Bels F, Ameisen JC. YOPRO-1 permits cytofluorometric analysis of programmed cell death (apoptosis) without interfering with cell viability. J Immunol Methods. 1995;185(2):249–258. doi:10.1016/0022-1759(95)00172-7
30. Zakikhani M, Dowling R, Fantus IG, Sonenberg N, Pollak M. Metformin is an AMP kinase-dependent growth inhibitor for breast cancer cells. Cancer Res. 2006;66(21):10269–10273. doi:10.1158/0008-5472.CAN-06-1500
31. Voit R, Hoffmann M, Grummt I. Phosphorylation by G1-specific cdk-cyclin complexes activates the nucleolar transcription factor UBF. EMBO J. 1999;18(7):1891–1899. doi:10.1093/emboj/18.7.1891
32. Laemmli UK. Cleavage of structural proteins during the assembly of the head of bacteriophage T4. Nature. 1970;227:680. doi:10.1038/227680a0
33. McIlwain DR, Berger T, Mak TW. Caspase functions in cell death and disease. Cold Spring Harb Perspect Biol. 2013;5(4):a008656. doi:10.1101/cshperspect.a008656
34. Parrish AB, Freel CD, Kornbluth S. Cellular mechanisms controlling caspase activation and function. Cold Spring Harb Perspect Biol. 2013;5(6):a008672. doi:10.1101/cshperspect.a008672
35. Powolny A, Xu J, Loo G. Deoxycholate induces DNA damage and apoptosis in human colon epithelial cells expressing either mutant or wild-type p53. Int J Biochem Cell Biol. 2001;33:193–203. doi:10.1016/S1357-2725(00)00080-7
36. Samaha HS, Asher E, Payne CM, Bernstein C, Bernstein H. Evaluation of cell death in EBV-transformed lymphocytes using agarose gel electrophoresis, light microscopy and electron microscopy. I. Induction of classic apoptosis by the bile salt, sodium deoxycholate. Leuk Lymphoma. 1995;19(1–2):95–105. doi:10.3109/10428199509059663
37. Duriez PJ, Shah GM. Cleavage of poly(ADP-ribose) polymerase: a sensitive parameter to study cell death. Biochem Cell Biol. 1997;75(4):346–347. doi:10.1139/o97-043
38. Nicholson DW, Ali A, Thornberry NA, et al. Identification and inhibition of the ICE/CED-3 protease necessary for mammalian apoptosis. Nature. 1995;376(6535):37–43. doi:10.1038/376037a0
39. Fernandes-Alnemri T, Litwack G, Alnemri ES. CPP32, a novel human apoptotic protein with homology to Caenorhabditis elegans cell death protein Ced-3 and mammalian interleukin-1β-converting enzyme. J Biol Chem. 1994;269(49):30761–30764. doi:10.1016/S0021-9258(18)47344-9
40. Sadeghi H, Yazdanparast R. Isolation and structure elucidation of a new potent anti-neoplastic diterpene from Dendrostellera lessertii. Am J Chin Med. 2005;33(5):831–837. doi:10.1142/S0192415X05003387
41. Bailey CJ. Metformin: historical overview. Diabetologia. 2017;60(9):1566–1576. doi:10.1007/s00125-017-4318-z
42. Nasri H, Rafieian-Kopaei M. Metformin: current knowledge. J Res Med Sci. 2014;19(7):658–664.
43. Sui X, Xu Y, Wang X, Han W, Pan H, Xiao M. Metformin: a novel but controversial drug in cancer prevention and treatment. Mol Pharm. 2015;12(11):3783–3791. doi:10.1021/acs.molpharmaceut.5b00577
44. Martin-Montalvo A, Mercken EM, Mitchell SJ, et al. Metformin improves healthspan and lifespan in mice. Nat Commun. 2013;4:2192. doi:10.1038/ncomms3192
45. Pryor R, Cabreiro F. Repurposing metformin: an old drug with new tricks in its binding pockets. Biochem J. 2015;471(Pt 3):307–322. doi:10.1042/BJ20150497
46. Podhorecka M, Ibanez B, Dmoszyńska A. Metformin - its potential anti-cancer and anti-aging effects. Postepy Hig Med Dosw. 2017;71:170–175.
47. Fujisawa S, Romin Y, Barlas A. Evaluation of YO-PRO-1 as an early marker of apoptosis following radiofrequency ablation of colon cancer liver metastases. Cytotechnology Mar Pp. 2014;66:259–273. doi:10.1007/s10616-013-9565-3
48. Porter AG, Jänicke RU. Emerging roles of caspase-3 in apoptosis. Cell Death Differ. 1999;6(2):99–104. doi:10.1038/sj.cdd.4400476
49. Ben-Sahra I, Laurent K, Loubat A, et al. The antidiabetic drug metformin exerts an antitumoral effect in vitro and in vivo through a decrease of cyclin D1 level. Oncogene. 2008;27:3576. doi:10.1038/sj.onc.1211024
50. Alimova IN, Liu B, Fan Z, et al. Metformin inhibits breast cancer cell growth, colony formation and induces cell cycle arrest in vitro. Cell Cycle. 2009;8(6):909–915. doi:10.4161/cc.8.6.7933
51. Isakovic A, Harhaji L, Stevanovic D, et al. Dual antiglioma action of metformin: cell cycle arrest and mitochondria-dependent apoptosis. Cell Mol Life Sci. 2007;64(10):1290–1302. doi:10.1007/s00018-007-7080-4
52. Tang J-C, An R, Jiang YQ, Yang J. Effects and mechanisms of metformin on the proliferation of esophageal cancer cells in vitro and in vivo. Cancer Res Treat. 2016;49(3):778–789. doi:10.4143/crt.2015.485
53. Takahashi A, Kimura F, Yamanaka A, et al. Metformin impairs growth of endometrial cancer cells via cell cycle arrest and concomitant autophagy and apoptosis. Cancer Cell Int. 2014;14(1):1–12. doi:10.1186/1475-2867-14-53
54. Shi WY, Xiao D, Wang L, et al. Therapeutic metformin/AMPK activation blocked lymphoma cell growth via inhibition of mTOR pathway and induction of autophagy. Cell Death Dis. 2012;3(3):e275–9. doi:10.1038/cddis.2012.13
55. Tomic T, Botton T, Cerezo M, et al. Metformin inhibits melanoma development through autophagy and apoptosis mechanisms. Cell Death Dis. 2011;2(9):e199–10. doi:10.1038/cddis.2011.86
56. Han G, Gong H, Wang Y, Guo S, Liu K. AMPK/mTOR-mediated inhibition of survivin partly contributes to metformin-induced apoptosis in human gastric cancer cell. Cancer Biol Ther. 2015;16(1):77–87. doi:10.4161/15384047.2014.987021
57. Lu CC, Chiang JH, Tsai FJ, et al. Metformin triggers the intrinsic apoptotic response in human AGS gastric adenocarcinoma cells by activating AMPK and suppressing mTOR/AKT signalling. Int J Oncol. 2019;54(4):1271–1281. doi:10.3892/ijo.2019.4704
58. Zhao Y, Luo Q, Mo J, et al. Metformin in combination with JS-K inhibits growth of renal cell carcinoma cells via reactive oxygen species activation and inducing DNA breaks. J Cancer. 2020;11(13):3701–3712. doi:10.7150/jca.36372
59. Alhourani AH, Tidwell TR, Bokil AA, et al. Metformin treatment response is dependent on glucose growth conditions and metabolic phenotype in colorectal cancer cells. Sci Rep. 2021;11(1):10487. doi:10.1038/s41598-021-89861-6
60. Quentin T, Steinmetz M, Poppe A, Thoms S. Metformin differentially activates ER stress signaling pathways without inducing apoptosis. Dis Model Mech. 2012;5(2):259–269. doi:10.1242/dmm.008110
61. Cha J-H, Yang W-H, Xia W, et al. Metformin promotes antitumor immunity via endoplasmic-reticulum-associated degradation of PD-L1. Mol Cell. 2018;71(4):606–620.e7. doi:10.1016/j.molcel.2018.07.030
 © 2023 The Author(s). This work is published and licensed by Dove Medical Press Limited. The
full terms of this license are available at https://www.dovepress.com/terms
and incorporate the Creative Commons Attribution
- Non Commercial (unported, 3.0) License.
By accessing the work you hereby accept the Terms. Non-commercial uses of the work are permitted
without any further permission from Dove Medical Press Limited, provided the work is properly
attributed. For permission for commercial use of this work, please see paragraphs 4.2 and 5 of our Terms.
© 2023 The Author(s). This work is published and licensed by Dove Medical Press Limited. The
full terms of this license are available at https://www.dovepress.com/terms
and incorporate the Creative Commons Attribution
- Non Commercial (unported, 3.0) License.
By accessing the work you hereby accept the Terms. Non-commercial uses of the work are permitted
without any further permission from Dove Medical Press Limited, provided the work is properly
attributed. For permission for commercial use of this work, please see paragraphs 4.2 and 5 of our Terms.