Back to Journals » Diabetes, Metabolic Syndrome and Obesity » Volume 17
Metabolically Unhealthy Normal Weight: Prevalence and Associated Factors in an Adult Population from Northwest Colombia
Authors López-Herrera JA, Castillo AN, Ordoñez-Betancourth JE, Martínez Quiroz WDJ, Higuita-Gutiérrez LF ![]() , Suarez-Ortegon MF
, Suarez-Ortegon MF
Received 22 November 2023
Accepted for publication 11 February 2024
Published 18 March 2024 Volume 2024:17 Pages 1337—1357
DOI https://doi.org/10.2147/DMSO.S449213
Checked for plagiarism Yes
Review by Single anonymous peer review
Peer reviewer comments 2
Editor who approved publication: Prof. Dr. Juei-Tang Cheng
Julián Andrés López-Herrera,1 Adriana Nathaly Castillo,2 Jenny Elizabeth Ordoñez-Betancourth,3 Wilson de Jesús Martínez Quiroz,4 Luis Felipe Higuita-Gutiérrez,5 Milton F Suarez-Ortegon6
1Departamento de Salud Pública, Facultad de Ciencias de la Salud, Pontificia Universidad Javeriana Seccional Cali, Cali, Colombia; 2Departamento de nutrición y dietética, Institución Universitaria Escuela Nacional del Deporte, Cali, Colombia; 3Facultad de Ciencias de la Salud, Universidad Icesi, Cali, Colombia; 4Dirección de gestión clínica y promoción y prevención, Metrosalud, Medellín, Colombia; 5School of Medicine, Universidad Cooperativa de Colombia, Medellín, Colombia; 6Departamento de Alimentación y Nutrición, Facultad de Ciencias de la Salud, Pontificia Universidad Javeriana Seccional Cali, Cali, Colombia
Correspondence: Milton F Suarez-Ortegon; Luis Felipe Higuita-Gutiérrez, Email [email protected]; [email protected]
Background and Aim: Individuals with a normal weight may have metabolic alterations at risk for chronic non-communicable diseases. The prevalence of this condition and associated factors have not been reported in Latin American populations. We aimed to estimate the presence and associated factors of Metabolically Unhealthy Normal Weight (MUNW) in adults from a public program for the control and prevention of chronic diseases in Medellín, Colombia.
Methods: Cross-sectional study. Overweight and normal weight were characterized according to the absence or presence of one or more components of the metabolic syndrome, obtaining four phenotypes: Metabolically Healthy Normal Weight (MHNW), MUNW (phenotype of interest), Metabolically Healthy Overweight (MHO), and Metabolically Unhealthy Overweight (MUO). The association of these phenotypes with sociodemographic variables of lifestyles and increased waist circumference was conducted by using logistic regression.
Results: In 37,558 individuals (72.7% women), the prevalence of MUNW was 23.3%. Among the additional phenotypes, MUO was found to be more prevalent (71.6%), while MHNW and MHO were very slightly common, 2% and 3.1%, respectively. In a multiple model, the factors associated with MUNW were age over 60 years (trend [OR 1.56 95% CI 0.97– 2.52] p-value = 0.066), living in a rural area ([OR 1.58 95% CI 1.09– 2.29] p-value = 0.015), and increased waist circumference ([OR 1.68 95% CI 1.45– 1.95] p-value < 0.001). Male gender was inversely associated with all phenotypes (P < 0.05).
Conclusion: Almost a quarter of the analyzed population presented MUNW. People living in a rural area and over 60 years old were more likely to present MUNW. Men were less likely to present the weight phenotypes studied, although they could have been underrepresented.
Keywords: normal weight, metabolism, risk factor, body mass index, metabolic profile, metabolic syndrome
Introduction
Excess adiposity in terms of overweight and obesity is a condition that is usually accompanied by metabolic and hemodynamic alterations.1,2 This abnormal metabolic pattern appears to be at least partially explained by the deleterious effects of subclinical inflammation derived from adipose tissue on insulin sensitivity.3 However, the combination of overweight/obesity status and metabolic health status leads to discordant phenotypes such as metabolically healthy overweight/obesity (MHO) and metabolically unhealthy normal weight (MUNW), and expectable phenotypes of metabolic unhealthy overweight/obesity (MUO) and metabolic healthy normal weight (MHNW).4 There is some heterogeneity in definitions of these phenotypes, consisting of the absence or presence of metabolic syndrome criteria, hypercholesterolemia, and/or hyperinsulinemia or insulin resistance as components.4,5
In recent years, discordant phenotypes MHO and MUNW have obtained growing attention due to the paradox they might represent in the management of risk for non-communicable chronic diseases. Despite individuals with MHO lack of main cardiometabolic risk factors, several prospective studies have shown associations between this phenotype and higher risk of diabetes and cardiovascular diseases when compared with MHNW.6–8 Therefore, MHO seems to be a state in which normality of metabolic parameters is transitory and worsens throughout time in the individual with overweight or obesity, and thus excess body mass must be still a major criterion in risk management.9,10 Meanwhile, MUNW has been associated with increased cardiovascular alterations and mortality by cardiovascular disease,5,11 and the screening of these individuals is complex in clinical practice.
In Latin America, there have been scarce or null evaluations of MUNW. Particularly in Colombia, the need for estimation of discordant phenotypes and variables related to them is even more pertinent. According to a population-based study representative of urban individuals in the five major regions of Colombia, one of every two Colombians is affected by overweight or obesity (57.6%).12 Moreover, diet habits are inclined toward hypercaloric meals according to a 2015 ENSIN survey analysis.13 This increase might increase the chance of finding metabolic alterations either in normal or excess weight status. Therefore, we conducted a study to estimate the prevalence of MUNW and other weight status phenotypes and evaluate potential associated factors in a population attending a prevention and monitoring program of chronic diseases in Medellin, Colombia.
Methods
Study Population
This cross-sectional study consisted of the analysis of data from individuals linked to a program of public health for control of chronic diseases implemented by the health provider institution E.S.E Metrosalud, of the city of Medellín, in 2019. The original database contained 69,883 records of individuals over 18 years of age, with voluntary participation. The data were generated from electronic medical records. We included adults (18 years or older) with medical records linked to the program with active participation and screening compliance. We excluded cases with missing or out-of-range values for those anthropometric and cardio-metabolic risk variables that defined the discordant phenotypes. These extreme or out-of-range values, in addition to the criteria to define the values, are set out in Supplemental Table S1. Individuals with a diagnosis of diseases that already defined the individual with a pathology related to cardio-metabolic risk were excluded: diabetes (ICD-10 CODES E-110-149; E-100-109), kidney disease (ICD-10 CODES N170-179), and cerebrovascular (ICD-10 I600-679; G-450-459) and cardiovascular disease (ICD-10 I200-I259). The above exclusion criteria were based on 2 reasons: 1 - these disorders already define individuals with a cardio-metabolic pathology and not individuals at risk; and 2 - These pathologies, due to their metabolism, might bring associated complications, added to the effect of medications and treatment that could bias the cardio-metabolic factors values to define phenotypes of weight status. The consolidation process of the final sample of 37,558 individuals for the analysis is described step by step in Supplemental Table S2.
Study Outcomes
Determination of MUNW and other weight status phenotypes was based on the presence of Overweight or Normal Weight in combination with the presence or absence of cardio-metabolic risk factors. Overweight including obesity, was determined based on a BMI (calculated as weight/height2) equal to or greater than 25 kg/m2, and a normal weight as a BMI below that cut-off point and above 18 kg/m2.
Cardio-metabolic risk factors were taken from the criteria described in the harmonized definition of metabolic syndrome:14 Triglycerides >150 mg/dl; High-density lipoprotein cholesterol (HDL-C) level of <40 mg/dl in men and <50 mg/dl in women; systolic blood pressure (SBP) of ≥130 mm/Hg and/or diastolic blood pressure (DBP) of ≥85 mm/Hg; and glucose levels of ≥100 mg/dl. The low-density lipoprotein cholesterol (LDL-C) levels were calculated according to the Friedewald equation, and levels >110 mg/dL were an additional cardiometabolic risk factor. Although this latter factor is not part of the definition of metabolic syndrome, high levels are associated with atherogenesis and cardiovascular risk.15 We complement the dyslipidemia-related criteria and the increased blood pressure criterion by using information on clinical diagnosis of dyslipidemia and hypertension as part of those criteria.
In this way, the phenotypes and their metabolic condition were estimated as follows:
- Metabolically Healthy Normal Weight (MHNW): Normal weight and not having any cardio-metabolic risk criteria
- Metabolically Unhealthy Normal Weight (MUNW) (main category of analysis): Normal weight and presenting one or more cardio-metabolic risk criteria
- Metabolically healthy overweight/Obesity (MHO): Overweight or obesity and not having any cardio-metabolic risk criteria
- Metabolically Unhealthy Overweight/obesity (MUO): Overweight or obesity and presenting one or more cardio-metabolic risk criteria
Regarding the criterion of increased waist circumference (WC) from the metabolic syndrome definition, this was not used as part of the cardio-metabolic risk criteria that defined the categories of metabolic status previously described. The rationale for this decision was based on the fact that individuals with overweight tend to have this criterion, and it was of particular interest for this analysis to verify the relationship of abdominal obesity with MUNW.
Exposures of the Study
Increased waist circumference was one of the exposure variables based on ≥90 cm in men and ≥80 cm in women, according to the regional cut-offs suggested for South American populations by the harmonized definition of metabolic syndrome.14 Sociodemographic and lifestyle variables were also exposure variables in this analysis, and were: age (years), sex (male/female[Ref]), education level (illiterate[Ref], elementary, secondary, technical profession education, undergraduate, graduate), ethnicity (general population[Ref], Afro-descendant, Palenquero, Raizal, Roma, and Indigenous) area of residence (urban[Ref]/rural), marital status (single[Ref], divorced, free union, married, widowhood), alcohol intake habit (yes/no), and smoking (yes/no). For these exposure variables, having missing values was not a reason for exclusion.
Ethnicity was defined according to the self-perception of belonging to a specific ethnic group. The measurement of smoking and alcoholism was based on the patient’s consumption in the last month, at least once a week. For regular physical activity, an individual who reported engaging in vigorous or moderate physical activity at least three times per week was classified as active, and below that frequency was classified as inactive
Data Analysis
The continuous variables were summarized by calculating the median and its interquartile range, regardless of their normal or non-normal distribution. The rationale to homogenize the description of all these variables with the same central trend measure was on the basis that for non-normal distributed variables, a mean does not represent the values distribution and a median is the best option, and in the case of normally distributed variables, median and mean tend to be similar. The categorical variables were described as frequency and percentage. The difference in the distribution of the proportion of cases with each phenotype throughout categories of the exposure variables was examined via χ2 test. Continuous variables of anthropometric, clinical, and biochemical variables were additionally described by groups of weight status phenotypes, and the trend for difference throughout the groups was estimated by using the Jonckheere-Terpstra test.
Logistic regression was used to evaluate the association between exposure variables and each weight status phenotype (MUNW, MHO, MUO) using metabolically MHNW as the reference for the outcomes. We first conducted univariate analyses with each exposure variable vs the outcomes and selected those that showed a p-value <0.10 to be included in the multiple model, observing the change in odds ratio (OR), confidence interval (CI), and p-value. In the multiples models, we used a backward elimination, by progressively removing variables with the highest (non-significant) p-values till obtaining the best explanatory model.
We additionally conducted a subgroup analysis by sex to identify potential sex differences in association patterns. We did not carry out any sensitivity analysis since this study had an exploratory nature to find variables associated with MUNW and other phenotypes.
The analyses were carried out using Stata Software 14.0.
Results
Sociodemographic characteristics and some lifestyle variables are described in Table 1. Most of the adults studied were over 60 years old (68.9%), women (72.7%), and one out of every two (48.9%) individuals reported schooling up to the primary level. The predominant marital status was being single with 40.7% followed by married status with 34.7%. A vast majority (80–95%) of the individuals resided in the urban area and did not recognize themselves in an ethnic group, being classified as general population, and did not report tobacco or alcohol use. Physical activity was reported in around two-thirds of the individuals (65.4%) (Table 1).
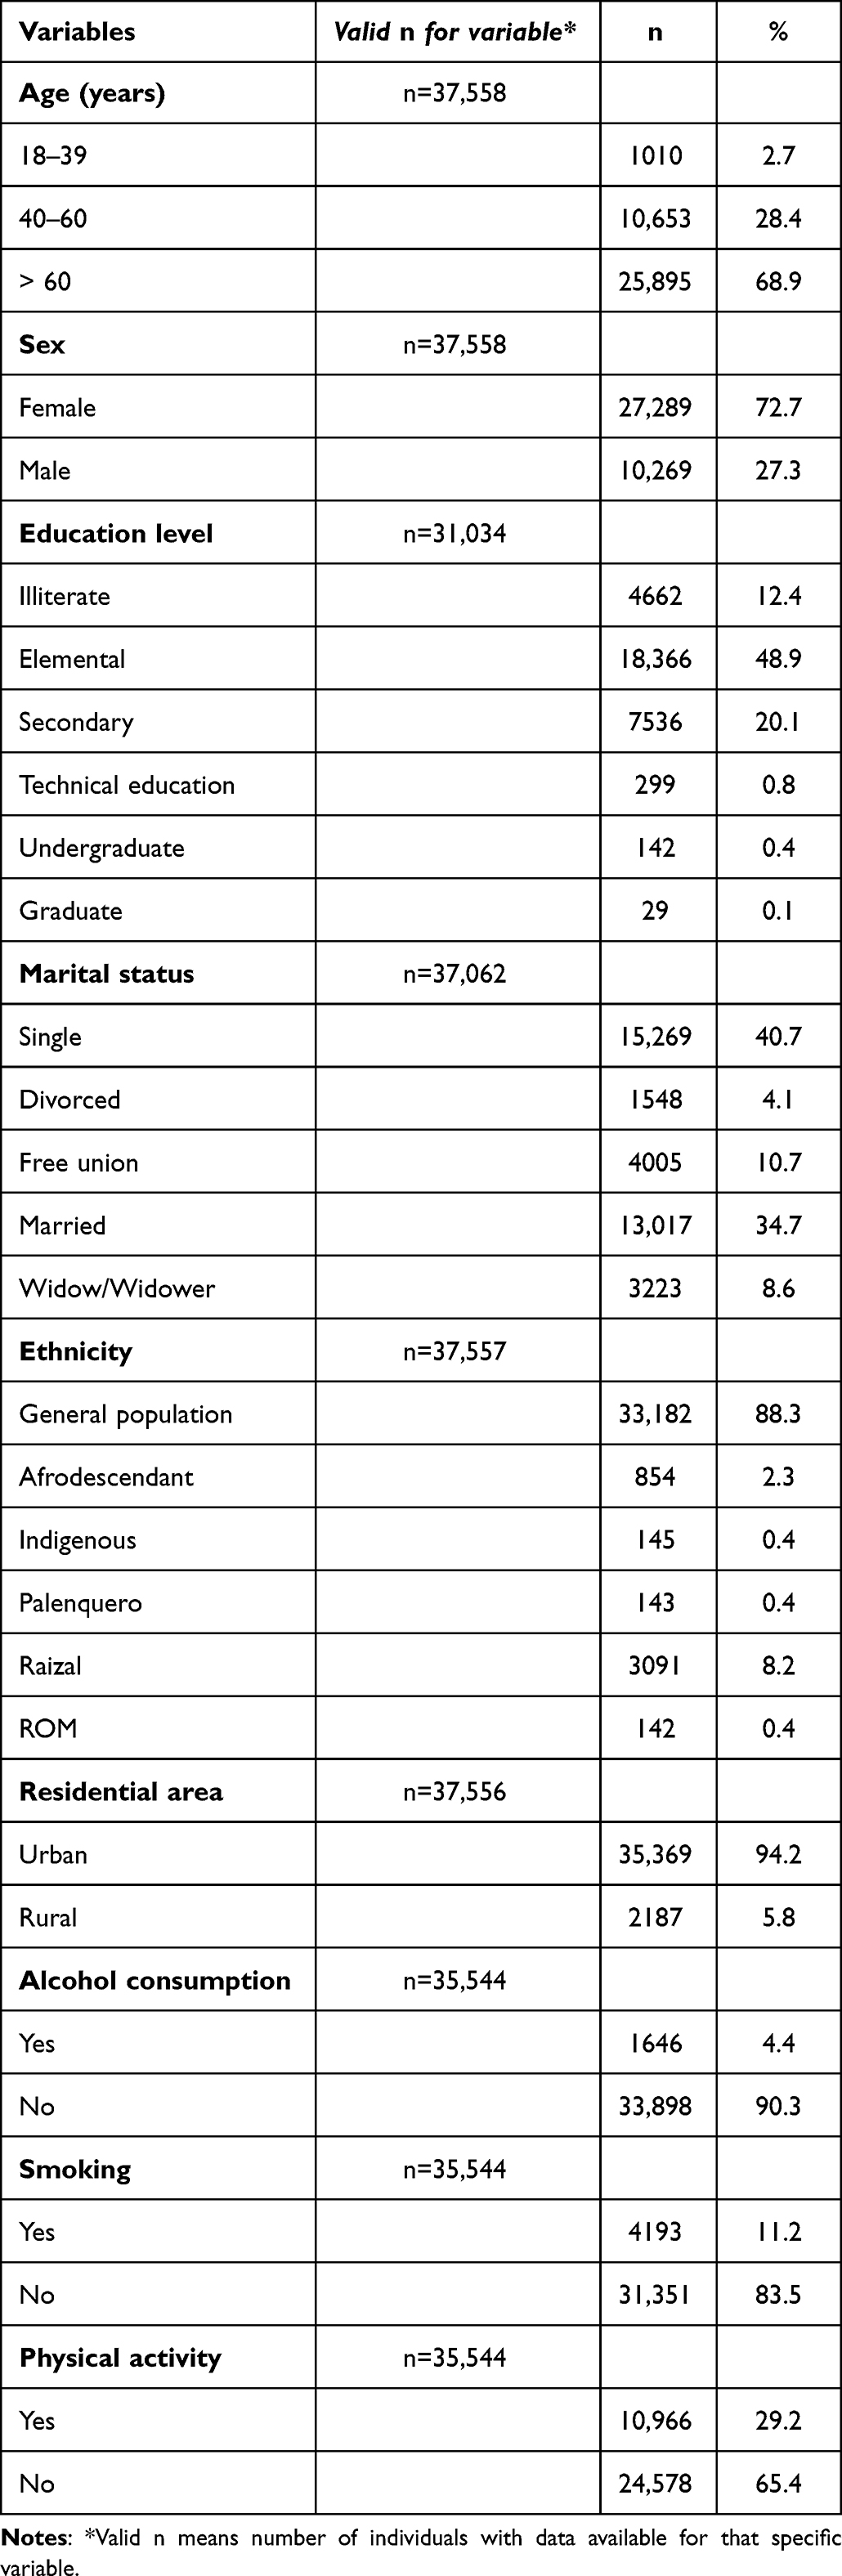 |
Table 1 Description of Study Sociodemographic Variables in the Sample |
Prevalence of MUNW was around one-quarter of the individuals (23.3%, n = 8734). MHNW and MHO were present in only 2% (n = 767) and 3.1% (n = 1164) of the individuals, respectively, and MUO was the most prevalent phenotype, 71.6% (n = 26,893).
Continuous variables of anthropometric, clinical, and biochemical variables are described in the whole sample and by weight status phenotypes in Supplemental Table S3. As expected, medians of biochemical markers and blood pressure tended to be higher in MUNW and MUO than in MHO and MHNW because based on cut-offs for these markers the phenotypes were established. The BMI median in the whole sample was in the range of overweight [27.8 Interquartile range (24.9–31.3)]. Waist circumference was higher in overweight phenotypes and comparable between normal weight phenotypes [MHNW median 85 (78–90) and MUNW median 86 (81–91)].
When MUO and MUNW were compared in terms of individual metabolic components, both phenotypes were similar in proportions of cases with increased blood pressure, high LDL cholesterol, and a history of previous diagnosis of unspecified dyslipidemia (Table 2). However, high fasting glucose (HFG) high triglycerides levels (HTL), and low HDL-C were significantly more prevalent in MUO than in MUNW (Table 2).
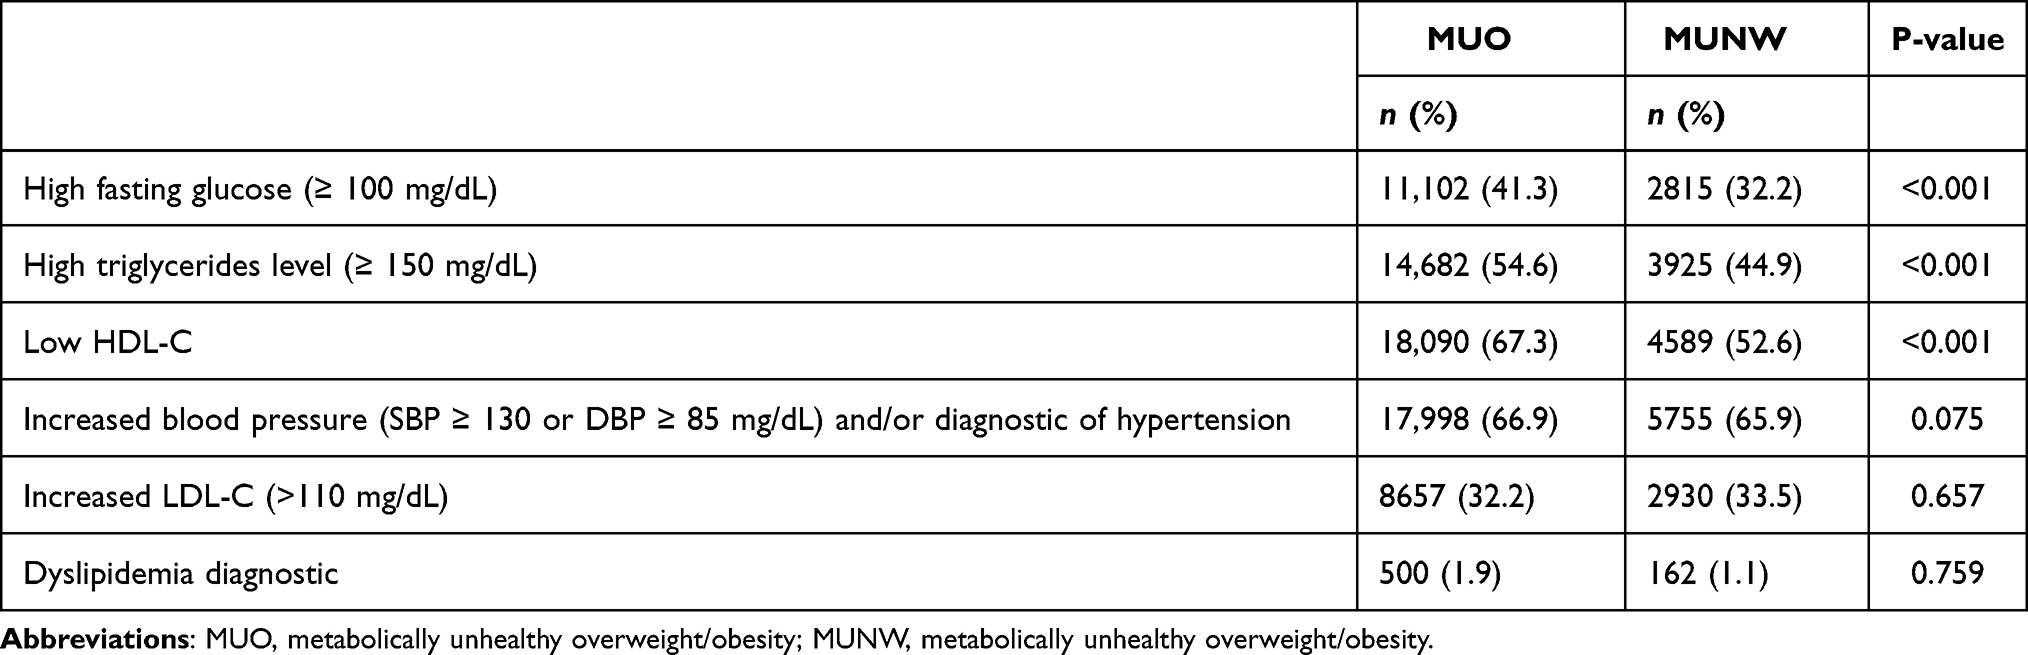 |
Table 2 Individual Metabolic Components in the Unhealthy Metabolic Phenotypes (N = 37,558) |
The distribution of the weight phenotypes throughout categories of sociodemographic and lifestyle variables (exposures) is shown in Table 3. When compared with MHNW, the proportion of individuals with MUNW phenotype was significantly higher in female sex, and rural residence, and tended to be higher in the oldest individuals (p-value=0.074). Similarly, in comparison with the MHNW, cases with MHO and MUO were significantly more prevalent in the oldest group, female sex, and less prevalent in people who smoke vs non-smoking (Table 3). In addition, there were more cases of MUO among people reporting physical activity, and with residence in rural areas. All the phenotypes in comparison with MHNW were significantly more prevalent among individuals with increased WC (Table 3).
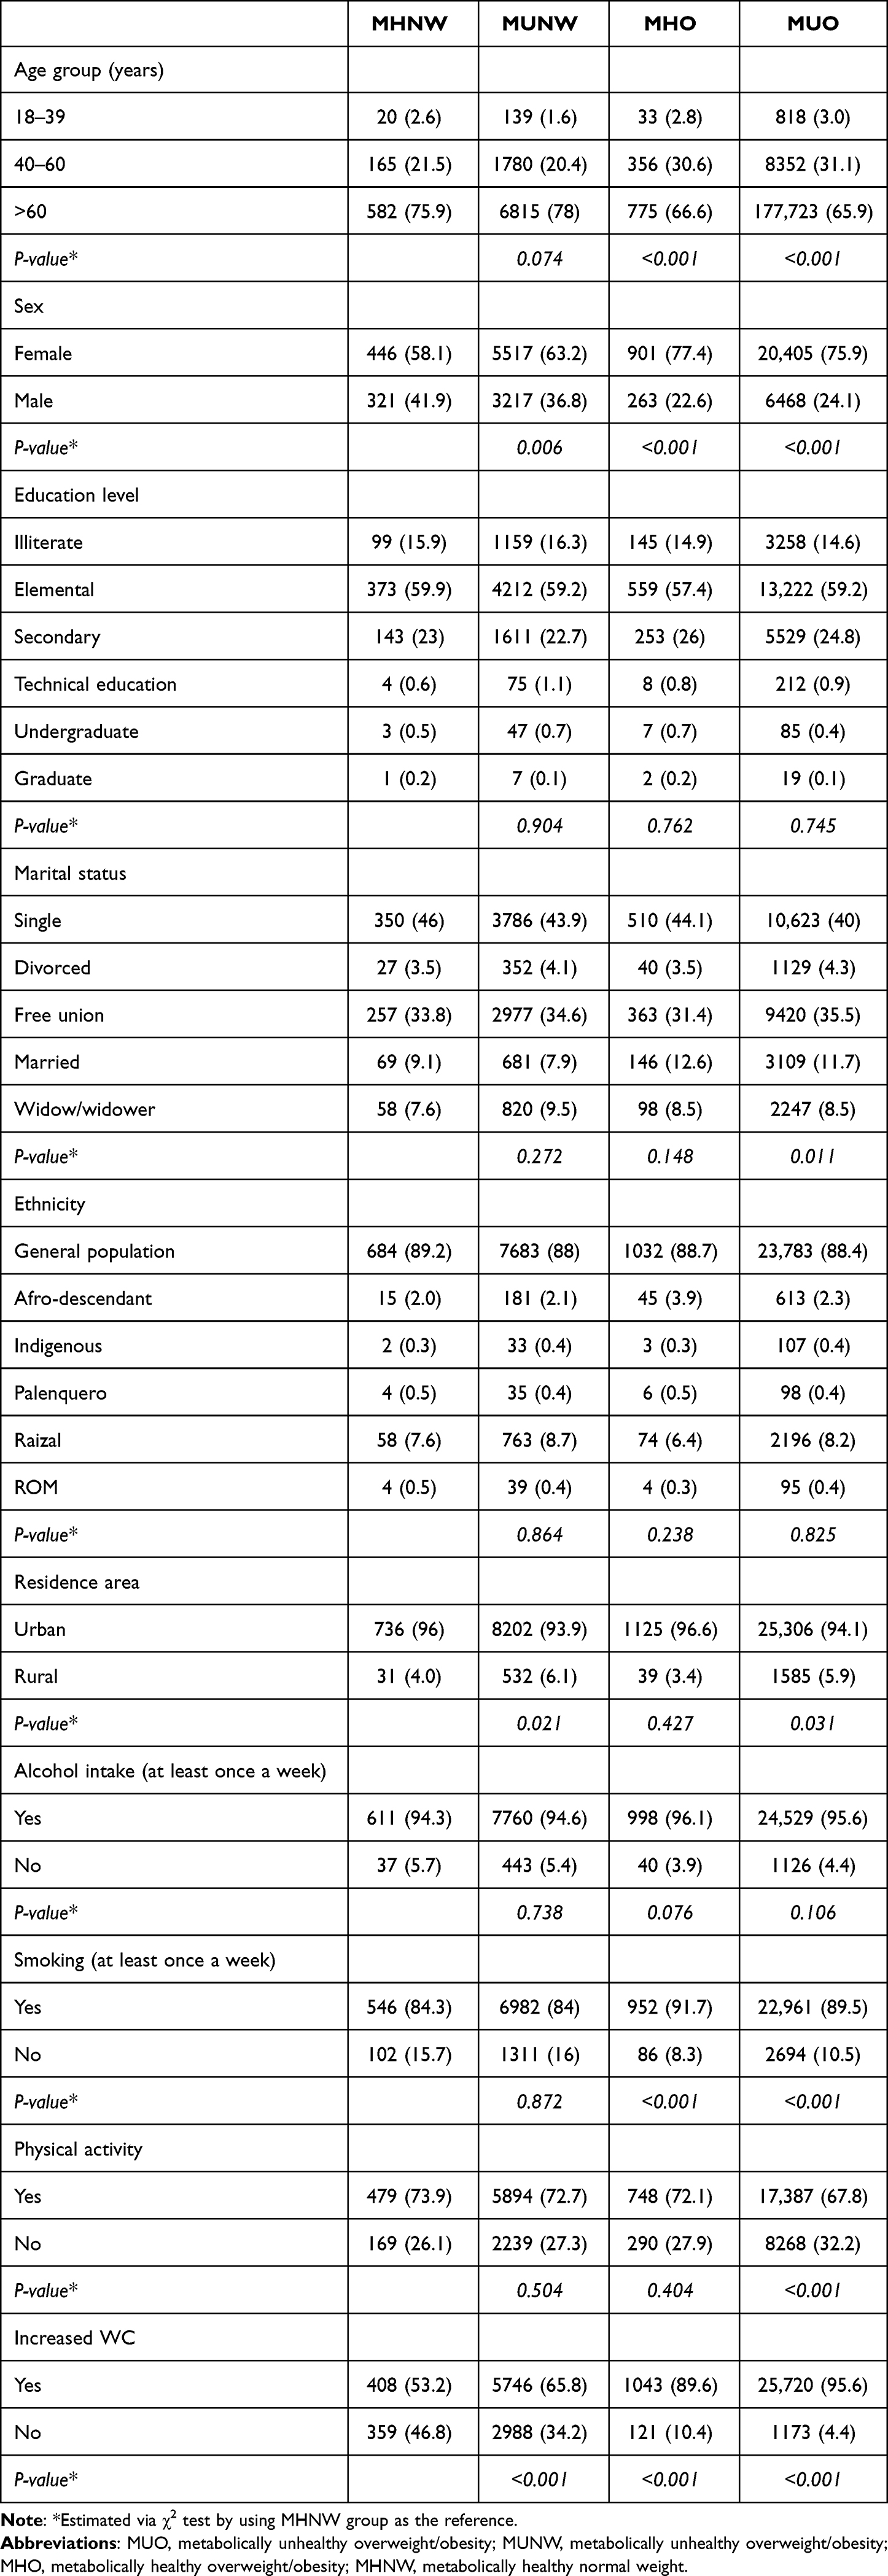 |
Table 3 Distribution of Cases [n (%)] with Weight Status Phenotypes Throughout Categories of Exposure Variables |
Table 4 describes multiple models with variables explaining MUNW, MHO, and MUO. Having a marital status of free union, residing in a rural area compared to an urban one, and having an increased WC were the variables that maintained their positive and significant association with MUNW in the final multivariable model. Being 60 years or older was also positively associated with MUNW in the final multivariable model but as a trend (p-value=0.068). Meanwhile, MHO and MUO had either positive or inverse determinants in their final models. As happened for MUNW, marital status involving conjugal union (married and/or free) and increased WC were positively associated with MHO and MUO, whereas for both overweight/obesity phenotypes being male was found to be a protective determinant. Smoking was inversely related to MHO, and the practice of physical activity increased the likelihood of MUO (Table 4).
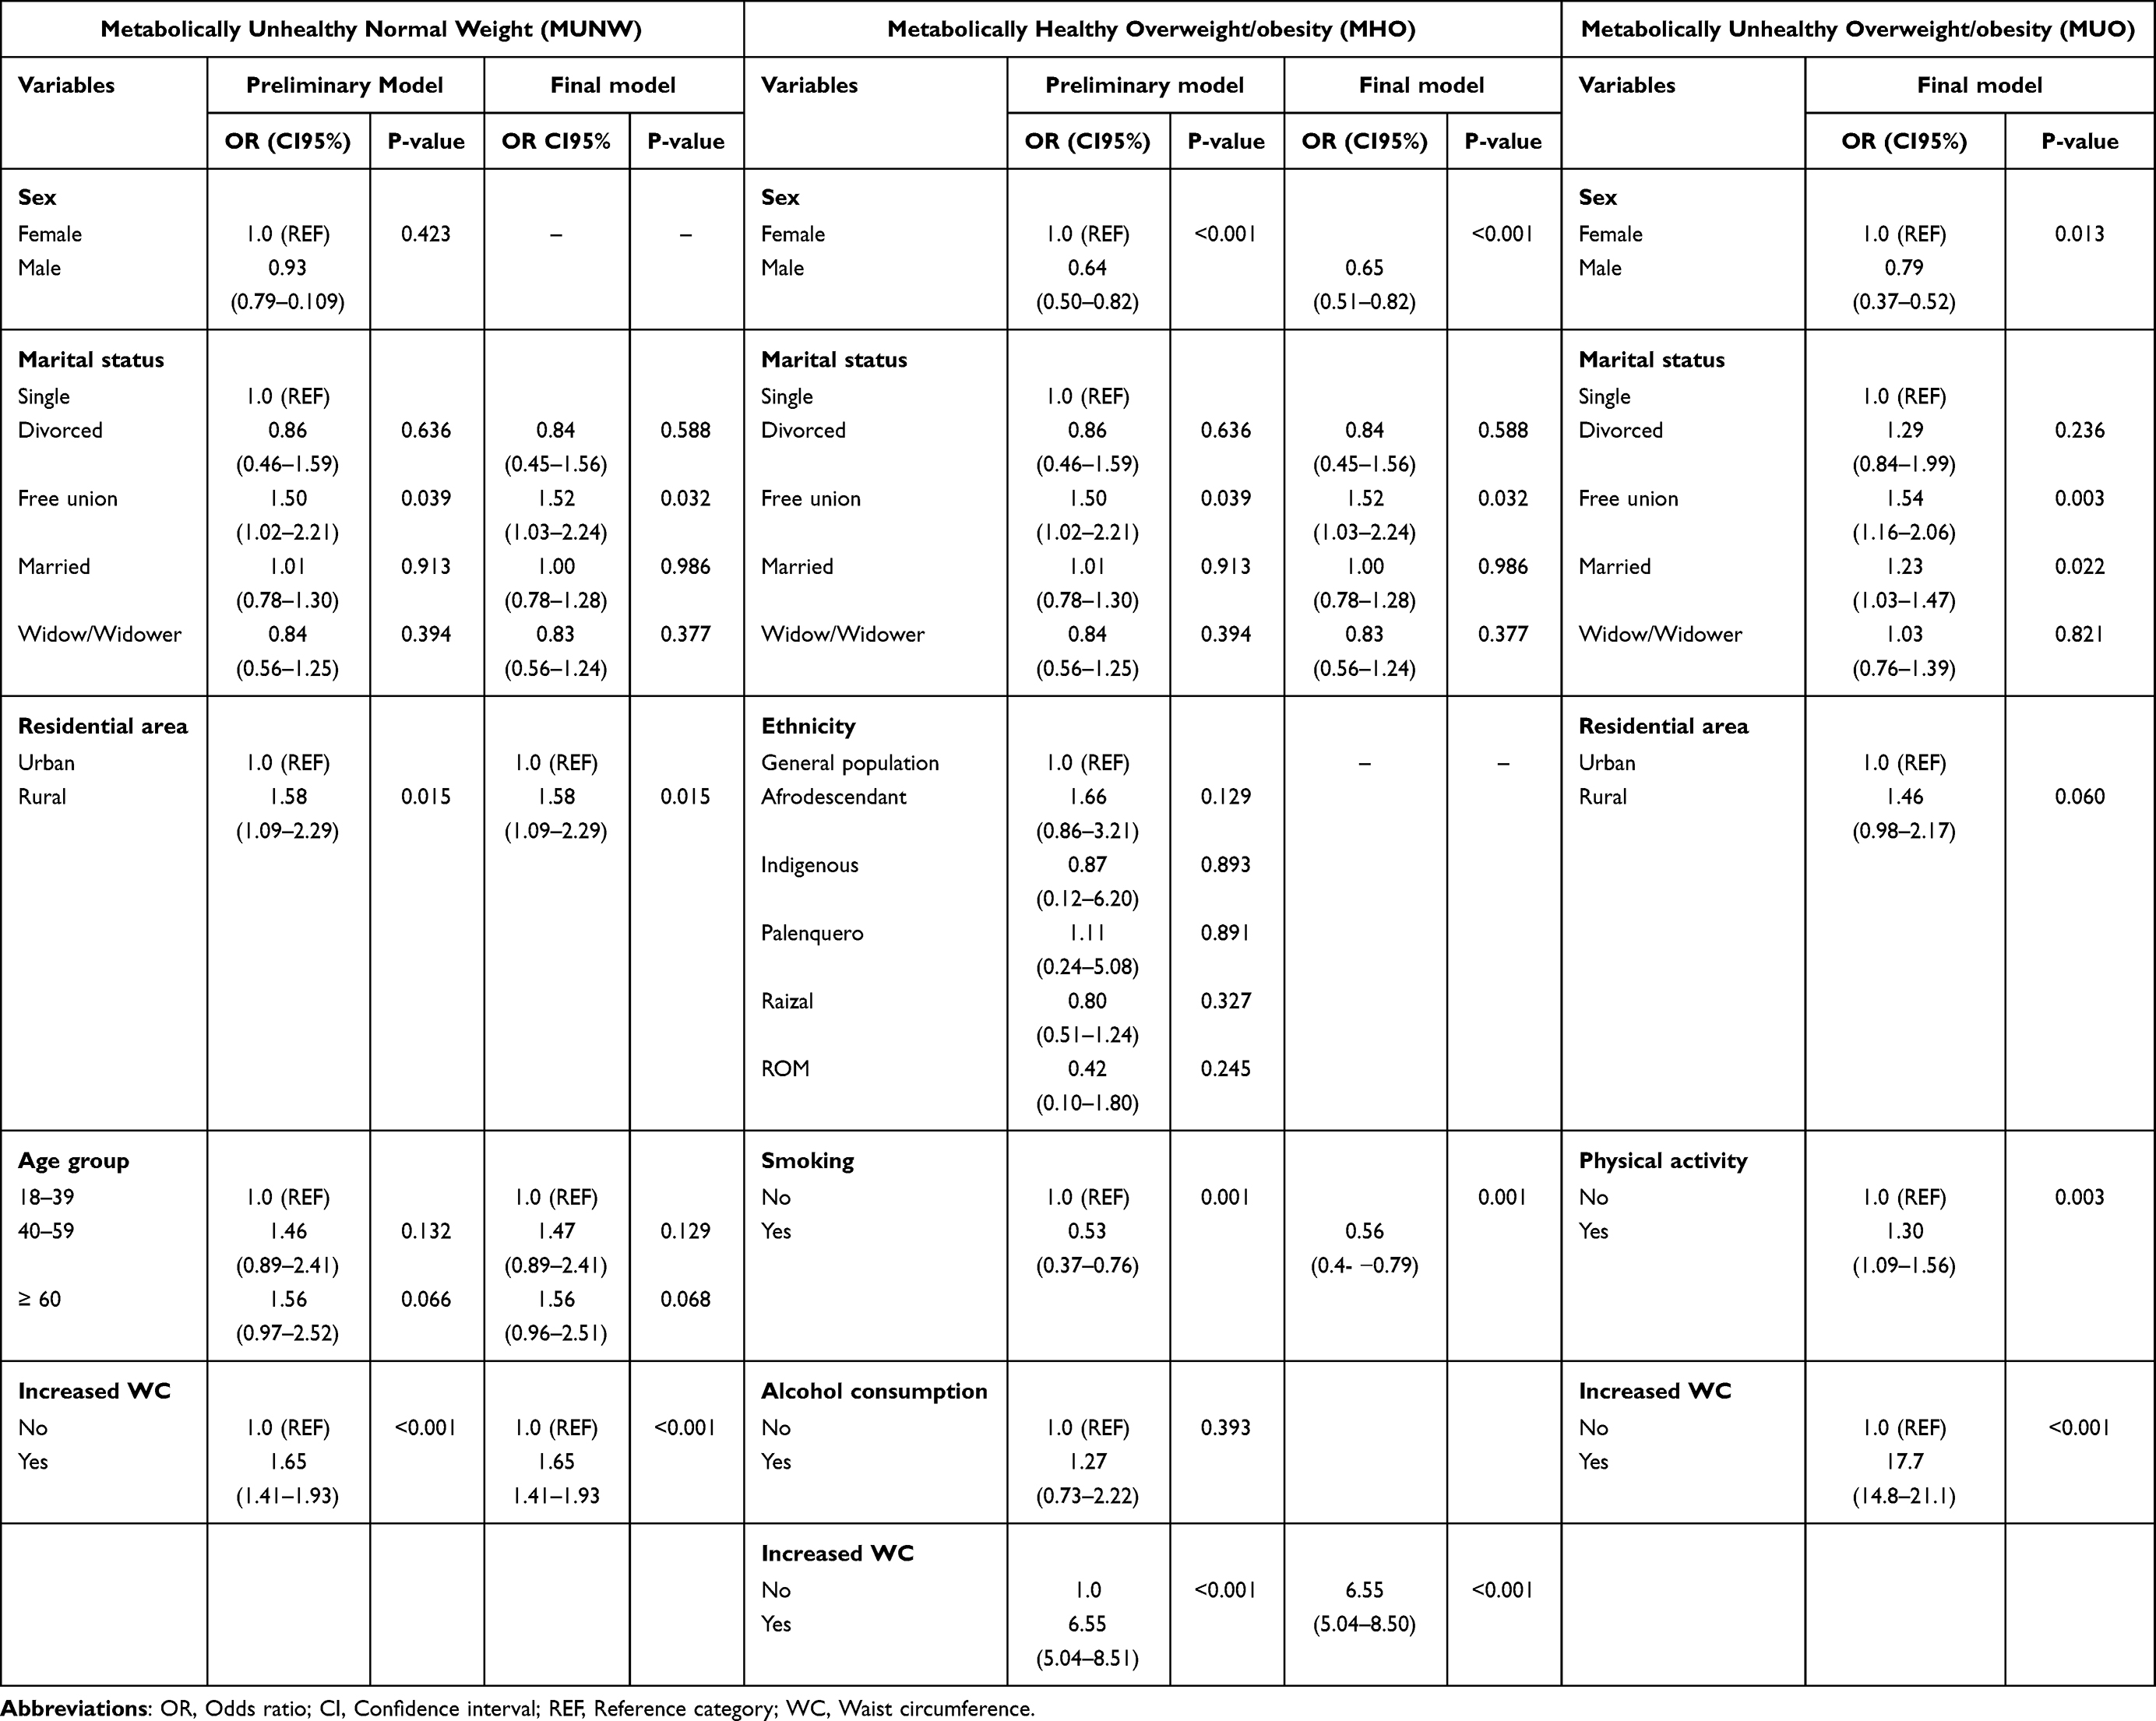 |
Table 4 Multivariable Models Explaining Each Weight Status Phenotype Compared to Metabolically Healthy Normal Weight (MHNW) |
Analyses by sex showed some differences in determinants of MUNW, MHO, and MUO (Supplemental Table S4). As occurred in the whole sample, in both men and women, increased WC was a significant associated factor for all three discordant phenotypes of weight status. Based on associated variables in the whole sample, for the case of MUNW, residence area was associated with women only, while age remained a significant predictor in men. Variables that did not reach final multiple models in the whole sample, were or tended to be associated with MHO or MUO in multiple models in a sex-specific way. Ethnicity was positively associated with MUO in women (ROM ethnic group vs general population) and men (Palenquero ethnic group vs general population) and with MHO only in men (Afro-descendant vs general population p-value=0.062). Marital status (free union vs single) tended to have an association with MHO in women. Particularly in women, alcohol intake was consistently found as a variable filtered in multiple models for all of the discordant phenotypes with a marginal statistical significance (P ≥ 0.05 and < 0.1) in the multiple models. Educational level was positively associated with MUO (secondary education vs illiterate) but this paradoxical relationship might be a chance finding.
Discussion
In the present analysis, it was found that approximately one in four individuals presented MUNW (23.3%). Concerning the other phenotypes or categories of metabolic condition, the MUO presented the highest proportion of cases with 71.6%, and to a lesser extent the MHO with 3.1% and the MHNW with 2%. Regarding variables associated with these phenotypes in multivariate analysis, age over 60 years, residence in a rural area, and high waist circumference were positively associated with MUNW. Being male was inversely associated with the MHO and MUO overweight phenotypes, while marital status was positively related to the opportunity to present them. Smoking habits and physical activity were paradoxically, inversely, and positively associated with MHO and MUO, respectively. Living in a rural area was additionally associated with MUO. Having an increased WC had strong positive associations with the opportunity to present all the phenotypes with metabolic alteration and/or overweight.
Studies on the estimation of MUNW have been mostly conducted in Asian populations, and the criteria for the definition of this phenotype are not consistent across the studies (Table 5).
 |
Table 5 Selected Studies on Metabolically Unhealthy Normal Weight (MUNW) |
Although BMI has been the reference to establish normal weight, some studies, as our analysis, excluded underweight individuals (BMI < 18.5)17,18,20–22,24,26 while other analyses used a broader classification based on <25 kg/mt2.16,23,25 One of the studies reviewed, conducted exclusively in people older than 60 years used a cut-off of BMI < 23 kg/mt2 for normal weight, because of recommended guidelines for older adults.19 Meanwhile, for the definition of metabolic obesity or unhealthy metabolic condition, previous research has mainly used the presence of metabolic syndrome (≥3 metabolic/clinical alterations) based on ATP III3,4,6,11 and IDF2,8 definitions. Other studies have implemented independent criteria, such as elevated HOMA-IR1 and C-reactive protein.5 We identified five studies that considered increased waist circumference as one of the possible criteria to establish metabolic unhealthy conditions16–19,21 (Table 5). Unlike the studies previously mentioned, we did not use increased waist circumference among possible criteria because we aimed to verify its association with MUNW and to confirm whether other factors were independently associated with MUNW in the presence of such a strong predictor of cardiometabolic risk in multiple models.
In the group of individuals studied, it was found a prevalence of 23% that is higher than that reported in most of the studies reviewed for this discussion, which describe prevalence estimates around 18%17–20,24,26 or much lower, below 10%.16,21,23,25 This discrepancy might be due to some methodological differences. We set a cut-off of ≥ 1 MetS criteria to establish metabolic obesity in normal weight, thus a cut-off of ≥3 MetS criteria may underestimate an unhealthy metabolic classification by accepting the presence of one or two criteria as a normal status of metabolic health. We also excluded underweight status because the opportunity to detect cardiometabolic alterations in the BMI range of underweight might be too low, and the presence of individuals with underweight may dilute cases with MUNW. Our prevalence of MUNW was comparable to that described by Park et al, 24.3% in the NHANNES population, and in that study underweight condition was excluded and the cut-off of MetS criteria for unhealthy metabolic classification was restricted to having two or more instead of three or more.22 Another potential explanation for our higher prevalence is the use of increased LDL-C levels as an additional criterion for unhealthy metabolic status. None of the reviewed studies included this dyslipidemia alteration because metabolic alterations to estimate MUNW have been regularly adopted from metabolic syndrome definitions which do not take into account LDL-C levels. Increased cholesterol or LDL-C levels are part of the Framingham Score for cardiovascular risk, and thus it represents a complementary criterion to detect people with atherogenic risk. We re-estimated the prevalence of MUNW in our sample without considering increased LDL-C as a metabolic abnormality criterion, and the proportion of MUNW minimally decreased to 20.8%, although it approximated to prevalence findings in population-based studies by Choi et al (18.3%) and Hajian –Tilaki et al (17.2%) in elderly Korean adults and adults from Northern Iran, respectively.19,24 Similarly, it seems that studies with elderly populations or that had a broader age range with old age individuals included, as our study, tend to report higher proportions of MUNW cases.19,22
Similar to our study, Zheng et al found an association between waist circumference and MUNW.26 In contrast, Hajian-Tilaki et al found no association between WC and MUNW, however, the sample of this study was much smaller (n=986).24 Regarding age, two studies found that the older, the greater the presence of MUNW.16,24 These studies included people older than 60 years, and none used different criteria for the classification of weight status in older adults. The age-MUNW association is consistent with the trend previously mentioned about the higher prevalence of MUNW in studies that included older individuals. Possible mechanisms could involve aging-related epigenetic changes that have been associated with traditional CVD risk factors in a cohort with a high prevalence of hypertension,27 and with endothelial alterations that interact with the development of cardiovascular disease such as arteriosclerosis.28
There was also an increased opportunity to present MUNW by being a resident of a rural area (vs urban area). In contrast, several studies have shown rural residence as a protective factor for cardiometabolic risk when compared to living in urban environments which are linked to higher physical inactivity and higher caloric intakes.29,30 Our positive association might be related to a local context of differences in access to services and health inequities in health. In Colombia, some authors have exposed the barriers that rural residents deal with such as long distances between health centers and homes, transportation problems, and the lack of primary and preventive care, in addition to the fact that some areas are vulnerable to armed conflict, which makes access difficult.31,32 In agreement with what was found in our analysis, a study in Colombia conducted by Ashner-Montoya found that individuals who lived in rural areas (vs urban areas) had 1.48 times higher odds (95% CI: 1.30–1.56) of presenting metabolic syndrome.33
Increased WC was a factor associated with MUNW and the other phenotypes, and it was the only non-sociodemographic or lifestyle variable that was used as an exposure variable in this analysis, not only to confirm its expectable relationship with MUNW but also to verify if other variables associated remained significantly associated in the presence of increased WC in the multiple models. Thus, age-MUNW and rural residence-MUNW relationships appear to be neither confounded nor mediated by increased waist circumference. Therefore, each variable in the model would have a different mechanism of relationship with MUNW. Particularly, increased WC is an indicator of visceral-type fat accumulation, which is found between the organs and digestive parts in the abdominal axis. This visceral fat has harmful biological properties based on its subclinical inflammatory effects that decrease the effect of insulin, predispose to dyslipidemia, and increase the risk of diabetes and cardiovascular disease.34,35
In the present study, subjects with MUNW showed a considerable prevalence of high waist circumference, 65%. The finding of high waist circumference as a variable positively associated with MUNW reinforces the concept that localized adiposity is a good predictor of cardio-metabolic risk. Several studies have reported waist circumference as a strong predictor of diabetes and cardiovascular disease independently of body mass index.36,37
The MHO phenotype has a very low prevalence in the sample of subjects analyzed (3.1%), which reinforces the concept that the trend for metabolic health in individuals with overweight or obesity is a rare event, and should be considered a transitory state towards the alteration of metabolic markers.9,10 Consistently, it was observed that MUO was the most prevalent phenotype, as it was highly likely that individuals with excess adiposity would have a negative metabolic profile. The sum of the overweight phenotypes prevalence in the analyzed population (74.7%) exceeds the global Colombian prevalence of 56.1% according to the National Survey of the Nutritional Situation 2015 (ENSIN 2015).38 However, the presence of middle-aged and older subjects included in the investigation predisposes to find more cases of overweight.39 In light of the above, the prevalence of MUNW is likely much higher in the Colombian general population in which normal weight is more prevalent than in individuals from the Metrosalud chronic disease prevention program.
The phenotypes related to a BMI≥25 (MHO and MUO) shared similar associations with the exposure variables of sex and marital status of common-law marriage. Previous studies have found married status positively associated with higher opportunity of obesity when compared with unmarried categories.40,41 Although the explanation for this relationship is still unclear, some hypotheses have been provided. One lays on the fact that unmarried people might prioritize physical activity and the control of their diet to look more attractive with the expectation of building couple relationships.40 Another reason is related to the stress-triggered weight loss effects in individuals who deal with separated/divorced status vs married status.40 In addition, married individuals cope with either work or domestic duties that limit their time for physical activity and predispose them to consume fast food/processed food-based diets. In the case of sex being a man compared to being a woman was associated with a 35% and 66% reduction in the chance of having MHO and MUO, respectively. This agrees with reports of a higher global prevalence of obesity in women than in men.42,43 In this pattern, gender inequalities and vulnerability conditions are involved.43 For instance, in Mexico, Araujo et al described gender inequities, in terms of high prevalence of hypertension, overweight, and increased WC in mothers who are heads of households from vulnerable sectors, compared to men of the same age (average 40 years) and with women from high socioeconomic status.44 However, the analysis of this study lacks proper variables to evaluate the vulnerability of the women in the sample.
Two lifestyle variables, smoking habit and physical activity presented presumably contradictory associations with phenotypes characterized by overweight. Smoking and its inverse relationship with MHO (OR 0.56 p-value = 0.001), initially could be seen as an unexpected finding, in terms that two risk factors for NCDs, smoking and overweight, are not aligned in a positive sense of association. However, this pattern has an epidemiological and biological background that supports it. Wang, in a population sample of 70,394 subjects from the Chinese Health and Nutrition Survey, found a lower chance of being overweight in smokers (−6.5%) and a 2.7% greater likelihood of being underweight in the same individuals, compared to non-smokers.45 Similarly, Jitnarim et al reported a significantly lower BMI in smokers vs non-smokers (21.6 kg/m2 vs 22.2 kg/m2) in 7858 Thai adults recruited from 17 provinces.46 However, when strong, moderate, and light smoking habits were compared within the group of smokers, a higher average BMI was found in those with a strong habit.46 Nicotine and its effect of increasing caloric expenditure could explain a lower weight in smokers.47 Meanwhile, the self-reported practice of physical activity also had a paradoxical positive association with the chance that an individual presented MUO. This paradoxical association might be explained by the fact that individuals affected by overweight and obesity reported more practice of physical activity to lose weight.
The sub-analysis by sex revealed only alcohol intake as a sex-specific associated factor for MUNW different from those factors described in the whole sample, and sex-specific associations between ethnicity and overweight/obesity phenotypes. In women, alcohol consumption was associated with a higher likelihood of having MUNW. The link between sex, alcohol, and cardiometabolic risk is still controversial. While some studies report higher odds of cardiovascular disease risk by alcohol intake in men,48 others have found this in women,49 and others describe significant risk in both sexes.50 The conflicting findings also arise in terms of frequency of alcohol consumption, with suggestions of moderate intake protective factor for cardiometabolic risk48,51 vs observations on the harmfulness of either moderate or heavy intakes of alcohol for cardiovascular health.50 Our finding needs to be interpreted with caution given that no structured questionnaires were used to estimate alcohol consumption habits. Similarly, differences by sex might be attributed to residual confounding in terms of covariates not measured or available in this analysis. There were also particular associations between a few ethnic groups and obesity/overweight phenotypes. It is unclear why ROM ethnicity was a significant determinant of MHO only in women, and Palenquero/Afro-descendant groups increased the opportunity to present MUO only in men. However, these findings altogether are consistent with previous studies reporting a higher risk of cardiometabolic disease in ethnic minority groups.52,53 Although genetic factors might be implied in differences by ethnicity in cardiometabolic risk,54 vulnerability, and social marginalization seem to be strong determinants in this relationship.55
Strengths and weaknesses
One of the strengths of this study is that it appears to be the first to be carried out in a Latin-American population on the characterization of MUNW and other metabolic phenotypes, and it serves as a baseline for future research. Likewise, a robust sample size was used and multiple associated factors were evaluated, and the independence of these factors was explored in a multivariate analysis. On the other hand, the analysis also presents weaknesses that should be highlighted. First, the information collected on lifestyle variables such as smoking, alcohol consumption, and physical activity was not based on structured questionnaires with international validity, but rather based on general frequency questions in the last month. Second, the findings of this analysis cannot be easily extrapolated to the general population since the sample was users of a program for the prevention and management of chronic diseases, in which young individuals are underrepresented. In terms of relative comparison with women in the sample, male sex individuals (27%) might also have been underrepresented and this could have influenced protective associations with MHO, MUO, and MUNW. Nevertheless, our large sample of 10,269 men might have attenuated this potential limitation. Another limitation is the multi-testing nature of univariate and multivariate analyses to find determinants of the outcome variables, which can lead to chance findings. Another limitation was the lack of information on socioeconomic status to explore inequities. Similarly, aggregate information on medications was not available and this variable may have helped complement dyslipidemia-related criteria and increased blood pressure criterion.
Conclusions
Almost a quarter (23.3%) of the population analyzed presents the metabolically discordant metabolically Obese normal weight (MUNW) phenotype. The sum of the two phenotypes with BMI ≥ 25 (MHO and MUO) show a prevalence of overweight of 74.7% of the total sample, indicating that only the 2% represented presented an ideal state for NCD prevention goals. The rural area of residence and being older than 60 years (as a trend) were associated with presenting MUNW. Being a man reduces the opportunity to present the MHO and MUO phenotypes. The age-MUNW and rural residence-MUNW relationships appear to be neither confounded nor mediated by increased waist circumference. Increased waist circumference, as expected, was a variable consistently associated with overweight phenotypes, but its association with MUNW reaffirms the high relevance of localized fat, particularly visceral fat, in cardiometabolic risk beyond general adiposity.
Future studies should be carried out in the general population to corroborate the findings of our study. Likewise, research should be carried out that describes, through relevant methodologies, to what extent metabolic alterations are not being detected in individuals with a normal BMI in the current Colombian health system, and whether the measure of waist circumference is being used in clinical practice routine.
Data Sharing Statement
The datasets used and/or analyzed during the current study are available from the corresponding author upon reasonable request.
Ethics Approval and Consent to Participate
The study applied the guidelines of the Declaration of Helsinki and Resolution 8430 of the Colombian Ministry of Health, which state that this is a risk-free investigation. The participating institutions were endorsed, and the project was endorsed by the scientific committee of Metrosalud. The information was collected based on medical records; therefore, informed consent was not obtained.
Author Contributions
All authors made a significant contribution to the work reported, whether that is in the conception, study design, execution, acquisition of data, analysis and interpretation, or in all these areas; took part in drafting, revising or critically reviewing the article; gave final approval of the version to be published; have agreed on the journal to which the article has been submitted; and agree to be accountable for all aspects of the work.
Disclosure
The authors declare that they have no competing interests in this work.
References
1. Meldrum DR, Morris MA, Gambone JC. Obesity pandemic: causes, consequences, and solutions-but do we have the will? Fertil Steril. 2017;107(4):833–839. doi:10.1016/j.fertnstert.2017.02.104
2. Roth J, Qiang X, Marbán SL, et al. The obesity pandemic: where have we been and where are we going? Obes Res. 2004;12(S11):88S–101S. doi:10.1038/oby.2004.273
3. Ellulu MS, Patimah I, Khaza’ai H, et al. Obesity and inflammation: the linking mechanism and the complications. Arch Med Sci. 2017;13(4):851–863. doi:10.5114/aoms.2016.58928
4. Vecchié A, Dallegri F, Carbone F, et al. Obesity phenotypes and their paradoxical association with cardiovascular diseases. Eur J Intern Med. 2018;48:6–17. doi:10.1016/j.ejim.2017.10.020
5. Schulze MB. Metabolic health in normal-weight and obese individuals. Diabetologia. 2019;62(4):558–566. doi:10.1007/s00125-018-4787-8
6. Hansen L, Netterstrøm MK, Johansen NB, et al. Metabolically healthy obesity and ischemic heart disease: a 10-year follow-up of the Inter99 study. J Clin Endocrinol Metab. 2017;102(6):1934–1942. doi:10.1210/jc.2016-3346
7. Aung K, Lorenzo C, Hinojosa MA, et al. Risk of developing diabetes and cardiovascular disease in metabolically unhealthy normal-weight and metabolically healthy obese individuals. J Clin Endocrinol Metab. 2014;99(2):462–468. doi:10.1210/jc.2013-2832
8. Jung CH, Lee MJ, Kang YM, et al. The risk of incident type 2 diabetes in a Korean metabolically healthy obese population: the role of systemic inflammation. J Clin Endocrinol Metab. 2015;100(3):934–941. doi:10.1210/jc.2014-3885
9. Stefan N, Häring HU, Hu FB, et al. Metabolically healthy obesity: epidemiology, mechanisms, and clinical implications. Lancet Diabetes Endocrinol. 2013;1(2):152–162. doi:10.1016/S2213-8587(13)70062-7
10. Smith GI, Mittendorfer B, Klein S. Metabolically healthy obesity: facts and fantasies. J Clin Invest. 2019;129(10):3978–3989. doi:10.1172/JCI129186
11. Park JM, Park DH, Song Y, et al. Understanding the genetic architecture of the metabolically unhealthy normal weight and metabolically healthy obese phenotypes in a Korean population. Sci Rep. 2021;11(1):1–8. doi:10.1038/s41598-020-79139-8
12. Jimenez-Mora MA, Nieves-Barreto LD, Montano-Rodriguez A, et al. Association of overweight, obesity and abdominal obesity with socioeconomic status and educational level in Colombia. Diabetes, Metab Syndr Obes Targets Ther. 2020;13:1887. doi:10.2147/DMSO.S244761
13. Abellan MV, Sandoval NB, Dolly VA, et al. Dietary patterns in Colombia: an exploratory and confirmatory factor analysis. Front Food Sci Technol. 2022;2022:5.
14. Alberti KG, Eckel RH, Grundy SM, et al. Harmonizing the metabolic syndrome: a joint interim statement of the international diabetes federation task force on epidemiology and prevention; national heart, lung, and blood institute; American heart association; world heart federation; international atherosclerosis society; and international association for the study of obesity. Circulation. 2009;120(16):1640–1645. doi:10.1161/CIRCULATIONAHA.109.192644
15. Grundy SM, Cleeman JI, Merz CNB, et al. Implications of recent clinical trials for the national cholesterol education program adult treatment panel III guidelines. Circulation. 2004;110(2):227–239. doi:10.1161/01.CIR.0000133317.49796.0E
16. Lee K. Metabolically obese but normal weight (MONW) and metabolically healthy but obese (MHO) phenotypes in Koreans: characteristics and health behaviors. Asia Pac J Clin Nutr. 2009;18(2):280–284.
17. Lee S, Ha H, Park Y, et al. Identifying metabolically obese but normal‐weight (MONW) individuals in a nondiabetic Korean population: the Chungju Metabolic disease Cohort (CMC) study. Clin Endocrinol. 2011;75(4):475–481. doi:10.1111/j.1365-2265.2011.04085.x
18. Choi J, Se-Young O, Lee D, et al. Characteristics of diet patterns in metabolically obese, normal weight adults (Korean National Health and Nutrition Examination Survey III, 2005). Nutr, Metab Cardiovasc Dis. 2012;22(7):567–574. doi:10.1016/j.numecd.2010.09.001
19. Choi KM, Cho HJ, Choi HY, et al. Higher mortality in metabolically obese normal‐weight people than in metabolically healthy obese subjects in elderly Koreans. Clin Endocrinol. 2013;79(3):364–370. doi:10.1111/cen.12154
20. Kim M, Paik JK, Kang R, et al. Increased oxidative stress in normal-weight postmenopausal women with metabolic syndrome compared with metabolically healthy overweight/obese individuals. Metabolism. 2013;62(4):554–560. doi:10.1016/j.metabol.2012.10.006
21. Yoo HJ, Hwang SY, Hong HC, et al. Association of metabolically abnormal but normal weight (MANW) and metabolically healthy but obese (MHO) individuals with arterial stiffness and carotid atherosclerosis. Atherosclerosis. 2014;234(1):218–223. doi:10.1016/j.atherosclerosis.2014.02.033
22. Park YMM, Fung TT, Steck SE, et al. Diet quality and mortality risk in metabolically obese normal-weight adults. En Elsevier. 2016;2016:1372–1383.
23. Zhang Y, Fu J, Yang S, et al. Prevalence of metabolically obese but normal weight (MONW) and metabolically healthy but obese (MHO) in Chinese Beijing urban subjects. Biosci Trends. 2017;11(4):418–426. doi:10.5582/bst.2017.01016
24. Hajian-Tilaki K, Heidari B. Metabolically healthy obese and unhealthy normal weight in Iranian adult population: prevalence and the associated factors. Diabetes Metab Syndr Clin Res Rev. 2018;12(2):129–134. doi:10.1016/j.dsx.2017.11.005
25. Buscemi S, Chiarello P, Buscemi C, et al. Characterization of metabolically healthy obese people and metabolically unhealthy normal-weight people in a general population cohort of the ABCD study. J Diabetes Res. 2017;2017:1–9. doi:10.1155/2017/9294038
26. Zheng Q, Lin W, Liu C, et al. Prevalence and epidemiological determinants of metabolically obese but normal-weight in Chinese population. BMC Public Health. 2020;20(1):1–10. doi:10.1186/s12889-020-08630-8
27. Ammous F, Zhao W, Ratliff SM, et al. Epigenetic age acceleration is associated with cardiometabolic risk factors and clinical cardiovascular disease risk scores in African Americans. Clin Clin Epigenet. 2021;13(1):1–13. doi:10.1186/s13148-021-01035-3
28. Zhang W, Song M, Qu J, et al. Epigenetic modifications in cardiovascular aging and diseases. Circ Res. 2018;123(7):773–786. doi:10.1161/CIRCRESAHA.118.312497
29. Daniel M, Carroll SJ, Niyonsenga T, et al. Concurrent assessment of urban environment and cardiometabolic risk over 10 years in a middle‐aged population‐based cohort. Geogr Res. 2019;57(1):98–110. doi:10.1111/1745-5871.12318
30. Obirikorang C, Osakunor DNM, Anto EO, et al. Obesity and cardio-metabolic risk factors in an urban and rural population in the Ashanti Region-Ghana: a comparative cross-sectional study. PLoS One. 2015;10(6):e0129494. doi:10.1371/journal.pone.0129494
31. Tovar-Cuevas LM, Arrivillaga-Quintero M. State of the art in access to health services research in Colombia, 2000–2013: a systematic review/Estado del arte de la investigacion en acceso a los servicios de salud en Colombia, 2000–2013: revision sistematica critica/Estado da arte da pesquisa em acesso aos servicos de saude na Colombia, 2000–2013: revisao sistematica critica. Rev Gerenc Polit Salud. 2014;2014:12–27.
32. Valenzuela-Fuenagan PA, Mejía-Ortega LM. Access to health services for people with disabilities: the case of a Foundation in Nariño-Colombia-2017. Rev Fac Nac Salud Pública. 2021;39:1.
33. Aschner-Montoya P. metabolic syndrome in a rural and an urban population in the colombian region of the Andes. Rev Med. 2007;15(2):154–162.
34. Brunzell JD, Hokanson JE. Dyslipidemia of central obesity and insulin resistance. Diabetes Care. 1999;22:C10.
35. Gower BA, Nagy TR, Goran MI. Visceral fat, insulin sensitivity, and lipids in prepubertal children. Diabetes. 1999;48(8):1515–1521. doi:10.2337/diabetes.48.8.1515
36. Olson KL, Neiberg RH, Espeland MA, et al. Waist circumference change during intensive lifestyle intervention and cardiovascular morbidity and mortality in the Look AHEAD Trial. Obesity. 2020;28(10):1902–1911. doi:10.1002/oby.22942
37. Nair N, Vittinghoff E, Pletcher MJ, et al. Associations of body mass index and waist circumference in young adulthood with later life incident diabetes. J Clin Endocrinol Metab. 2021;106(12):e5011–20. doi:10.1210/clinem/dgab551
38. ICBF. Encuesta Nacional de la Situación Nutricional en Colombia (ENSIN): Instituto Nacional de Salud, Instituto Colombiano de Bienestar Familiar. Colombia: Bogotá; 2010.
39. Marques A, Peralta M, Naia A, et al. Prevalence of adult overweight and obesity in 20 European countries, 2014. Eur J Public Health. 2018;28(2):295–300. doi:10.1093/eurpub/ckx143
40. Lee J, Shin A, Cho S, et al. Marital status and the prevalence of obesity in a Korean population. Obes Res Clin Pract. 2020;14(3):217–224. doi:10.1016/j.orcp.2020.04.003
41. Tzotzas T, Vlahavas G, Papadopoulou SK, et al. Marital status and educational level associated to obesity in Greek adults: data from the National Epidemiological Survey. BMC Public Health. 2010;10(1):1–8. doi:10.1186/1471-2458-10-732
42. Cooper AJ, Gupta SR, Moustafa AF, et al. Sex/gender differences in obesity prevalence, comorbidities, and treatment. Curr Obes Rep. 2021;10(1):1–9. doi:10.1007/s13679-020-00419-5
43. Traissac P, El Ati J, Gartner A, et al. Gender inequalities in excess adiposity and anaemia combine in a large double burden of malnutrition gap detrimental to women in an urban area in North Africa. Public Health Nutr. 2016;19(8):1428–1437. doi:10.1017/S1368980016000689
44. Araujo-Contreras JM, Rivas-Avila E, Avila-Rodríguez A, et al. Relationship between arterial hypertension and central obesity in mothers. CienciaUAT. 2015;9(2):53–58. doi:10.29059/cienciauat.v9i2.534
45. Wang Q. Smoking and body weight: evidence from China health and nutrition survey. BMC Public Health. 2015;15(1):1–8. doi:10.1186/s12889-015-2549-9
46. Jitnarin N, Kosulwat V, Rojroongwasinkul N, et al. The relationship between smoking, body weight, body mass index, and dietary intake among Thai adults: results of the national Thai food consumption survey. Asia Pac J Public Health. 2014;26(5):481–493. doi:10.1177/1010539511426473
47. Chiolero A, Faeh D, Paccaud F, et al. Consequences of smoking for body weight, body fat distribution, and insulin resistance. Am J Clin Nutr. 2008;87(4):801–809. doi:10.1093/ajcn/87.4.801
48. Onat A, Hergenç G, Kucukdurmaz Z, et al. Moderate and heavy alcohol consumption among Turks: long-term impact on mortality and cardiometabolic risk. Turk Kardiyol Dern Ars. 2009;37(2):83–90.
49. Zheng YL, Lian F, Shi Q, et al. Alcohol intake and associated risk of major cardiovascular outcomes in women compared with men: a systematic review and meta-analysis of prospective observational studies. BMC Public Health. 2015;15(1):1–11. doi:10.1186/s12889-015-2081-y
50. Lankester J, Zanetti D, Ingelsson E, et al. Alcohol use and cardiometabolic risk in the UK Biobank: a Mendelian randomization study. PLoS One. 2021;16(8):e0255801. doi:10.1371/journal.pone.0255801
51. O’neill D, Britton A, Hannah MK, et al. Association of longitudinal alcohol consumption trajectories with coronary heart disease: a meta-analysis of six cohort studies using individual participant data. BMC Med. 2018;16(1):1–13. doi:10.1186/s12916-018-1123-6
52. El Fakiri F, Bruijnzeels MA, Foets MM, et al. Different distribution of cardiovascular risk factors according to ethnicity: a study in a high risk population. J Immigr Minor Health. 2008;10(6):559–565. doi:10.1007/s10903-008-9144-4
53. LaRosa JC, Brown CD. Cardiovascular risk factors in minorities. Am J Med. 2005;118(12):1314–1322. doi:10.1016/j.amjmed.2005.04.041
54. Graille V, Ferrieres J, Evans A, et al. Associations between classical cardiovascular risk factors and coronary artery disease in two countries at contrasting risk for myocardial infarction: the PRIME Study. Int J Cardiol. 2000;74(2–3):191–198. doi:10.1016/S0167-5273(00)00283-7
55. Nazroo JY. Genetic, cultural or socio‐economic vulnerability? Explaining ethnic inequalities in health. Sociol Health Illn. 1998;20(5):710–730. doi:10.1111/1467-9566.00126
 © 2024 The Author(s). This work is published and licensed by Dove Medical Press Limited. The
full terms of this license are available at https://www.dovepress.com/terms
and incorporate the Creative Commons Attribution
- Non Commercial (unported, 3.0) License.
By accessing the work you hereby accept the Terms. Non-commercial uses of the work are permitted
without any further permission from Dove Medical Press Limited, provided the work is properly
attributed. For permission for commercial use of this work, please see paragraphs 4.2 and 5 of our Terms.
© 2024 The Author(s). This work is published and licensed by Dove Medical Press Limited. The
full terms of this license are available at https://www.dovepress.com/terms
and incorporate the Creative Commons Attribution
- Non Commercial (unported, 3.0) License.
By accessing the work you hereby accept the Terms. Non-commercial uses of the work are permitted
without any further permission from Dove Medical Press Limited, provided the work is properly
attributed. For permission for commercial use of this work, please see paragraphs 4.2 and 5 of our Terms.
Recommended articles
Comparison of Incidence of Metabolic Syndrome and Five Obesity- and Lipid-Linked Indicators for Predicting Metabolic Syndrome Among Normal-Weight and Overweight Adults
Wu J, Lin X, Yin X, Xu Z, Wu N, Zhang Z, Zhou J, Li H
Diabetes, Metabolic Syndrome and Obesity 2024, 17:3509-3520
Published Date: 20 September 2024
Clinical Patterns of Metabolic Syndrome in First-Hospitalized Major Depressive Disorder Patients: Comparison of Antidepressant-Exposed and Drug-Naïve Groups
Wang S, Zhang L, Wu Y, Ma J
Neuropsychiatric Disease and Treatment 2024, 20:2159-2168
Published Date: 14 November 2024
Prevalence and Clinically Related Factors of Hypertriglyceridemia in Patients with Bipolar Disorder in Anhui Province, China
Li J, Lei W, Wang Y, Wu Q
Diabetes, Metabolic Syndrome and Obesity 2025, 18:2695-2705
Published Date: 7 August 2025
Low-Level Viremia as an Independent Risk Factor for Metabolic Syndrome in People Living with HIV Receiving Antiretroviral Therapy: A 6-Year Retrospective Cohort Study
Wang Z, Jin Y, Qian G
Infection and Drug Resistance 2025, 18:5627-5642
Published Date: 30 October 2025
Metabolic Risk Factors Evaluation of Obstructive Sleep Apnea Among Patients with Polycystic Ovary Syndrome
Ha LX, Wang JJ, Yuan YY, Liu H, Yang J
International Journal of Women's Health 2025, 17:4423-4433
Published Date: 13 November 2025