")
Back to Journals » Infection and Drug Resistance » Volume 12
Metabolic mechanism of ceftazidime resistance in Vibrio alginolyticus
Authors Liu SR , Peng XX, Li H
Received 10 July 2018
Accepted for publication 4 January 2019
Published 13 February 2019 Volume 2019:12 Pages 417—429
DOI https://doi.org/10.2147/IDR.S179639
Checked for plagiarism Yes
Review by Single anonymous peer review
Peer reviewer comments 4
Editor who approved publication: Dr Eric Nulens
Shi-Rao Liu,1 Xuan-Xian Peng,1,2 Hui Li1
1Center for Proteomics and Metabolomics, State Key Laboratory of Biocontrol, Guangdong Province Key Laboratory for Pharmaceutical Functional Genes, School of Life Sciences, Sun Yat-sen University, University City, Guangzhou 510006, People’s Republic of China; 2Laboratory for Marine Fisheries Science and Food Production Processes, Qingdao National Laboratory for Marine Science and Technology, Qingdao 266071, People’s Republic of China
Background: Microbial metabolism confounds antibiotic efficacy. However, information regarding effect of metabolism on cephalosporin antibiotics-mediated killing and Vibrio spp is largely absence, although the drugs are widely used in clinic and the bacteria are pathogens to both human and aquaculture animals.
Purpose: This study explores the metabolome of cephalosporin antibiotic-resistant Vibrio alginolyticus and analyzes the role of bacterial metabolism in drug and multidrug-resistance.
Results: The metabolomes of isogenic ceftazidime-resistant V. alginolyticus (VA-RCAZ) and ceftazidime-sensitive V. alginolyticus (VA-S) were analyzed using gas chromatography -mass spectrometry. The metabolome of VA-RCAZ is characterized by inefficient respiration, an inefficient pyruvate cycle (P cycle), increased biosynthesis of fatty acids and decreased membrane proton motive force. This hypothesis was confirmed by the fact that furfural and malonate, inhibitors of pyruvate dehydrogenase and succinate dehydrogenase (P cycle enzymes), respectively, increased resistance of VA-RCAZ to antibiotics, while exposure to triclosan, to inhibit biosynthesis of fatty acids, decreased resistance.
Conclusion: These results contribute to our understanding of mechanisms of bacterial antibiotic-resistance and may lead to more effective approaches to treat, manage or prevent infections caused by antibiotic-resistant pathogens including those of the Vibrio species.
Keywords: antibiotic resistance, cephalosporin, central carbon metabolism, pyruvate cycle, biosynthesis of fatty acids, metabolomics
Introduction
Pathogenic Vibrio species cause intestinal disease in humans and systemic disease in fish and shrimp. The most common pathogenic Vibrio strains are Vibrio alginolyticus, V. parahaemolyticus, V. vulnificus, and V. cholera, which cause cholera.1–4 Diseases caused by Vibrio pathogens have been treated or prevented with antibiotic drugs, with tremendous benefit to human health and animal breeding. However, widespread use, as well as misuse and/or inappropriate use of antibiotic therapy have promoted emergence and rapid spread of antibiotic-resistant species of Vibrio and other pathogens.5–8 Some Vibrio species develop multidrug resistance, and are no longer susceptible to ampicillin, cefotaxime, tetracycline, and chloramphenicol,9,10 posing a major challenge for health practitioners and a huge threat to human health. The process of developing new pharmaceutical agents to control antibiotic-resistant pathogens is slow and not a viable approach to manage the growing epidemic of multidrug-resistant infectious diseases,11,12 which are already a major global public health concern.13 Therefore, further understanding of antibiotic resistance mechanisms for control of these antibiotic-resistant pathogens is an important scientific issue.
Ongoing research demonstrates several mechanisms by which Vibrio and other bacterial species develop antibiotic resistance, including mutation, acquisition of resistance-conferring plasmids/episomes, modification or degradation of target sites, altered drug uptake/altered membrane permeability, and induction or upregulation of drug efflux.14–18 Recently, metabolic mechanisms have been revealed as a characteristic feature of antibiotic resistance in bacteria.19–24 For example, the abundance of glucose, glutamate, alanine, and fructose is greatly suppressed in kanamycin-resistant Edwardsiella tarda as determined by gas chromatography–mass spectrometry (GC-MS)-based metabolomics.19 Exposure to exogenous glucose, glutamate, alanine, or fructose restored susceptibility of multidrug-resistant bacteria including Edwardsiella tarda, Escherichia coli, V. parahaemolyticus, Klebsiella pneumoniae, Pseudomonas aeruginosa, and Staphylococcus aureus to kanamycin.19,21,22 The mechanism underlying this approach is that these metabolites promote the pyruvate cycle (P cycle), a previous unknown cycle that provides energy for bacteria,22 by substrate activation, which in turn increases production of nicotinamide adenine dinucleotide (NADH) and proton motive force (PMF) and stimulates uptake of antibiotic.22
Here we analyzed the metabolome of ceftazidime (CAZ)-susceptible and -resistant V. alginolyticus (VA-S and VA-RCAZ, respectively) focusing on carbon, energy metabolism, and fatty acid biosynthesis, which appear to be altered in CAZ-resistant V. alginolyticus. Metabolic changes were validated using gene deletion mutants and measurement of enzyme activity. Finally, the effect of inhibitors targeting fatty acid biosynthesis or the P cycle on CAZ resistance was analyzed. These findings indicate that the inefficient P cycle and increased fatty acid biosynthesis promote resistance to CAZ in V. alginolyticus. These results increase our understanding of antibiotic resistance and the role of bacterial metabolism. They may also provide tools and/or knowledge for future new strategies to stop infections by multidrug-resistant human pathogens.
Materials and methods
Bacterial strains and culture conditions
The bacterial strain, V. alginolyticus V12G01, used in this study came from a collection of our laboratory. V. alginolyticus V12G01 was subcultured in Luria–Bertani (LB) medium with or without 1/2 minimum inhibitory concentration (MIC) of CAZ (0.1 µg/mL) for serial passages, which led to generation of 16 MIC CAZ-resistant V. alginolyticus (VA-RCAZ) and control (VA-S), respectively. A single colony was propagated in 3% NaCl LB (tryptone 10 g/L, yeast extract 5 g/L, NaCl 30 g/L) broth for 8 hours at 30°C. The cultures were diluted to 1:100 using fresh 3% NaCl LB medium and grown at 30°C. For growth curve, OD600 of the bacterial cultures was measured at the indicated time. For effect of carbon sources on bacterial growth, OD600 of the bacterial cultures was measured at 10 hours in medium with the indicated concentration of glucose, xylitol, fructose, sucrose, mannose, or maltose. Glucose, xylitol, fructose, and maltose were purchased from Sigma-Aldrich, and sucrose and mannose were provided by Sangon Biotech. At least three biologic replicates were performed.
Measurement of MIC
Measurement of MIC was performed as previously described.25 In brief, CAZ (Guangzhou Qiyun Biological Technology) was twofold serial diluted with LB broth ranging from 0.05 to 100 μg/mL CAZ. Ninety microliters of LB containing CAZ and 10 µL of logarithmic phase cells (107 colony-forming units [CFU]/mL) of VA-S or VA-RCAZ were incubated in microwell plate for 16 hours at 30°C. The lowest concentration showing no visible growth was recorded as the MIC. At least three biologic replicates were performed.
Metabolomics analysis
Bacterial sample preparation was carried out as previously described.26 In brief, equivalent cells were quenched with 1 mL of cold methanol and sonicated for 5 minutes at a 200 W power setting. Samples were centrifuged at 12,000 rpm for 10 minutes. Supernatant, containing 1 µg/mL ribitol (Sigma-Aldrich) as internal analytical standard, was transferred into a new Eppendorf tube and dried by vacuum centrifugation device (LABCONCO). The dried extracts were used for GC-MS analysis.
GC-MS analysis was performed with a variation on the two-stage technique.26 Briefly, samples were oximated with 80 µL methoxyamine hydrochloride (20 mg/mL, Sigma-Aldrich) in pyridine (Sigma-Aldrich) for 90 minutes at 37°C, and derivatization with identical volume of N-methyl-N-(trimethylsilyl)trifluoroacetamide (Sigma-Aldrich) for another 30 minutes. An aliquot (1 µL) of the derivative of the supernatant was injected into a 30 m×250 µm internal diameter ×0.25 µm DB-5MS (Agilent) by splitless sampling and analyzed using GC-MS (Trace DSQ II system, Thermo Scientific). The separation conditions of GC-MS consisted of an initial temperature of 85°C (5 minutes) with a uniform increase to 270°C at a speed of 15°C min−1 (5 minutes); 0.5 µL sample volume, splitless injection; injection temperature, 270°C; interface temperature, 270°C; ion source (EI) temperature, 30°C; ionization voltage, 70 eV; quadrupole temperature, 150°C; carrier gas, highly pure helium; velocity, 1.0 mL min−1; and full scan way, 50–600 m/z. Each group contains four independent biologic replicates with two technical replicates.
Spectral deconvolution and calibration were performed using AMDIS and internal standards as previously described.27 A retention time (RT) correction was performed for all the samples, and then the RT was used as reference against which the remaining spectra were queried and a file containing the abundance information for each metabolite in all the samples was assembled. Metabolites from the GC-MS spectra were identified by searching in National Institute of Standards and Technology (NIST11.L) Mass Spectral Library. Among the detected peaks of all chromatograms, 206 compound peaks were considered as endogenous metabolites and the same metabolite names were merged. The resulting data matrix was normalized by the concentrations of added internal standards and the total intensity. This file was then used for subsequent statistical analyses.
The abundance of a metabolite was scaled by total abundance of all metabolites in a sample as its relative abundance for further analysis. Z-score analysis scaled each metabolite according to a reference distribution, and calculated based on the mean and SD of reference. Hierarchical Clustering was completed in the R platform with the package gplots (https://cran.r-project.org/web/packages/gplots/) using the distance matrix. Multivariate statistical analysis included principal component analysis (SIMCA-P 12.0.1), which was used to discriminate sample patterns, to identify the metabolites in VA-RCAZ and to minimize the interindividual variation’s influence. SPSS13.0 and Graphpad Prism 5 were used to draw the histogram as the scatter plot.
Measurement of enzyme activity
Measurement of enzyme activity was performed as previously described with a few modifications.28 In brief, 30 mL logarithmic phase (OD600 1.0) of VA-S and VA-RCAZ was harvested and sonicated for 8 minutes at a 130 W power setting. Samples were centrifuged at 12,000 rpm for 10 minutes. Sample protein concentration was determined using a bicinchoninic acid assay (Beyotime Biotechnology, P0010). Enzyme activity was spectrophotometrically monitored reduction of MTT at 566 nm using the following reaction mixes: pyruvate dehydrogenase (PDH) and α-ketoglutaric dehydrogenase (KGDH) reaction mix (0.15 mM MTT, 0.5 mM PMS, 0.2 mM TPP, 2.5 mM MgCl2, 50 mM potassium phosphate buffer [pH 7], 2 mM pyruvate, or 5 mM α-ketoglutaric acid potassium salt), isocitrate dehydrogenase (IDH) reaction mix (0.15 mM MTT, 1 mM PMS, 2.5 mM MgCl2, 100 mM Tris–HCl [pH 8.8], 3.5 mM isocitrate), succinate dehydrogenase (SDH), and malate dehydrogenase (MDH) reaction mix (0.15 mM MTT, 1 mM PMS, 50 mM potassium phosphate buffer [pH 7], 20 mM succinate, or 50 mM malate). Isocitrate lyase (ICL) activity was measured at OD 445 nm. The lysate was incubated with reaction mix (100 mM Tris–HCl [pH 7.7], 0.15 mM MgCl2, 60 µM l-cysteine hydrochloride monohydrate, 7 mM isocitrate) for 30 minutes, followed by addition of 0.2 mL 10% trichloroacetic acid to terminate the reaction and centrifugation for 5 minutes. Then, 0.1 mL supernatant was mixed with 20 µL 0.1% 2,4-dimethyl-1-nitrobenzene at 30°C for 30 minutes, and 0.2 mL 1.5 N NaOH was added to show colors. Citrate synthase (CS) activity was measured with the Citrate Synthase Assay Kit (Nanjing Jiancheng Bioengineering Institute). MTT, PMS, TPP, pyruvate, succinate, l-cysteine hydrochloride monohydrate, and 2,4-dimethyl-1-nitrobenzene were purchased from Sangon Biotech, and isocitrate and malate were purchased from Howei Pharm. At least three biologic replicates were performed.
Measurement of membrane potential
Measurement of membrane potential was performed as previously described.28 In brief, overnight VA-S and VA-RCAZ were diluted to 1:100 using fresh 3% NaCl LB medium and grown at 30°C for 3 hours (OD600 1.0). The cultures were harvested at 8,000 rpm for 3 minutes, and washed three times with 30 mL sterile saline and resuspended in M9 minimal medium with NaAc (10 mM), MgSO4 (2 mM), and CaCl2 (0.1 mM) to 0.6 at OD600. At 30°C, 106 CFU/mL cells were stained with 30 µM DiOC2(3) (D14730, Thermo Fisher Scientic, Waltham, MA, USA) for 30 minutes. Samples were analyzed by flow cytometry (FACSCalibur, Becton Dickinson, San Jose, CA, USA). PMF was accounted according to the following computational formula:  . Experiments were repeated in three independent biologic replicates.
Antibiotic bactericidal assay
Antibiotic bactericidal assay was performed as previously described.22 In brief, VA-S, VA-RCAZ, ATCC33787, ΔnqrA, and ΔnqrF were cultured for 12 hours at 30°C. Samples were harvested at 8,000 rpm for 3 minutes, and washed three times with 30 mL sterile saline and resuspended in M9 minimal medium with NaAc (10 mM), MgSO4 (2 mM), and CaCl2 (0.1 mM) to 0.6 at OD600. Indicated concentrations of CAZ with or without furfual, malonate, NaN3, CCCP, or triclosan were added in a final volume of 5 mL. After incubation at 30°C for 6 hours, 100 µL aliquot samples were collected, serially diluted, and plated (10 µL aliquots) on LB medium containing 2.5% agar. The plates were cultured at 30°C for 8–10 hours. Only those dilutions generating 20–200 clones were counted to calculate CFU. Percent survival was determined by dividing the CFU obtained from a treated sample by the CFU obtained from control. For fatty acid-enabled killing of VA-S by CAZ, the bacteria were cultured in LB with 0.2 mM of palmitate or stearate for 12 hours. The collected cells were used for the antibiotic bactericidal assay described above. Furfual, malonate, triclosan palmitate, and stearate were purchased from Sangon Biotech, and Sigma-Aldrich provided NaN3 and CCCP. Experiments were repeated in three independent biologic replicates.
Quantitative real-time PCR (qRT-PCR)
qRT-PCR was performed as previously described.29 Briefly, total RNA was extracted using Trizol reagent following the manufacturer’s instruction (Thermo Fisher Scientific), and reverse transcription to cDNAs was carried out on 1 µg total RNA using PrimerScriptTM RT Reagent Kit with gDNA Eraser (TaKaRa RR047A). Quantification of mRNA was measured by using real-time PCR system (BIO-RAD) and SYBRPremix Ex TaqTM II (TaKaRa RR820A). Gene-specific primers used for qRT-PCR are showed in Table 1 and reference 23. The ΔCt values were calculated by ΔCt = Ct(target gene) – Ct(reference gene), and the ΔΔCt values were calculated by ΔΔCt = ΔCt(test sample) – ΔCt(calibrator sample). Fold change of the target gene was calculated by 2–ΔΔC.30 Experiments were repeated in four independent biologic replicates.
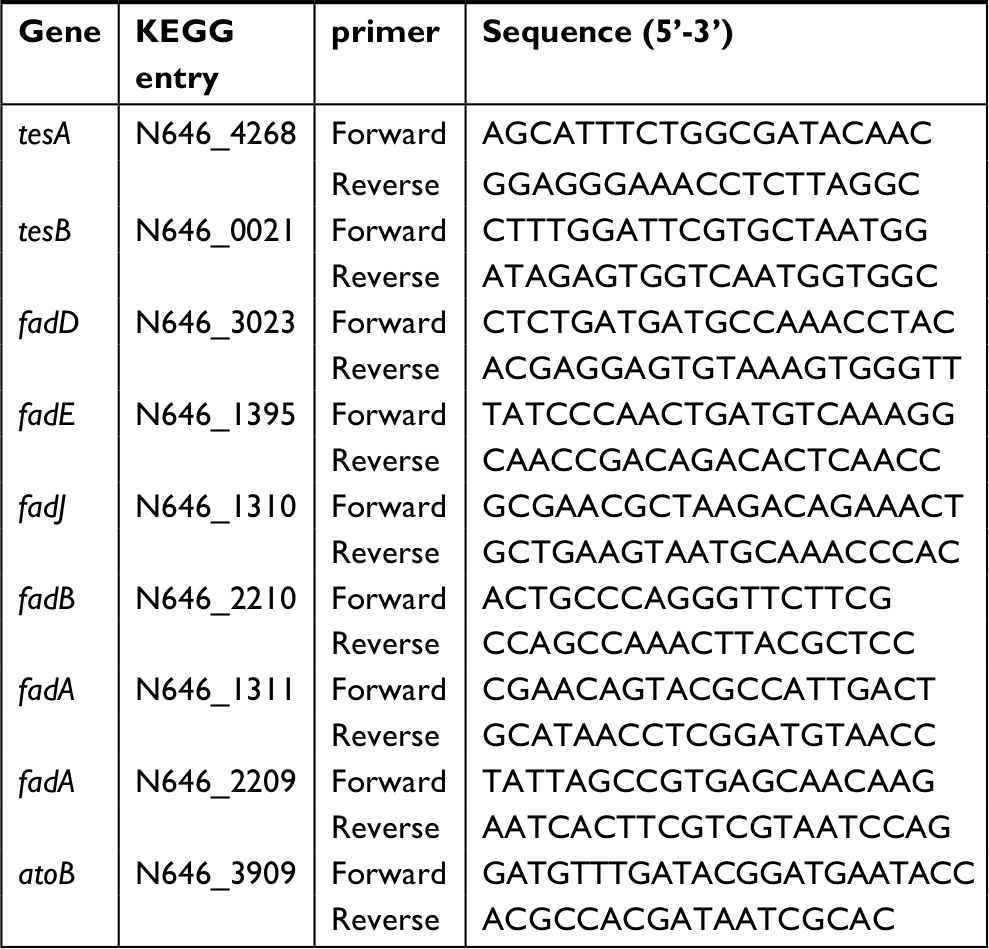 | Table 1 Primers for QRT-PCR |
Results
VA-RCAZ are phenotypically different than VA-S
This study examines mechanisms that confer antibiotic resistance in two strains of V. alginolyticus, VA-S and VA-RCAZ, which are 16-fold differentially sensitive or differentially resistant to CAZ, respectively. More specifically, the minimal drug concentration to fully inhibit growth in liquid LB (MIC; see section “Materials and Methods” for exact growth conditions) was 0.2 µg/mL for VA-S and 3.2 µg/mL for VA-R (Figure 1A). Under these conditions, both percent survival depended on CAZ dose (Figure 1B) and slower growth rate was detected in VA-RCAZ than VA-S (Figure 1C). In addition, VA-RCAZ grew more slowly than VA-S in medium containing glucose, xylitol, mannose, or maltose (P<0.05), while the growth rates of the two strains were similar in media containing fructose or sucrose (P>0.05) (Figure 1D).
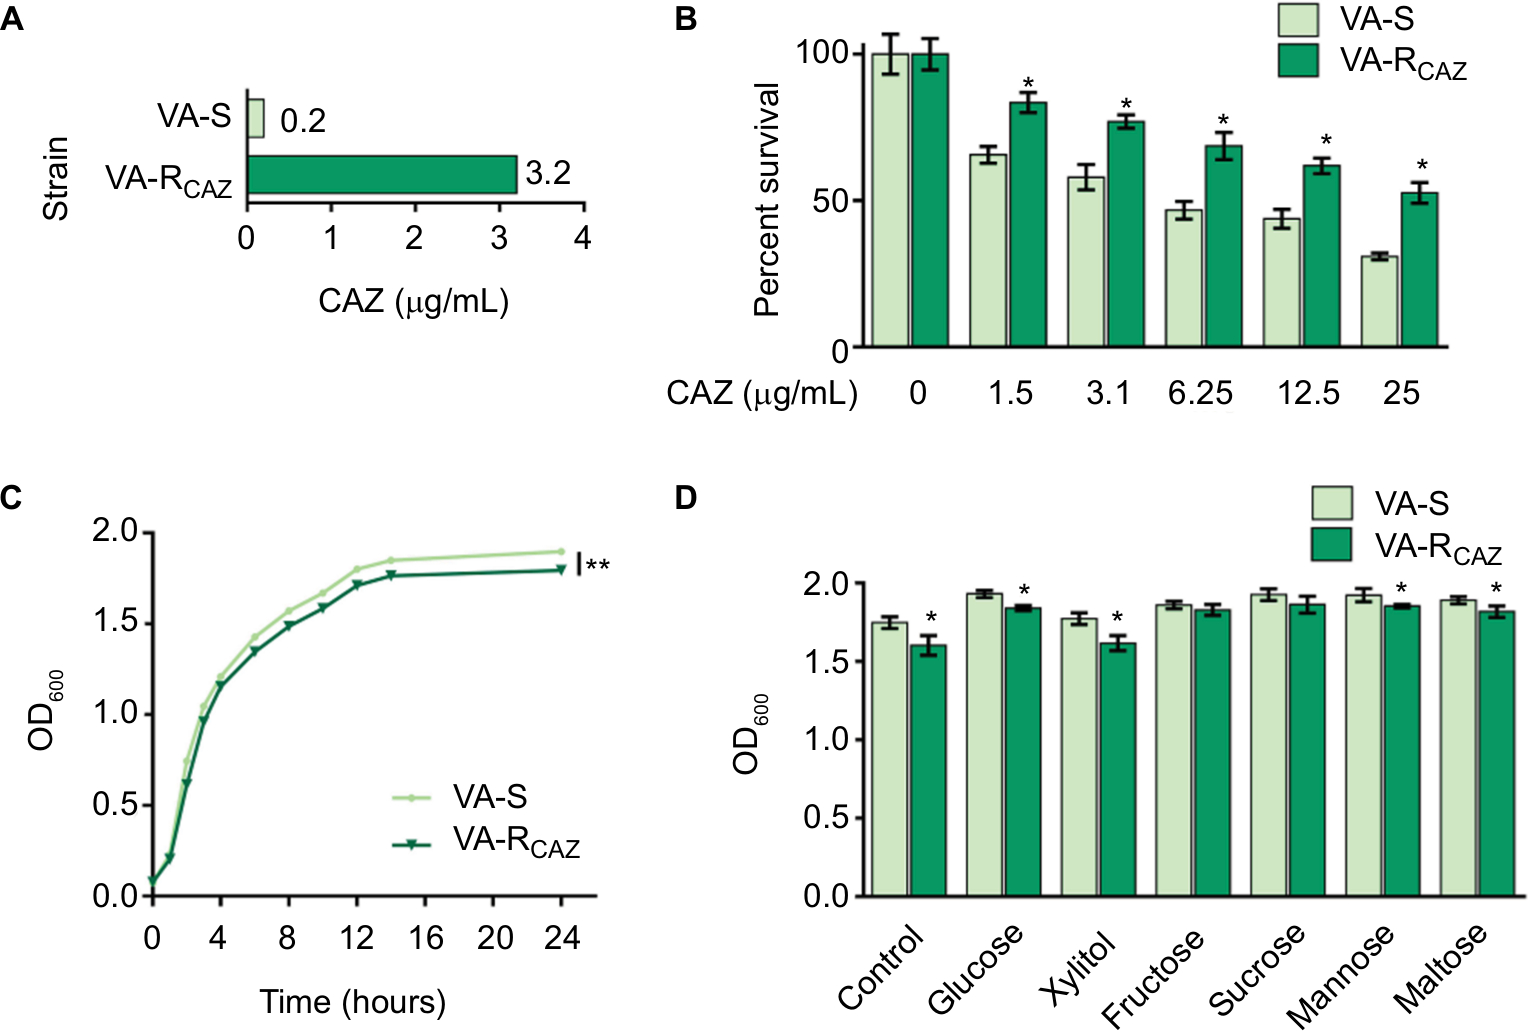 | Figure 1 Resistance of VA-RCAZ to CAZ. Notes: (A) MIC of CAZ in VA-S and VA-RCAZ. Logarithmic phase of VA-S and VA-RCAZ (105 colony-forming units) were incubated with 3% NaCl LB broth containing CAZ ranging from 0.05 to 100 μg/mL in microwell plate at 30°C for 16 hours. (B) Percent survival of VA-S and VA-RCAZ vs concentration of CAZ. Overnight VA-S and VA-RCAZ were incubated with CAZ (0, 1.5, 3.1, 6.25, 12.5, and 25 µg/mL) in M9 minimal medium plus NaAc (10 mM) at 30°C for 6 hours. (C) Growth curve of VA-S and VA-RCAZ. Overnight VA-S and VA-RCAZ were diluted to 1:100 using fresh 3% NaCl LB medium and grown in the indicated periods. OD600 of the bacterial cultures was measured at the indicated time. (D) Growth ability of VA-S and VA-RCAZ in the presence of different carbon sources. Overnight VA-S and VA-RCAZ were diluted to 1:100 using fresh 3% NaCl LB medium and grown with glucose, xylitol, fructose, sucrose, mannose, or maltose at 30°C for 10 hours. OD600 of the bacterial cultures was measured. Results (B–D) are displayed as mean ± SEM, and significant differences are identified as determined by Student’s t-test. *P<0.05, **P<0.01. At least three biologic repeats were carried out. Abbreviations: CAZ, ceftazidime; LB, Luria–Bertani; VA-RCAZ, ceftazidime-resistant Vibrio alginolyticus; VA-S, ceftazidime-sensitive Vibrio alginolyticus. |
Metabolic profile of VA-RCAZ is different from that of VA-S
The metabolomes of VA-RCAZ and VA-S were analyzed by GC-MS as described (see section “Materials and Methods”). Two technical replicates were performed and a correlation coefficient equal to 0.997–1.0 was observed, indicating that the methodology is reliable (Figure 2A). Biologic roles of metabolites were defined using KEGG. The results showed that 36.23% (25), 31.88% (22), 14.49% (10), and 14.49% (10) of the metabolites were carbohydrates, amino acids, nucleotides, or lipids, respectively (Figure 2B). Four biologic replicates in each group and two technical repeats for each biologic replicate were performed, yielding a total of 16 data sets. The metabolite profiles of VA-RCAZ and VA-S were compared and differences were displayed as a heat map (Figure 2C). A two-sided Wilcoxon rank-sum test coupled with a permutation test was used to compare metabolite abundance/distribution in VA-RCAZ and VA-S. The results showed that 69 metabolites (P<0.05) were differentially enriched or -depleted in VA-RCAZ relative to VA-S, distributed as 31.88% carbohydrates, 31.88% amino acids, 13.04% nucleotides, and 14.49% lipids, respectively (Figure 2D, E). Calculated Z-values fell in the range –21.4 to 28.0 and the data are visualized on the Z-score plot shown in Figure 2F. These results indicate that the metabolic profiles of VA-S and VA-RCAZ are substantially different from one another and that the difference is statistically significant.
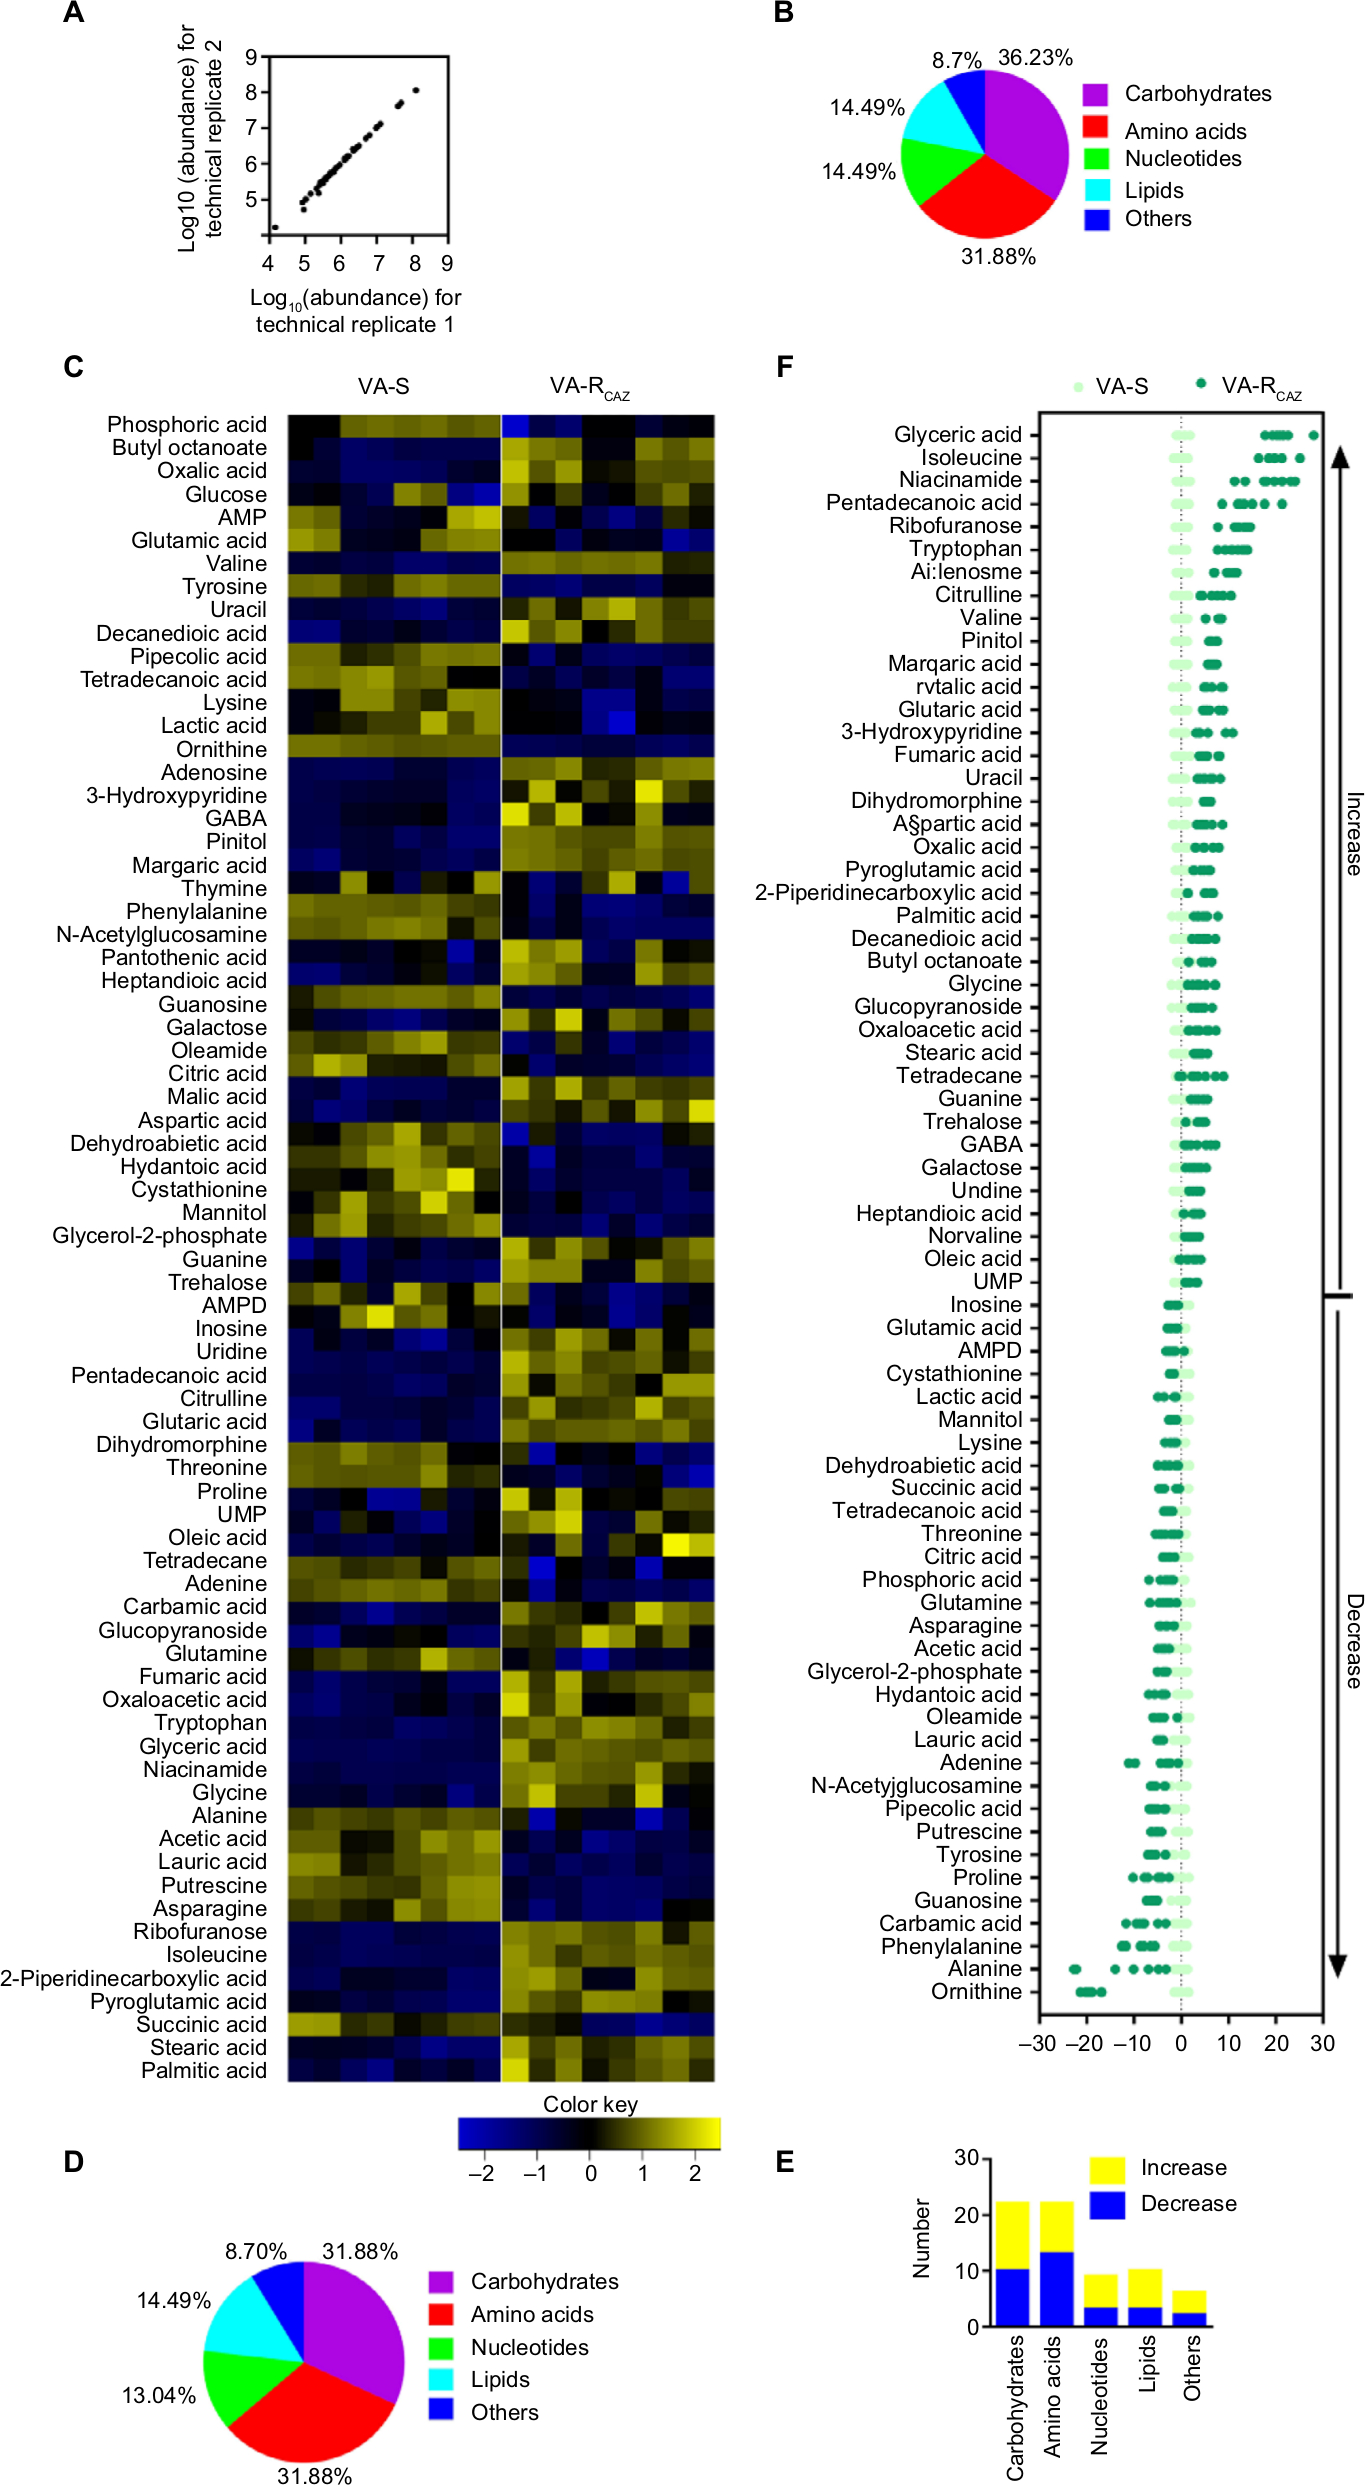 | Figure 2 Metabolic profiles of VA-S and VA-RCAZ. Notes: (A) Abundance of metabolites quantified in samples over two technical replicates is shown. Pearson correlation coefficient between technical replicates varies between 0.997 and 1.0. (B) Percentage of metabolites in every category. (C) Heat map of differential abundance of metabolites (row). Yellow and blue indicate increase and decrease of the metabolites scaled to mean and SD of row metabolite level, respectively (see color scale). Four biologic replicates in each group and two technical repeats for each biologic replicate were performed, yielding a total of 16 data sets. (D) Percentage of differential abundant metabolites in every category. (E) Number of differential abundant metabolites increased and decreased in every category. (F) Z-score plots corresponding to the data in panel (A). The data from VA-RCAZ are separately scaled to the mean and SD of VA-S. Each point represents one metabolite in one technical repeat and is colored by sample types (yellow: VA-S, blue: VA-RCAZ). Abbreviations: VA-RCAZ, ceftazidime-resistant Vibrio alginolyticus; VA-S, ceftazidime-sensitive Vibrio alginolyticus. |
Metabolic pathways differentially up- or downregulated in VA-RCAZ
To better understand the metabolic differences between VA-S and VA-RCAZ, MetaboAnalyst (http://www.metaboanalyst.ca/) was used to identify pathways in the two strains that were differentially up- or downregulated. The analysis revealed that eleven pathways (P<0.05) are upregulated in VA-RCAZ, and these pathways involve metabolism of amino acids (alanine, aspartate, and glutamate; arginine and proline; glycine, serine, and threonine; cyano amino acids), glyoxylate and dicarboxylate, nitrogen, glutathione, butanoate, as well as biosynthesis of aminoacyl-tRNAs, and unsaturated fatty acids, and the tricarboxylic acid cycle (Figure 3A). However, all metabolites increased in the pathway affecting biosynthesis of unsaturated fatty acids, whereas some metabolites decreased and some increased in other metabolic pathways (Figure 3B). We conclude that biosynthesis of fatty acids is upregulated in VA-RCAZ and tentatively conclude that this pathway may play a direct or indirect role in CAZ resistance in V. alginolyticus.
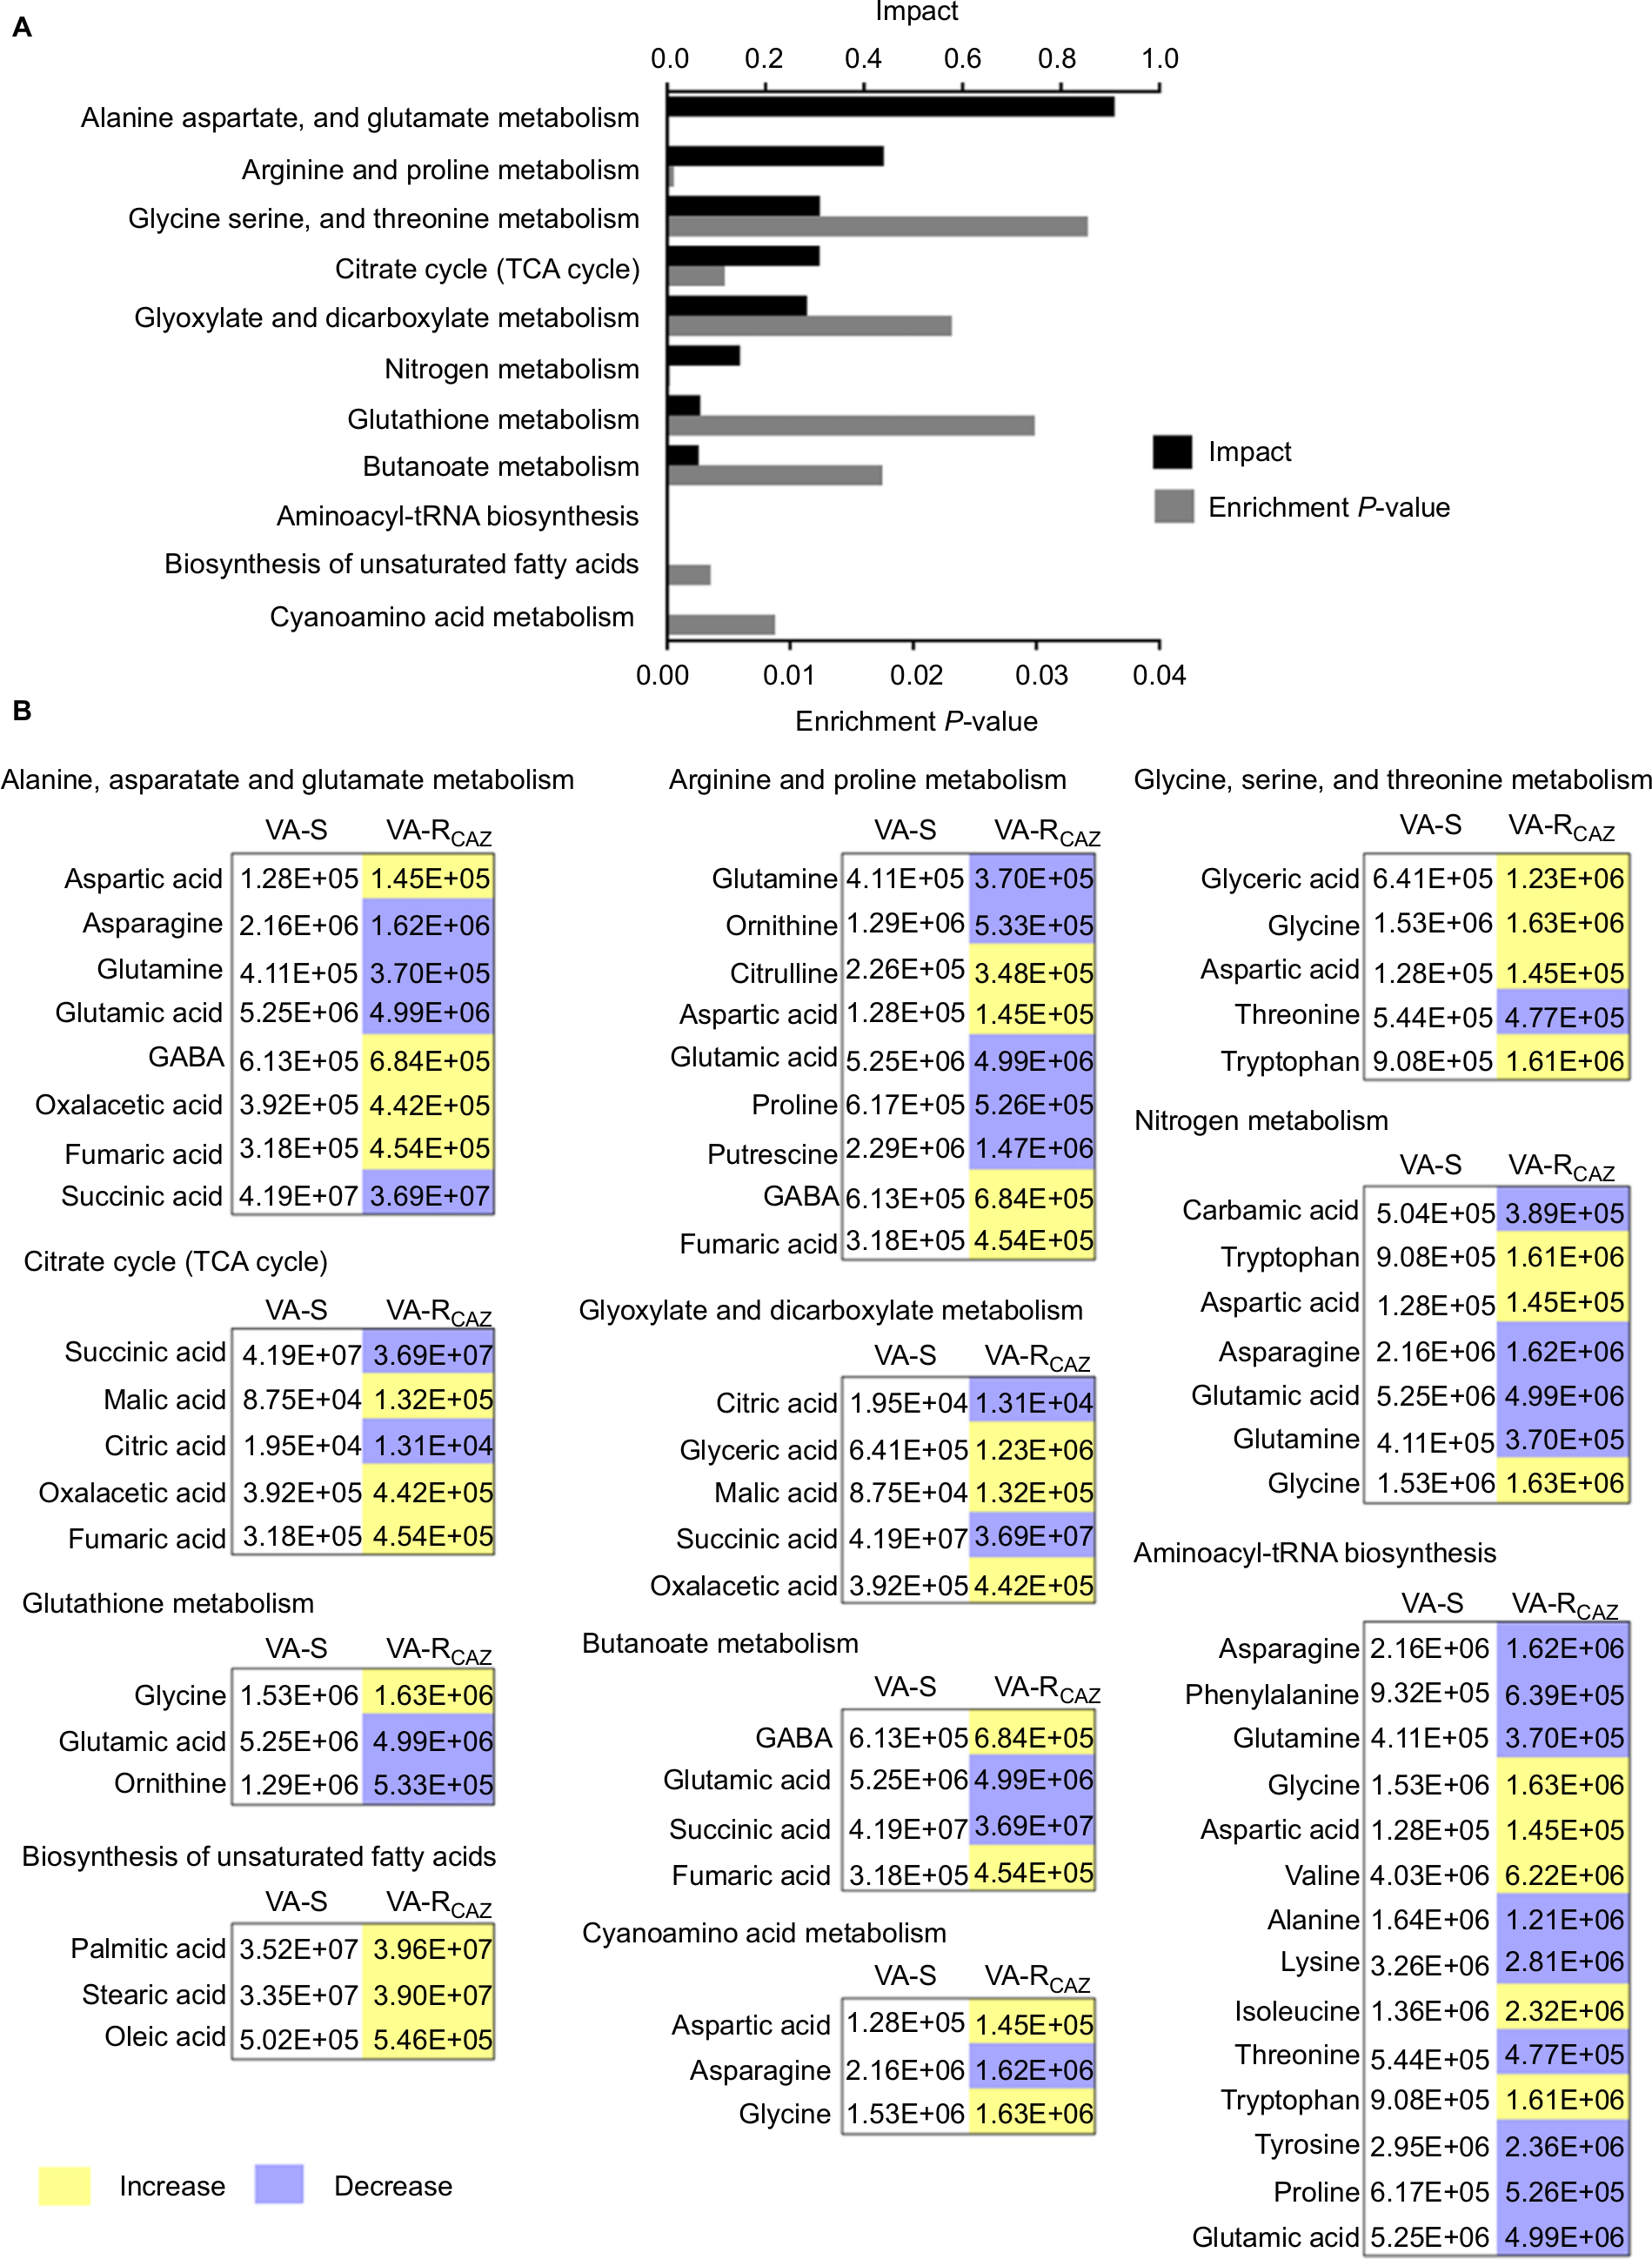 | Figure 3 Pathway analysis. Notes: (A) Pathway enrichment of differential abundant metabolites. (B) Integrative analysis of differential abundant metabolites in significantly enriched pathways. Yellow and blue indicate increase and decrease of metabolites, respectively. Number shows the differential abundant metabolites. Abbreviations: VA-RCAZ, ceftazidime-resistant Vibrio alginolyticus; VA-S, ceftazidime-sensitive Vibrio alginolyticus. |
Biomarkers of CAZ resistance
To identify biomarkers of CAZ resistance, the metabolomic profiles of VA-RCAZ and VA-S were analyzed using orthogonal partial least-square discriminant analysis. Component (t[1]) distinguished VA-RCAZ from VA-S (Figure 4A). Discriminating variables were identified on an S-plot (Figure 4B). Cutoff values were ≥0.05 for absolute value of the covariance p and ≥0.5 for correlation p(corr). Larger weight and higher relevance metabolites are shown in red. Five putative biomarkers of CAZ resistance were identified, including stearic acid, palmitic acid, oxalic acid, and valine (all of which increase), and succinic acid, whose abundance decreases (Figure 4C). Palmitic and stearic acids play roles in biosynthesis of fatty acids, and succinic acid plays a role in the P cycles, respiration, and energy metabolism.
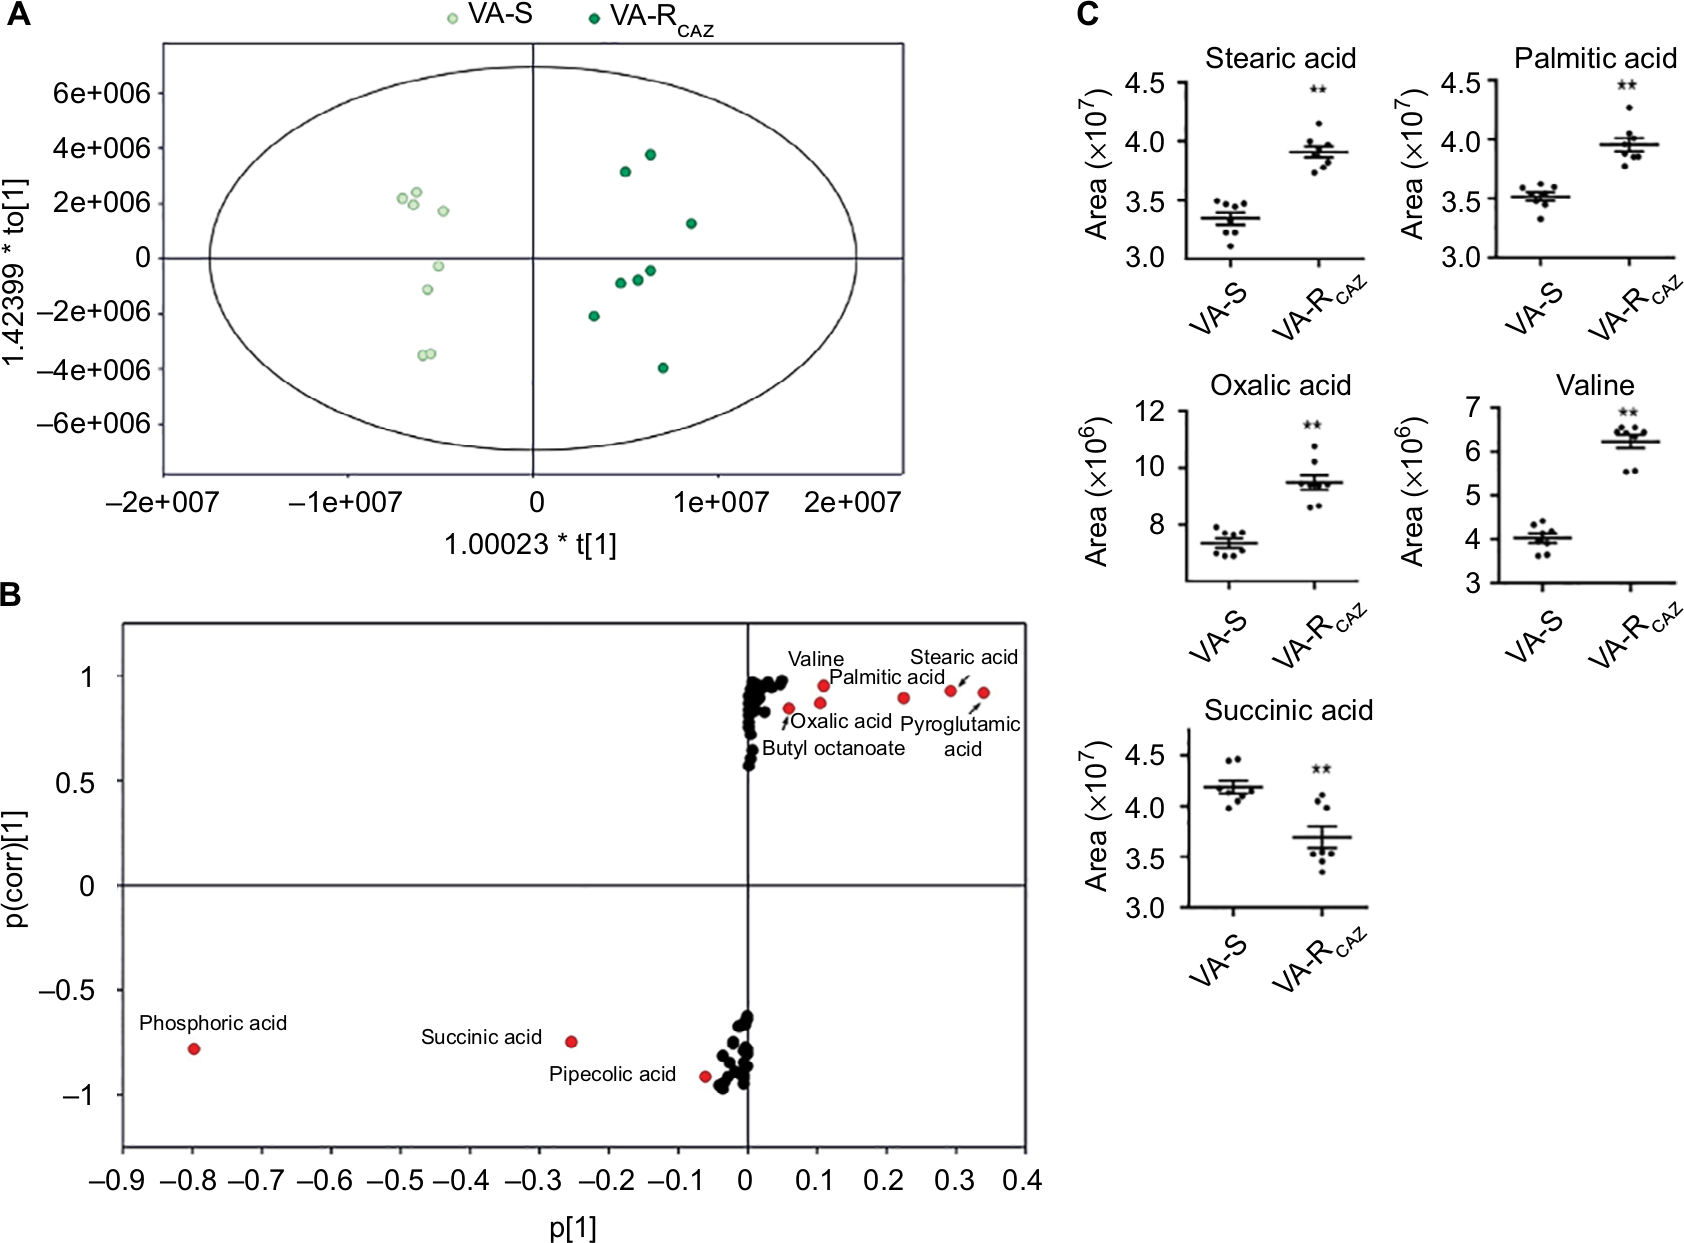 | Figure 4 Metabolites up- or downregulated in VA-RCAZ.. Notes: (A) Principal component analysis of VA-S and VA-RCAZ. Each dot represents the technologic replicate analysis of samples in the plot. (B) S-plot generates from orthogonal partial least-square discriminant analysis. Predictive component p[1] and correlation p(corr)[1] differentiate VA-S and VA-RCAZ. Each dot represents metabolites and candidate biomarkers are highlighted in red dot. (C) Candidate biomarkers by predictive component p[1], p(corr)[1], and enriched pathways. Results (C) are displayed as mean ± SEM, and significant differences are identified as determined by Student’s t-test. **P<0.01. At least three biologic repeats were carried out. Abbreviations: VA-RCAZ, ceftazidime-resistant Vibrio alginolyticus; VA-S, ceftazidime-sensitive Vibrio alginolyticus. |
Decreased energy metabolism and inefficient P cycle in VA-RCAZ
Based on the results presented above and summarized in Figure 5A, we hypothesize that flux of acetyl-coA into and through the P-cycle and fatty acid biosynthesis is altered in VA-RCAZ (Figure 5B). This hypothesis is substantiated by the following observations: PDH transforms pyruvate into acetyl-CoA, CS catalyzes the condensation reaction of acetyl-CoA and oxaloacetate to form the citrate, IDH catalyzes the oxidative decarboxylation of isocitrate to produce α-ketoglutarate, KGDH converts α-ketoglutarate to succinyl-CoA, SDH catalyzes the oxidation of succinate to fumarate, and MDH reversibly catalyzes the oxidation of malate to oxaloacetate. Decreased PDH, CS, IDH, and OGDH activity supported the reduced citric acid and succinic acid, while increased SDH activity and decreased MDH activity are expected to lead to elevated fumaric acid and malic acid (Figure 5C). ICL catalyzes the cleavage of isocitrate to succinate and glyoxylate. To preclude the possibility that the glyoxylate cycle is activated in VA-RCAZ, we showed that ICL activity is lower in VA-RCAZ than in VA-S (Figure 5C). iPath was also used to compare the metabolomes of VA-RCAZ and VA-S and the results are summarized in an overview map, on which red lines show upregulated pathways and blue lines show downregulated pathways, the latter including carbohydrate metabolism (Figure 5D). The importance of the P cycle in the CAZ resistance was demonstrated by the fact that cell survival decreased in a dose-dependent manner in the presence of increasing concentration of furfural and malonate, which inhibit PDH and SDH of the P cycle, respectively (Figure 5E, F).
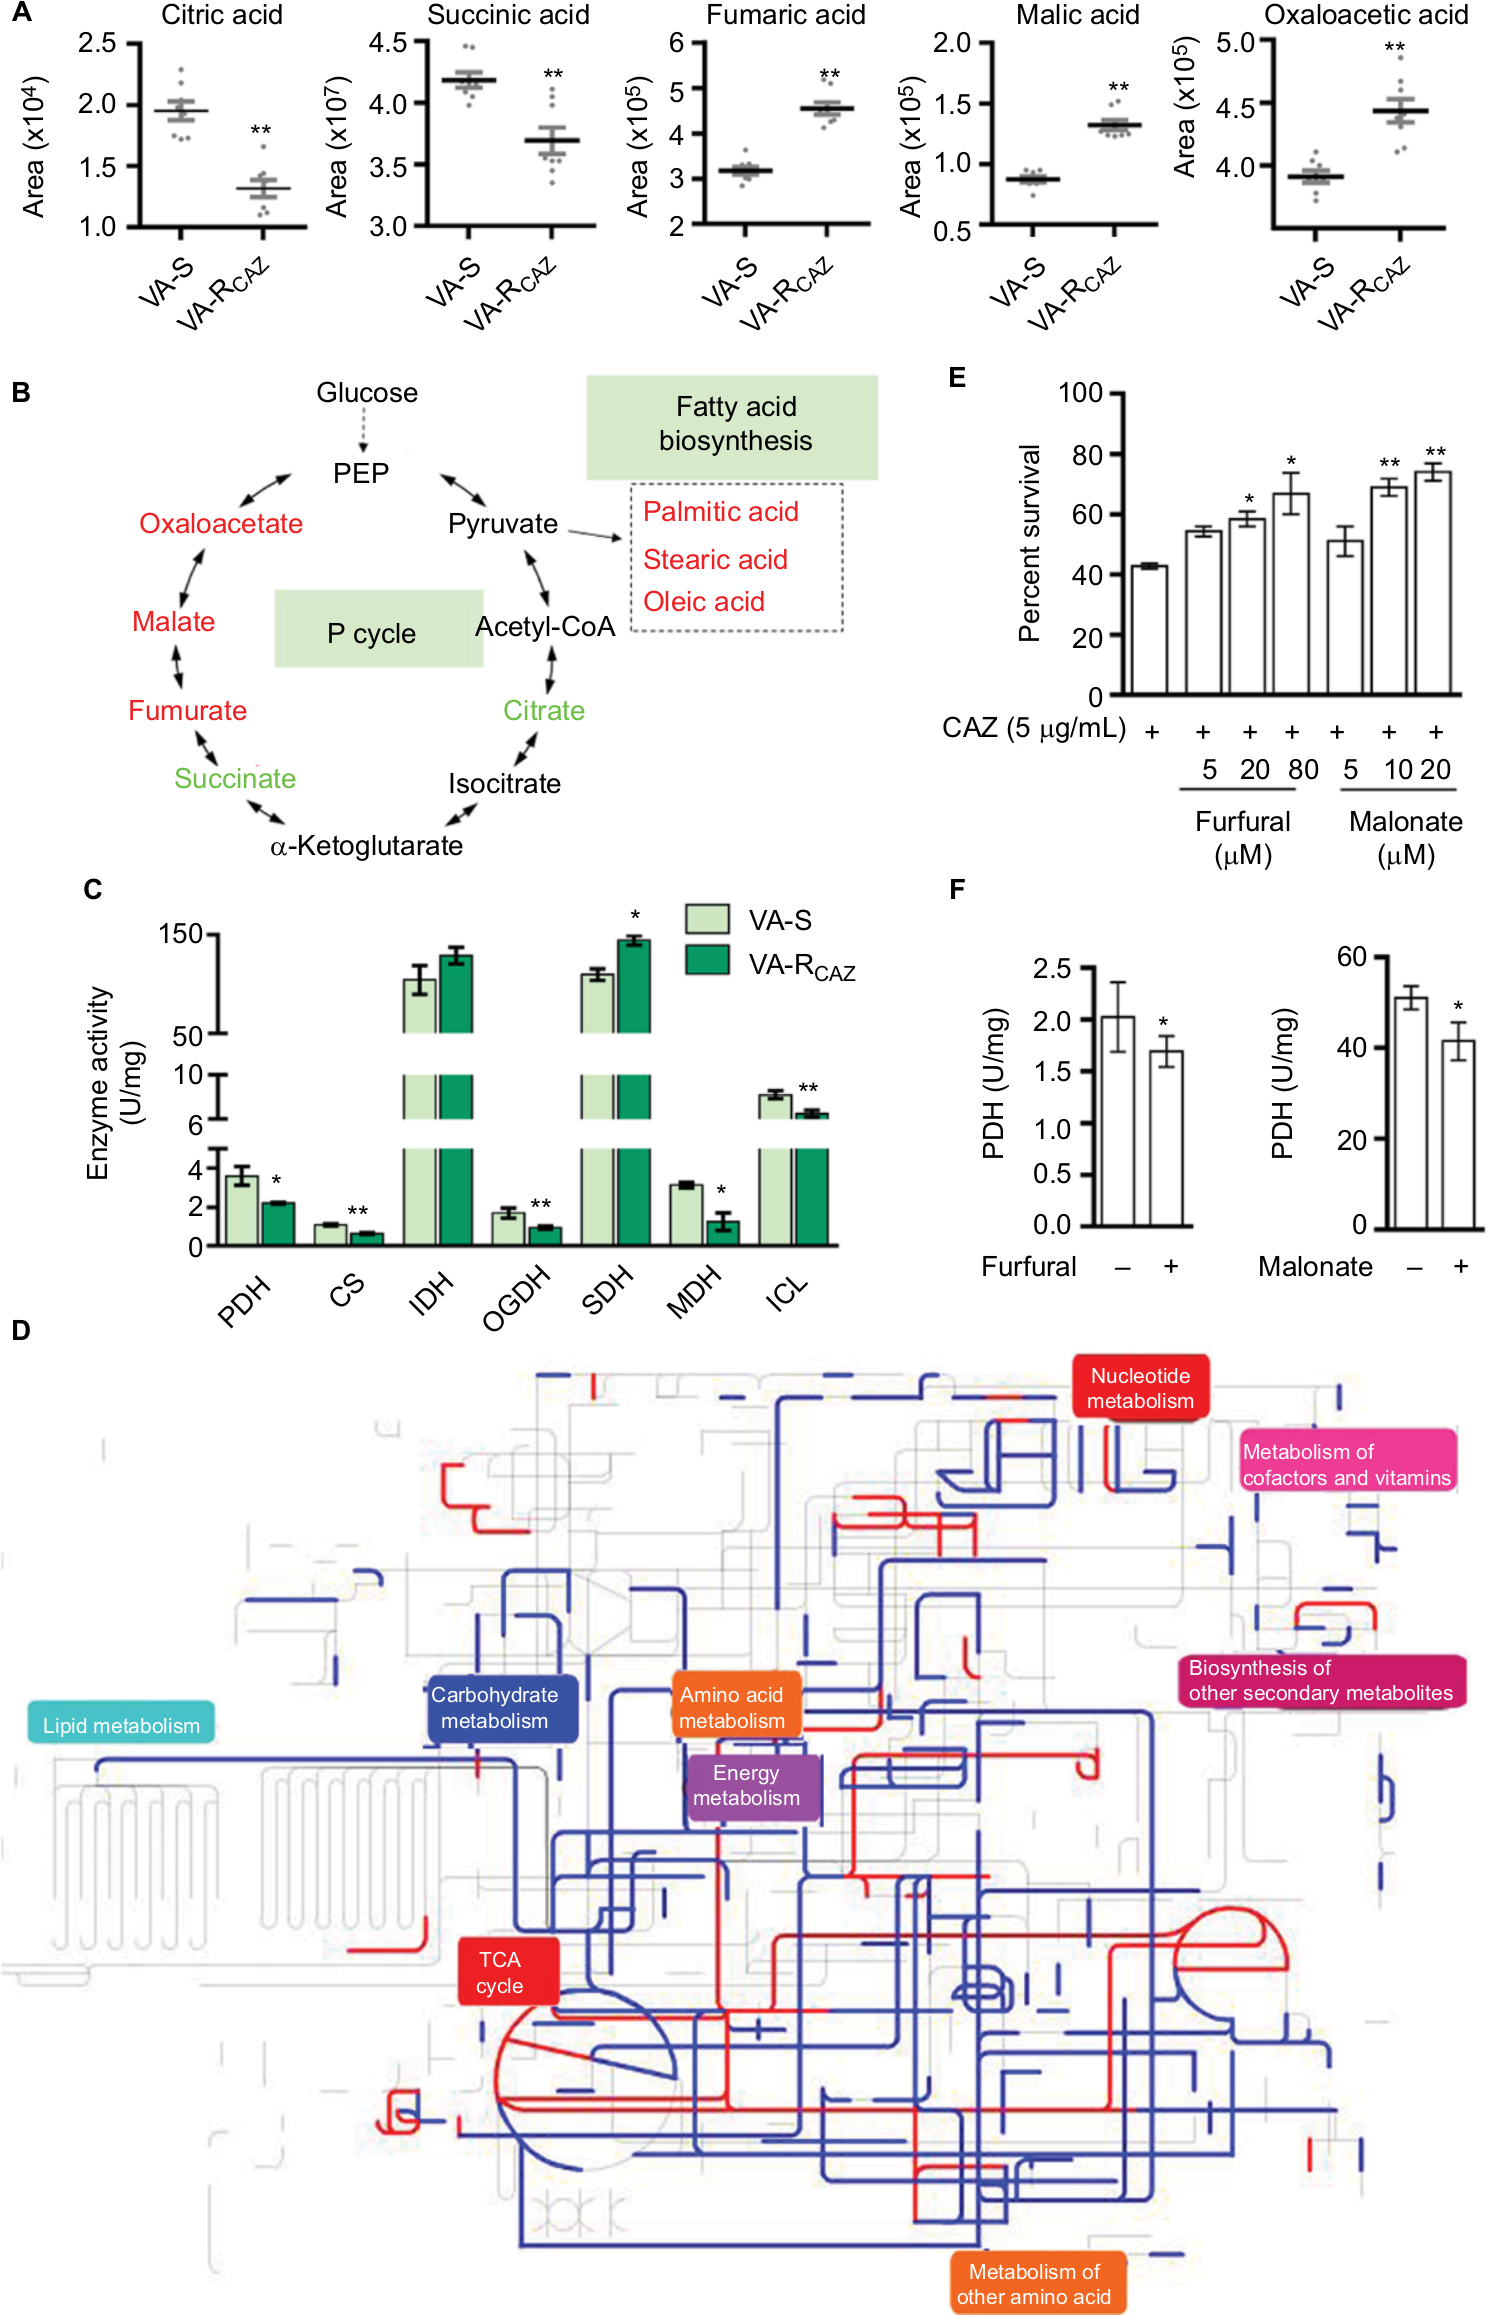 | Figure 5 P cycle and energy metabolism in VA-RCAZ. Notes: (A) Abundance of five metabolites in the P cycle. (B) Flux of the P cycle and biosynthesis of fatty acids in VA-RCAZ compared with VA-S. (C) Activity of enzymes (PDH, CS, IDH, OGDH, SDH, MDH, and ICL) in the P cycle. Overnight VA-S and VA-RCAZ were diluted to 1:100 using fresh 3% NaCl LB medium and grown at 30°C for 3 hours. (D) Interactive Pathways Explorer (iPath) analysis. Metabolic network pathways in VA-RCAZ were analyzed with iPath 2.0 (http://pathways2.embl.de/iPath2.cgi#). Analyses of the 42 differential metabolites (the other metabolites are not recognized in the metabolic network pathways). Red: increase; blue: decrease. (E) Percent survival of VA-S in the presence or absence of inhibitors (furfural and malonate). Overnight VA-S were incubated with CAZ (5 µg/mL) plus furfural (5, 20, and 80 µM) or malonate (5, 10, and 20 mM) in M9 minimal medium plus NaAc (10 mM) at 30°C for 6 hours. (F) Enzyme activity of PDH and SDH in the presence or absence of inhibitors (furfural and malonate). Overnight VA-S were incubated with furfural (80 µM) or malonate (20 mM) in M9 minimal medium plus NaAc (10 mM) at 30°C for 6 hours. Results (A, C, E, and F) are displayed as mean ± SEM, and significant differences are identified as determined by Student’s t-test. *P<0.05, **P<0.01. At least three biologic repeats were carried out. Abbreviations: CAZ, ceftazidime; ICL, isocitrate lyase; IDH, isocitrate dehydrogenase; MDH, malate dehydrogenase; P cycle, pyruvate cycle; PDH, pyruvate dehydrogenase; SDH, succinate dehydrogenase; TCA, tricarboxylic acid; VA-RCAZ, ceftazidime-resistant Vibrio alginolyticus; VA-S, ceftazidime-sensitive Vibrio alginolyticus. |
Decreased NQR and PMF in VA-RCAZ
We hypothesized that antibiotic resistance may be associated with impaired energy metabolism leading to low PMF, and reduced capacity for active transport of drugs and other metabolites across the cell membrane. In fact, membrane potential was significantly lower in VA-RCAZ than in VA-S (Figure 6A). Consistent with this, VA-RCAZ is also resistant to killing by gentamicin, whose cytotoxicity also requires adequate PMF,19,22,31 and higher percent survival as found in Figure 6B. We also investigated the possible role of sodium-dependent NADH: ubiquinone oxidoreductase (Na+-NQR), the main ion ransporter in Vibrio species, in the mechanism of antibiotic resistance in V. alginolyticus. Na+-NQR is a multisubunit (NqrA-F) respiratory complex that couples the free energy of electron transfer reactions to electrogenic pumping of sodium across the Vibrio cell membrane. Loss of nqrA or nqrF lowers membrane potential (Figure 6C), and increases percent survival in the presence of toxic small molecule drugs, including antibiotics (Figure 6D). NaN3 and CCCP, inhibitors of respiration and membrane potential, respectively, also increased percent survival of VA-S in a dose-dependent manner (Figure 6E). These results suggest that defects in energy metabolism and low membrane potential play roles in the mechanism of CAZ resistance in V. alginolyticus.
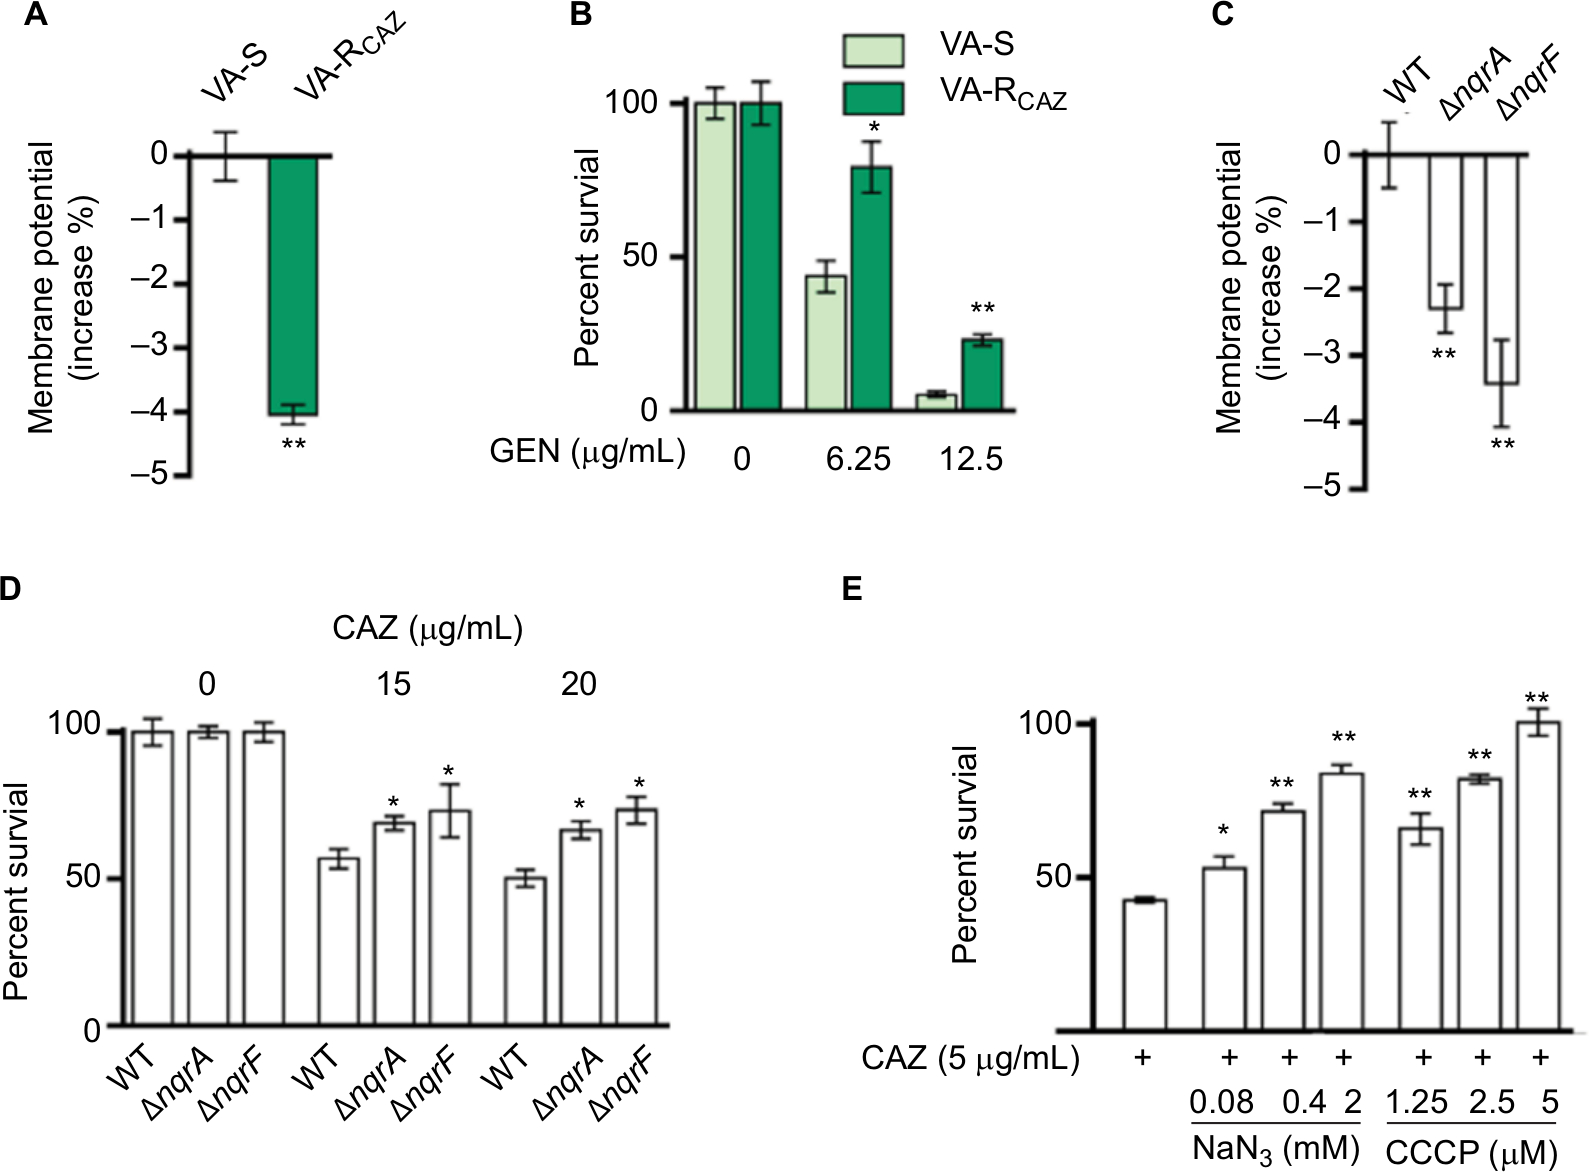 | Figure 6 Nqr complex and PMF. Notes: (A) Membrane potential of VA-S and VA-RCAZ. Overnight VA-S and VA-RCAZ were diluted to 1:100 using fresh 3% NaCl LB medium and grown at 30°C for 3 hours, and then 106 CFU/mL cells were stained with 30 µM DiOC2(3) at 30°C for 30 minutes prior to flow cytometry assay. (B) Percent survival of VA-S in the presence of the indicated GEN. Overnight VA-S and VA-RCAZ were incubated with gentamicin (6.25, 12.5 µg/mL) in M9 minimal medium plus NaAc (10 mM) at 30°C for 6 hours. (C) Membrane potential of ATCC33787, nqrA-deleted, and nqrF-deleted mutants. Overnight ATCC33787, ΔnqrA, and ΔnqrF were diluted to 1:100 using fresh 3% NaCl LB medium and grown at 30°C for 3 hours, and then 106 CFU/mL cells were stained with 30 µM DiOC2(3) at 30°C for 30 minutes prior to flow cytometry analysis. (D) Percent survival of ATCC33787, nqrA-deleted, and nqrF-deleted mutants in the presence of the indicated CAZ. Overnight ATCC33787, ΔnqrA, and ΔnqrF were incubated with CAZ (0, 15, 20 µg/mL) in M9 minimal medium plus NaAc (10 mM) at 30°C for 6 hours. (E) Percent survival of VA-S in the presence of CAZ with the indicated NaN3 or CCCP. Overnight VA-S were incubated with CAZ (5 µg/mL) plus NaN3 (0.08, 0.4, and 2 mM) or CCCP (1.25, 2.5, and 5 µM) in M9 minimal medium plus NaAc (10 mM) at 30°C for 6 hours. Results are displayed as mean ± SEM, and significant differences are identified as determined by Student’s t-test. *P<0.05, **P<0.01. At least three biologic repeats were carried out. Abbreviations: CAZ, ceftazidime; CFU, colony-forming unit; GEN, gentamicin; LB, Luria–Bertani; PMF, proton motive force; VA-RCAZ, ceftazidime-resistant Vibrio alginolyticus; VA-S, ceftazidime-sensitive Vibrio alginolyticus; WT, wild type. |
Elevated fatty acid metabolism in CAZ-resistant V. alginolyticus
Triclosan, an inhibitor of fatty acid biosynthesis, decreases resistance and increases dose-dependent lethal effects of CAZ on VA-RCAZ (Figure 7A), while exogenous palmitic acid or stearic acid increases resistance of VA-S to CAZ (Figure 7B). This is consistent with the upregulation of fatty acid biosynthesis and downregulation of fatty acid degradation in VA-RCAZ, as suggested by metabolomics data presented above. This result was confirmed using qRT-PCR to quantify expression of genes in the two pathways. The results showed upregulation of 10 genes involved in fatty acid biosynthesis (N646_1132 and N646_1439 are fabH) while expression of 13 genes in fatty acid biosynthesis were unchanged. Furthermore, expression of five of seven genes involved in fatty acid degradation was lower in VA-RCAZ than in VA-S (N646_1311 and N646_2209 are fadA), while expression of one gene in this pathway increased and expression of one gene did not change (Figure 7C, D).
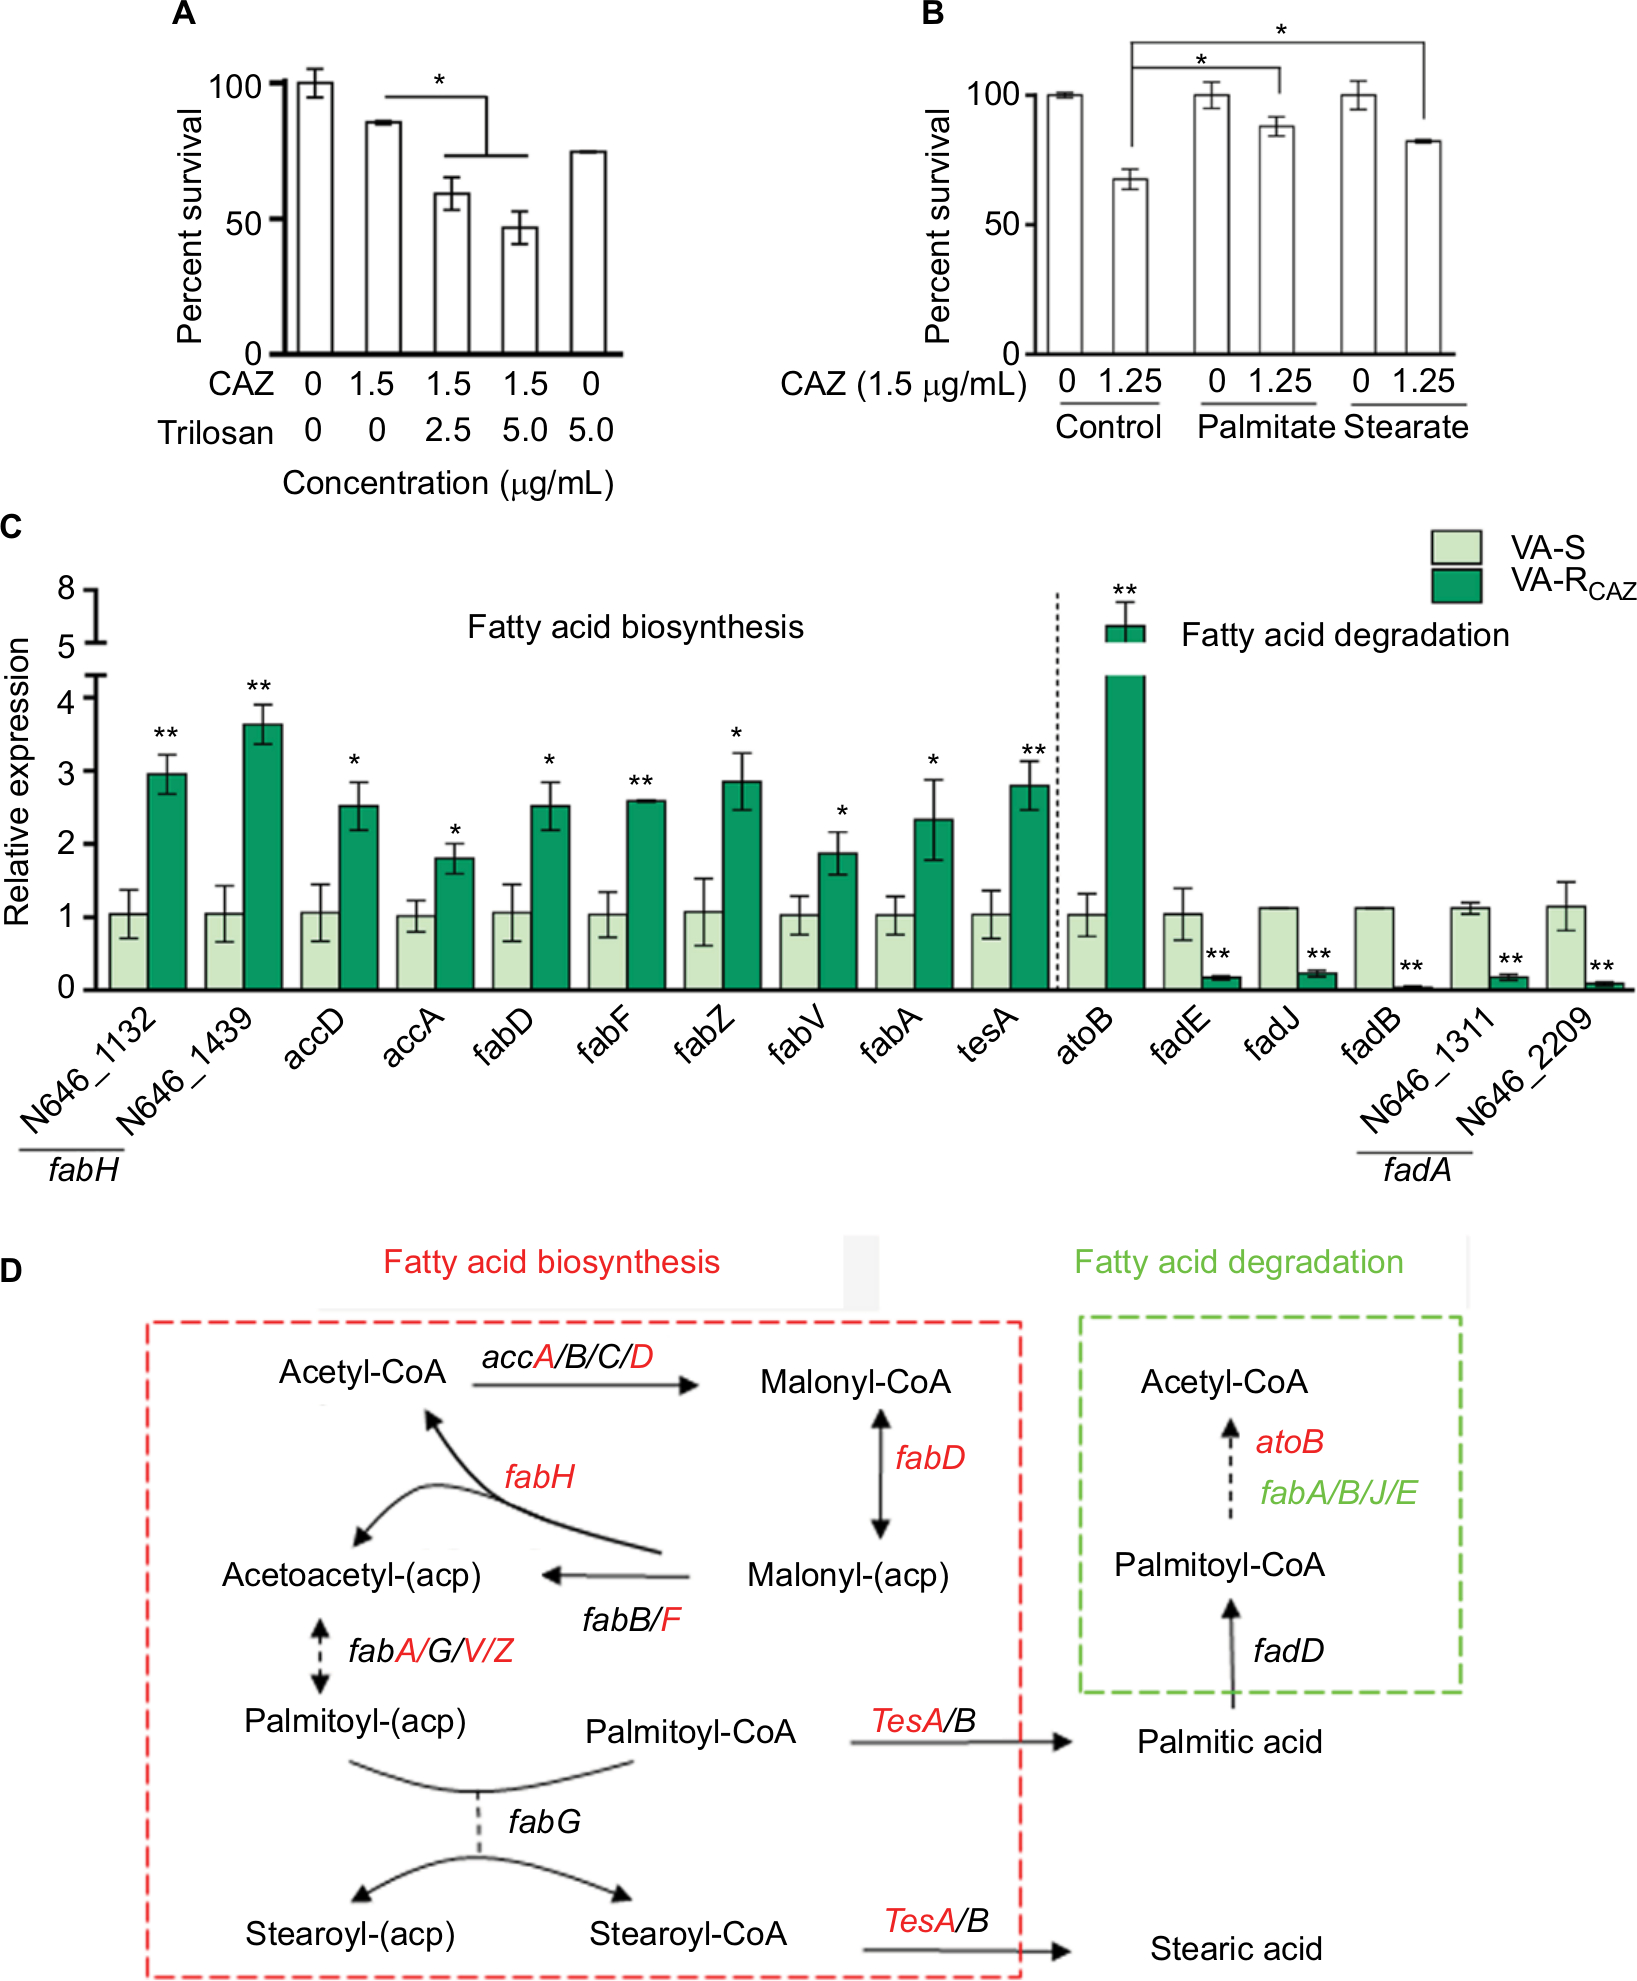 | Figure 7 Fatty acid metabolism and resistance to CAZ. Notes: (A) Percent survival of VA-RCAZ in the presence of the indicated triclosan plus CAZ. Overnight VA-RCAZ were incubated with CAZ (1.5 µg/mL) plus triclosan (2.5, 5 µg/mL) in M9 minimal medium plus NaAc (10 mM) at 30°C for 6 hours. (B) Percent survival of VA-S incubated in LB medium with exogenous palmitate or stearate, and then in M9 medium with CAZ (1.5 µg/mL). Overnight VA-S, cultured in LB with 0.2 mM of palmitate or stearate, were incubated with CAZ (1.25 µg/mL) in M9 minimal medium plus NaAc (10 mM) for 6 hours. (C) Quantitative real-time PCR for expression of genes in fatty acid metabolism. Overnight VA-S and VA-RCAZ were diluted to 1:100 using fresh 3% NaCl LB medium and grown at 30°C for 3 hours. (D) Outline for expression of genes in fatty acid metabolism pathway. Red: increase, green: decrease. Results (A–C) are displayed as mean ± SEM, and significant differences are identified as determined by Student’s t-test. *P<0.05, **P<0.01. At least three biologic repeats were carried out. Abbreviations: CAZ, ceftazidime; LB, Luria–Bertani; VA-RCAZ, ceftazidime-resistant Vibrio alginolyticus; VA-S, ceftazidime-sensitive Vibrio alginolyticus. |
Discussion
It has been proposed that deregulation of critical cellular metabolic pathways, including carbon and energy metabolism, plays a role in or can modulate resistance of pathogenic bacteria to small-molecule drugs, including antibiotics.19,22,32 Here, we analyzed the metabolomes of CAZ-resistant and CAZ-sensitive V. alginolyticus using GC-MS and identified pathways and biomarkers that could play a direct or indirect role in CAZ resistance in V. alginolyticus. More specifically, the results suggest that an inefficient P cycle, low/altered energy production/metabolism, and increased biosynthesis of fatty acids contribute to the resistance of VA-RCAZ to CAZ. Importantly, these findings could support future development of methods to restore susceptibility of Vibrio species to cephalosporin antibiotics.
GC-MS-based metabolomics has been used to investigate metabolic characteristics in antibiotic-resistant bacteria, and metabolic response to antibiotics in bacteria.19,22,32,33 Peng et al identified alanine, aspartate, and glutamate metabolism and decreased abundance of alanine, glutamate, glucose, and fructose as the key pathways and crucial biomarkers in kanamycin-resistant Edwardsiella tarda, respectively.19 Exogenous alanine, glutamate, glucose, or fructose reprogrammed antibiotic-resistant metabolome to antibiotic-sensitive metabolome and thereby promoted antibiotic uptake,19,21 which was P cycle dependent.22 In addition, Ye et al indicated that alanine metabolism promoted ROS production and glucose elevated glycine, serine, and threonine metabolism, which facilitated kanamycin-mediated killing of antibiotic-resistant bacteria.34,35 The present study investigated the mechanism of CAZ resistance in VA-RCAZ and found results similar to those previously reported for kanamycin-resistant Edwardsiella tarda.19 In particular, an inefficient P cycle, decreased abundance of metabolites in the upper cycle, and increased abundance of metabolites in the lower cycle were observed in both drug-resistant strains. We confirmed low activity of PDH, CS, OGDH, MDH, and ICL, and high activity of SDH in VA-RCAZ, and showed that furfural and malonate inhibit PDH and SDH and increase resistance of VA-RCAZ to CAZ.
We note that upregulated fatty acid biosynthesis is the most characteristic metabolic feature of VA-RCAZ. Our results also show decreased degradation of fatty acids in VA-RCAZ. However, we hypothesize that an inefficient P cycle, where high and low activity of SDH (to catalyze the oxidation of succinate to fumarate) and MDH (to reversibly catalyze the oxidation of malate to oxaloacetate) lead to decreased abundance of succinic acid and increased abundance of fumaric acid. This promotes flux of acetyl-CoA into fatty acid biosynthesis and links it to altered energy/carbon metabolism in drug-resistant Vibro species.
VA-RCAZ also show altered energy metabolism, deregulation of Na+-NQR, and low membrane potential, all factors that could potentiate and/or contribute to resistance to CAZ (note that ΔnqrA and ΔnqrF mutations are reported to decrease susceptibility to CAZ).36 Consistent with this, membrane potential was reduced in VA-RCAZ, ΔnqrA, and ΔnqrF, and drug resistance of VA-S was potentiated in the presence of respiratory chain inhibitors.
Conclusion
The present study explores the relationship between V. alginolyticus metabolome and CAZ resistance, and identifies an altered and inefficient P cycle, increased biosynthesis of fatty acids, deregulation of Na+-NQR and low membrane PMF (Figure 8). These findings provide insight into mechanisms of resistance to CAZ and other antibiotics, and insight into multidrug resistance in Vibrio and other human pathogens. Importantly, the findings may also support future development of drugs that can prevent and/or manage infections caused by drug-resistant human pathogens.
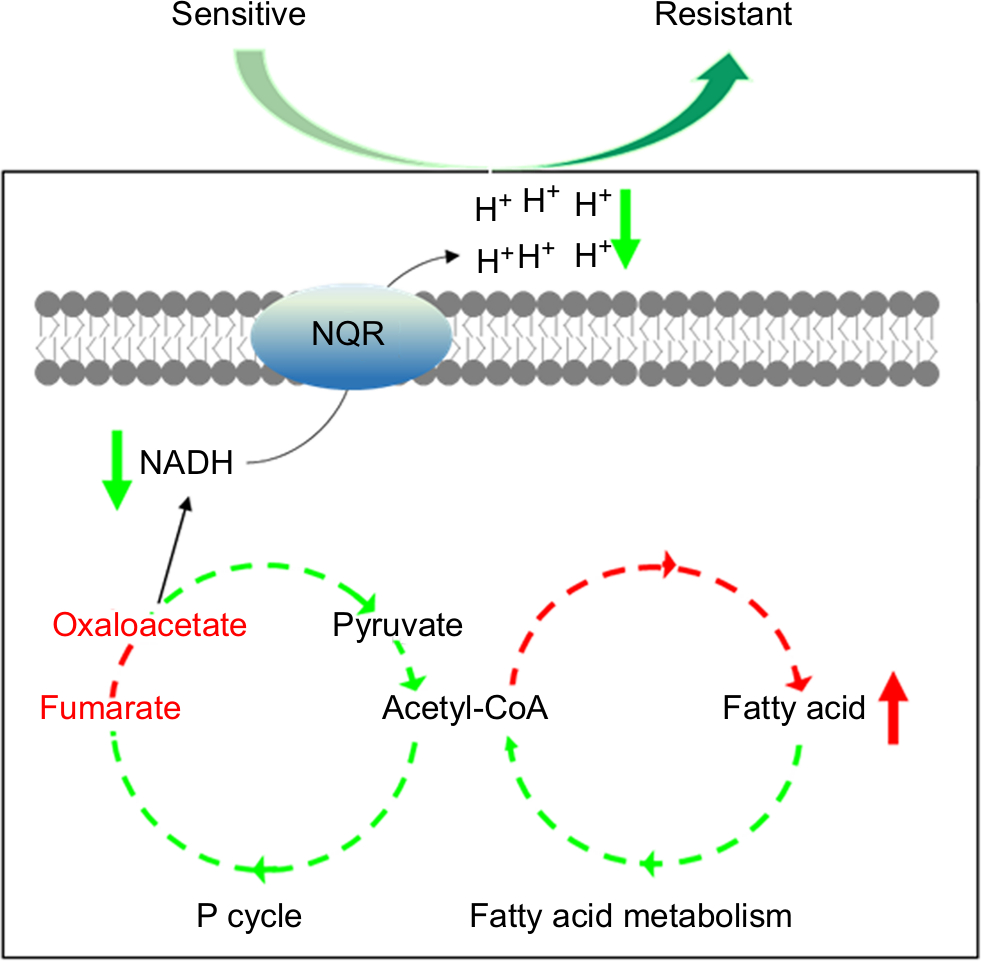 | Figure 8 Model for resistance to ceftazidime in Vibrio alginolyticus. Abbreviations: NADH, nicotinamide adenine dinucleotide; P cycle, pyruvate cycle. |
Acknowledgment
This work was sponsored by grants from key project of Natural Science foundation of Guangdong (2015A030308009), NSFC project (31772888, U1701235, 31472283), and the National Key Research and Development Plan (2016YFD0501307).
Disclosure
The authors report no conflicts of interest in this work.
References
Jones EH, Feldman KA, Palmer A, Butler E, Blythe D, Mitchell CS. Vibrio infections and surveillance in Maryland, 2002-2008. Public Health Rep. 2013;128(6):537–545. | ||
Mechri B, Monastiri A, Medhioub A, Medhioub MN, Aouni M. Molecular characterization and phylogenetic analysis of highly pathogenic Vibrio alginolyticus strains isolated during mortality outbreaks in cultured Ruditapes decussatus juvenile. Microb Pathog. 2017;111:487–496. | ||
Economopoulou A, Chochlakis D, Almpan MA, et al. Environmental investigation for the presence of Vibrio species following a case of severe gastroenteritis in a touristic island. Environ Sci Pollut Res. 2017;24(5):4835–4840. | ||
Raja RA, Sridhar R, Balachandran C, Palanisamy A, Ramesh S, Nagarajan K. Prevalence of vibrios with special reference to Vibrio parahaemolyticus in farmed penaeid shrimp, Penaeus vannamei (Boone, 1931) from selected districts of Tamil Nadu, India. Indian J Fish. 2017;64(3):122–128. | ||
Kang C-H, Shin Y, Jang S, Jung Y, So J-S, Js S. Antimicrobial susceptibility of Vibrio alginolyticus isolated from oyster in Korea. Environ Sci Pollut Res. 2016;23(20):21106–21112. | ||
Hernández-Robles MF, Álvarez-Contreras AK, Juárez-García P, et al. Virulence factors and antimicrobial resistance in environmental strains of Vibrio alginolyticus. Int Microbiol. 2016;19(4):191–198. | ||
Zavala-Norzagaray AA, Aguirre AA, Velazquez-Roman J, et al. Isolation, characterization, and antibiotic resistance of Vibrio spp. in sea turtles from northwestern Mexico. Front Microbiol. 2015;6:635. | ||
Smaldone G, Marrone R, Cappiello S, et al. Occurrence of antibiotic resistance in bacteria isolated from seawater organisms caught in Campania region: preliminary study. BMC Vet Res. 2014;10(1):161. | ||
Zanetti S, Spanu T, Deriu A, Romano L, Sechi LA, Fadda G. In vitro susceptibility of Vibrio spp. isolated from the environment. Int J Antimicrob Agents. 2001;17(5):407–409. | ||
Li J, Yie J, Fu W, et al. [Antibiotic resistance and plasmid profiles of Vibrio isolates from cultured Sparus sarba]. Wei Sheng Wu Xue Bao. 1999;39(5):461–468. | ||
Vila-Farres X, Chu J, Ternei MA, et al. An optimized synthetic-bioinformatic natural product antibiotic sterilizes multidrug-resistant Acinetobacter baumannii -infected wounds. mSphere. 2018;3(1): e00528–17. | ||
Paharik AE, Schreiber HL, Spaulding CN, Dodson KW, Hultgren SJ. Narrowing the spectrum: the new frontier of precision antimicrobials. Genome Med. 2017;9(1):110. | ||
Tacconelli E, Sifakis F, Harbarth S, et al. Surveillance for control of antimicrobial resistance. Lancet Infect Dis. 2018;18(3):e99–e106. | ||
Blair JM, Webber MA, Baylay AJ, Ogbolu DO, Piddock LJ. Molecular mechanisms of antibiotic resistance. Nat Rev Microbiol. 2015;13(1):42–51. | ||
Rajpara N, Nair M, Bhardwaj AK. A highly promiscuous integron, plasmids, extended spectrum beta lactamases and efflux pumps as factors governing multidrug resistance in a highly drug resistant Vibrio fluvialis Isolate BD146 from Kolkata, India. Indian J Microbiol. 2018;58(1):60–67. | ||
Teschler JK, Cheng AT, Yildiz FH. The two-component signal transduction system VxrAB positively regulates Vibrio cholerae biofilm formation. J. Bacteriol. 2017;199(18):e00139–17. | ||
Acosta-Smith E, Viveros-Jiménez K, Canizalez-Román A, et al. Bovine lactoferrin and lactoferrin-derived peptides inhibit the growth of Vibrio cholerae and other Vibrio species. Front Microbiol. 2017;8:2633. | ||
Bina XR, Howard MF, Taylor-Mulneix DL, Ante VM, Kunkle DE, Bina JE. The Vibrio cholerae RND efflux systems impact virulence factor production and adaptive responses via periplasmic sensor proteins. PLoS Pathog. 2018;14(1):e1006804. | ||
Peng B, Su YB, Li H, et al. Exogenous alanine and/or glucose plus kanamycin kills antibiotic-resistant bacteria. Cell Metab. 2015;21(2):249–262. | ||
Allison KR, Brynildsen MP, Collins JJ. Metabolite-enabled eradication of bacterial persisters by aminoglycosides. Nature. 2011;473(7346):216–220. | ||
Su YB, Peng B, Han Y, Li H, Peng XX. Fructose restores susceptibility of multidrug-resistant Edwardsiella tarda to kanamycin. J Proteome Res. 2015;14(3):1612–1620. | ||
Su YB, Peng B, Li H, et al. Pyruvate cycle increases aminoglycoside efficacy and provides respiratory energy in bacteria. Proc Natl Acad Sci U S A. 2018;115(7):E1578–E1587. | ||
Cheng ZX, Yang MJ, Peng B, Peng XX, Lin XM, Li H. The depressing central carbon and energy metabolisms mediate levofloxacin resistance in Vibrio alginolyticus. J Proteomics. 2018;181:83–91. | ||
Yang J, Zeng ZH, Yang MJ, Cheng ZX, Peng XX, Li H. NaCl promotes antibiotic resistance by reducing redox states in Vibrio alginolyticus. Environ Microbiol. 2018;20(11):4022–4036. | ||
Xu C, Lin X, Ren H, Zhang Y, Wang S, Peng X. Analysis of outer membrane proteome of Escherichia coli related to resistance to ampicillin and tetracycline. Proteomics. 2006;6(2):462–473. | ||
Yang MJ, Cheng ZX, Jiang M, et al. Boosted TCA cycle enhances survival of zebrafish to Vibrio alginolyticus infection. Virulence. 2018;9(1):634–644. | ||
Meyer MR, Peters FT, Maurer HH. Automated mass spectral deconvolution and identification system for GC-MS screening for drugs, poisons, and metabolites in urine. Clin Chem. 2010;56(4):575–584. | ||
Cheng ZX, Qy G, Wang Z. Edwardsiella tarda tunes tricarboxylic acid cycle to evade complement-mediated killing. Front Immunol. 2017;8:1706. | ||
Li W, Yao Z, Sun L, et al. Proteomics analysis reveals a potential antibiotic cocktail therapy strategy for Aeromonas hydrophila infection in biofilm. J Proteome Res. 2016;15(6):1810–1820. | ||
Livak KJ, Schmittgen TD. Analysis of relative gene expression data using real-time quantitative PCR and the 2(-Delta Delta C(T)) Method. Methods. 2001;25(4):402–408. | ||
Lee HH, Collins JJ. Microbial environments confound antibiotic efficacy. Nat Chem Biol. 2012;8(1):6–9. | ||
Gutierrez A, Jain S, Bhargava P, Hamblin M, Lobritz MA, Collins JJ. Understanding and sensitizing density-dependent persistence to quinolone antibiotics. Mol Cell. 2017;68(6):1147–1154. | ||
Yang JH, Bening SC, Collins JJ. Antibiotic efficacy-context matters. Curr Opin Microbiol. 2017;39:73–80. | ||
Ye JZ, Su YB, Lin XM, et al. Alanine enhances aminoglycosides-induced ROS production as revealed by proteomic analysis. Front Microbiol. 2018;9:29. | ||
Ye JZ, Lin XM, Cheng ZX, et al. Identification and efficacy of glycine, serine and threonine metabolism in potentiating kanamycin-mediated killing of Edwardsiella piscicida. J Proteomics. 2018;183:34–44. | ||
Shea ME, Mezic KG, Juárez O, Barquera B. A mutation in Na(+)-NQR uncouples electron flow from Na(+) translocation in the presence of K(+). Biochemistry. 2015;54(2):490–496. |
 © 2019 The Author(s). This work is published and licensed by Dove Medical Press Limited. The full terms of this license are available at https://www.dovepress.com/terms.php and incorporate the Creative Commons Attribution - Non Commercial (unported, v3.0) License.
By accessing the work you hereby accept the Terms. Non-commercial uses of the work are permitted without any further permission from Dove Medical Press Limited, provided the work is properly attributed. For permission for commercial use of this work, please see paragraphs 4.2 and 5 of our Terms.
© 2019 The Author(s). This work is published and licensed by Dove Medical Press Limited. The full terms of this license are available at https://www.dovepress.com/terms.php and incorporate the Creative Commons Attribution - Non Commercial (unported, v3.0) License.
By accessing the work you hereby accept the Terms. Non-commercial uses of the work are permitted without any further permission from Dove Medical Press Limited, provided the work is properly attributed. For permission for commercial use of this work, please see paragraphs 4.2 and 5 of our Terms.