
Back to Journals » International Journal of General Medicine » Volume 19
Machine Learning-Based Predictive Model for Grade 3 Primary Graft Dysfunction Following Lung Transplantation: A Retrospective Cohort Study
Authors Miao Q, Huang C, Wang K, Wu J 
Received 4 February 2026
Accepted for publication 6 June 2026
Published 21 July 2026 Volume 2026:19 600424
DOI https://doi.org/10.2147/IJGM.S600424
Checked for plagiarism Yes
Review by Single anonymous peer review
Peer reviewer comments 2
Editor who approved publication: Professor Reynold Panettieri Jr
Qing Miao,1 Chengya Huang,2 Kai Wang,1 Jingxiang Wu2
1Department of Anesthesiology, Jiading District Central Hospital, Shanghai University of Medicine and Health Sciences, Shanghai, 201318, People’s Republic of China; 2Department of Anesthesiology, Shanghai Chest Hospital, Shanghai Jiao Tong University, School of Medicine, Shanghai, 200030, People’s Republic of China
Correspondence: Jingxiang Wu, Department of Anesthesiology, Shanghai Chest Hospital, Shanghai Jiao Tong University, School of Medicine, No. 241 Huaihai West Road, Xuhui District, Shanghai, 200030, People’s Republic of China, Email [email protected]
Background: This study aimed to identify key predictors for Grade 3 Primary Graft Dysfunction (PGD) after lung transplantation. Machine learning (ML) algorithm models were constructed for early clinical identification of high-risk PGD patients based on these predictors.
Methods: A total of 297 lung transplant recipients from December 2018 to December 2024 were retrospectively enrolled. Patient classification followed the 2016 International Society for Heart and Lung Transplantation (ISHLT) criteria.
Results: The area under the receiver operating characteristic curve (AUC) values for the logistic regression (LR), K-Nearest neighbors (KNN), random forest (RF), and decision tree (DT) models in validation cohort were 0.6960, 0.6307, 0.9989, and 0.9138, respectively. The RF algorithm was selected as the optimal predictive model for Grade 3 PGD risk after lung transplantation. The RF model showed a maximum net benefit of 0.2837 at a threshold probability of 0.6 in the training set. In the test cohort, the maximum net benefit was 0.3034 at a threshold probability of 0.5. The net benefit difference between the two datasets was minimal (mean difference: − 0.0034). This finding reflected robust generalization capability for the RF model. The most influential features for the RF model’s predictions were intraoperative red blood cell transfusion volume, preoperative oxygenation index, donor cold ischemia time, preoperative NT-proBNP, white blood cell count, use of cardiopulmonary bypass (CPB) during surgery, and CRP level.
Conclusion: The RF model effectively predicted the risk of Grade 3 PGD after lung transplantation. This model showed potential for providing decision support in the early identification of high-risk patients.
Keywords: machine learning algorithms, lung transplantation, early lung injury, primary graft dysfunction, predictive model
Introduction
Lung transplantation has become the definitive treatment for various end-stage pulmonary diseases. Approximately 4500 such procedures are performed globally each year.1 Although the number of lung transplants increases steadily annually, a significant gap persists between the supply and demand of available organs. Moreover, certain rare primary diseases still pose a risk of recurrence after transplantation.2 Primary Graft Dysfunction (PGD) describes any functional or morphological injury to the pulmonary allograft. This injury occurs within the first 72 hours after lung transplantation. PGD represents a leading cause of early morbidity and mortality. Its incidence is approximately 30%.3,4 According to the 2016 International Society for Heart and Lung Transplantation (ISHLT) definition, PGD is classified into four grades, from Grade 0 to Grade 3. Severe Grade 3 PGD at 48–72 hours post-transplantation shows an incidence of 15–20%.5 Compared to patients with PGD Grade 0, those with Grade 3 PGD within 48 hours experience longer hospital stays. They also require longer intensive care unit stays. Prolonged mechanical ventilation is needed. Higher 90-day mortality is observed (17% vs 9%).4 These adverse outcomes are closely linked to activated molecular pathways. The pathways are active before, during, and after transplantation. Oxidative stress and inflammatory responses are collectively driven.6
Currently, the clinical assessment of PGD primarily relies on the updated grading system proposed by the International Society for Heart and Lung Transplantation (ISHLT) in 2016. This system classifies PGD into grades 0–3 based on the PaO2/FiO2 ratio within the first 72 hours post-surgery, radiographic evidence of diffuse pulmonary infiltrates, and exclusion criteria. Moreover, owing to its relative ease of use and well-defined criteria, the ISHLT standard has become the gold standard for evaluating early graft function in lung transplant centers worldwide and is widely applied in both clinical decision-making and research.7 However, this grading system has three major limitations:8 First, there is a diagnostic delay inherent to its exclusion-based approach. A confirmed diagnosis requires the rigorous exclusion of complications such as left heart failure, pulmonary infection, and bronchial stenosis—conditions that may independently exacerbate lung injury and thereby “amplify” the perceived PGD grade, confounding accurate assessment. Second, the system has insufficient inter-rater reliability due to its subjective nature. Interpretation of infiltrate extent on chest radiographs is subjective, leading to poor inter-rater agreement. Moreover, grading results may vary across time points (T0, T24, T48, T72), limiting the ability to reflect the patient’s overall clinical trajectory. Third, the system lacks early predictive capability. By nature, it functions as a post-event diagnostic tool and cannot identify PGD risk before or during surgery.
In recent years, researchers have attempted to develop machine learning (ML)-based risk prediction models for PGD to address these shortcomings. Compared with traditional regression methods, ML can extract key features more accurately and effectively handle issues such as multivariate interactions and multicollinearity.9 Furthermore, owing to its capacity to identify patterns in large-scale data and continuously refine predictive accuracy, ML has been widely applied in various clinical scenarios,10 including outcome prediction in lung transplant recipients11 and PGD prediction in patients with systemic sclerosis undergoing lung transplantation.12 In the field of PGD prediction, Diamond et al13 developed a preoperative algorithm based on donor and recipient characteristics. However, its area under the curve (AUC) values were generally low (0.66–0.76), and because it was built on historical data, it may not be applicable to contemporary lung transplant practice. Other studies have attempted to integrate intraoperative variables using ML algorithms such as XGBoost for real-time prediction of grade 3 PGD. Although some progress has been made, challenges remain, including overfitting to single-center data, a lack of external validation, and insufficient model interpretability.14 Therefore, there is an urgent clinical need for a tool capable of identifying patients at high risk for grade 3 PGD either before surgery or in the very early postoperative period, enabling targeted monitoring or preventive intervention.
Therefore, this study aimed to develop and validate a ML model based on preoperative and early intraoperative variables for early risk prediction of Grade 3 PGD after lung transplantation. To enhance clinical credibility and usability, the study also incorporates SHapley Additive exPlanations (SHAP) to provide both global and individual-level interpretability analyses.
Materials and Methods
Patient Characteristics
This retrospective study enrolled 297 patients who underwent lung transplantation at our institution between December 2018 and December 2024. The inclusion criteria were as follows: (1) age ≥ 18 years; (2) elective lung transplantation performed at our hospital; (3) postoperative survival time ≥ 72 hours; and (4) availability of complete clinical data. Patients were excluded based on the following criteria: (1) those undergoing re-do lung transplantation; (2) those receiving combined multi-organ transplantation; (3) those on long-term immunosuppressive therapy prior to surgery; or (4) those with a documented history of psychiatric disorders.
Grade 3 PGD, defined according to the 2016 updated criteria from the International Society for Heart and Lung Transplantation (ISHLT),5 was used as the outcome event representing early postoperative lung injury. The diagnostic criteria for Grade 3 PGD was as follows: the presence of diffuse pulmonary infiltrates on chest radiography within 72 hours post-transplantation, a ratio of arterial oxygen partial pressure to fractional inspired oxygen (PaO2/FiO2) < 200, or the need for extracorporeal membrane oxygenation (ECMO) support irrespective of the oxygenation index. In contrast, Grade 0 PGD was defined as the absence of any radiographic evidence of pulmonary edema. Based on these diagnostic criteria, 91 patients meeting the criteria for Grade 3 PGD were defined as the Grade 3 PGD group, while 206 patients meeting the criteria for Grade 0 PGD were defined as the Grade 0 PGD group. The Institutional Medical Ethics Committee of Shanghai Chest Hospital reviewed and approved the study protocol. Shanghai Chest Hospital is affiliated with Shanghai Jiao Tong University School of Medicine. The study design was retrospective.
Sample Size Estimation and Post-Hoc Statistical Power Verification
The sample size for this study was estimated based on the Events Per Variable (EPV) rule for logistic regression models,15 using the following formulae:
n = EPV × k; N = n/p.
Here, n represented the required number of positive events (ie, cases developing Grade 3 PGD after lung transplantation). The EPV represented the number of events required per predictor variable and was set within the conventional range of 10 to 20. The variable k indicated the final number of predictor variables anticipated for inclusion, which was approximately 8. The parameter p signified the anticipated incidence rate of positive events (ie, the proportion of patients developing Grade 3 PGD post-lung transplantation). N mean the calculated total sample size. According to the EPV principle, a minimum of 10 positive events per predictor variable was required. Therefore, this study necessitated at least 80 patients with postoperative Grade 3 PGD. Based on published literature reporting an incidence rate of Grade 3 PGD following lung transplantation between 25% and 30%,16,17 the total required sample size was calculated to range from 266 to 320 patients. Given a 10% missing rate, the total sample size ranged between 295 and 355.
To ensure the statistical robustness of model development and validation, a post-hoc power analysis was performed using G*Power 3.1 software. The parameters were configured as follows: the test family was selected as “z tests,” the statistical test was set to “Logistic regression,” and the significance level (α) was defined as 0.05. The final study sample size was 297. The effect size was based on the maximum odds ratio (OR = 51.571) of the most influential predictor identified in this study. The expected event rate in the exposed group under the null hypothesis (Pr(Y=1|X=1) H0) was estimated using the actual incidence of grade 3 PGD (57.81%; 74/128) among patients in the CPB group from our data. The calculated statistical power (1-β) was 1.000, which fully satisfied the statistical power requirement for model development.
Collection of Clinical Data
This study extracted and compiled existing clinical data from the electronic medical record dataset of Shanghai Chest Hospital, affiliated with Shanghai Jiao Tong University School of Medicine. The parameters included age, gender, smoking history, alcohol consumption history, body mass index (BMI), the preoperative diagnosis of pulmonary hypertension, the preoperative diagnosis of idiopathic pulmonary fibrosis (IPF), and donor-recipient size matching. Surgical details comprised the surgical approach, warm ischemia time, and donor cold ischemia time. Intraoperative extracorporeal life support technology (including cardiopulmonary bypass (CPB) or extracorporeal membrane oxygenation (ECMO)) and the volume of intraoperative red blood cell transfusion were recorded. Laboratory parameters included white blood cell count (WBC), preoperative oxygenation index, preoperative N-terminal pro-brain natriuretic peptide (NT-proBNP), albumin (ALB), alanine aminotransferase (ALT), and C-reactive protein (CRP).
Development and Performance Evaluation of Machine Learning Models
This study first identified independent predictive variables through univariate and multivariate logistic regression analysis. Subsequently, risk prediction models for Grade 3 PGD were constructed based on four ML algorithms: Logistic Regression (LR), K-Nearest Neighbors (KNN), Random Forest (RF), and Decision Tree (DT). The procedure was as follows: First, the overall dataset was randomly split into training and validation sets at a 7:3 ratio using R software (version 4.3.2). The training set then underwent data preprocessing: continuous predictive variables (eg, donor cold ischemia time, WBC, preoperative oxygenation index) were standardized using Z-score normalization to eliminate scale effects. No variables had missing values; hence, imputation was not performed. During the model optimization phase, hyperparameter tuning for each algorithm was performed using the caret package combined with grid search. Key parameters adjusted included: the regularization parameter λ for LR, the number of neighbors k for KNN, the number of trees (ntree) and the number of features considered at each split (mtry) for RF, as well as the maximum depth (maxdepth) and complexity parameter (cp) for DT. All possible parameter combinations were evaluated, and the optimal configuration was selected based on the highest Area Under the Receiver Operating Characteristic Curve (AUC). Model validation was conducted using the pROC and caret packages. Performance metrics included sensitivity, specificity, accuracy, F1-score (computed via the MLmetrics package), and AUC (calculated using the pROC package). Following model evaluation, the SHAP (SHapley Additive exPlanations) toolkit was employed to compute feature SHAP values for each sample in the test set. Based on these values, three types of interpretability plots were generated: (1) A feature importance bar plot, ranking features by the mean absolute SHAP value in descending order, illustrating the global contribution of each variable to predictions; (2) A SHAP summary (beeswarm) plot, displaying the relationship between feature values and SHAP values via scatter points. This plot integrates feature importance (vertical axis), impact direction (horizontal axis), and feature magnitude (color scale) to comprehensively reveal variable importance, effect direction, and association patterns with values; (3) SHAP dependence plots, which were used to further investigate the contribution of individual features to model output. A random seed was set throughout all analyses to ensure the reproducibility of the results.
Statistical Analysis
Data processing and modeling were performed using SPSS 22.0 and R 4.3.2. Continuous variables conforming to a normal distribution were presented as mean ± standard deviation. Comparisons between groups for these variables were conducted using the independent samples t-test. Continuous variables that did not follow a normal distribution were expressed as median M (P25, P75), and the non-parametric Mann–Whitney U-test was employed for intergroup comparisons. Categorical variables were summarized as frequency (percentage) [n (%)], and differences between groups were analyzed using the chi-square (χ2) test. A two-tailed P-value of less than 0.05 was considered statistically significant.
Results
Univariate Analysis of Factors Influencing the Risk of Grade 3 PGD After Lung Transplantation
Compared with the Grade 0 PGD group, the Grade 3 PGD group showed significantly higher values in the following parameters: age, BMI, proportion of patients with a preoperative diagnosis of pulmonary hypertension, proportion of donor-recipient size mismatch, donor cold ischemia time, intraoperative CPB, volume of intraoperative red blood cell transfusion, WBC count, and preoperative levels of NT-proBNP and CRP (p < 0.05, Table 1). Conversely, the preoperative oxygenation index was significantly lower in the Grade 3 PGD group (p < 0.05, Table 1). No statistically significant differences were observed between the two groups, including gender, smoking history, alcohol history, preoperative diagnosis of IPF, surgical approach, warm ischemia time, ALB levels, or ALT levels (p > 0.05, Table 1).
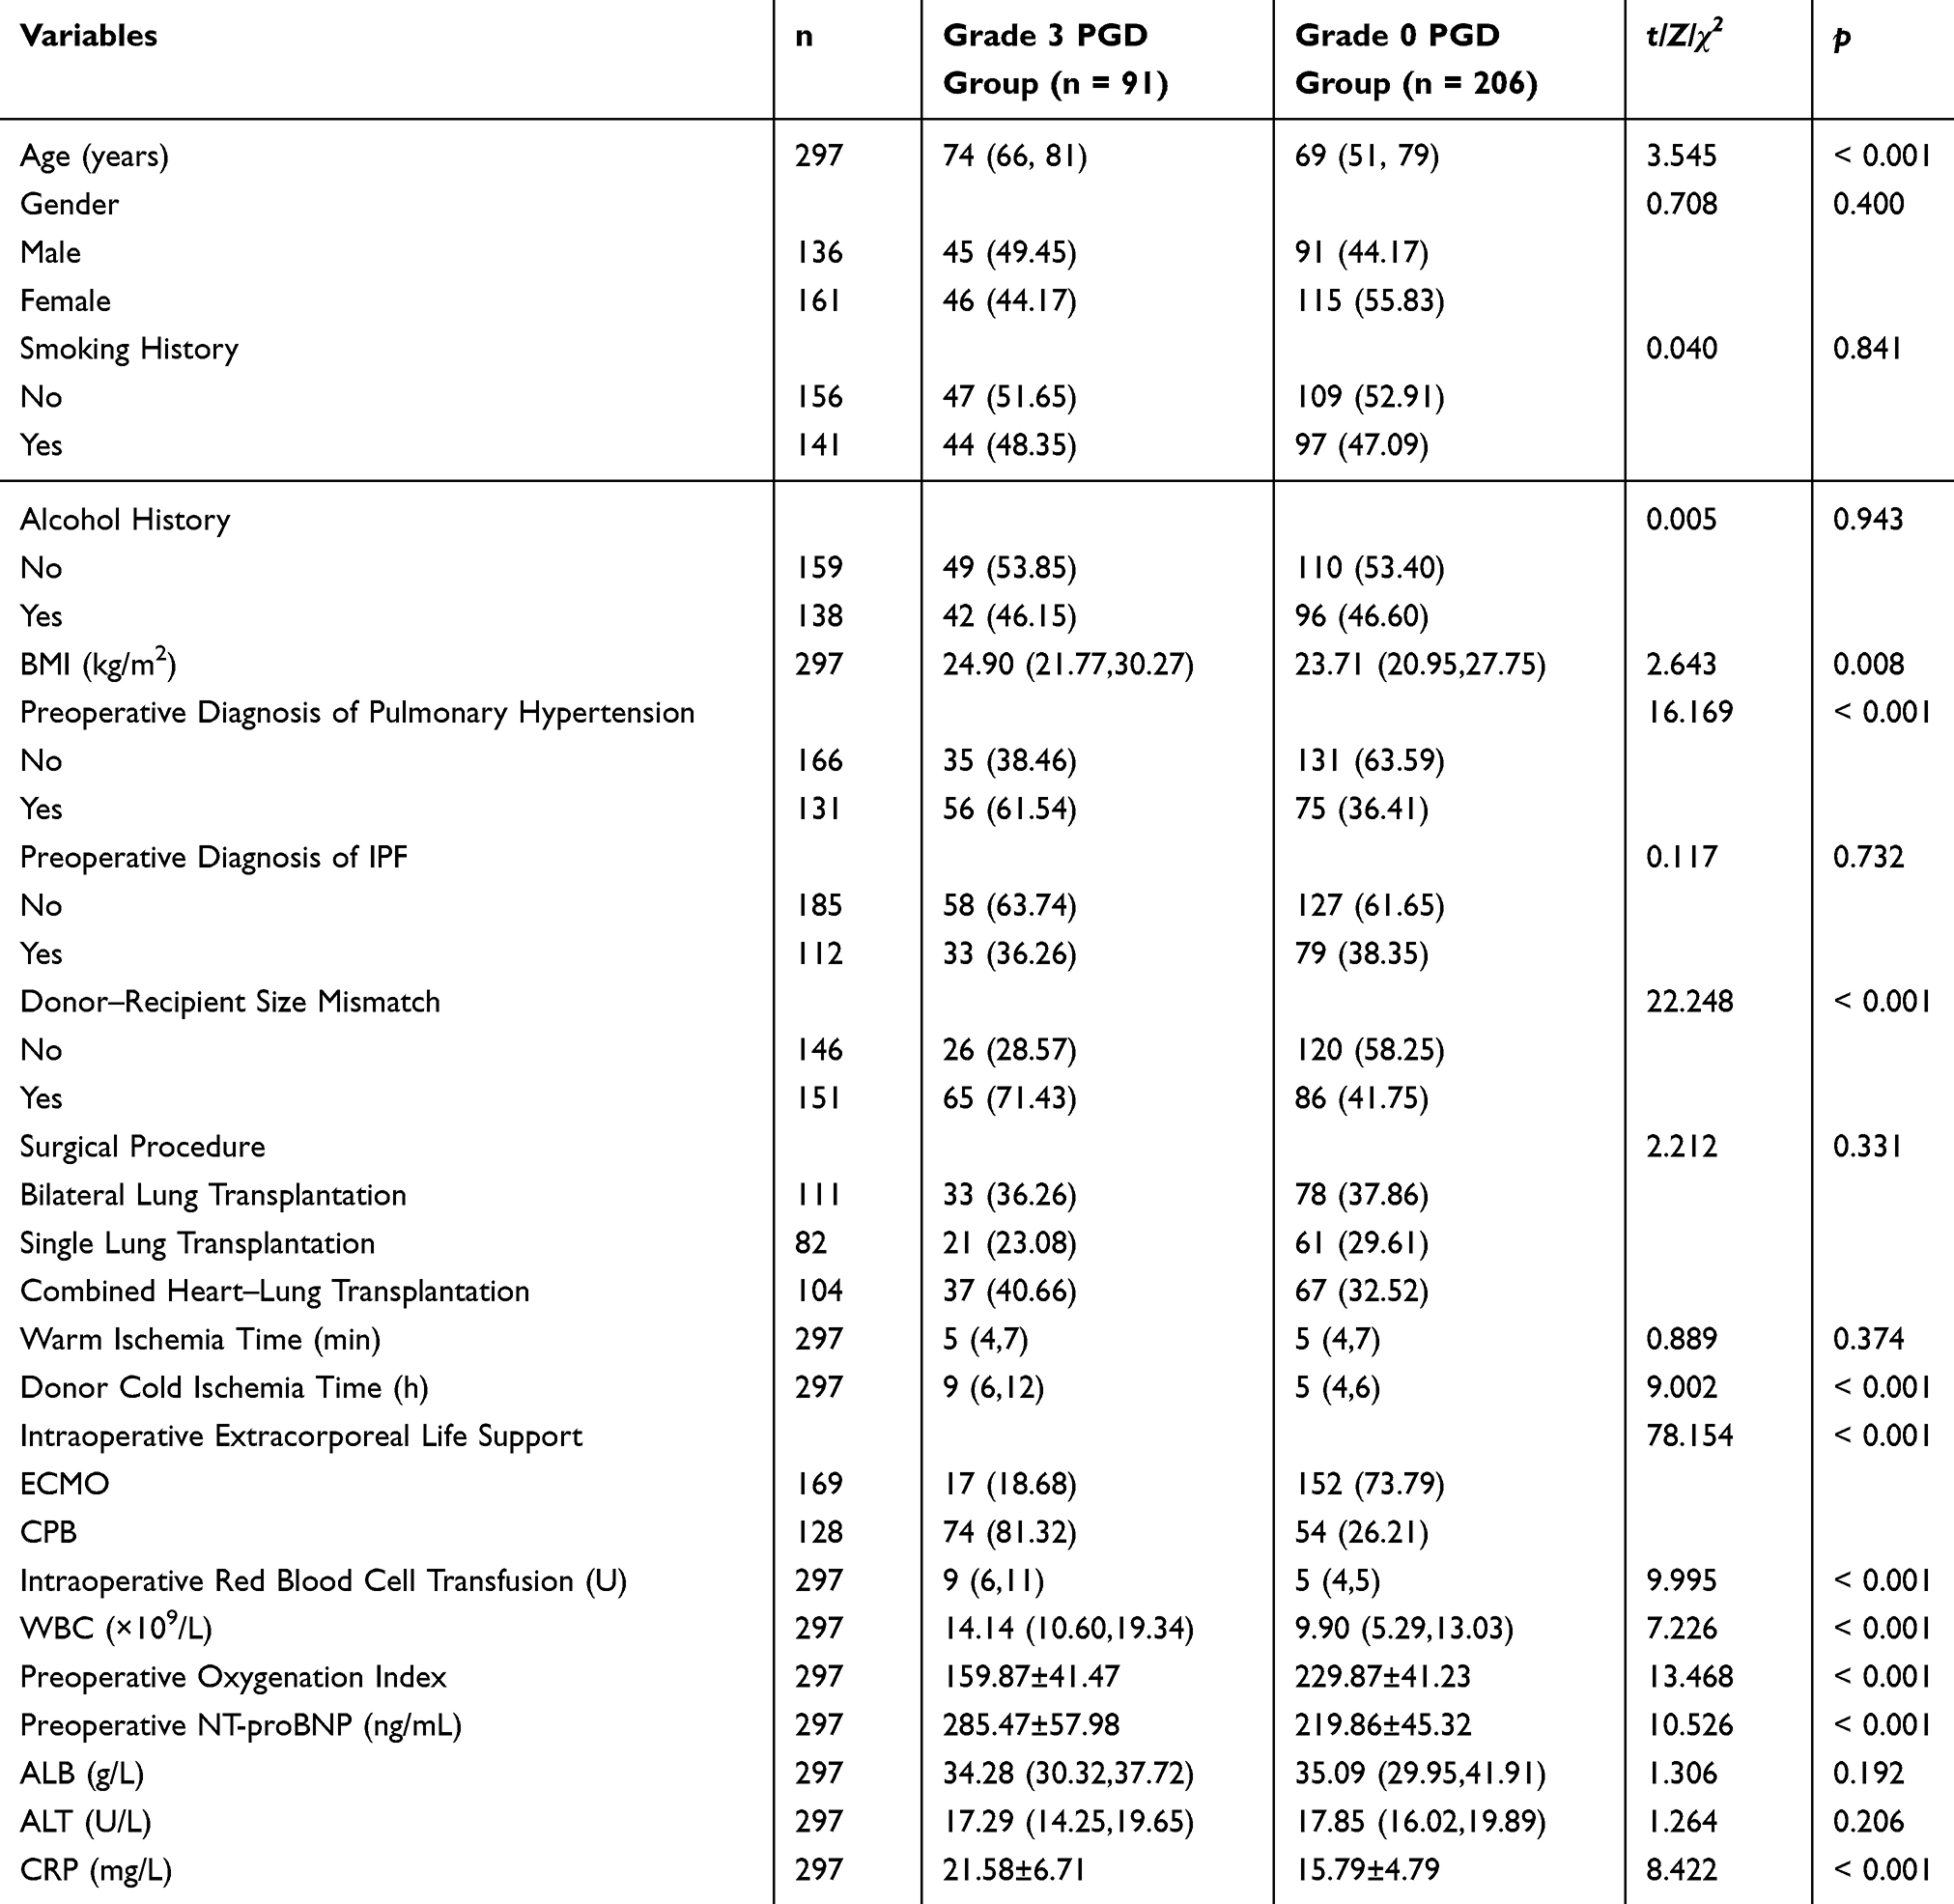 |
Table 1 Univariate Analysis of Factors Influencing the Risk of Grade 3 PGD After Lung Transplantation |
Multivariate Logistic Regression Analysis of Factors Influencing the Risk of Grade 3 PGD After Lung Transplantation
Early postoperative lung injury status served as the dependent variable. Grade 3 PGD was defined as 1. Grade 0 PGD was defined as 0. First, collinearity diagnostics were performed. The forward stepwise method was used. Eleven factors were examined. These factors showed significance in the univariate analysis. The variance inflation factor was calculated for each variable. Eight variables had a VIF below 5. These variables included preoperative pulmonary hypertension diagnosis, donor cold ischemia time, intraoperative CPB use, intraoperative red blood cell transfusion volume, WBC count, preoperative oxygenation index, preoperative NT-proBNP, and CRP. Multicollinearity was absent among these eight variables. Therefore, these eight variables were selected for multivariate logistic regression analysis. The forward stepwise method was applied again. The analysis revealed that donor cold ischemia time, intraoperative CPB, volume of intraoperative red blood cell transfusion, WBC count, preoperative oxygenation index, preoperative NT-proBNP, and CRP were all independent influencing factors for the risk of Grade 3 PGD after lung transplantation (p < 0.05, Table 2).
 |
Table 2 Multivariate Logistic Regression Analysis of Factors Influencing the Risk of Grade 3 PGD After Lung Transplantation |
Development and Performance Evaluation of Machine Learning-Based Models for Predicting Grade 3 PGD Risk After Lung Transplantation
The seven independent predictors (donor cold ischemia time, intraoperative CPB, intraoperative red blood cell transfusion volume, WBC, preoperative oxygenation index, preoperative NT-proBNP, and CRP) identified via multivariate logistic regression analysis in section “2.2” were used as input features to construct ML models for predicting postoperative Grade 3 PGD risk in lung transplant recipients. Subsequently, multiple ML algorithms were employed to build these prediction models (Table 3 and Figure 1). In the training set, the LR, KNN, RF, and DT models achieved AUCs of 0.6576, 0.8025, 0.9983, and 0.9675; sensitivities of 48.08%, 74.04%, 98.39%, and 90.32%; specificities of 74.04%, 75.00%, 97.26%, and 98.63%; accuracies of 61.06%, 74.52%, 97.60%, and 96.15%; and F1-scores of 0.5525, 0.7440, 0.9606, and 0.9333, respectively. Evaluation on the validation set showed AUCs of 0.6960, 0.6307, 0.9989, and 0.9138; sensitivities of 57.14%, 59.52%, 100.00%, and 82.76%; specificities of 76.60%, 61.70%, 96.67%, and 91.67%; accuracies of 67.42%, 60.67%, 97.75%, and 88.76%; and F1-scores of 0.6234, 0.5882, 0.9667, and 0.8276 for the LR, KNN, RF, and DT models, respectively. Among them, the RF model outperformed others in terms of AUC and F1-score. Based on a comprehensive assessment of AUC, sensitivity, specificity, accuracy, and F1-score, the RF algorithm was ultimately determined to be the optimal predictive model for postoperative Grade 3 PGD risk in lung transplant patients.
 |
Table 3 Comparison of Predictive Performance of Machine Learning Algorithm Models in Training and Validation Sets |
 |
Figure 1 Comparison of predictive performance of machine learning algorithm models. (A) Training set; (B) Validation set. |
Clinical Value Assessment of the Optimal ML Model
DCA was performed to evaluate the clinical utility of the RF model (Figure 2). The results indicated that the net benefit reached its maximum in the Training set (0.2837) at a threshold probability of 0.6, and in the validation set (0.3034) at a threshold probability of 0.5. The minimal difference in net benefit between the Training and Validation sets (mean difference: −0.0034) reflected the model’s robust generalization ability. Notably, the net benefit remained consistently high (above 0.25) with the low to intermediate threshold probability range (0.1–0.7) (Figure 3), suggesting that the model provided stable and reliable clinical decision support for patients with varying risk levels.
 |
Figure 2 Decision curve analysis (DCA) of the random forest (RF) model. |
 |
Figure 3 Net benefit comparison of the RF model between the Training and Validation sets. |
Model Interpretability Analysis Based on SHAP
SHAP summary plots visualized the distribution of feature contributions within the model (Figure 4). The x-axis showed the SHAP value. SHAP value quantifies the direction and magnitude of a feature’s impact on the prediction output. A negative SHAP value (< 0) indicated a negative contribution. Negative contributions were associated with lower risk. Zero signifies no significant contribution. A positive value (> 0) indicated a positive contribution. Positive contributions were associated with higher risk. The y-axis listed features. Features were ranked in descending order of their overall importance. A yellow-purple color scale encoded the actual feature values. Yellow represented high values, specifically, the normalized maximum. Purple represented low values, specifically the normalized minimum.
 |
Figure 4 SHAP summary plot of feature distributions. |
The analysis revealed (Figure 4) that six features—intraoperative red blood cell transfusion volume, preoperative NT-proBNP, donor cold ischemia time, WBC count, intraoperative CPB, and CRP level—exhibited distributions extending predominantly towards positive SHAP values and were associated with higher (yellower) feature values. This pattern suggested that higher levels of these six indicators were associated with an increased risk of Grade 3 PGD. In contrast, the preoperative oxygenation index also extended towards positive SHAP values; it was associated with lower (purpler) feature values, indicating that a lower preoperative oxygenation index was associated with a higher PGD risk.
Figure 5 further quantified the mean absolute impact of each feature on the model output. The y-axis maintained the feature importance ranking. The x-axis plotted the mean absolute SHAP value. The mean absolute SHAP analysis revealed the most important features. Feature importance was presented in descending order: intraoperative red blood cell transfusion volume, preoperative oxygenation index, donor cold ischemia time, preoperative NT-proBNP, WBC count, intraoperative CPB, and CRP level.
 |
Figure 5 SHAP feature importance ranking. |
SHAP Dependence Plot Analysis for Individual Variables
To further elucidate the contribution of individual features to the model’s predictions, we generated and analyzed SHAP dependence plots for key variables. These plots clearly delineated the relationship between the value of a single feature and its corresponding SHAP value. The analysis revealed that the SHAP values for intraoperative red blood cell transfusion volume, preoperative NT-proBNP, donor cold ischemia time, WBC count, intraoperative CPB, and CRP level exhibited a gradually increasing trend with the increased their respective values (Figure 6). This indicated that higher levels or a higher proportion of these features represent an increased risk of Grade 3 PGD. Conversely, the SHAP value for the preoperative oxygenation index gradually decreased with its value increase, demonstrating that a higher level of this feature suppresses the risk of Grade 3 PGD.
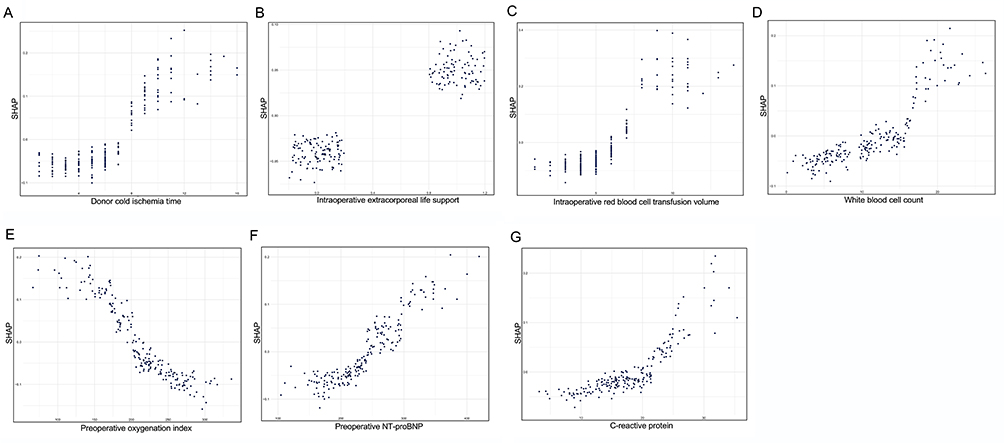 |
Figure 6 SHAP dependence plots for individual variables. (A) Donor cold ischemia time; (B) Intraoperative extracorporeal life support (CPB); (C) Intraoperative red blood cell transfusion volume; (D) White blood cell count (WBC); (E) Preoperative oxygenation index; (F) Preoperative NT-proBNP; (G) C-reactive protein (CRP). |
Discussion
In this study, among 297 lung transplant patients, 91 developed grade 3 PGD postoperatively, with an incidence rate of 30.64%. This figure was largely consistent with previously reported data (approximately 30% incidence).18 Based on data from these 297 lung transplant patients, donor cold ischemia time, intraoperative use of CPB, volume of intraoperative red blood cell transfusion, WBC, preoperative oxygenation index, preoperative NT-proBNP, and CRP were identified as independent predictors for grade 3 PGD. Additionally, a high-accuracy, interpretable machine learning prediction model using the RF algorithm as its core was successfully constructed.
Multivariable logistic regression revealed that prolonged cold ischemia time significantly increased the risk of grade 3 PGD (OR = 2.247, P = 0.010). This increased risk may be largely attributable to severe downregulation of tight junction protein ZO-1, epithelial sodium channel (ENaC), and cystic fibrosis transmembrane conductance regulator (CFTR) in alveolar cells of donor grafts from PGD patients. Such downregulation likely contributed to the development of PGD.19 Intraoperative use of extracorporeal life support technology, particularly CPB, demonstrated strong predictive power in this study (OR = 51.571, P = 0.003). This result is consistent with conclusions from multiple studies.20,21 Contact between blood and foreign surfaces like CPB tubing activates various immune cells. This activation promotes elevated levels of pro-inflammatory indicators such as interleukin-6, WBC, and CRP. Subsequently, pulmonary vascular endothelial barrier function is disrupted, pulmonary edema formation is accelerated, and ultimately PGD occurrence and progression are promoted.20,21 WBC, as a marker of systemic inflammatory state, also showed a significant association with grade 3 PGD risk in this study (OR = 1.332, P = 0.026). This finding echoes the inflammatory cascade triggered by CPB and transfusion. It further supports the central role of inflammation in PGD pathogenesis. The volume of intraoperative red blood cell transfusion was also confirmed as an independent risk factor (OR = 3.777, P = 0.002). The mechanism primarily involves two aspects.22 First, massive transfusion can suppress recipient immune function and may introduce exogenous pathogens, increasing postoperative infection risk. Second, transfusion may induce transfusion-related acute lung injury. These factors collectively exacerbate pulmonary inflammation and tissue damage, promoting grade 3 PGD progression. CRP, as an acute-phase inflammatory marker, was also an independent predictor in this study (OR = 1.300, P = 0.017). Its elevation is closely related to CPB, transfusion, and systemic inflammatory state. This further reinforces inflammation as a core pathological pathway in PGD. Elevated preoperative NT-proBNP levels were also independently associated with grade 3 PGD risk (OR = 1.046, P = 0.013). Although Leon’s team23 did not find an association between NT-proBNP levels and grade 1–3 PGD development in lung transplant patients, elevated levels were accompanied by higher postoperative mortality. This suggests close monitoring of preoperative NT-proBNP expression in lung transplant patients can effectively reduce postoperative mortality. It must be noted that the model in this study indicated the preoperative oxygenation index acted as a protective factor (OR = 0.946, P = 0.006). Lower values were associated with higher grade 3 PGD risk, differs from the view of Prekker et al.24 However, the machine learning approach in this study may have more sensitively captured this indicator’s predictive value in a specific clinical context. This highlights its importance as an index for preoperative lung reserve function assessment. However, an important discrepancy exists in this study’s conclusions. Although univariate analysis observed significantly higher age, BMI, and proportion of preoperative pulmonary hypertension diagnosis in the grade 3 PGD group compared to the grade 0 PGD group, multivariate analysis did not further confirm these as independent predictive factors for grade 3 PGD. This may be because clinical factors like age, BMI, and pulmonary hypertension are not independent. Complex interactions likely exist among them, thus not demonstrating independent predictive roles.
In this study, through rigorous training and testing of a series of ML models including LR, KNN, RF, and DT, a prediction model with high predictive accuracy and good calibration was ultimately obtained (the RF algorithm model). Regarding model performance evaluation: First, the RF algorithm-based model demonstrated high predictive efficacy for estimating postoperative grade 3 PGD risk in lung transplant patients (AUC = 0.9989, F1-score = 0.9667). Its performance was significantly superior to other ML algorithm models. The DCA curve further confirmed this model provides stable and high clinical net benefit within the threshold probability range of 0.1~0.7. These results suggest the model possesses good generalizability and clinical application value. The SHAP interpretability analysis in this study not only identified core predictive variables but also quantified and revealed the direction and strength of each feature’s contribution to grade 3 PGD risk prediction. High SHAP values for intraoperative red blood cell transfusion volume, preoperative NT-proBNP level, donor cold ischemia time, WBC, CPB application, and CRP generally corresponded to positive SHAP values (right side). Low SHAP values for the preoperative oxygenation index corresponded to negative SHAP values (left side). This indicates abnormal levels of these indicators are directly associated with increased grade 3 PGD risk. This observation is highly consistent with the aforementioned understanding of PGD pathophysiological mechanisms.22–24 This interpretability framework transforms the predictive output of the “black box” model into pathophysiological logic understandable by clinicians. It greatly enhances the model’s credibility and clinical acceptability. It also provides clear target guidance for precise interventions aimed at the key links mentioned above, such as limiting transfusion, optimizing donor organ procurement procedures, and controlling preoperative inflammation. Compared to the algorithm model for post-lung transplant PGD risk constructed by Michelson et al18 (which generally had lower AUC values), this study focused on grade 3 PGD as a specific high-risk endpoint. The strategy of “multivariate logistic regression screening + ML modeling” was adopted. While ensuring the clinical significance and statistical robustness of input features, model performance was significantly improved. This method effectively avoids interference from redundant variables and collinearity. The model can not only predict accurately but also reveal risk-driving pathways consistent with known biological mechanisms through SHAP. This enhances its clinical credibility and value for guiding interventions.
Limitations
This study has several limitations. First, although the model demonstrated excellent predictive performance in internal validation (eg, AUC of 0.9989, sensitivity of 100%), these results may be subject to optimistic bias or overfitting. This risk could arise from the high homogeneity of the single-center retrospective data, the limited sample size (n = 297), and class imbalance. To mitigate this, we implemented rigorous training/testing set splitting, cross-validation, and independent test set evaluation. Furthermore, SHAP analysis indicated that the key features were clinically reasonable. Nevertheless, this outstanding performance requires external validation in larger, multicenter, prospective cohorts to confirm its generalizability. Second, this study did not include donor-related variables (eg, donor lung function, inflammatory markers), which may limit the model’s comprehensiveness. Future work will integrate both donor- and recipient-side factors and pursue multi-center collaborations to develop more comprehensive prediction tools.
Conclusions
Based on single-center retrospective data, this study successfully developed and internally validated a random forest model for predicting the risk of grade 3 PGD after lung transplantation. Through SHAP-based interpretability analysis, the study preliminarily identified key risk drivers, offering insights to facilitate the application of explainable artificial intelligence in the field of organ transplantation. Nevertheless, the model remains at an exploratory stage, and its clinical applicability requires further validation through multicenter external studies.
Data Sharing Statement
The datasets used and/or analyzed during the current study are available from the corresponding author on reasonable request.
Ethics Approval Statement
All procedures performed in studies involving human participants were in accordance with the ethical standards of the institutional and/or national research committee and with the 1964 Helsinki declaration and its later amendments or comparable ethical standards. We also confirmed that all organs were donated voluntarily with written informed consent, and these were conducted in accordance with the Declaration of Istanbul. This study was approved by The Ethics Committee of Shanghai Chest Hospital (KS(Y)22226).
Consent to Participate
Written Informed consent was obtained from every human participant in the study and the patients participating in the study all agree to publish the research results.
Acknowledgment
The authors sincerely thanks for the assistance from the lung transplantation teams of Shanghai Chest Hospital and Shanghai Pulmonary Hospital.
Funding
The authors greatly acknowledge the financial support from the National Natural Science Foundation of China (82202412).
Disclosure
The authors declare that they have no competing interests in this work.
References
1. Chambers DC, Cherikh WS, Harhay MO, et al. The international thoracic organ transplant registry of the international society for heart and lung transplantation: thirty-sixth adult lung and heart-lung transplantation report-2019; focus theme: donor and recipient size match. The Journal of Heart and Lung Transplantation. 2019;38(10):1042–13. doi:10.1016/j.healun.2019.08.001
2. Rama Esendagli D, Ntiamoah P, Kupeli E, et al. Recurrence of primary disease following lung transplantation. ERJ Open Research. 2022;8(2):00038–2022. doi:10.1183/23120541.00038-2022
3. Criner RN, Clausen E, Cantu E, et al. Primary graft dysfunction. Curr Opinion Organ Transplant. 2021;26(3):321–327. doi:10.1097/MOT.0000000000000876
4. Whitson BA, Nath DS, Johnson AC, et al. Risk factors for primary graft dysfunction after lung transplantation. J Thoracic Cardiovasc Surg. 2006;131(1):73–80. doi:10.1016/j.jtcvs.2005.08.039
5. Snell GI, Yusen RD, Weill D, et al. Report of the ISHLT working group on primary lung graft dysfunction, part i: definition and grading-A 2016 Consensus Group statement of the International Society for Heart and Lung Transplantation. J Heart Lung Transplant. 2017;36(10):1097–1103. doi:10.1016/j.healun.2017.07.021
6. Morrison MI, Pither TL, Fisher AJ, et al. Pathophysiology and classification of primary graft dysfunction after lung transplantation. J Thoracic Dis. 2017;9(10):4084–4097. doi:10.21037/jtd.2017.09.09
7. Van Slambrouck J, Van Raemdonck D, Vos R, et al. A focused review on primary graft dysfunction after clinical lung transplantation: a multilevel syndrome. Cells. 2022;11(4):745. doi:10.3390/cells11040745
8. Hu C, Yu H, Wang J, Li X, Hu C. Research progress on risk factors of primary graft dysfunction after lung transplantation. Organ Transplant. 2021;12(3):6.
9. Liu J, Gu Y, Wang D, et al. Prediction of the short-term prognosis of acute ischaemic stroke in patients with high treatment platelet reactivity using explainable machine learning. Scientific Rep. 2025;15(1):36696. doi:10.1038/s41598-025-20763-7
10. Bektaş M, Tuynman JB, Costa Pereira J, et al. Machine learning algorithms for predicting surgical outcomes after colorectal surgery: a systematic review. World J Surg. 2022;46(12):3100–3110. doi:10.1007/s00268-022-06728-1
11. Tian D, Yan H-J, Huang H, et al. Machine learning-based prognostic model for patients after lung transplantation. JAMA Network Open. 2023;6(5):e2312022. doi:10.1001/jamanetworkopen.2023.12022
12. Singh J, Meng X, Leader JK, et al. Predicting primary graft dysfunction in systemic sclerosis lung transplantation using machine-learning and CT features. Clin Transplant. 2025;39(7):e70217. doi:10.1111/ctr.70217
13. Diamond JM, Anderson MR, Cantu E, et al. Development and validation of primary graft dysfunction predictive algorithm for lung transplant candidates. J Heart Lung Transplant. 2024;43(4):633–641. doi:10.1016/j.healun.2023.11.019
14. Fessler J, Gouy-Pailler C, Ma W, et al. Machine learning for predicting pulmonary graft dysfunction after double-lung transplantation: a single-center study using donor, recipient, and intraoperative variables. Transplant Int. 2025;38:14965.
15. Riley RD, Ensor J, Snell KIE, et al. Calculating the sample size required for developing a clinical prediction model. BMJ. 2020;368:m441. doi:10.1136/bmj.m441
16. Geube MA, Perez-Protto SE, McGrath TL, et al. Increased intraoperative fluid administration is associated with severe primary graft dysfunction after lung transplantation. Anesthesia Analgesia. 2016;122(4):1081–1088. doi:10.1213/ANE.0000000000001163
17. Walsh MG, Cui EY, Dimitrov T, et al. External perfusion centers can bridge the gap of experience during ex vivo lung perfusion: a United Network for Organ Sharing Database Study. ASAIO J. 2025;72(5):418–425. doi:10.1097/MAT.0000000000002509
18. Michelson AP, Oh I, Gupta A, et al. Developing machine learning models to predict primary graft dysfunction after lung transplantation. Am J Transplant. 2024;24(3):458–467. doi:10.1016/j.ajt.2023.07.008
19. Adam D, Landry C, Corado-Castillo D, et al. Relationship between phenotypic characteristics from the donors, predictive biomarkers from the donor grafts and the development of primary graft dysfunction in lung transplant recipients. J Heart Lung Transplant. 2020;39(4):S328. doi:10.1016/j.healun.2020.01.345
20. Liu Y, Liu Y, Su L, et al. Recipient-related clinical risk factors for primary graft dysfunction after lung transplantation: a systematic review and meta-analysis. PLoS One. 2014;9(3):e92773. doi:10.1371/journal.pone.0092773
21. Diamond JM, Lee JC, Kawut SM, et al. Clinical risk factors for primary graft dysfunction after lung transplantation. Am J Respirat Critical Care Med. 2013;187(5):527–534. doi:10.1164/rccm.201210-1865OC
22. Pena JJ, Bottiger BA, Miltiades AN, et al. Perioperative management of bleeding and transfusion for lung transplantation. Seminars Cardiothoracic Vascul Anesthesia. 2020;24(1):74–83. doi:10.1177/1089253219869030
23. Leon I, Vicente R, Moreno I, et al. Plasma levels of N terminal pro-brain natriuretic peptide as a prognostic value in primary graft dysfunction and a predictor of mortality in the immediate postoperative period of lung transplantation. Transplant Proceed. 2009;41(6):2216–2217. doi:10.1016/j.transproceed.2009.05.016
24. Prekker ME, Nath DS, Walker AR, et al. Validation of the proposed International Society for Heart and Lung Transplantation grading system for primary graft dysfunction after lung transplantation. J Heart Lung Transplant. 2006;25(4):371–378. doi:10.1016/j.healun.2005.11.436
 © 2026 The Author(s). This work is published and licensed by Dove Medical Press Limited. The
full terms of this license are available at https://www.dovepress.com/terms
and incorporate the Creative Commons Attribution
- Non Commercial (unported, 4.0) License.
By accessing the work you hereby accept the Terms. Non-commercial uses of the work are permitted
without any further permission from Dove Medical Press Limited, provided the work is properly
attributed. For permission for commercial use of this work, please see paragraphs 4.2 and 5 of our Terms.
© 2026 The Author(s). This work is published and licensed by Dove Medical Press Limited. The
full terms of this license are available at https://www.dovepress.com/terms
and incorporate the Creative Commons Attribution
- Non Commercial (unported, 4.0) License.
By accessing the work you hereby accept the Terms. Non-commercial uses of the work are permitted
without any further permission from Dove Medical Press Limited, provided the work is properly
attributed. For permission for commercial use of this work, please see paragraphs 4.2 and 5 of our Terms.
Recommended articles

Identification of Neutrophil Extracellular Trap-Related Gene Expression Signatures in Ischemia Reperfusion Injury During Lung Transplantation: A Transcriptome Analysis and Clinical Validation

Gao J, Zhang Z, Yu J, Zhang N, Fu Y, Jiang X, Xia Z, Zhang Q, Wen Z
Journal of Inflammation Research 2024, 17:981-1001
Published Date: 12 February 2024