Back to Journals » Journal of Inflammation Research » Volume 19
Machine Learning and Experimental Validation of m6A RNA Methylation Related Signatures for Risk Prediction, Diagnostic Biomarkers, and Immune Subtypes in Chronic Kidney Disease
Authors Chen J, Wang Z, Liao Y, Ding W
Received 31 July 2025
Accepted for publication 22 January 2026
Published 2 February 2026 Volume 2026:19 553934
DOI https://doi.org/10.2147/JIR.S553934
Checked for plagiarism Yes
Review by Single anonymous peer review
Peer reviewer comments 3
Editor who approved publication: Dr Wenjian Li
Jiaheng Chen,* Zhiwei Wang,* Yanting Liao, Wencong Ding
The Department of Nephrology and Hemopurification Center, Affiliated Guangdong Hospital of Integrated Traditional Chinese and Western Medicine of Guangzhou University of Chinese Medicine, Foshan, Guangdong, 528000, People’s Republic of China
*These authors contributed equally to this work
Correspondence: Wencong Ding, The Department of Nephrology and Hemopurification Center, Affiliated Guangdong Hospital of Integrated Traditional Chinese and Western Medicine of Guangzhou University of Chinese Medicine, Foshan, Guangdong, 528000, People’s Republic of China, Email [email protected]
Background: N6-methyladenosine (m6A) RNA methylation, a pivotal epigenetic modification, has been implicated in the pathogenesis and progression of diverse diseases. This study sought to elucidate the functional contributions of m6A-related genes to the pathogenesis of chronic kidney disease (CKD) using a strategy that integrated machine learning and experimental validation, with the goal of identifying robust diagnostic biomarkers and novel molecular subtypes.
Methods: Leveraging publicly available datasets, transcriptomic results of 53 patients with chronic kidney disease (CKD) as well as 8 healthy control individuals were collected. Differential expression analysis of m6A-related genes was performed, followed by the construction and comparison of random forest (RF) and support vector machine (SVM) models to predict CKD risk and identify diagnostic biomarkers. The key biomarkers were validated in the CKD model mice established by unilateral ureteral obstruction (UUO) using RT-qPCR and immunofluorescence analysis. Immune cell infiltration was assessed via ssGSEA analysis, and molecular subtypes were delineated through consensus clustering.
Results: We identified 20 differentially expressed m6A-related genes in CKD. The RF model demonstrated superior performance in risk prediction and prioritized five key genes (CBLL1, ELAVL1, RBM15B, YTHDF1, METTL3) for constructing a diagnostic nomogram. Experimental validation confirmed the upregulation of CBLL1, ELAVL1, RBM15B, and YTHDF1, and the downregulation of METTL3 in CKD mice. Furthermore, we identified two distinct m6A-associated molecular subtypes (Clusters A and B) with divergent immune landscapes. Cluster B was characterized by a pro-inflammatory phenotype, featuring elevated Th17 cell infiltration and a reduced proportion of Th2 cells.
Conclusion: Beyond advancing the mechanistic understanding of m6A in CKD, this study provides a translatable risk prediction model and delineates distinct immune subtypes, offering valuable foundations for future clinical stratification, diagnostic refinement, and the development of personalized immunomodulatory therapies.
Keywords: m6A methylation, chronic kidney disease, random forest, nomogram, subgroup
Introduction
Chronic kidney disease (CKD) is characterized by persistent structural and functional impairment of the kidneys resulting from diverse etiologies, with a duration exceeding three months. This condition may present with or without reduced glomerular filtration rate (GFR), defined as GFR<60 mL/min·1.73m2. Epidemiological studies indicate that the global prevalence of CKD (encompassing all stages 1 through 5) ranges between 3% and 18% across different populations.1,2 Furthermore, early-stage chronic kidney disease (CKD) is often clinically silent, resulting in delayed diagnosis and intervention. This contributes to elevated risks of cardiovascular mortality, immune dysfunction, metabolic disturbances, and exacerbated systemic inflammation. Given its substantial global burden, CKD ranks as the 12th leading cause of death worldwide.3,4 Nevertheless, current diagnostic approaches for CKD, including invasive renal biopsy, glomerular filtration rate (GFR) assessment, and biomarker analysis, which have notable limitations.5,6 Consequently, identifying novel biomarkers and improving risk stratification based on disease progression, prevalence, and mortality remains critically important.
Accumulating evidence demonstrates that epigenetic dysregulation drives chronic kidney disease (CKD) progression by altering the expression of genes associated with pathological mechanisms such as inflammation, epithelial-mesenchymal transition (EMT), and fibrotic pathways. Furthermore, beyond structural damage, CKD is characterized by a state of profound immune dysregulation. Activated T cells release pro-inflammatory cytokines like IFN-γ and TNF-α, which drive kidney inflammation and fibrotic remodeling.7 The presence of T-cells within the glomerulus is linked to the onset of albuminuria and the progression of renal fibrosis.8 Macrophages also foster renal fibrosis through the release of TGF-β and the subsequent accumulation of extracellular matrix.9 Notably, recent studies highlight m6A methylation, a dynamic RNA modification, as a key player in CKD pathogenesis through these shared mechanisms.10,11 Immune dysfunction not only drives renal fibrosis and accelerates CKD progression but also delineates distinct pathological subgroups among patients, thereby revealing dominant pathogenic drivers. Consequently, stratifying patients based on their immune profile represents a critical step toward personalized medicine, enabling clinicians to align targeted therapeutic interventions with individual disease mechanisms. However, the systematic characterization of m6A’s role in shaping the immune landscape of CKD remains largely unexplored, representing a significant knowledge gap.
In patients with end-stage CKD (stage 5), peripheral blood monocytes exhibit significantly reduced global m6A abundance alongside elevated expression of the demethylase FTO.12 This enzyme FTO, implicated in renal fibrosis regulation, has emerged as a potential biomarker for CKD risk stratification.13 Similarly, METTL3 protein levels show a positive correlation with serum creatinine and 24-hour urinary albumin excretion, suggesting its utility as a non-invasive indicator for assessing diabetic nephropathy severity.14 Furthermore, renal biopsies from patients with focal segmental glomerulosclerosis and diabetic nephropathy reveal upregulated METTL14 expression, supporting the clinical value of m6A methylation dynamics and METTL14 quantification as novel biomarkers for podocyte injury.15 Mechanistically, m6A dynamically controls T-cell differentiation and cytokine production by regulating the stability and translation of key immune transcripts. For example, m6A eraser FTO dampens Th17 responses while promoting Treg function, whereas reader YTHDF1 enhances IL-17 and TNF-α mRNA translation, suggesting that m6A imbalance could directly contribute to the Th17/Treg skewing observed in CKD.16,17 Despite these advances, the diagnostic and predictive potential of m6A-related genes in CKD remains underexplored, particularly for disease stratification and targeted therapeutic development.
In this study, we systematically identified m6A-related differentially expressed genes (DEGs) between CKD patients and healthy controls. To evaluate disease risk and prioritize hub genes, we employed random-forest and support-vector-machine algorithms to prioritize clinically relevant m6A features before experimental validation. In addition, the biomarkers expression was validated in CKD model mice. Unsupervised consensus clustering further delineated two distinct m6A-associated molecular subtypes, elucidating the functional landscape of m6A regulators in CKD pathogenesis. Integrated enrichment and immune infiltration analyses uncovered potential mechanistic biomarkers, providing novel targets for diagnostic and therapeutic development in CKD.
Methods
Data Sources
Gene Expression Omnibus (GEO, available at http://www.ncbi.nlm.nih.gov/geo/) serves as a publicly accessible genomics database designed to store gene expression profiles, original sequences, and platform records. By conducting a search using the keyword “chronic kidney disease”, the GSE66494 cohort was identified and subsequently downloaded. This particular cohort encompasses microarray analyses derived from kidney biopsy samples collected from 53 patients with chronic kidney disease (CKD) as well as 8 healthy control individuals. In addition, the GSE108112 (107 patients and 5 healthy controls) and GSE200818 (188 patients and 5 healthy controls) cohorts were also downloaded and analyzed as the validation datasets. The preprocessing steps were as follows: using reference platform files for probe to gene annotation, the raw data undergoes log2 conversion, elimination of missing values, and background correction.
Differentially Expressed Genes (DEGs) Analysis
We utilized the “limma” package within R software to identify differentially expressed m6A-related genes between CKD patients and healthy controls, using a threshold of |log2FC|>1 and false discovery rate (FDR)<0.05 via Benjamini-Hochberg method. The m6A-related genes were sourced from previously published studies.18
Construction and Screening of Mechanical Learning Models
The random forest (RF) model was constructed using the “random forest” package in R, selecting m6A-related differentially expressed genes (DEGs) as independent variables and CKD patients as dependent variables to forecast CKD occurrence.19,20 The support vector machine (SVM), a machine-learning technique rooted in statistical learning theory’s structural risk minimization principle and known for minimizing classification errors, was also employed. To rigorously evaluate and prevent overfitting, the performance of both the RF and SVM models was assessed using 10-fold cross-validation repeated 5 times. Based on residual reverse cumulative distribution maps and residual box plots, the models were comprehensively evaluated to pick the optimal one for CKD prediction. Furthermore, to explore the potential of m6A-related genes in distinguishing the identified molecular subtypes, a separate random forest model was trained to classify samples into m6A-related Cluster A and m6A-related Cluster B.
Construction and Verification of Nomogram
To forecast the status of CKD, a nomogram was created based on the previously selected RF model, with candidate differential genes identified using the “rms” package.21 In this nomogram, each influencing factor’s value level was assigned a score according to its impact on the outcome variable. The total score was derived by summing these individual scores, and the probability of the outcome event was predicted through the functional relationship between the total score and occurrence likelihood. The model’s accuracy was assessed via a calibration curve, which evaluated the alignment between predicted and observed values.22 The receiver operating characteristic (ROC) curve analysis was used to reveal the predictive effect of the signature in three cohorts.
Reagents
The primary antibodies used in the study included: METTL3 (Proteintech, 15073-1-AP), CBLL1 (Proteintech, 21179-1-AP), ELAVL1 (Proteintech, 11910-1-AP), YTHDF1 (Proteintech, 17479-1-AP), RBM15B (Proteintech, 22249-1-AP). The secondary antibody was Goat Anti-Rabbit IgG H&L Alexa Fluor 594 (Invitrogen, A11012).
Animal Model and Sample Collection
C57BL/6 mice aged 8 weeks with a body weight of approximately 25 g, were provided by Gempharmatech Co., Ltd (Nanjing, China), and housed in the SPF grade animal room of the experimental animal center of Guangzhou University of Chinese Medicine. The feeding conditions were: temperature (25±0.5) °C, humidity of 50% to 60%, 12 hours of light per day, and sufficient water and feed. All animal experiments were approved by the Animal Ethics Committee of Guangzhou University of Chinese Medicine, following the Guide for the Care and Use of Laboratory Animals. A total of 12 mice were randomly assigned to either the sham group (n=6) or the UUO model group (n=6) using a random number table As per published studies,23 a CKD model induced by unilateral ureteral obstruction was established. The procedure involved anaesthetising mice with isoflurane, incising the skin on their back, exposing the left kidney and ureter, and ligating the ureter’s ends with surgical thread before resecting its middle part. The sham group underwent the same procedure without ureteral ligation and resection. Immediate euthanasia was performed on mice reaching humane endpoints, specifically severe distress, >20% weight loss, or immobility. After the experiment, the mice were anesthetized and euthanized, and 1/4 of the kidney tissue was collected for paraffin embedding. The remaining tissues were subjected to liquid nitrogen quick freezing to extract RNA for subsequent experimental analysis.
Hematoxylin and Eosin (HE) Staining and Masson Staining
HE staining was performed according to the steps described in the reagent kit (Solarbio, G1120). The specific staining steps were to immerse the tissue slices in hematoxylin dye for 5 minutes, followed by color separation with 75% alcohol and immediately staining with eosin dye for 45s. Finally, the slices were sealed and observed for tubular injury under a microscope, and representative images were collected. The Masson staining protocol was performed as follows: tissue sections were sequentially stained with iron hematoxylin for 5 minutes, ponceau red solution for 10 minutes, and differentiated with phosphomolybdic acid for 1–5 minutes, followed by counterstaining with toluidine blue for 1–5 minutes. After thorough rinsing with 1% glacial acetic acid until no blue dye effluent was observed, the sections were air-dried. Finally, the slides were mounted and examined under a microscope to evaluate collagen fiber deposition, with representative photomicrographs captured for documentation and analysis.
Immunofluorescence Analysis
Tissue sections were processed for immunofluorescence by first performing standard deparaffinization and antigen retrieval procedures. After inactivation of endogenous peroxidase activity, nonspecific binding sites were blocked for 30 minutes at room temperature. The samples were then sequentially treated with target-specific primary antibodies and corresponding fluorescent secondary antibodies. Nuclear counterstaining was achieved using DAPI, with fluorescence imaging conducted on a Zeiss Axio Vert A1 microscope (Oberkochen, Germany).
RT-qPCR Analysis
Total RNA was extracted from approximately 25 mg of renal tissue and quantified using an ultra-microvolume UV spectrophotometer to assess concentration and quality. Subsequently, 1 μg of RNA was reverse transcribed into cDNA. Quantitative real-time PCR was performed using ChamQ Universal SYBR qPCR Master Mix with gene-specific primers (Supplementary Table 1) and cDNA template under the following conditions: initial denaturation at 95°C for 30s, followed by 40 cycles of 95°C for 15s, 60°C for 15s, and 72°C for 15s, with a final extension at 72°C for 5 min. Gapdh was used as the endogenous control, and relative gene expression levels were calculated using the 2−ΔΔCT method.
Consensus Clustering Analysis
Consensus clustering analysis, performed with the “ConsensusClusterPlus” package based on m6A-related gene expression levels, retained CKD samples and divided them into multiple subgroups, with the largest subgroup designated as k=9, aiming to uncover the role of m6A-related genes in CKD.24 The analysis was run with the following parameters: maximum evaluated cluster number (kmax) = 9, 1000 resampling iterations, a subsampling ratio of 0.8, and using the Euclidean distance metric with hierarchical clustering. Principal component analysis (PCA) via the “Rtsne” package verified this optimal grouping. t-Distributed Stochastic Neighbor Embedding (t-SNE) was utilized for two-dimensional visualization purposes only, to provide an intuitive graphical representation of the subtype distribution. Additionally, the “limma” package was used to analyze the differential expression of m6A - related genes across these m6A-associated subgroups.
Enrichment Analysis
The “clusterProfiler” software package was used to conduct Gene Ontology (GO) and Kyoto Gene and Genome Encyclopedia (KEGG) function enrichment analysis to reveal the potential biological functions of DEGs using the “org.Hs.eg.db” annotation database, with statistical significance thresholds set at FDR<0.05.25
Immune Infiltration Analysis
The study employed single sample genomic enrichment analysis (ssGSEA) via the “GSEABase” and “GSVA” packages to elucidate the abundance of immune cells in each sample and the correlation between DEGs and immune cells. The relative abundance of 28 immune cell types in each sample was quantified using a well-established, published gene signature set.26 Correlations between gene expression and immune cell abundance were calculated using Spearman correlation analysis, and an FDR < 0.05 was considered significant.27 The m6A-related score for each CKD patient was calculated using the PCA algorithm to quantify the m6A-related subgroup. Briefly, PCA algorithm was applied to the expression matrix of the 20 predefined m6A regulators across all samples. The first principal component (PC1), which captured the largest variance in the m6A regulator expression profile, was extracted and defined as the m6A-related score for each sample. Furthermore, the “ggplot2” and “ggallivian” packages were utilized to visualize the correlation among m6A - related clusters, m6A-related gene clusters, and m6A scores.
Statistical Analysis
Spearman correlation analysis was applied to evaluate the correlation coefficient between the expression of m6A-related genes and immune infiltrating cells. The Wilcoxon test was conducted to assess differences between m6A-related subgroups. A P<0.05 or FDR<0.05 (Benjamini-Hochberg) was regarded as statistically significant. All data analyses were performed using R software, version 4.0.1.
Results
Analysis of m6A-Related DEGs
To examine the differential expression patterns of m6A regulatory genes in CKD, we systematically analyzed 20 m6A-associated modifiers through comparative statistical analysis. The expression profiling revealed distinct regulatory patterns between CKD patients and healthy controls (Figure 1A and B). Specifically, fifteen genes (METTL14, WTAP, ZC3H13, RBM15B, CBLL1, YTHDC1, YTHDC2, YTHDF1, YTHDF2, YTHDF3, FMR1, LRPPRC, RBMX, ELAVL1, and FTO) exhibited significant upregulation in the CKD group. Conversely, five genes (METTL3, RBM15, HNRNPC, IGFBP1, and IGFBP3) showed marked downregulation compared to healthy individuals.
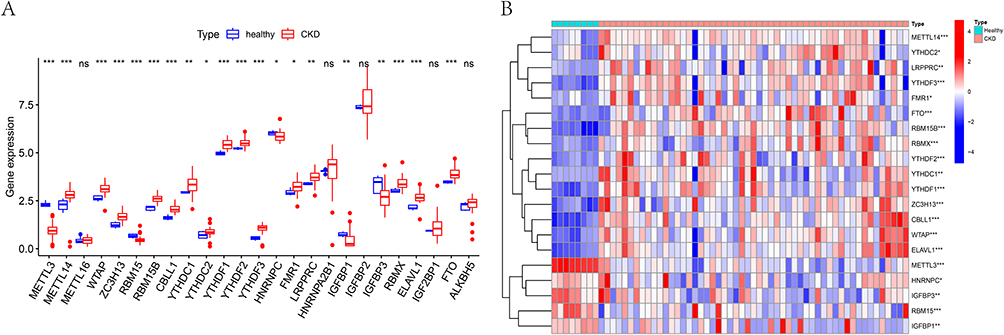 |
Figure 1 Differential expression of m6A-related genes in chronic kidney disease. (A) Boxplot of differences in gene expression of m6A-related genes between CKD patients and healthy controls. (B) The heat map of differential expression of 20 m6A-related signature genes between CKD patients and healthy controls. ns, not significant; * P <0.05, **P <0.01, *** P <0.001. |
Construction and Selection of Mechanical Learning Models
To enhance CKD prediction accuracy, we developed and compared two machine learning models: random forest (RF) and support vector machines (SVM). Model performance evaluation through residual analysis (box plots and reverse cumulative distribution) demonstrated superior predictive capability of the RF model, as evidenced by significantly smaller residuals (Figure 2A and B). During model optimization, we established that RF stability was achieved at >500 decision trees, where the error rate variation plateaued (Figure 2C). Subsequent feature importance analysis identified key m6A-related genes (score ≥1.5) for CKD prediction, which were prioritized for nomogram construction (Figure 2D).
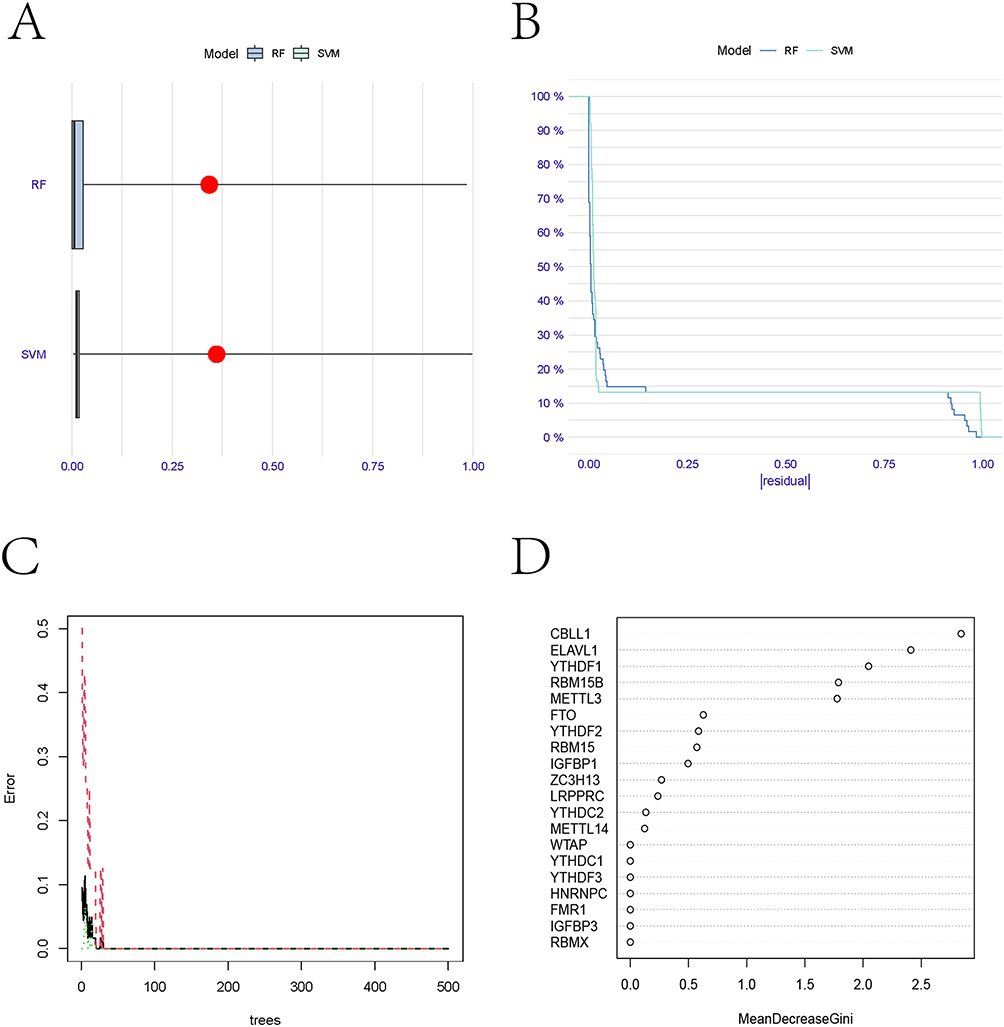 |
Figure 2 Construction and selection of random forest and support vector machine models. (A) Residual Boxplot of random forest and support vector machine models. (B) Inverse cumulative distribution of residuals in random forest and support vector machine models. (C) The number of decision trees about error rate in random forest model. (D) The importance score map of m6A-related genes. |
Cluster Analysis
To elucidate the association between m6A regulatory patterns and CKD pathogenesis, we performed consensus clustering analysis. The optimal number of stable clusters was determined to be k=2, based on the consensus cumulative distribution function (CDF) and the delta area curve, which showed maximal cluster stability and clear distinction, effectively stratifying CKD patients into two distinct subgroups (m6A clusters A and B) with maximal separation (Figure 3A and B). Principal component analysis (PCA) further validated this classification, demonstrating clear segregation between the two clusters (Figure 3C). Notably, differential expression analysis revealed significant variations in 50% (10/20) of the examined m6A regulators between clusters (Figure 3D).
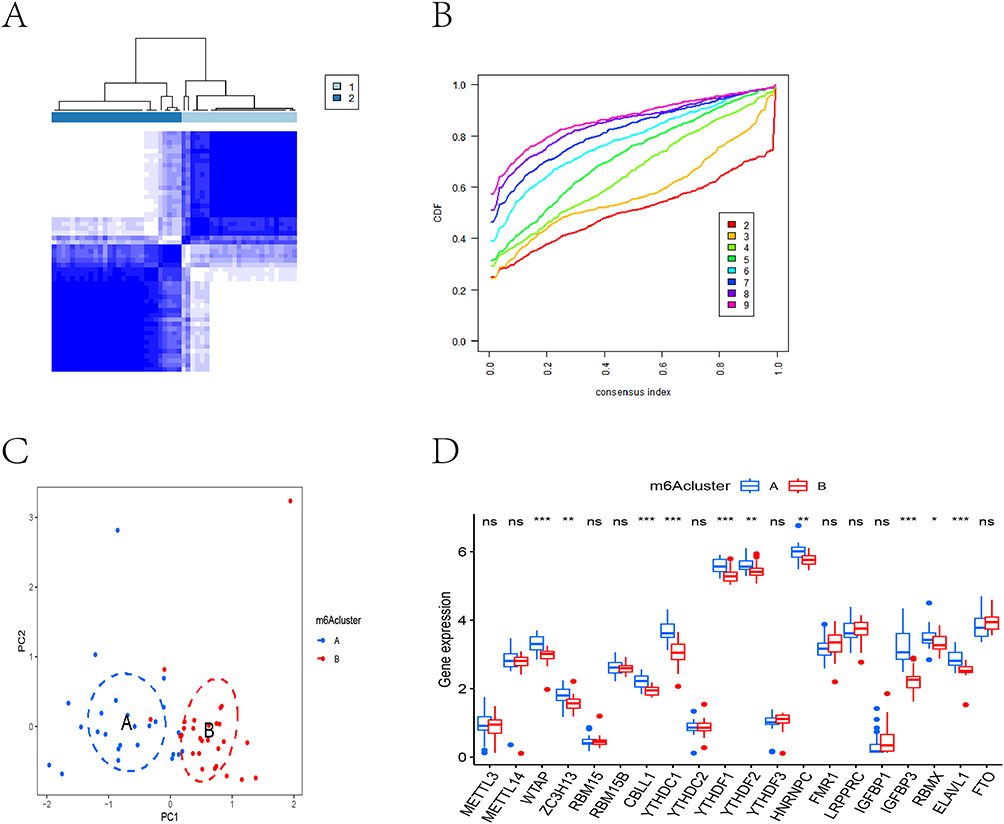 |
Figure 3 The results of cluster analysis. (A) CKD patients were divided into two m6A-related subtypes by consensus clustering method. (B) The cumulative distribution function (CDF) curve results show that if k=2, the CDF value was the lowest and the clustering effect is the best. (C) PCA analysis showed that the two groups were distributed in two different directions, indicating that the two m6A related subtypes were clearly distinguished. Blue circle represents the samples in m6A-related cluster A, red circle represents the samples in m6A-related cluster B. (D) Boxplots showed expression of m6A-related genes in two m6A-related clusters. ns, not significant; * P <0.05, **P <0.01, *** P <0.001. |
Construction and Verification of Nomogram
For enhanced CKD risk visualization, we developed a predictive nomogram incorporating five key m6A regulators (Figure 4A). The scoring system demonstrated positive correlations between elevated CBLL1, YTHDF1, and RBM15B expression levels and increased CKD risk scores, identifying these as potential risk factors. Conversely, higher ELAVL1 and METTL3 expression conferred protective effects. Calibration curve analysis confirmed strong agreement between nomogram predictions and actual outcomes (Figure 4B), validating the model’s clinical utility. ROC curve demonstrated that the prediction signature had good robustness and generalizability, the area under curve (AUC) values in GSE 66494, GSE108112 and GSE200818 cohorts were 0.906, 0.809 and 0.811, respectively (Figure 4C).
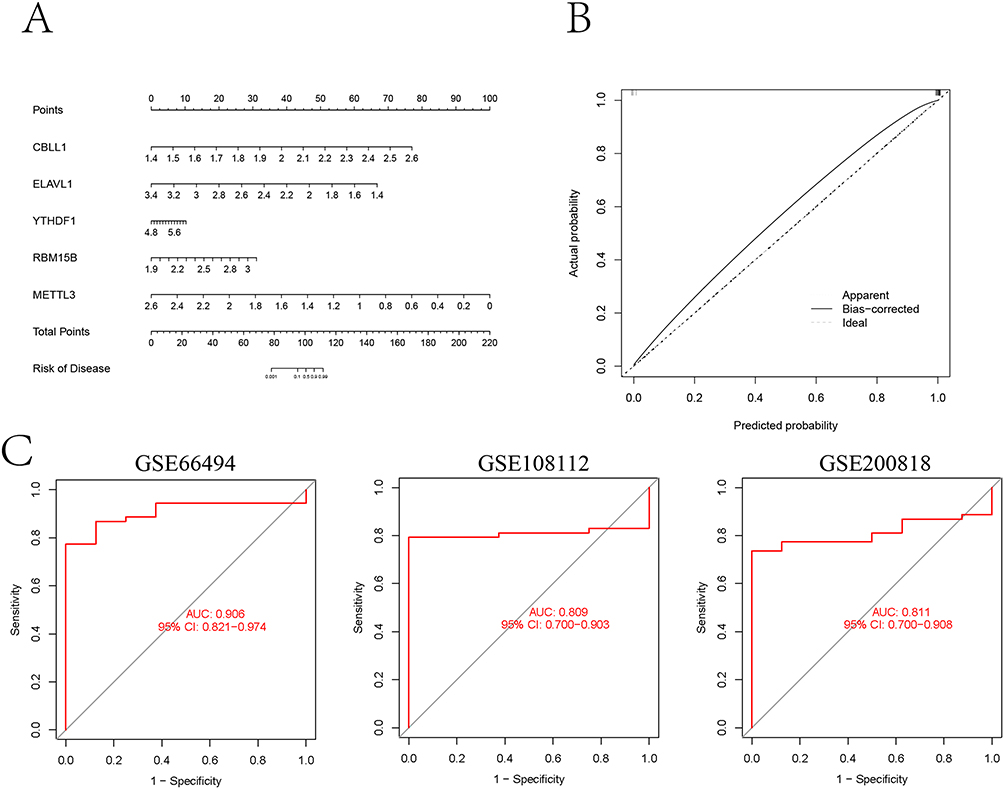 |
Figure 4 Construction and validation of nomogram. (A) Norman map was constructed to predict the status of CKD based on the expression levels of five important m6A-related characteristic genes. (B) Construction of calibration curve. (C) The ROC curves were used to evaluate the accuracy of prediction signature in GSE 66494, GSE108112 and GSE200818 cohorts. |
In vitro Experimental Validation
To verify the correlation of key m6A-related genes and CKD, we established an in vitro CKD model via UOO. The HE staining results of the kidneys showed that compared with the sham surgery group, the glomeruli in the model group were significantly atrophied and hardened, and the renal tubules were significantly dilated, accompanied by necrosis and shedding of renal tubular epithelial cells. The Masson results showed that compared with the sham surgery group, the model group experienced fibrosis, and the degree of fibrosis was aggravated, which was close to the pathological manifestations of CKD (Figure 5A). Consistent with the results predicted by bioinformatics analysis, immunofluorescence results and RT-PCR results confirmed that the expression of CBLL1, ELAVL1, RBM15B, and YTHDF1 was increased, while the expression of METTL3 was decreased in CKD model mice (Figure 5B and C).
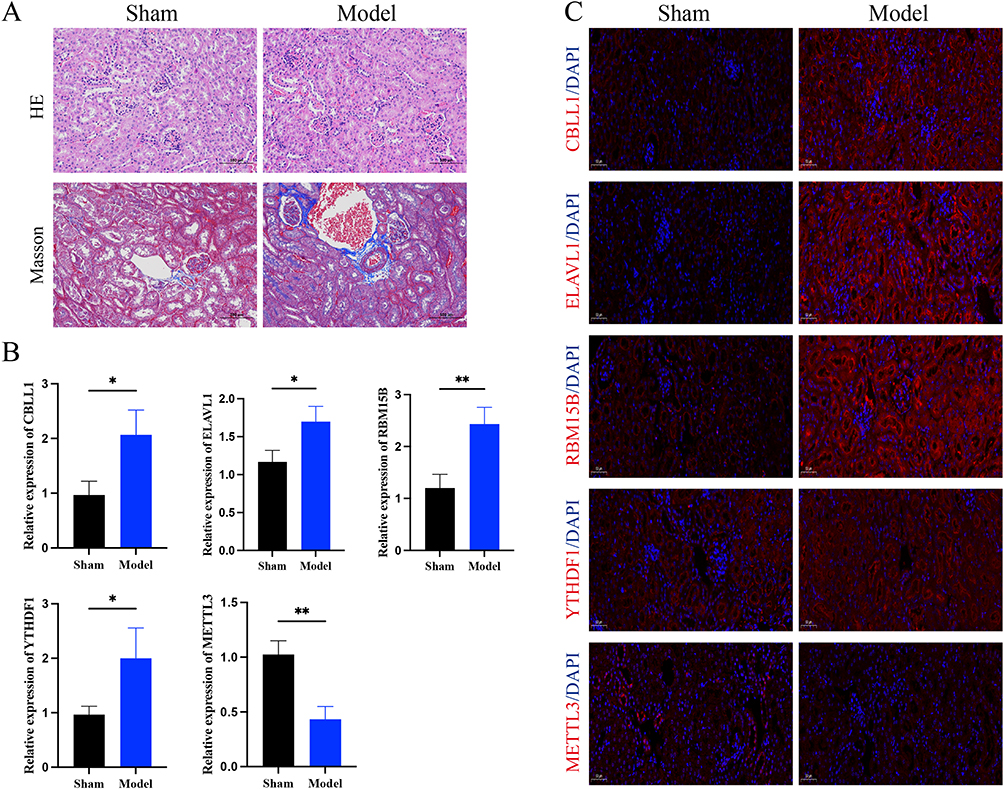 |
Figure 5 The results of in vitro experiment validation. (A) HE and Masson staining. (B) RT-PCR analysis of CBLL1, ELAVL1, RBM15B YTHDF1, METTL3 expression levels (n=3). (C) CBLL1, ELAVL1, RBM15B YTHDF1, METTL3 expression was detected via immunofluorescent. * P <0.05, **P <0.01. |
Immune Cell Infiltration Analysis
To investigate the immunoregulatory role of m6A modification in CKD, we performed comprehensive immune correlation analyses using ssGSEA. Heatmap visualization demonstrated distinct immune-m6A interaction patterns, revealing strong positive correlations between multiple m6A regulators and T2 helper cells and immature B cells, and significant negative associations with T17 helper cells (Figure 6A). Comparative analysis of immune infiltration between m6A clusters showed cluster B exhibited elevated CD56 dim NK cells, monocytes and T17 cells, while cluster A was enriched in immature B cells, Tregs and T2 cells (Figure 6B). Furthermore, four key m6A regulators (CBLL1, ELAVL1, YTHDF1 and RBM15B) showed significant discriminative power for immune cell composition (Figure 6C–F).
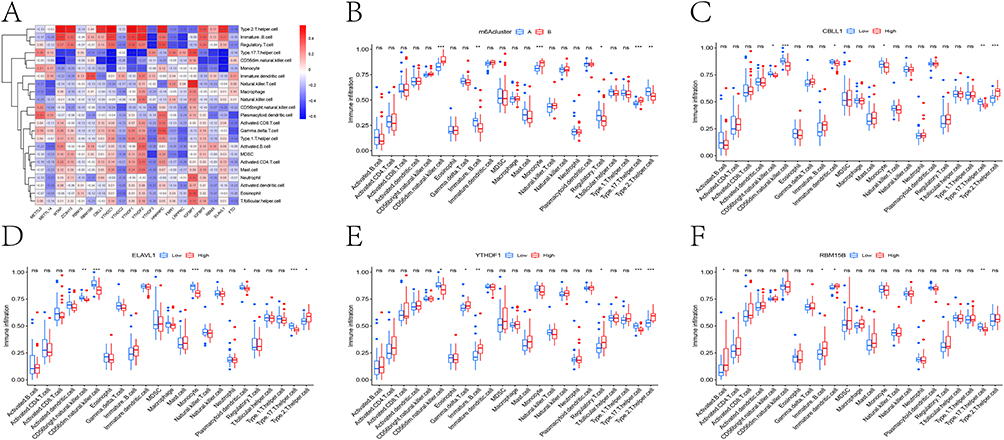 |
Figure 6 Analysis of immune cell infiltration. (A) Heat map of correlation between the expression level of m6A-related genes and immune cell infiltration. (B) Analysis of the difference in immune cell content in two m6A related subtypes. Box plot showed the difference of immune cell content in different expression groups of CBLL1 (C), ELAVL1 (D), YTHDF1 (E), RBM15B (F). ns, not significant; * P <0.05, **P <0.01, *** P <0.001. |
Identification of m6A-Related Gene Clusters
To elucidate the biological significance of m6A clusters, we identified 572 DEGs between clusters A and B (Figure 7A). Pathway analysis revealed these DEGs were significantly enriched in multiple metabolism pathway (Figure 7B). Functional annotation demonstrated three key characteristics including biological processes (BP) enrichment in metabolic regulation, cellular component (CC) localization to apical cellular structures, and molecular function (MF) predominance in transmembrane transport activity (Figure 7C). The cluster-specific expression patterns of these DEGs were confirmed through consensus clustering (Figure 7D) and heatmap visualization (Figure 7E).
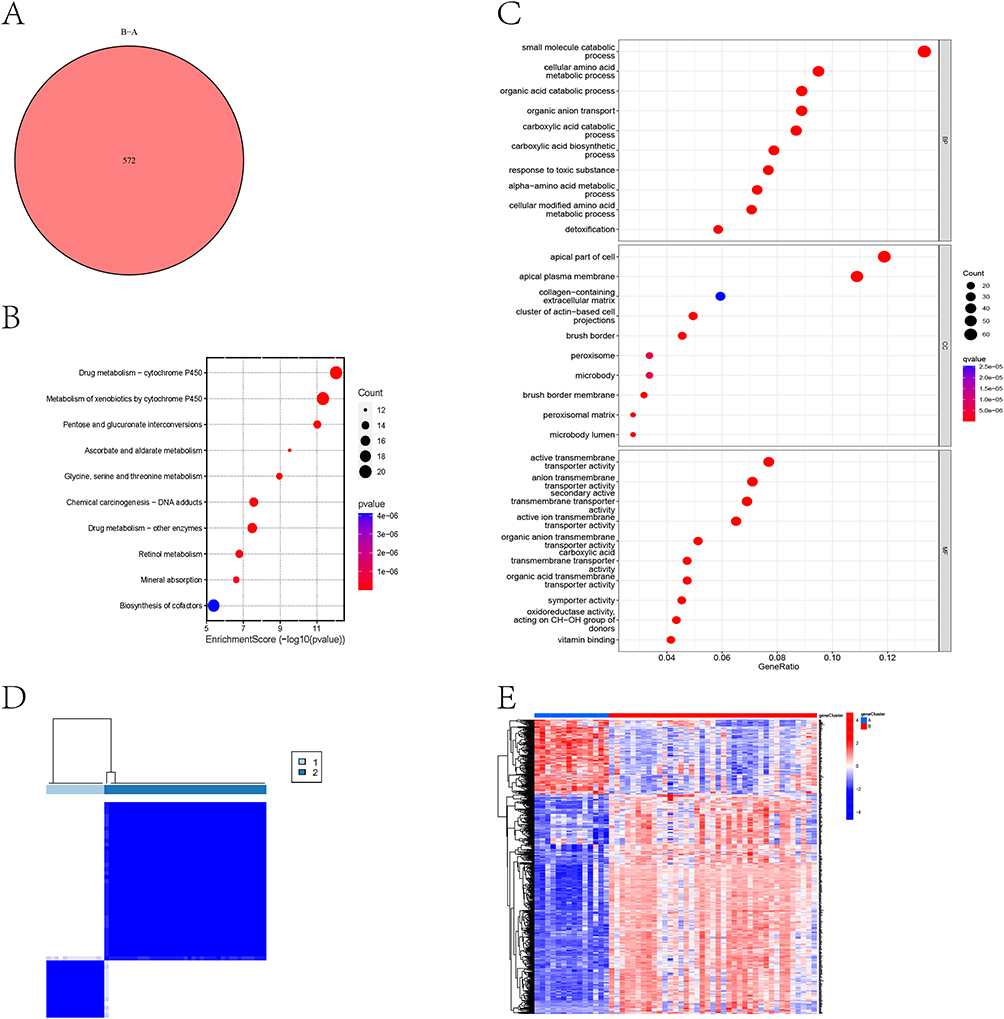 |
Figure 7 Identification of m6A-related gene clusters. (A) Venn diagram showed the number of differentially expressed genes between m6A-related clusters A and B. (B) Bubble map of KEGG enrichment analysis of differentially expressed genes. (C) Bubble map of GO enrichment analysis of differentially expressed genes. (D) CKD patients were divided into two m6A-related gene clusters by consensus clustering method. (E) The heat map showed the differentially expressed genes between m6A-related gene clusters A and B. |
Role of m6A Related Subgroups in CKD
Our analysis identified differential expression patterns in 14 out of 20 m6A regulatory genes between the two clusters (Figure 8A). Subsequent immune characterization using ssGSEA revealed cluster-specific immune cell infiltration profiles (Figure 8B). Principal component analysis-derived m6A scores showed a notable increase in cluster B, although this difference did not reach statistical significance when comparing the two clusters (Figure 8C and D). To comprehensively illustrate these relationships, we generated a Sankey diagram mapping the associations between m6A subtypes and their respective scores (Figure 8E).
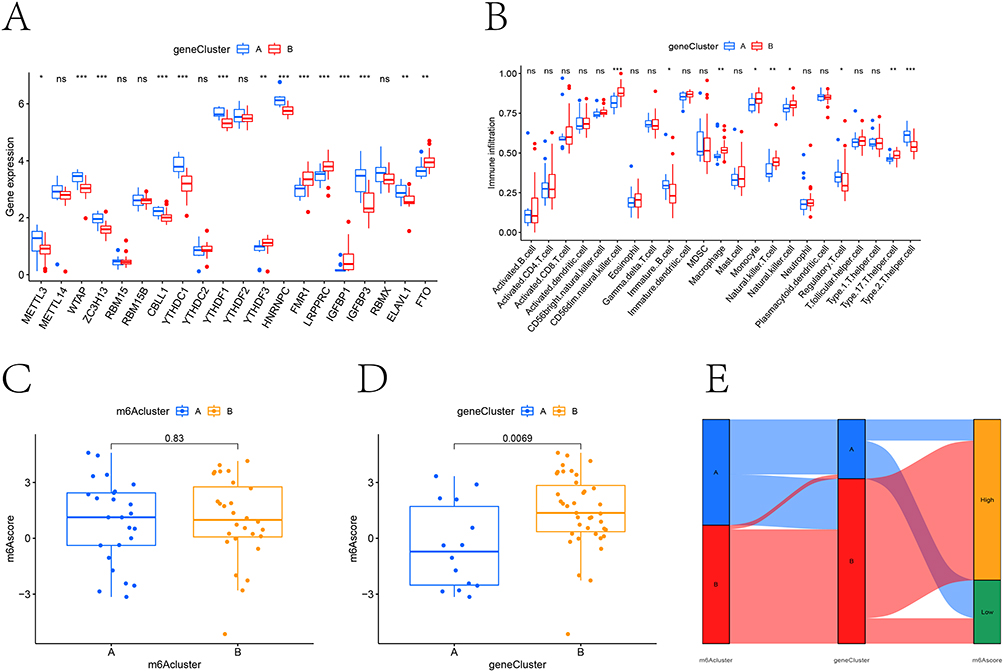 |
Figure 8 The role of m6A-related subgroups in CKD. (A) Boxplot showed the differentially expressed m6A-related genes between m6A-related gene clusters A and B. (B) Analysis of immune cell content difference between m6A-related gene cluster A and B. (C and D) The m6A-related score in m6A-related cluster and m6A-related gene cluster. (E) Sankey diagram visualizes the relationship between m6A-related cluster, m6A-related gene cluster and m6A-related assessment grouping. ns, not significant; * P <0.05, **P <0.01, *** P <0.001. |
Discussion
Early detection and intervention in chronic kidney disease (CKD) are crucial for improving clinical outcomes. Recent advances in high-throughput sequencing, machine learning algorithms, and bioinformatics approaches have revolutionized disease prediction methodologies, enabling the development of non-invasive diagnostic biomarkers. These technological breakthroughs offer unprecedented opportunities for timely risk assessment and precision medicine in CKD management.28 While m6A-mediated regulation of transcription and immunity is well-documented in cancer and,29,30 its impact on the immune microenvironment of CKD remains largely uncharted. This study employed machine learning to reveal the role of m6A in CKD, aiming to delineate m6A-related signatures and characterize distinct immune subtypes.
In this investigation, we analyzed the GSE66494 cohort from GEO, identifying 20 m6A-related differentially expressed genes (DEGs) distinguishing CKD patients from healthy controls. Machine learning approaches were employed to prioritize key candidate genes, with random forest analysis demonstrating superior diagnostic and predictive performance for CKD. The candidate genes expression was detected in CKD model mices. We subsequently developed a predictive nomogram incorporating five m6A regulators to assess individual CKD risk. Furthermore, consensus clustering revealed two distinct m6A modification subtypes among CKD patients, which exhibited differential immune infiltration patterns. The m6A-related signature can be developed into non-invasive diagnostic tools for CKD patients, while immune subtypes stratify patients for targeted immunotherapy, and key regulatory factors may also become new therapeutic targets. The m6A-related risk score can be combined with traditional clinical parameters to create a composite stratification tool that identifies high-risk patients for more in-depth monitoring or tailored treatment interventions. To advance this process, we need to conduct predictive validation in large prospective cohorts, develop clinically feasible detection methods, and conduct functional in vivo studies to determine causal relationships and evaluate target therapy potential.
The m6A methylation process involves three functional enzyme groups: writers (methyltransferases), erasers (demethylases), and readers (methylation recognition proteins).31 As a key reader protein, YTHDF1 mediates transcriptional regulation by binding methylated RNA sites.32 Our findings corroborate previous reports of YTHDF1 upregulation in CKD, where it promotes renal fibrosis through YAP-mediated positive feedback mechanisms.33 In this study, we found that YTHDF1 expression in kidney tissue of CKD patients was significantly increased compared with healthy controls, and the results of the nomogram confirmed that YTHDF1 was a risk factor in CKD, which was consistent with the reported results. METTL3 is an RNA methyltransferase that transfers methyl to RNA by forming the m6A methyltransferase complex.34 Previous studies have shown that METTL3 positively regulates MALAT1 through m6A modification, which may promote renal fibrosis through MALAT1/miR-145/FAK pathway.35 METTL3-mediated m6A modification can promoted the maturation of miR-21-5p by promoting the recognition and processing of pri-miR-21. Mature miR-21-5p promotes inflammation by activating the SPRY1/ERK/NF-κB signaling pathway and ultimately promoted renal fibrosis.36 In addition, the protein expression levels of METTL3 were positively correlated with serum creatinine and 24-hour urinary albumin excretion, suggesting that it can be used as a non-invasive indicator of clinical diabetic nephropathy severity.14
In addition to removing metabolic waste, toxins, and drugs from the body, the kidneys remove circulating cytokines and bacterial toxins, such as lipopolysaccharides (LPS), and constantly sample proteins in the blood, contributing to immune system homeostasis. The removal of cytokines from the blood limits inflammation, and the removal of bacterial components reduces the activation of pattern recognition receptors (PRRs) on immune cells.37,38 The kidney is also very vulnerable to immune-mediated diseases, and the loss of immune homeostasis can adversely affect the kidney directly or indirectly, leading to the loss of renal function.39 In vitro studies have suggested that T cell proliferation is reduced in uremic environments.40 Due to decreased thymus output and increased apoptosis, naive T cells were significantly reduced in CKD patients, but the number of effector memory cells remained normal.41,42 Similarly, the number of naive and memory B cells is significantly reduced in CKD patients due to increased apoptosis.43,44 In this study, CKD patients were divided into two different m6A-related subtypes by using consensus clustering method, and the two m6A-related clusters were equally effective in classifying CKD patients into two types (m6A-related gene clusters), indicating that m6A-related genes could effectively stratified CKD patients. Both m6A-related clusters and m6A-related gene clusters can significantly distinguish different immune cell infiltration states in CKD patients, suggesting that m6A-related genes play an important role in immune cells in CKD patients, and providing some potential directions for future prediction of clinical diagnosis and treatment in CKD patients. It is worth noting that although our bioinformatics analysis and validation results preliminarily confirm that these m6A regulatory factors are closely related to specific immune cells and CKD pathology, the clear causal relationship has not been further confirmed. The exact mechanism pathways, such as whether changes in m6A drive immune dysregulation and accelerate CKD, or whether CKD induces inflammatory feedback to alter the m6A epigenetic transcriptome, still need to be fully elucidated and represent a key direction for future functional researches.
Despite providing novel insights, our study has several limitations worth considering. Firstly, in vivo experimental validation is conducted with a limited sample size, which is sufficient to detect significant molecular changes. However, caution should be exercised when inferring results, and confirmation should be conducted in larger animal samples. Secondly, our bioinformatics findings are based on a public dataset. Although we conducted two external validations using the GSE108112 and GSE200818 cohorts to support the generalizability of our risk signature, it is necessary to conduct more robust validation of the entire risk prediction signature in large, prospective, and multicenter clinical cohorts with long-term follow-up data before clinical translation. In addition, many proteins in the kidneys can be noninvasively detected in urine and in subsequent studies, we hope to examine the protein levels of the key genes being studied.
Conclusion
In summary, we systematically identified m6A-related DEGs in CKD and, for the first time, applied machine learning methods to rank feature genes to construct the nomogram with high predictive ability and robustness. In addition, our work uniquely identified m6A related molecular subtypes associated with different immune dysregulation patterns, providing a new paradigm for immune based patient stratification in CKD. Our research findings provide a multifaceted clinical translational application strategy, offering a non-invasive diagnostic tool through m6A-related signature, enabling patient stratification for personalized therapy through immune subtypes, and presenting key regulators as novel therapeutic targets for CKD immunopathology.
Data Sharing Statement
The dataset generated and analyzed during the current study are available in Gen Expression Omnibus (GEO) with GSE66494 accession number (https://www.ncbi.nlm.nih.gov/geo/query/acc.cgi?acc= GSE66494).
Ethics Approval and Consent to Participate
This study conducted secondary analyses only of legally obtained, publicly available datasets comprising anonymised human data. In accordance with the Measures for Ethical Review of Life Science and Medical Research Involving Human Subjects (China; promulgated 18 February 2023), Article 32(1)(2), research using legally obtained publicly available data or anonymised information may be exempt from ethics review when it causes no harm and does not involve sensitive personal information or commercial interests. No new data were collected from human participants, no re-identification was attempted, and all analyses complied with the source repositories’ terms of use. The analyses were conducted in line with the principles of the Declaration of Helsinki. Consent to participate was not required because only anonymised data were analysed.
Author Contributions
All authors made a significant contribution to the work reported, whether that is in the conception, study design, execution, acquisition of data, analysis and interpretation, or in all these areas; took part in drafting, revising or critically reviewing the article; gave final approval of the version to be published; have agreed on the journal to which the article has been submitted; and agree to be accountable for all aspects of the work.
Funding
This work was supported by the Foshan 14th Five-Year Priority Speciality Construction Project, the Foshan Nanhai District 14th Five-Year Priority Speciality Construction Project and Foshan Traditional Chinese Medicine Immune Health Technology Innovation Base Project.
Disclosure
The authors declare that they have no competing interests related to this work.
References
1. Ebert N, Jakob O, Gaedeke J, et al. Prevalence of reduced kidney function and albuminuria in older adults: the berlin initiative study. Nephrol Dial Transplant. 2017;32(6):997–15. doi:10.1093/ndt/gfw079
2. Brück K, Stel VS, Gambaro G, et al. CKD prevalence varies across the European general population. J Am Soc Nephrol. 2016;27(7):2135–2147. doi:10.1681/ASN.2015050542
3. Jha V, AY W, Wang H. The impact of CKD identification in large countries: the burden of illness. Nephrol Dial Transplant. 2012;27(Suppl 3):iii32–38. doi:10.1093/ndt/gfs113
4. Zewinger S, Schumann T, Fliser D, Speer T. Innate immunity in CKD-associated vascular diseases. Nephrol Dial Transplant. 2016;31(11):1813–1821. doi:10.1093/ndt/gfv358
5. Dhaun N, Bellamy CO, Cattran DC, Kluth DC. Utility of renal biopsy in the clinical management of renal disease. Kidney Int. 2014;85(5):1039–1048. doi:10.1038/ki.2013.512
6. Stevens LA, Levey AS. Measured GFR as a confirmatory test for estimated GFR. J Am Soc Nephrol. 2009;20(11):2305–2313. doi:10.1681/ASN.2009020171
7. Lisowska KA, Storoniak H, Dębska-Ślizień A. Cell subpopulations and cytokine levels in hemodialysis patients. Hum Immunol. 2022;83(2):134–143. doi:10.1016/j.humimm.2021.11.003
8. Hu SY, Jia XY, Li JN, et al. T cell infiltration is associated with kidney injury in patients with anti-glomerular basement membrane disease. Sci China Life Sci. 2016;59(12):1282–1289. doi:10.1007/s11427-016-5030-9
9. Wen J, Jiao B, Tran M, Wang Y. Pharmacological Inhibition of S100A4 attenuates fibroblast activation and renal fibrosis. Cells. 2022;11(17):2762. doi:10.3390/cells11172762
10. Wanner N, Bechtel-Walz W. Epigenetics of kidney disease. Cell Tissue Res. 2017;369(1):75–92. doi:10.1007/s00441-017-2588-x
11. Wing MR, Ramezani A, Gill HS, Devaney JM, Raj DS. Epigenetics of progression of chronic kidney disease: fact or fantasy? Semin Nephrol. 2013;33(4):363–374. doi:10.1016/j.semnephrol.2013.05.008
12. Tang C, Livingston MJ, Liu Z, Dong Z. Autophagy in kidney homeostasis and disease. Nat Rev Nephrol. 2020;16(9):489–508. doi:10.1038/s41581-020-0309-2
13. Wang CY, Shie SS, Tsai ML, et al. FTO modulates fibrogenic responses in obstructive nephropathy. Sci Rep. 2016;6:18874. doi:10.1038/srep18874
14. Jiang L, Liu X, Hu X, et al. METTL3-mediated m(6)A modification of TIMP2 mRNA promotes podocyte injury in diabetic nephropathy. Mol Ther. 2022;30(4):1721–1740. doi:10.1016/j.ymthe.2022.01.002
15. Lu Z, Liu H, Song N, et al. METTL14 aggravates podocyte injury and glomerulopathy progression through N(6)-methyladenosine-dependent downregulating of Sirt1. Cell Death Dis. 2021;12(10):881. doi:10.1038/s41419-021-04156-y
16. Yao Q, Chen Y, Zhang X, et al. Decoding m(6)A RNA methylation in kidney disorders: from molecular insights to therapeutic strategies. J Transl Med. 2025;23(1):771. doi:10.1186/s12967-025-06817-4
17. Srivastava D, Nayak V, Pahari S, Sandeep G, Misra A. Epitranscriptomic regulation of immunity: the role of m6A in shaping immune response dynamics. Cytokine. 2025;194:157011. doi:10.1016/j.cyto.2025.157011
18. Ritchie ME, Phipson B, Wu D, et al. limma powers differential expression analyses for RNA-sequencing and microarray studies. Nucleic Acids Res. 2015;43(7):e47. doi:10.1093/nar/gkv007
19. Zhou T, Chen L, Guo J, et al. MSIFinder: a python package for detecting MSI status using random forest classifier. BMC Bioinf. 2021;22(1):185. doi:10.1186/s12859-021-03986-z
20. Zhang M, Su Q, Lu Y, Zhao M, Niu B. Application of machine learning approaches for protein-protein interactions prediction. Med Chem. 2017;13(6):506–514. doi:10.2174/1573406413666170522150940
21. Zhang JA, Zhou XY, Huang D, et al. Development of an immune-related gene signature for prognosis in melanoma. Front Oncol. 2020;10:602555. doi:10.3389/fonc.2020.602555
22. Cui G, Wang C, Liu J, et al. Development of an exosome-related and immune microenvironment prognostic signature in colon adenocarcinoma. Front Genetics. 2022;13:995644. doi:10.3389/fgene.2022.995644
23. Zhao Q, Dong J, Liu H, et al. Design and discovery of a highly potent ultralong-acting GLP-1 and glucagon co-agonist for attenuating renal fibrosis. Acta Pharm Sin B. 2024;14(3):1283–1301. doi:10.1016/j.apsb.2023.11.020
24. Wilkerson MD, Hayes DN. ConsensusClusterPlus: a class discovery tool with confidence assessments and item tracking. Bioinformatics. 2010;26(12):1572–1573. doi:10.1093/bioinformatics/btq170
25. Yu G, Wang LG, Han Y, He QY. clusterProfiler: an R package for comparing biological themes among gene clusters. Omics. 2012;16(5):284–287. doi:10.1089/omi.2011.0118
26. Bindea G, Mlecnik B, Tosolini M, et al. Spatiotemporal dynamics of intratumoral immune cells reveal the immune landscape in human cancer. Immunity. 2013;39(4):782–795. doi:10.1016/j.immuni.2013.10.003
27. Wang L, Wang D, Yang L, et al. Cuproptosis related genes associated with Jab1 shapes tumor microenvironment and pharmacological profile in nasopharyngeal carcinoma. Front Immunol. 2022;13:989286. doi:10.3389/fimmu.2022.989286
28. Gaitonde DY, Cook DL, Rivera IM. Chronic kidney disease: detection and evaluation. Am Family Phys. 2017;96(12):776–783.
29. Wang S, Wan L, Zhang M, Yan D, Li F. New targets for immune inflammatory response in rheumatoid arthritis: focus on the potential significance of n6-methyladenosine, ferroptosis and cuproptosis. J Inflamm Res. 2025;18:8085–8106. doi:10.2147/JIR.S526096
30. An Y, Duan H. The role of m6A RNA methylation in cancer metabolism. Mol Cancer. 2022;21(1):14. doi:10.1186/s12943-022-01500-4
31. Zaccara S, Ries RJ, Jaffrey SR. Reading, writing and erasing mRNA methylation. Nat Rev Mol Cell Biol. 2019;20(10):608–624. doi:10.1038/s41580-019-0168-5
32. Liao S, Sun H, Xu C. YTH domain: a family of n(6)-methyladenosine (m(6)a) readers. Genomics, proteomics & bioinformatics. 2018;16(2):99–107. doi:10.1016/j.gpb.2018.04.002
33. Xing J, He YC, Wang KY, Wan PZ, Zhai XY. Involvement of YTHDF1 in renal fibrosis progression via up-regulating YAP. FASEB j. 2022;36(2):e22144. doi:10.1096/fj.202100172RR
34. Huang W, Chen TQ, Fang K, Zeng ZC, Ye H, Chen YQ. N6-methyladenosine methyltransferases: functions, regulation, and clinical potential. J hematol oncol. 2021;14(1):117. doi:10.1186/s13045-021-01129-8
35. Liu P, Zhang B, Chen Z, et al. m(6)A-induced lncRNA MALAT1 aggravates renal fibrogenesis in obstructive nephropathy through the miR-145/FAK pathway. Aging. 2020;12(6):5280–5299. doi:10.18632/aging.102950
36. Liu E, Lv L, Zhan Y, et al. METTL3/N6-methyladenosine/ miR-21-5p promotes obstructive renal fibrosis by regulating inflammation through SPRY1/ERK/NF-κB pathway activation. J Cell & Mol Med. 2021;25(16):7660–7674. doi:10.1111/jcmm.16603
37. Kurts C, Panzer U, Anders HJ, Rees AJ. The immune system and kidney disease: basic concepts and clinical implications. Nat Rev Immunol. 2013;13(10):738–753. doi:10.1038/nri3523
38. Syed-Ahmed M, Narayanan M. Immune dysfunction and risk of infection in chronic kidney disease. Adv Chronic Kidney Dis. 2019;26(1):8–15. doi:10.1053/j.ackd.2019.01.004
39. Hato T, Dagher PC. How the innate immune system senses trouble and causes trouble. Clin. J. Am. Soc. Nephrol. 2015;10(8):1459–1469. doi:10.2215/CJN.04680514
40. Brinkkoetter PT, Marinaki S, Gottmann U, et al. Altered CD46-mediated T cell co-stimulation in haemodialysis patients. Clin Exp Immunol. 2005;139(3):534–541. doi:10.1111/j.1365-2249.2005.02705.x
41. Meier P, Dayer E, Blanc E, Wauters JP. Early T cell activation correlates with expression of apoptosis markers in patients with end-stage renal disease. J Am Soc Nephrol. 2002;13(1):204–212. doi:10.1681/ASN.V131204
42. Yoon JW, Gollapudi S, Pahl MV, Vaziri ND. Naïve and central memory T-cell lymphopenia in end-stage renal disease. Kidney Int. 2006;70(2):371–376. doi:10.1038/sj.ki.5001550
43. Fernández-Fresnedo G, Ramos MA, González-Pardo MC, de Francisc AL, López-Hoyos M, Arias M. B lymphopenia in uremia is related to an accelerated in vitro apoptosis and dysregulation of Bcl-2. Nephrol Dial Transplant. 2000;15(4):502–510. doi:10.1093/ndt/15.4.502
44. Jacque E, Schweighoffer E, Tybulewicz VL, Ley SC. BAFF activation of the ERK5 MAP kinase pathway regulates B cell survival. J Exp Med. 2015;212(6):883–892. doi:10.1084/jem.20142127
 © 2026 The Author(s). This work is published and licensed by Dove Medical Press Limited. The
full terms of this license are available at https://www.dovepress.com/terms
and incorporate the Creative Commons Attribution
- Non Commercial (unported, 4.0) License.
By accessing the work you hereby accept the Terms. Non-commercial uses of the work are permitted
without any further permission from Dove Medical Press Limited, provided the work is properly
attributed. For permission for commercial use of this work, please see paragraphs 4.2 and 5 of our Terms.
© 2026 The Author(s). This work is published and licensed by Dove Medical Press Limited. The
full terms of this license are available at https://www.dovepress.com/terms
and incorporate the Creative Commons Attribution
- Non Commercial (unported, 4.0) License.
By accessing the work you hereby accept the Terms. Non-commercial uses of the work are permitted
without any further permission from Dove Medical Press Limited, provided the work is properly
attributed. For permission for commercial use of this work, please see paragraphs 4.2 and 5 of our Terms.
Recommended articles
Early Warning of Axillary Lymph Node Metastasis in Breast Cancer Patients Using Multi-Omics Signature: A Machine Learning-Based Retrospective Study
Ke Z, Shen L, Shao J
International Journal of General Medicine 2024, 17:6101-6114
Published Date: 12 December 2024
Development and Validation of a Nomogram for Predicting Chronic Kidney Disease in Older Patients with Type 2 Diabetes Mellitus and Cardiovascular Disease
Gu J, Chen J, Wang J, Zhu Z, Huang L, Deng Q, Li Y, You L, Zuo Y
Journal of Multidisciplinary Healthcare 2026, 19:604550
Published Date: 11 May 2026