Back to Journals » Diabetes, Metabolic Syndrome and Obesity » Volume 15
Lower Visceral Fat Area in Patients with Type 2 Diabetic Peripheral Neuropathy
Authors Wu Y ![]() , Wan Q, Xu Y, Li J, Li K, Zhang Z, Tang Q, Miao Y
, Wan Q, Xu Y, Li J, Li K, Zhang Z, Tang Q, Miao Y ![]() , Yan P
, Yan P ![]()
Received 3 September 2022
Accepted for publication 10 November 2022
Published 21 November 2022 Volume 2022:15 Pages 3639—3654
DOI https://doi.org/10.2147/DMSO.S388330
Checked for plagiarism Yes
Review by Single anonymous peer review
Peer reviewer comments 2
Editor who approved publication: Dr Konstantinos Tziomalos
Yuru Wu,1– 4 Qin Wan,1– 4 Yong Xu,1– 4 Jia Li,1– 4 Ke Li,1– 4 Zhihong Zhang,5 Qian Tang,1– 4 Ying Miao,1– 4 Pijun Yan1– 4
1Department of Endocrinology, the Affiliated Hospital of Southwest Medical University, Luzhou, Sichuan, People’s Republic of China; 2Metabolic Vascular Disease Key Laboratory of Sichuan Province, Luzhou, Sichuan, People’s Republic of China; 3Sichuan Clinical Research Center for Nephropathy, Luzhou, Sichuan, People’s Republic of China; 4Cardiovascular and Metabolic Diseases Key Laboratory of Luzhou, Luzhou, People’s Republic of China; 5Department of General Medicine, the Affiliated Hospital of Southwest Medical University, Luzhou, Sichuan, People’s Republic of China
Correspondence: Pijun Yan, Department of Endocrinology, The Affiliated Hospital of Southwest Medical University, Luzhou, Sichuan, 646000, People’s Republic of China, Tel/Fax +86-830-3165361, Email [email protected]
Objective: There is preliminary evidence that visceral fat area (VFA) was associated with the presence of type 2 diabetic peripheral neuropathy (DPN) in the Korean population; however, no studies have reported the association in Chinese population. The purpose of this study was to explore the possible correlation of VFA with DPN in such a population.
Methods: A total of 2498 hospitalized patients with type 2 diabetes mellitus (T2DM) undergone VFA measurement, and were divided into DPN group (n=900) and non-DPN group (n=1594). The association of VFA with the presence of DPN was evaluated by correlation and multiple logistic regression analyses, generalized additive model with a smooth curve fitting, and receiver operating characteristic (ROC) curve analysis.
Results: The VFA was significantly lower in the DPN group than in the non-DPN group (P < 0.001). VFA was significantly and positively associated with sural nerve conduction velocity (SNCV) and amplitude potential (SNAP) and negatively associated with the presence of DPN (all P< 0.001); there was no significant difference in the curve fitting (P = 0.344). Multivariate logistic regression analysis showed that the risk of presence of DPN decreased progressively across the VFA quartiles (P for trend < 0.001) and was significantly lower in patients in the highest VFA quartile than in those in the lowest quartile (OR: 0.382, 95% CI 0.151– 0.968, P< 0.001) after multivariate adjustment. The ROC analysis revealed that the best cut-off value of VFA for predicting the presence of DPN was 50.5cm2 (sensitivity 84.40%; specificity 34.00%).
Conclusion: These results suggest that lower VFA level may be associated with increased risk of the presence of DPN in T2DM patients.
Keywords: visceral fat area, diabetic peripheral neuropathy, sural nerve conduction velocity, sural nerve amplitude potential, Chinese population
Introduction
Diabetic peripheral neuropathy (DPN) is one of the most common chronic diabetic complications characterized by demyelination and axonal degeneration, leading to reduction in quality of life, disability, enormous health care costs, and even death.1,2 DPN may develop at the earliest stage of diabetes, and often progresses asymptomatically, without special and effective therapeutic strategies. Despite evidence that DPN may involve glucolipid metabolism disorders, insulin resistance (IR), inflammation, oxidative stress, and vascular dysfunction,1 its pathogenesis is still not fully understood. Therefore, the identification of a novel modifiable risk factor for DPN in patients with type 2 diabetes mellitus (T2DM) is critical to facilitate early interventions aimed at improving such adverse health outcome and its economic consequences.
Obesity, especially abdominal obesity, has been proven to be a potential risk factor for the development of diabetic macro- and microvascular complications, including DPN,2–7 but the mechanisms underlying the associations are multifactorial and still unclear. It has been well established that visceral adipose tissue (VAT) can overproduce several bioactive pro-inflammatory cytokines and adipocytokines that lead to IR, metabolic disorders, chronic inflammation, oxidative stress, endothelial dysfunction, and atherosclerotic vascular damage, subsequently resulting in nerve ischemia and direct axonal injury.5,8–11 Obesity is usually measured using several indicators such as body mass index (BMI), waist circumference (WC), waist-to-hip ratio, and body fat mass, however, these indicators are unable to accurately distinguish between VAT and subcutaneous adipose tissue.12 At present, although magnetic resonance imaging (MRI) and computed tomography (CT) are the gold standard to directly measure VAT, these techniques are not feasible because of consuming time, expense, and radioactivity.12 Recently, visceral fat area (VFA), measured by the bioelectrical impedance analysis (BIA), has been recognized as a noninvasive, relatively accurate, and low-cost method of quantifying VAT.12 Studies have demonstrated that VFA level may be strongly associated with IR, inflammation, oxidative stress, metabolic syndrome (MetS), hyperlipidemia, diabetes and its vascular complications including hypertension, cardiovascular disease, diabetic retinopathy (DR), albuminuria, and cardiovascular autonomic dysfunction (one of the main types of diabetic neuropathy),2,4,12–14 all of which play pivotal roles in the pathogenesis of DPN,1 suggesting indirectly that VFA also appears to play a crucial role in the development of DNP. There is preliminary in vivo evidence that subjects with DPN had higher VFA levels than those without DPN, and VFA level was associated with the presence of DPN in a small sample of young and middle-aged Korean individuals with T2DM,7 however, no studies, as yet, have evaluated the association of VFA level with DPN in Chinese population, and the pathological mechanism underlying the relationship has not been fully understood.
Given diabetes comprises several subtypes (clusters) with distinct heterogeneous features, and different clusters have significantly different patient characteristics and risk of diabetic complications including DPN,15,16 the purpose of the present study was to evaluate the association of VFA level with DPN in a Chinese population of T2DM patients aged 18–80 years old, and explores its possible mechanisms.
Materials and Methods
Study Population
This was a cross-sectional study designed to analyze the association between VFA level and DPN. A total of 2804 T2DM inpatients aged from 18 to 80 years in the Endocrinology Department at the Affiliated Hospital of Southwest Medical University between September 2017 and December 2021, who joined the National Metabolic Management Center (MMC) that provide standardised management for metabolic diseases and led by Ruijin Hospital, Shanghai, and received a standardized questionnaire, anthropometric examination, physical examination, laboratory tests, and evaluation of diabetes-related complications. T2DM was diagnosed based on the 1999 World Health Organization criteria.17 Subjects were excluded if they had any of the following criteria: 1) type 1 diabetes, acute complications of diabetes, including diabetic ketoacidosis, hyperglycemic hyperosmolar state, hyperosmolar coma and hypoglycemia; 2) endocrine diseases other than diabetes mellitus, such as thyroid disease, parathyroid disease, adrenal diseases, pituitary diseases; 3) presence of non-diabetes-related neuropathy such as chronic inflammatory demyelinating polyneuropathy, cervical and lumbar diseases, and severe cerebrovascular disease; 4) severe renal and liver failure, liver cirrhosis, gall bladder and biliary tract diseases, hematological diseases; 5) connective tissue, inflammatory and active infectious disease, autoimmune diseases; 6) history of malignancies; 7) history of mental illness; 8) pregnancy and lactation; 9) use of immunosuppressive agents, antioxidants, antibiotics, analgesics, systemic corticosteroids, multivitamins or vitamin B12 supplements, weight-loss drugs; 10) history of bariatric surgery; 11) missing or incomplete demographic or clinical characteristic data. After applying the exclusion criteria, 2494 participants were eligible and included in the present study (Figure 1).
 |
Figure 1 Flow chart of the selection of study participants. |
The study protocol was approved by the Human Research Ethics Committee of the Affiliated Hospital of Southwest Medical University and followed the Declaration of Helsinki. The patients provided their written informed consent to participate in this study.
Clinical and Biochemical Measurements
Professionally trained researchers collected data on all participants’ demography, lifestyle (smoking, fresh vegetable and fruit intake, soy consumption, fish intake), medical history (hypertension, stroke, coronary heart disease (CHD), diabetic foot ulceration (DFU), peripheral arterial disease (PAD), DR, diabetic nephropathy (DN), and other diseases), and medication status (hypoglycemic drugs, antihypertensive drugs, antihyperlipidemic drugs, antiplatelet drugs). The weight and height of the participants were measured before breakfast in a single light garment without shoes. BMI as a measure of general obesity was calculated by dividing the weight (kg) by the square of height (m). Systolic and diastolic blood pressures (SBP and DBP) were measured on the right arm using a standard mercury sphygmomanometer, and measurements were taken three times and then averaged.18
Blood samples were collected in the morning either after an overnight fast or 2 h after a 75 g oral glucose tolerance test (OGTT). Fasting blood glucose (FBG), postprandial 2h blood glucose (2hPBG), glycated hemoglobin A1c (HbA1c), fasting C-peptide (FCP), total cholesterol (TC), triglycerides (TG), high-density lipoprotein cholesterol (HDL-C), low-density lipoprotein cholesterol (LDL-C), total bilirubin (TBIL), glutamyl transpeptidase (GGT), serum albumin, creatinine (Cr), uric acid (UA), red blood cell count (RBC), hemoglobin (Hb), and white blood cell count (WBC) were determined according to relevant protocols and guidelines at the registered central laboratory located at the Affiliated Hospital of Southwestern Medical University, which is accredited in line with the international organization for standardization (ISO) 15189 standard for quality management specific to medical laboratories.
TyG was calculated as ln (TG [mg/dL] × FBG [mg/dL]/2).19 The atherogenic index of plasma (AIP) was calculated as ln (TG/HDL-C) and the atherogenic coefficient (AC) was calculated as (TC-HDL-C/HDL-C).20 Instead of insulin, fasting C-peptide was used to evaluate IR according to a modified formula. Insulin resistance index (homeostasis model assessment (HOMA)-insulin resistance): [HOMA-IR (CP) = 1.5 + FPG (mmol/L) × CP (ng/mL)/2800].21
The first urine sample was collected early in the morning for further analysis. Urinary microalbumin and creatinine concentrations were measured by chemiluminescent immunoassay, and urine albumin-to-creatinine ratio (ACR, mg/g Cr) was then calculated. The estimated glomerular filtration rate (eGFR) was calculated using the CKD Epidemiology Partnership (CKD-EPI) equation modified by Japanese coefficients.22 Patients were then classified as having DN if they had an eGFR < 60 mL/min/1.73m2 and/or an ACR > 30 mg/g.23
Measurements of VFA
After an overnight fast and urination, VFA was measured using the BIA (DUALSCAN HDS-2000, Omron Healthcare, Kyoto, Japan) according to the manufacturer’s protocol.24–26 Briefly, the device analyses weak electric currents passing through the body in order to obtain body impedance. In the analyzer, the hospital number, height, weight, age, and sex of each participant were entered. With the “abdominal measurement unit”, we measured the abdominal shape and calculated the cross-sectional area of the abdomen at the umbilicus. The abdominal surface and four limbs were placed on the electrodes to measure abdominal impedance when a mild electric current was generated, which was used to calculate lean tissue area and subcutaneous abdominal fat area (SFA). The VFA was defined as the cross-sectional area minus the sum of the lean tissue area and SFA.
Assessment and Diagnostic Criteria of DPN
All T2DM patients were asked whether they had neurologic symptoms including numbness, pain (prickling or stabbing, shooting, burning or aching pain), and paresthesia (abnormal cold or heat sensation, allodynia and hyperalgesia) in the toes, feet, legs or upper-limb, and undergone achilles tendon reflexes examination on both sides in the knee standing position (as being either presence or weakening or loss). Then, the bilateral sural nerve conduction velocity (SNCV) and amplitude potential (SNAP) of all patients were measured using the NC-stat DPN Check device (HDN-1000, Omron Healthcare, Kyoto, Japan) according to the test manual by clinical laboratory technicians. Age and height stratified SNAP and SNCV thresholds were used. A reduced SNCV and/ or SNAP in at least one leg were considered as nerve conduction abnormality.27–30 DPN was identified as both at least a neurologic symptom/sign and an abnormality of nerve conduction.1,27,30–36 SNCV and SNAP were plotted on a reference chart to identify the stage of DPN. All participants were categorized into four different groups (normal, mild, moderate, and severe neuropathy) according to the reference chart.30,37
Other Classifications and Definitions
Hypertension was defined as individuals with self-reported treated hypertension or with an average of 2 blood pressure measurements of at least 140/90 mm Hg using an automated digital device.38 CHD was defined as a positive history of myocardial infarction, bypass operation, a diagnostic finding in angiography or positive exercise test.39 Stroke was considered present if diagnosed according to previous medical records or if a pathological finding by CT and MRI of the brain.40 Ankle-brachial index (ABI) measurements were measured by a continuous-wave Doppler ultrasound probe (Vista AVS, Summit Co.). Patients were diagnosed as having PAD if an ABI value <0.9 on either limb.23 DFU was defined as a full‐thickness wound (penetrates dermal tissues) below the ankle in a person with diabetes caused by peripheral neuropathy or ischaemia or both, and consequent trauma to the foot.41 A Canon CR-2 Digital Retinal Camera was performed to obtain two-field fundus photography of patient’s eyes (Canon Inc., Kanagawa, Japan). The presence of DR was assessed by high-quality fundus photographs and an ophthalmologist.
Statistical Analysis
Statistical analyses were performed using the Statistical Package for Social Sciences version 20.0 (SPSS, Chicago, IL), R statistical software packages (http://www.R-project.org, The R Foundation) and EmpowerStats (http://www.empowerstats.com, X&Y Solutions, Inc, Boston, MA). Data were tested using the Kolmogorov–Smirnov test for normal distribution and Levene’s homogeneity of variance test for homogeneity of variance. Continuous variables were represented as mean ± standard deviation (SD), and categorical variables were shown as number (percentages).
Clinical and biochemical characteristics of T2DM patients with and without DPN were compared using the Student’s t-test (for normally distributed continuous variables), Mann–Whitney U-test (for non-normally distributed continuous variables), or χ2 test (for categorical variables). Clinical characteristics associated with DPN among four VFA quartiles groups were assessed using one-way analysis of variance (ANOVA) (continuous variables with normally distribution and homogeneity of variance), or Kruskal–Wallis test (covariates with nonparametric distribution and/or variance uneven).
The correlations between VFA and other variables were performed by Spearman correlation analysis firstly and then further determined by partial correlation analysis after adjusting for age, sex, BMI, and duration of diabetes. VFA quartiles were classified as follows: Q1 (≤54 cm2), Q2 (55–79 cm2), Q3 (80–107 cm2), and Q4 (≥108 cm2). To explore the relationship between VFA and the risk of presence of DPN, multivariate logistic regression analysis was performed using the presence of DPN as the dependent variable. Model 1 was unadjusted; Model 2 was adjusted for age, sex, BMI, and diabetic duration; Model 3 was additionally adjusted for glucolipid metabolism parameters based on Model 2; Model 4 was further adjusted for inflammation, oxidative stress, and vascular parameters based on Model 3; Model 5 was further adjusted for medication status, smoking, fresh vegetable and fruit intake, soy consumption, and fish intake based on Model 4. Odds ratios (OR) and 95% confidence intervals (CI) were determined using Q1 as the reference group. To identify the non-linear relationship between VFA and the risk of DPN, we use the generalized additive model (GAM) and smooth curve fitting (penalized spline method). Also, two-piecewise linear regression model was used to further explore the nonlinearity. Finally, the receiver operating characteristic (ROC) curve analysis was performed to determine the optimal cut-off point of VFA for the diagnosis of DPN.
All statistical tests were considered statistically significant at two-sided P<0.05.
Results
Clinical and Biochemical Characteristics of the Study Populations
A total of 2494 T2DM patients were included in this study; around 36.09% of patients had DPN. The clinical and biochemical characteristics of the patients are shown in Table 1. There were no statistically significant differences in sex ratios, BMI, TG, TC, LDL-C, TyG index, AIP, GGT, serum Cr, UA, eGFR, and prevalence of CHD and stroke between DPN and non-DPN group. Compared with those in the non-DPN group, patients with DPN had significantly younger age, longer diabetic duration, higher SBP, DBP, PP, FBG, 2hPBG, HbA1c, HDL-C, WBC, urine ACR, prevalence of DFU, PAD, DN, and DR, less user of metformin, DPP-4 inhibitors, ACEI/ARB, alcium antagonist, fresh fruit intake, soy consumption, fish intake, more user of insulin, and lower VFA, BMI, FCP, HOMA-IR, RBC, Hb, TBIL, serum albumin, SNCV, SNAP, and prevalence of hypertension (P<0.01 or P< 0.05; Table 1 and Figure 2). The prevalence of DPN across VFA quartiles was 51.90%, 34.85%, 30.03%, and 27.16%, respectively (P for trend < 0.01). There was significant reductions in the proportion of unilateral or bilateral nerve conduction abnormality, mild or moderate-to-severe DPN, and a marked increase in levels of SNCV and SNAP in T2DM patients with a higher VFA quartile compared to those with a lower VFA quartile (all P<0.01, Supplementary Table 1).
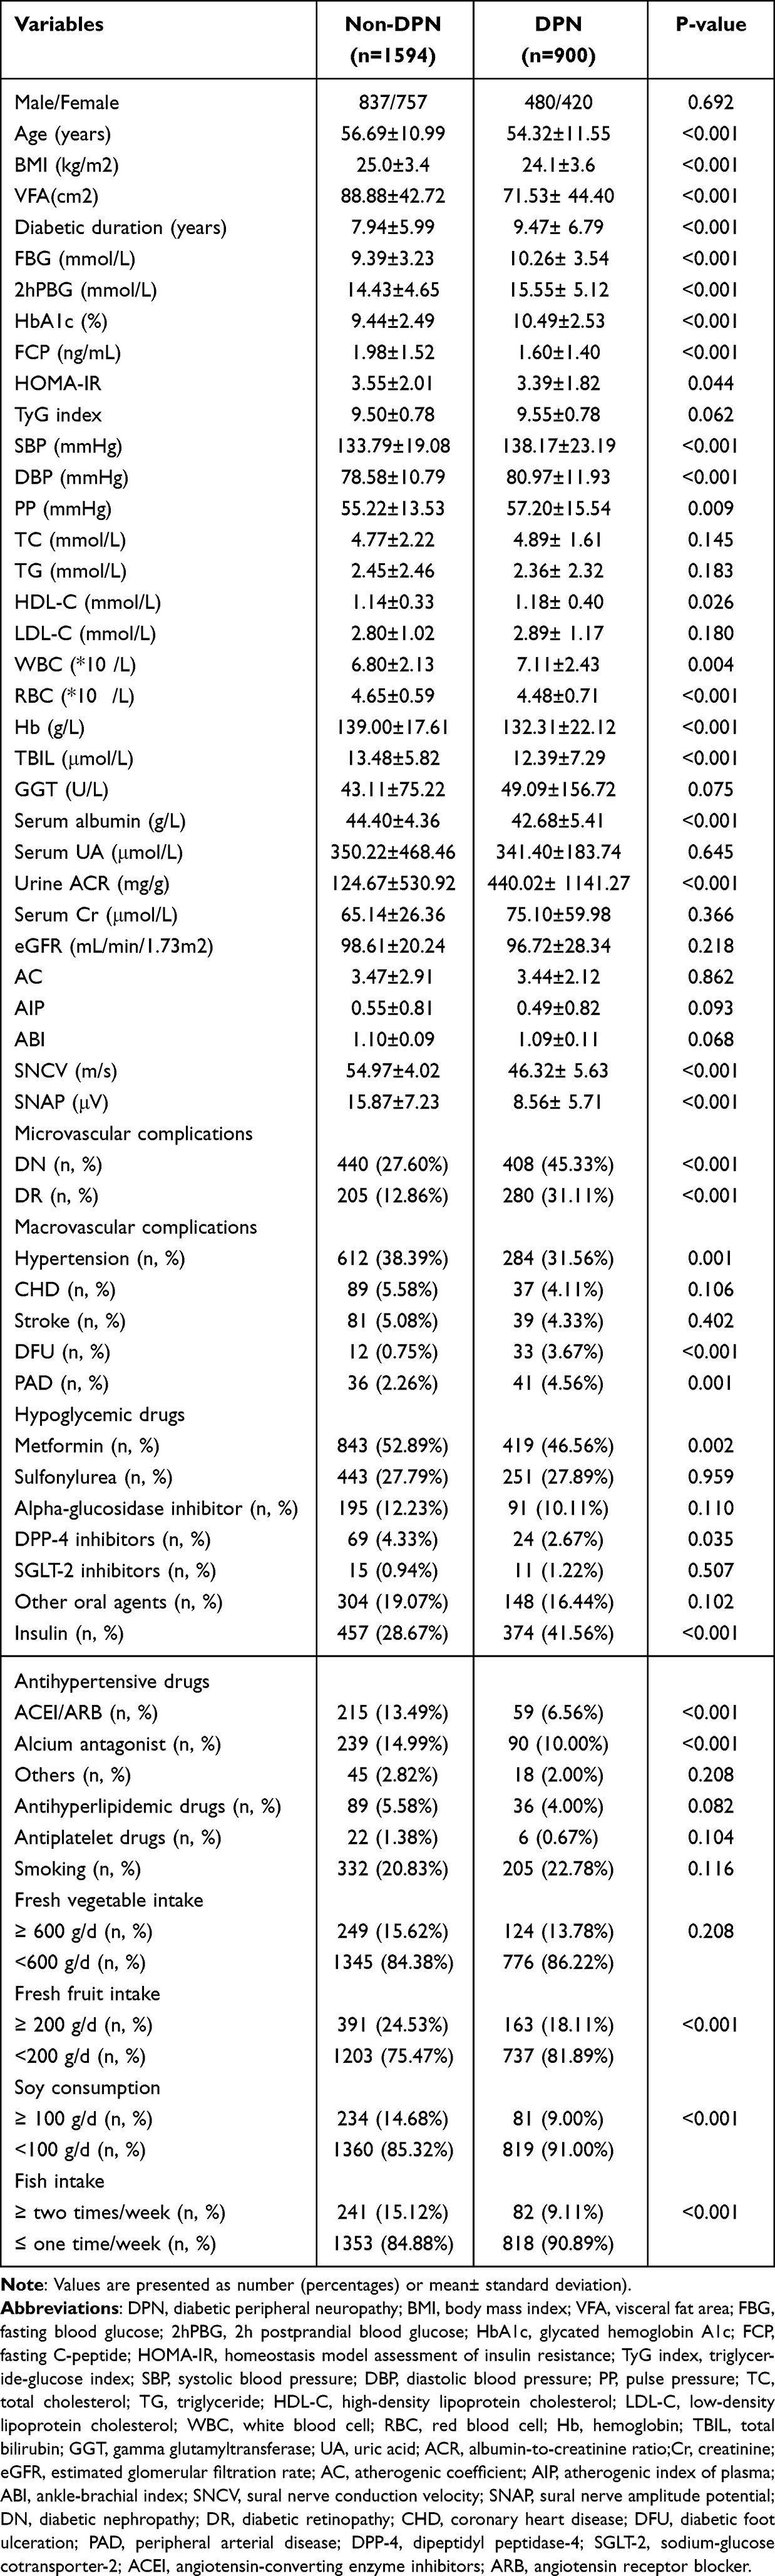 |
Table 1 Clinical and Biochemical Characteristics of Patients Stratified by Presence of DPN |
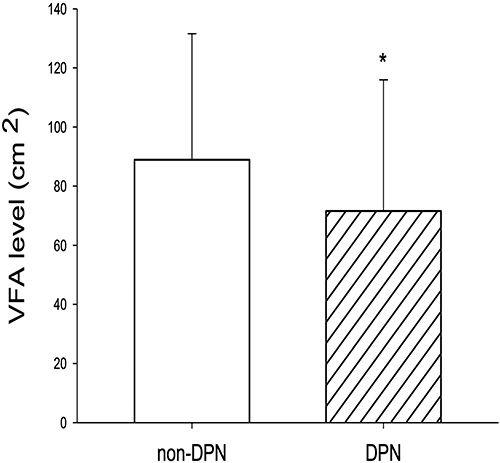 |
Figure 2 Comparison of VFA levels between non-DPN and DPN groups. *P < 0.01 vs non-DPN group. |
Relationship Between VFA and Risk Factors Associated with DPN in Study Participants
VFA levels were positively correlated with SNCV, SNAP, age, BMI, duration of diabetes, SBP, DBP, PP, TG, TyG index, AIP, AC, FCP, HOMA-IR, Hb, RBC, WBC, TBIL, GGT, serum albumin, UA, Cr, prevalence of hypertension and CHD, use of antihypertensive and antihyperlipidemic drugs, fresh vegetable and fish intake, and negatively correlated with gender, HbA1c, HDL-C, eGFR, and prevalence of DPN and DR (P<0.01 or P<0.05; Table 2). After adjusting for age, gender, BMI, and diabetes duration, the correlations between VFA and SNCV, SNAP, HbA1c, AIP, AC, TyG index, HOMA-IR, FCP, UA, and prevalence of hypertension, DPN, DR, and use of antihypertensive and antihyperlipidemic drugs, fresh vegetable intake remained statistically significant (P<0.01 or P<0.05).
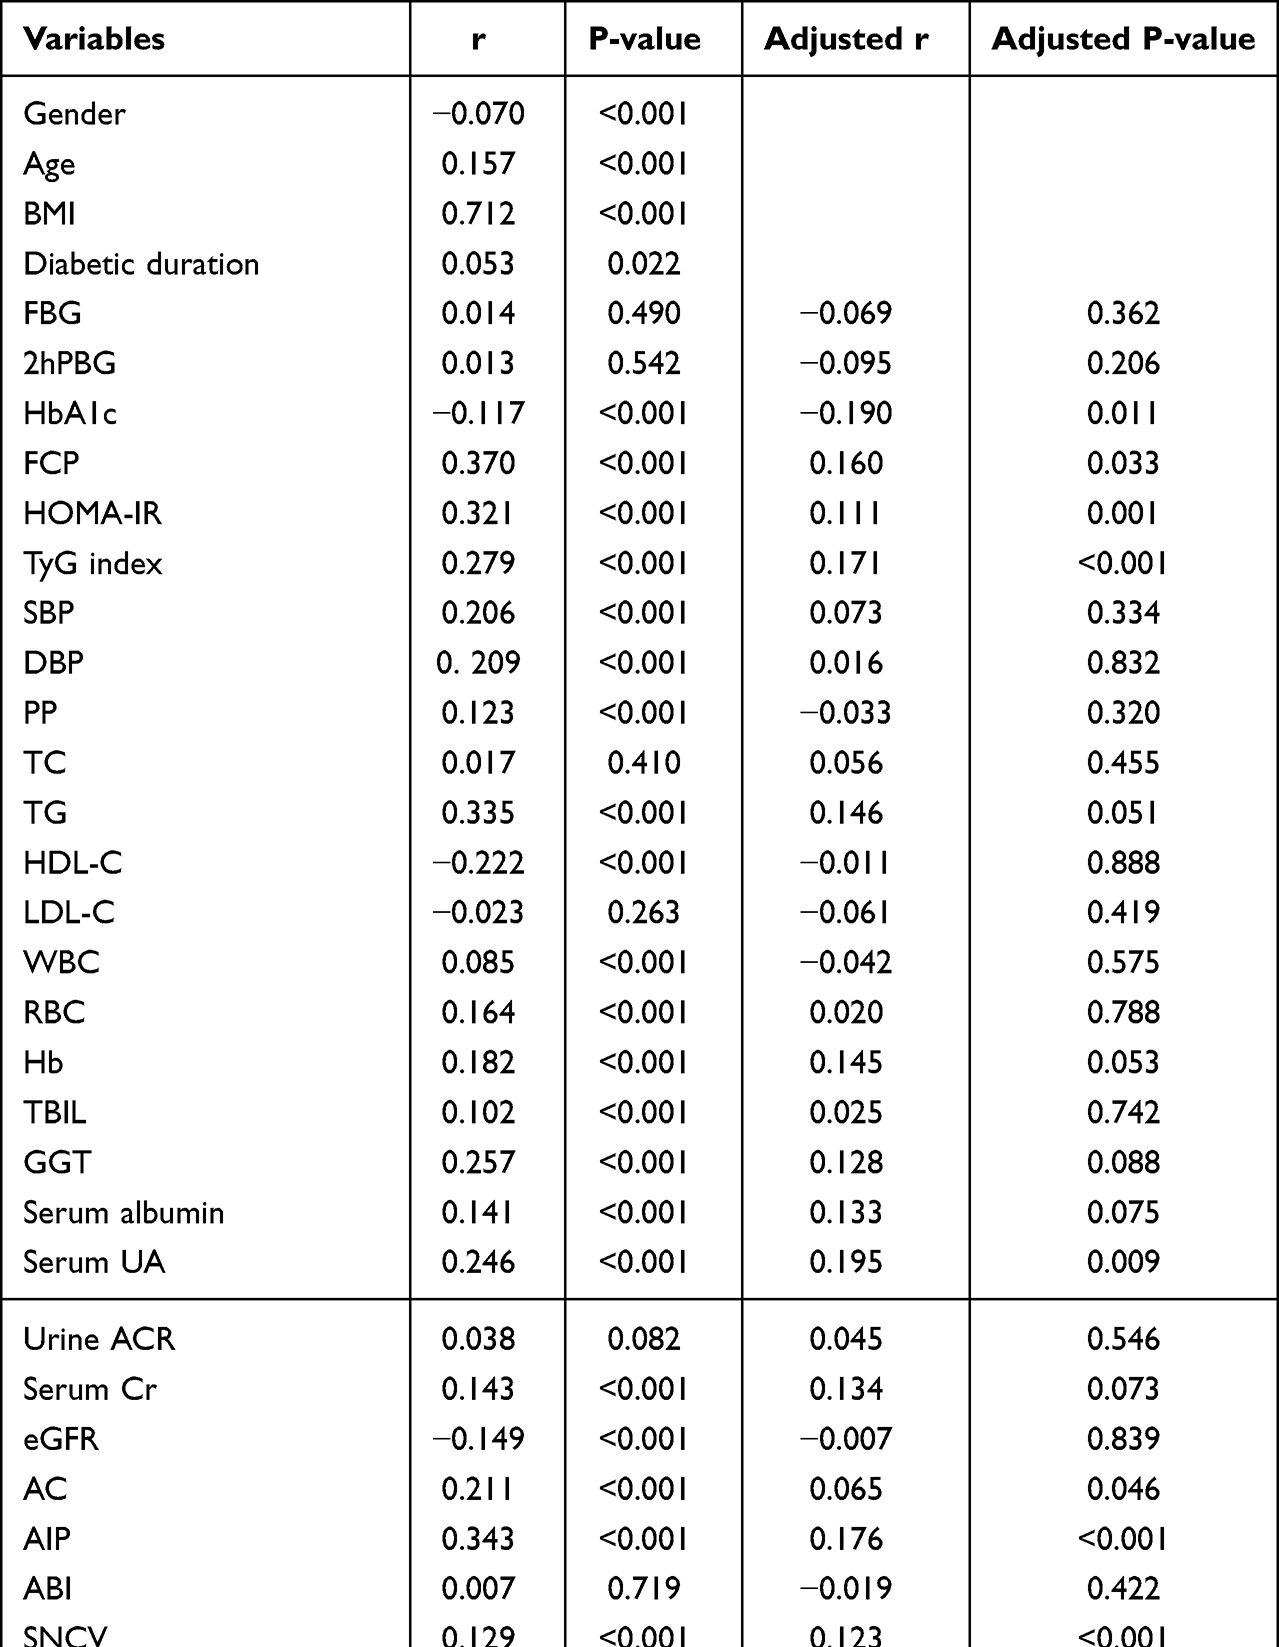 |
Table 2 Relationship Between VFA and Risk Factors Associated with DPN in Study Participants |
Association of VFA Quartiles with DPN Risk in Study Populations
Table 3 revealed the correlation of VFA quartiles with the risk of presence of DPN. The risk of presence of DPN was decreased by 36.1% for each SD increase in VFA in Model 1 (OR=0.639, 95% CI 0.582–0.702, P<0.01), and were further reduced when further adjustment for parameters, such as anthropometry, glucolipid metabolism, inflammation, oxidative stress, diabetic vasculopathy, medication status, smoking, fresh vegetable and fruit intake, soy consumption, and fish intake in Model 5 (OR=0.467, 95% CI 0.336–0.649, P<0.01). In addition, the risk of presence of DPN was gradually reduced with increasing VFA quartiles in Model 1–5 (all P for trend <0.01), and there was a significantly lower risk of presence of DPN in patients with the highest quartile of VFA levels than those in the lowest quartile after multivariate adjustment (OR=0.341, 95% CI 0.137–0.847, P<0.01).
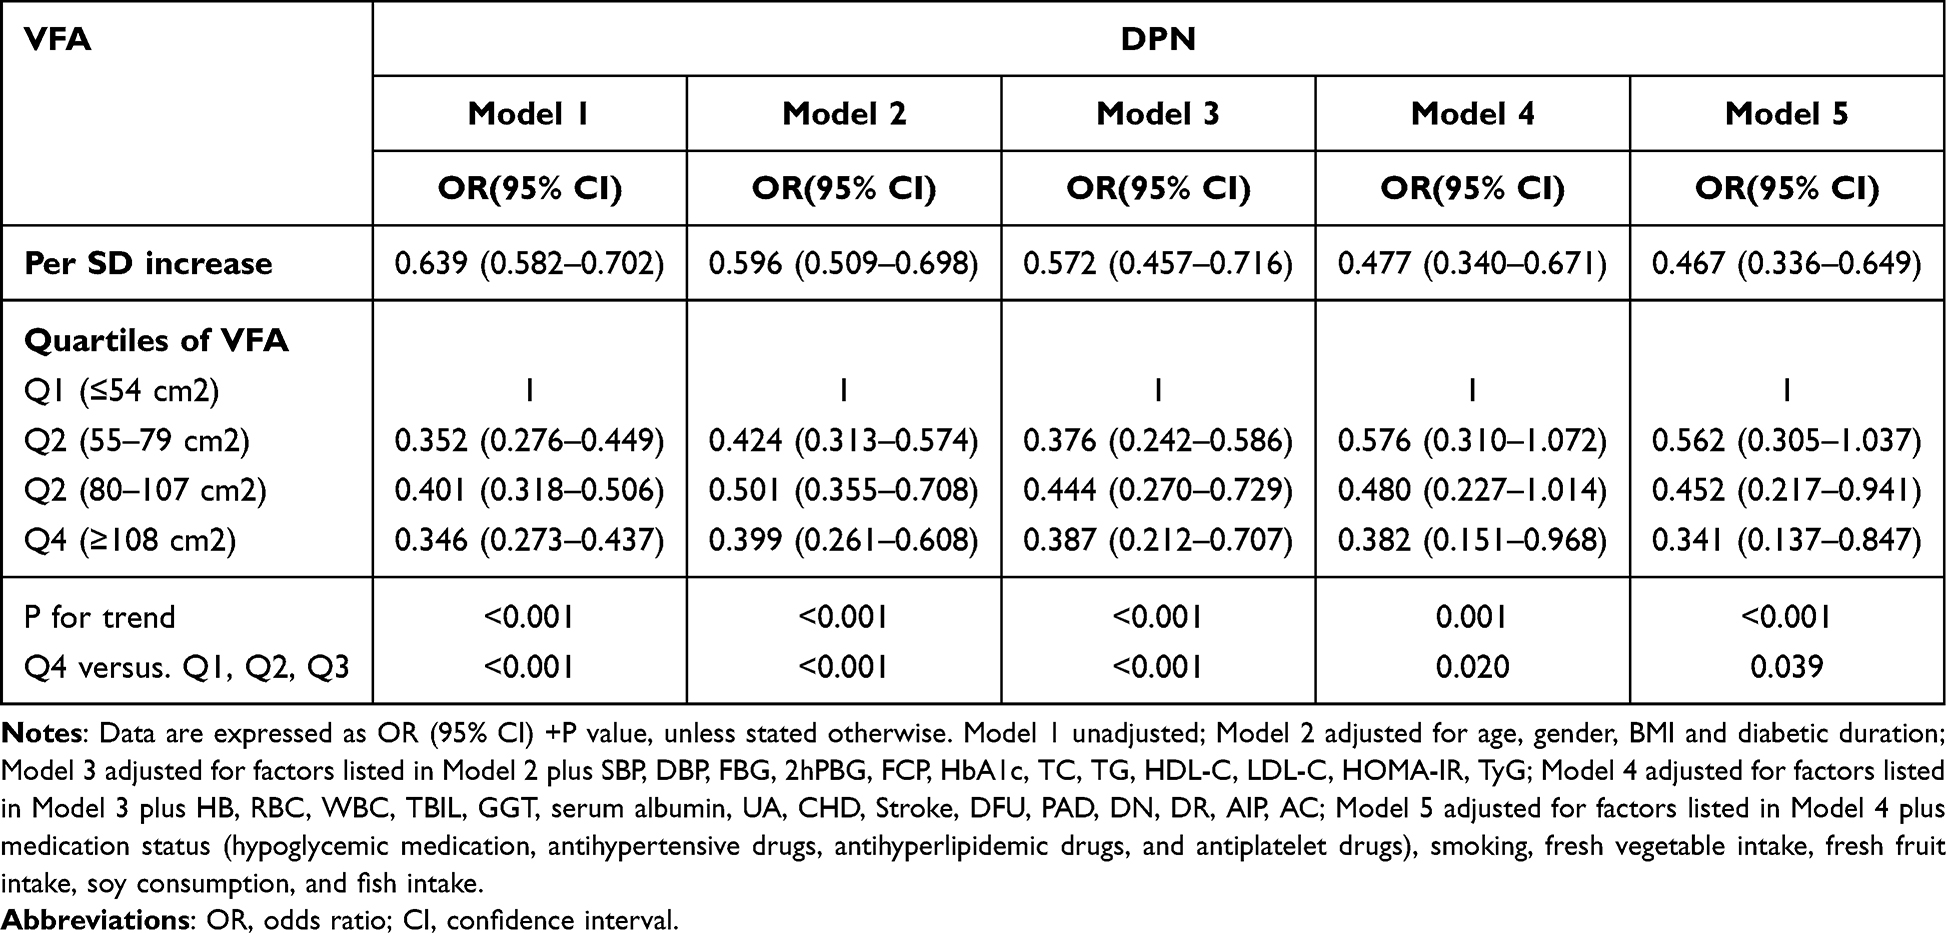 |
Table 3 OR and 95% CI of the Risk of DPN According to VFA Quartiles |
The Analysis of Non-Linear Relationship Between VFA and Risk of DPN
In the present study, we explored the non-linear relationship between VFA and the risk of DPN because VFA was a continuous variable (Figure 3). We used the two-piecewise linear regression model to calculate the inflection point of the VFA to predict the risk of DPN was 104 (Table 4, after adjusting parameters such as anthropometry, glucolipid metabolism, inflammation, oxidative stress, diabetic vasculopathy, medication status, smoking, fresh vegetable and fruit intake, soy consumption, and fish intake). On the left of the inflection point, a negative relationship was established on the DPN and the risk of DPN (OR = 0.980, 95% CI: 0.970–0.989, P = 0.000). On the right of the inflection point, the relationship was getting saturated (OR = 0.989, 95% CI: 0.974–1.004, P = 0.150). However, compared with the standard linear regression model, the difference is not statistically significant (P for log-likelihood ratio test was 0.344). Thus, the relationship between VFA and the risk of DPN did not conform to the curve relationship, and for each 1cm2 increase in VFA, the risk of DPN decreased by 1.8% (95% CI 0.974–0.990, P<0.01).
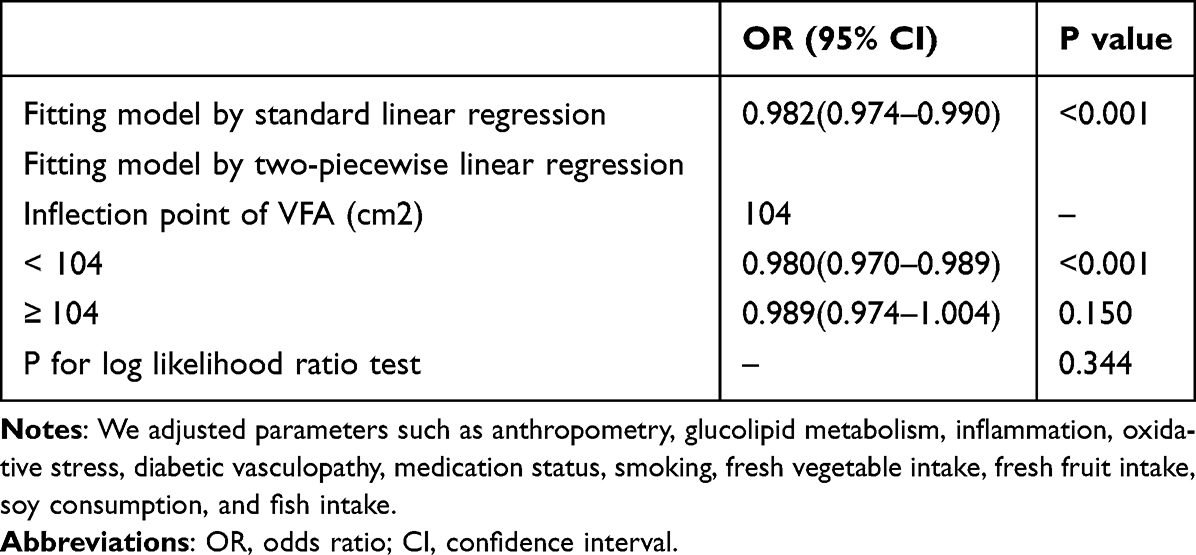 |
Table 4 The Result of Two-Piecewise Linear Regression Model |
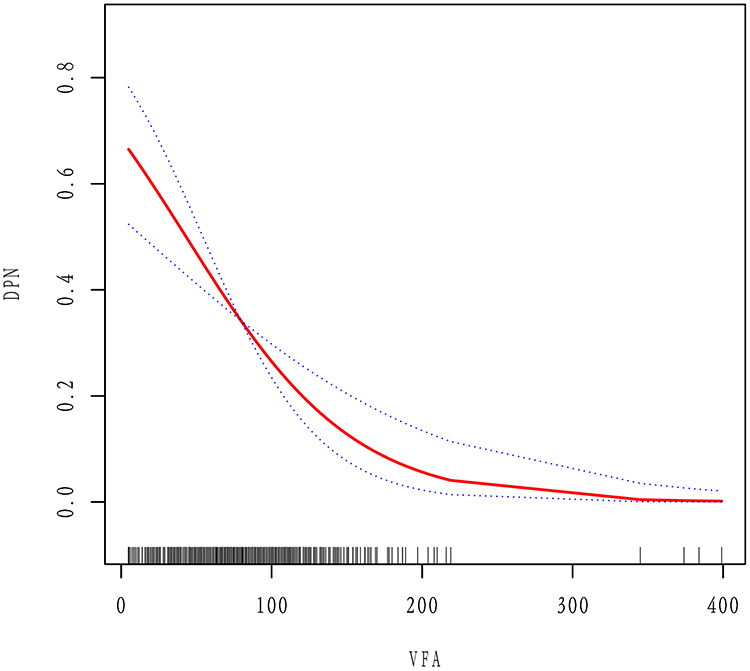 |
Figure 3 Multivariate adjusted smoothing spline plots of the Risk of DPN hospitalized patients with T2DM. We adjusted parameters such as anthropometry, glucolipid metabolism, inflammation, oxidative stress, and diabetic vasculopathy in Model 5 of Table 3. The solid red line represents the best-fit line, and the dotted blue lines are 95% confidence intervals. |
Predictive Value of VFA in Screening for the Presence of DPN in T2DM Patients
To further explore the predictive value of VFA for DPN, the ROC curve analysis was performed. The results showed that the optimal cut-off value for VFA to predict the presence of DPN was 50.5cm2 (AUC=0.621, 95% CI, 0.597–0.644; Youden index=0.184; sensitivity, 84.40%; specificity, 34.00%) (Figure 4).
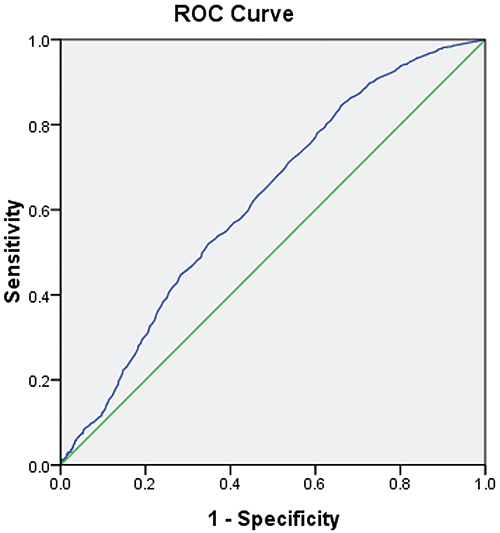 |
Figure 4 ROC analysis of visceral fat area (VFA) to predict the presence of DPN in T2DM patients. AUC = 0.621; 95% CI, 0.597–0.644; P<0.001; identified VFA cutoff value = 50.5 cm2; Youden index = 0.184; sensitivity: 84.40%; specificity: 34.00%. |
Discussion
To our knowledge, this is the first study to explore the relationship between VFA and the risk of presence of DPN in Chinese population. We found that VFA levels were significantly lower in T2DM patients with DPN compared with those with higher VFA quartile had a significant increase in SNCV and SNAP. Moreover, VFA level was positively correlated with SNCV and SNAP; there was no significant difference in the curve fitting. Additionally, VFA level was an independent decisive factor for the presence of DPN after multivariate adjustment. Further, VFA levels with 50.5 cm2 could predict the presence of DPN. These findings suggest that lower VFA may be associated with an increased risk of presence of DPN.
Numerous studies have demonstrated that obesity, especially visceral adiposity, plays an important role in the onset and development of DPN.6,42 Visceral adiposity, commonly assessed by WC, could contribute to IR, hyperglycaemia, dyslipidemia, hypertension, chronic inflammation and oxidative stress,43,44 and has been reported to be associated with damaged nerve conduction velocity and higher DPN risk.45 VFA, which can provide relatively accurate estimates of VAT, might also be correlated with DPN. Oh et al showed that VFA level was higher in middle-aged T2DM patients with DPN than those without DPN, and VFA level was associated with a 2.6% increase in likelihood of DPN.7 On the contrary, another study of 90 Japanese patients with T2DM conducted by Tayama et al demonstrated that levels of preperitoneal fat determined by ultrasonography, an indicator of visceral fat deposition, were positively correlated with motor or sensory nerve conduction velocity.46 The present study’s findings were in contrast to the report performed by Oh et al7 which can be partially explained by different study population, sample size, racial origins, determination method of VFA, diagnostic criteria of DPN, and adjusted confounding factors. Interestingly, however, the results of our present study were similar to the results obtained in a previous study.46 We showed that patients with DPN had significantly lower VFA levels than those without DPN, and VFA level was positively correlated with neurophysiological parameters including SNCV and SNAP. Moreover, VFA level was a significant and independent risk factor for the presence of DPN, and there was a 52.3% decrease in the risk of presence of DPN for each SD increase in VFA after multi-factorial adjustment. In addition, VFA levels with 50.5 cm2 could predict the presence of DPN. These findings suggest that an appropriately high level of VFA may have a protective effect on DPN. Further, we demonstrated that there was significant reductions in the proportion of nerve conduction abnormality, mild or moderate-to-severe DPN, and marked increase in SNCV and SNAP in T2DM patients with a higher VFA quartile compared to those with a lower quartile, suggesting that VFA levels may be associated with the presence and severity of DPN, and higher VFA may confer a decreased risk of DPN in a Chinese population of T2DM patients.
Biological mechanisms that explain the relationships between VFA levels and DPN prevalence have not been elucidated, but there are some potential candidates. First, growing evidence suggests that multiple adipocytokines secreted by VAT could exert beneficial effects such as regulating glucose and lipid metabolism, inflammation and oxidative stress, improving insulin resistance and endothelial function, and ameliorating atherosclerosis,43 all of which partially offset the negative effects of obesity. Second, the metabolic protective effects of subcutaneous fat accumulation itself on DPN can be also an important reason.45 Third, although diabetic subjects with visceral obesity (high level of VFA) often have dyslipidemia and multiple complications including DN, hypertension, and CHD than those without (low level of VFA), they may pay more attention to their illness, and employ various strategies including tight control of blood glucose, blood pressure, and blood lipids and other risk factors, and change the composition of the diet (eating more fresh vegetable and fruit, and fish), all of which were significantly associated with decreased visceral fat and improvement of overall nutritional status and peripheral nerves function.47–50 Fourth, it is a plausible explanation that inadvertent weight loss may occur in individuals with longstanding inadequate diabetes control as consequences of multiple systemic insults or comorbidities.51 There have been a few studies reporting that in individuals with progressive metabolic deterioration due to lack of diabetes control, obviously elevated resting metabolic rate would lead to ongoing increased energy expenditure, which may have a long-term impact on body weight or body composition regulation that appears as sustained unintentional weight loss.52 However, more evidence is required from longitudinal and randomized controlled studies to validate our suspicion.
Evidence suggests that long-term hyperglycemia and related chronic low-grade inflammation and oxidative stress play important roles in the development of DPN.1,53,54 HbA1c as an index of long-term glycemic control has been demonstrated to be a strong independent predictor of DPN in both cross-sectional and prospective epidemiological studies.53,55 In the present study, we found that patients with DPN had significantly longer diabetic duration and higher FBG, 2hPBG, and HbA1c compared with those without DPN, suggesting the possible role of poor glycemic control in the development of DPN. Also, we found that FCP was significantly decreased in DPN subjects along with longer diabetic duration, and VFA level was positively correlated with FCP and negatively with HbA1c, demonstrating that weakened or even deterioration of pancreatic islet β cell function induced by long-term hyperglycemia may lead to increased prevalence of DPN, and may at least partially mediate a potential relationship between VFA and DPN. Additionally, we found that diabetic subjects with the lower VFA quartiles have lower level of FCP and higher prevalence of DR and DPN compared with those with higher quartiles, which was similar to the findings of previous studies that diabetes comprises several subtypes (clusters) with distinct heterogeneous features, and cluster 2 (insulin deficient), represent a new form of diabetes previously masked within type 2 diabetes, had the highest risk of DR.15,16 Together, these data suggested that insulin deficiency or hyperglycaemia appeared to be important triggers of DPN in diabetic subjects with lower VFA, but more research is still needed to validate these findings. Moreover, our study provided further evidence supporting the potential role of increased inflammatory oxidative response induced by long-term hyperglycemia in the development of DPN, since we showed that patients with DPN had significantly higher levels of WBC (pro-inflammatory marker) and lower levels of RBC, Hb, TBIL, and serum albumin (antioxidative biomarkers) compared with those without DPN. Further, we showed that VFA levels were positively correlated with WBC, Hb, RBC, TBIL, UA, and serum albumin, which are partially inconsistent with previous studies.56–61 Together, these lines of evidence, combined with the results of our study, suggested that increased inflammatory response and decreased antioxidant capacity induced by long-term hyperglycemia may be involved in the negative association of VFA levels and DPN, and an appropriately high level of VFA may exert a neuroprotective effect by regulating inflammatory oxidative response. Perhaps the protective effect of VFA is weakened because of the decreased VFA and impairment of VAT function in T2DM patients with DPN; however, the specific mechanism remains to be further investigated.
Considerable evidence suggests that that macro- and microvascular complications associated with atherosclerosis due to endothelial dysfunction are the critical factors in the development of DPN.1,53,54,62 Urine ACR as a sensitive marker of DN and strong predictor of future progression of renal dysfunction has been reported to be an important marker of microvascular damage and generalized endothelial dysfunction.63 Our study found that patients with DPN had significantly higher blood pressure, urine ACR, and prevalence of DFU, PAD, DN, and DR compared with those without DPN, supporting the potential role of atherosclerotic vascular lesions in the development of DPN. Moreover, we demonstrated that VFA levels were positively correlated with atherogenic indices (TyG index, AIP, and AC) and prevalence of hypertension and its components (SBP, DBP), and negatively correlated with prevalence of DR independent of age, gender, BMI, and diabetes duration, in good agreement with previous studies.52,64–67 A cross-sectional study conducted by Song et al revealed that AIP was higher in the VFA ≥100 cm2 group, and VFA level was an independent related factor of AIP in 175 Chinese patients with T2DM.67 Another cross-sectional study of 326 participants with MetS in Spain performed by Bullón-Vela et al showed that TyG index increased with VAT tertiles, and could be a reliable indicator of VAT in subjects at high cardiovascular risk diagnosed with MetS.66 Data from two population-based cohort studies showed that visceral fat index and VAT were significantly and positively associated with blood pressure and risk of hypertension.64,65 Recently, Sasongko et al demonstrated that per SD increases in visceral fat (0.77 [0.67–0.88]) were significantly associated with decreased odds of having any level of DR, and VF was also inversely associated with severity of DR in a cross-sectional study from Jogjakarta Eye Diabetic Study in the Community.52 Both our hereby presented findings and the results of previous studies indicate that visceral fat accumulation could lead to atherosclerotic vascular diseases probably through multiple risk factors, and might mediate the relationship of VFA with DPN; however, the mechanism of action needs to be further investigated.
There are still some limitations in our study. First, because this was a cross-sectional and retrospective study, it is difficult to assess the causal relationship between VFA and DPN, which need to be further confirmed by prospective studies. Second, the current “gold standard” for the diagnosis of DPN is nerve conduction study (NCS); however, professional staff and expensive equipment required make the NCS less frequently used and difficult to apply in large studies. Therefore, DPN Check was used to assess sural nerve conduction, which has a sensitivity of 95% and a specificity of 71% when compared to traditional NCS in patients with DPN, with reproducible results.27 Third, our findings may not be generalizable to other populations with different ethnic and severity of disease because the present study was based on Chinese Han inpatients with T2DM at a single center, who generally had more serious illness than diabetic outpatients. Fourth, we only evaluated WBC as inflammation marker, and serum albumin, TBIL, RBC, Hb, GGT, and UA as oxidative stress parameters. The lack of classical inflammatory and oxidative stress markers, such as C-reactive protein, tumor necrosis factor-α, interleukin-6, glutathione, or superoxide dismutase analysis and/or correlation makes it difficult to draw any consistent conclusion regarding the possibility of these indicators as mentioned above to predict and evaluate the relationship of VFA with the presence of DPN. Finally, as we did not measure adipokines such as adiponectin, omentin-1 and vaspin in study subjects that were not analyzed in the final results, which might have influenced the results. Despite these limitations, the current study is not without strengths, including a relatively large sample size, the use of a standardized method at a single center, and adequate adjustment, which can raise the reliability of our findings. More importantly, our study, to our knowledge, provides the first clinical evidence on a potential link between VFA and DPN in Chinese patients with T2DM.
Conclusion
The present study suggest that lower VFA level may be independently associated with increased risk of presence of DPN in hospitalized Chinese patients with T2DM, and lower VFA level might mediate the development and progression of DPN through various mechanisms, such as dysregulation and dysfunction of adipocytokines, intervention of diet composition and medication, insulin deficiency or hyperglycaemia, inflammatory oxidative response and atherosclerotic vascular diseases. Further prospective studies are needed to clarify the associations of VFA with DPN and to elucidate the precise mechanism underlying the association.
Data Sharing Statement
The original contributions presented in the study are included in the article/Supplementary Material. Further inquiries can be directed to the corresponding authors.
Ethics Approval and Informed Consent
The study was performed in accordance with the ethical guidelines of the 1975 Declaration of Helsinki and was reviewed and approved by was approved by the Human Research Ethics Committee of the Affiliated Hospital of Southwest Medical University (No. 2018017). The patients provided their written informed consent to participate in this study.
Consent for Publication
All authors gave final approval of the version to be published and agreed to be listed as authors.
Acknowledgments
The authors would like to thank all the colleagues in clinical laboratory center and endocrine laboratory, and all the nurses in our department for their hard work and valuable assistance with this study.
Author Contributions
All the authors contributed significantly to the manuscript. YRW conducted the population study, analyzed and interpreted the data, and drafted the manuscript. PJY significantly revised the draft, interpreted the data, and involved in data analyses. JL, KL, QW, and YX conducted the study, collected the information and participated in data interpretation. ZHZ, QT, YM, and PC involved in the sample test, data management and draft revision. PJY is the PI of project, who designed the study and critically revised the manuscript. All authors read and approved the final manuscript.
Funding
This study is supported by the grants from the Ministry Science and Technology of China (2016YFC0901200, 2016YFC0901205), research grants from Luzhou Science and Technology Bureau [2013-S-48 (22/30))] and Health Commission of Luzhou City (18173).
Disclosure
The authors declare that the research was conducted in the absence of any commercial or financial relationships that could be construed as a potential conflict of interest.
References
1. Sloan G, Selvarajah D, Tesfaye S. Pathogenesis, diagnosis and clinical management of diabetic sensorimotor peripheral neuropathy. Nat Rev Endocrinol. 2021;17(7):400–420. doi:10.1038/s41574-021-00496-z
2. Carmichael J, Fadavi H, Ishibashi F, Shore AC, Tavakoli M. Advances in screening, early diagnosis and accurate staging of diabetic neuropathy. Front Endocrinol. 2021;12:671257. doi:10.3389/fendo.2021.671257
3. Moosaie F, Ghaemi F, Mechanick JI, et al. Obesity and diabetic complications: a study from the nationwide diabetes report of the National Program for Prevention and Control of Diabetes (NPPCD-2021) implications for action on multiple scales. Prim Care Diabetes. 2022;16(3):422–429. doi:10.1016/j.pcd.2022.03.009
4. Anan F, Masaki T, Ito Y, et al. Diabetic retinopathy is associated with visceral fat accumulation in Japanese type 2 diabetes mellitus patients. Metab Clin Exp. 2010;59(3):314–319. doi:10.1016/j.metabol.2009.06.001
5. Neeland IJ, Ross R, Despres JP, et al. Visceral and ectopic fat, atherosclerosis, and cardiometabolic disease: a position statement. Lancet Diabetes Endo. 2019;7(9):715–725. doi:10.1016/S2213-8587(19)30084-1
6. Gao S, Zhang HL, Long C, Xing ZH. Association between obesity and microvascular diseases in patients with type 2 diabetes mellitus. Front Endocrinol. 2021;12. doi:10.3389/fendo.2021.719515
7. Oh TJ, Lee JE, Choi SH, Jang HC. Association between body fat and diabetic peripheral neuropathy in middle-aged adults with type 2 diabetes mellitus: a preliminary report. J Obes Metab Syndr. 2019;28(2):112–117. doi:10.7570/jomes.2019.28.2.112
8. Tesfaye S. Recent advances in the management of diabetic distal symmetrical polyneuropathy. J Diabetes Investig. 2011;2(1):33–42. doi:10.1111/j.2040-1124.2010.00083.x
9. Mendez-Morales ST, Perez-De Marcos JC, Rodriguez-Cortes O, et al. Diabetic neuropathy: molecular approach a treatment opportunity. Vasc Pharmacol. 2022;143. doi:10.1016/j.vph.2022.106954
10. Kershaw EE, Flier JS. Adipose tissue as an endocrine organ. J Clin Endocrinol Metab. 2004;89(6):2548–2556. doi:10.1210/jc.2004-0395
11. Qiu Y, Deng X, Sha Y, et al. Visceral fat area, not subcutaneous fat area, is associated with cardiac hemodynamics in type 2 diabetes. Diabetes Metab Syndr Obes. 2020;13:4413–4422. doi:10.2147/DMSO.S284420
12. Yang X, Lin Y, Xu GD, et al. Optimal cut-off values of visceral fat area for predicting metabolic syndrome among type 2 diabetes patients in Ningbo, China. Diabet Metab Synd Ob. 2021;14:1375–1383. doi:10.2147/Dmso.S304164
13. Bouchi R, Ohara N, Asakawa M, et al. Is visceral adiposity a modifier for the impact of blood pressure on arterial stiffness and albuminuria in patients with type 2 diabetes? Cardiovasc Diabetol. 2016;15. doi:10.1186/s12933-016-0335-3
14. Kurajoh M, Koyama H, Kadoya M, et al. Plasma leptin level is associated with cardiac autonomic dysfunction in patients with type 2 diabetes: HSCAA study. Cardiovasc Diabetol. 2015;14. doi:10.1186/s12933-015-0280-6
15. Ahlqvist E, Storm P, Käräjämäki A, et al. Novel subgroups of adult-onset diabetes and their association with outcomes: a data-driven cluster analysis of six variables. Lancet Diabetes Endocrinol. 2018;6(5):361–369. doi:10.1016/S2213-8587(18)30051-2
16. Zaharia OP, Strassburger K, Knebel B, et al. Role of patatin-like phospholipase domain-containing 3 gene for hepatic lipid content and insulin resistance in diabetes. Diabetes Care. 2020;43(9):2161–2168. doi:10.2337/dc20-0329
17. Alberti KG, Zimmet PZ. Definition, diagnosis and classification of diabetes mellitus and its complications. Part 1: diagnosis and classification of diabetes mellitus provisional report of a WHO consultation. Diabet Med. 1998;15(7):539–553.
18. Yang W, Lu J, Weng J, et al. Prevalence of diabetes among men and women in China. N Engl J Med. 2010;362(12):1090–1101. doi:10.1056/nejmoa0908292
19. Guerrero-Romero F, Simental-Mendia LE, Gonzalez-Ortiz M, et al. The product of triglycerides and glucose, a simple measure of insulin sensitivity. Comparison with the euglycemic-hyperinsulinemic clamp. J Clin Endocrinol Metab. 2010;95(7):3347–3351. doi:10.1210/jc.2010-0288
20. Yan PJ, Xu Y, Wan Q, et al. Decreased plasma neuregulin 4 concentration is associated with increased high-sensitivity C-reactive protein in newly diagnosed type 2 diabetes mellitus patients: a cross-sectional study. Acta Diabetol. 2017;54(12):1091–1099. doi:10.1007/s00592-017-1044-4
21. Cao Y, Li XY, Lu C, Zhan XR. The relationship between vitronectin and hepatic insulin resistance in type 2 diabetes mellitus. Endocr J. 2018;65(7):747–753. doi:10.1507/endocrj.EJ17-0504
22. Yan PJ, Xu Y, Miao Y, et al. Association of remnant cholesterol with chronic kidney disease in middle-aged and elderly Chinese: a population-based study. Acta Diabetol. 2021;58(12):1615–1625. doi:10.1007/s00592-021-01765-z
23. Yan PJ, Xu Y, Zhang ZH, et al. Association of circulating omentin-1 with osteoporosis in a Chinese type 2 diabetic population. Mediators Inflamm. 2020;2020. doi:10.1155/2020/9389720
24. Omura-Ohata Y, Son C, Makino H, et al. Efficacy of visceral fat estimation by dual bioelectrical impedance analysis in detecting cardiovascular risk factors in patients with type 2 diabetes. Cardiovasc Diabetol. 2019;18(1). doi:10.1186/s12933-019-0941-y
25. Miyasato Y, Oba K, Yasuno S, Matsuyama Y, Masuda I. Associations between visceral obesity and renal impairment in health checkup participants: a retrospective cohort study. Clin Exp Nephrol. 2020;24(10):935–945. doi:10.1007/s10157-020-01921-9
26. Enomoto M, Adachi H, Fukami A, et al. A useful tool as a medical checkup in a general population-bioelectrical impedance analysis. Front Cardiovasc Med. 2017;4. doi:10.3389/fcvm.2017.00003
27. Lee JA, Halpern EM, Lovblom LE, Yeung E, Bril V, Perkins BA. Reliability and validity of a point-of-care sural nerve conduction device for identification of diabetic neuropathy. PLoS One. 2014;9(1). doi:10.1371/journal.pone.0086515
28. Hirayasu K, Sasaki H, Kishimoto S, et al. Difference in normal limit values of nerve conduction parameters between Westerners and Japanese people might need to be considered when diagnosing diabetic polyneuropathy using a Point-of-Care Sural Nerve Conduction Device (NC-stat (R)/DPNCheck). J Diabetes Investig. 2018;9(5):1173–1181. doi:10.1111/jdi.12818
29. Kurisu S, Sasaki H, Kishimoto S, et al. Clinical polyneuropathy does not increase with prediabetes or metabolic syndrome in the Japanese general population. J Diabetes Investig. 2019;10(6):1565–1575. doi:10.1111/jdi.13058
30. Vogt EC, Oksnes M, Suleiman F, et al. Assessment of diabetic polyneuropathy in Zanzibar: comparison between traditional methods and an automated point-of-care nerve conduction device. J Clin Transl Endocrinol. 2017;10:9–14. doi:10.1016/j.jcte.2017.09.001
31. Tesfaye S, Boulton AJM, Dyck PJ, et al. Diabetic neuropathies: update on definitions, diagnostic criteria, estimation of severity, and treatments. Diabetes Care. 2010;33(10):2285–2293. doi:10.2337/dc10-1303
32. Andersen ST, Witte DR, Andersen H, et al. Risk-factor trajectories preceding diabetic polyneuropathy: ADDITION-Denmark. Diabetes Care. 2018;41(9):1955–1962. doi:10.2337/dc18-0392
33. Breiner A, Lovblom LE, Perkins BA, Bril V. Does the prevailing hypothesis that small-fiber dysfunction precedes large-fiber dysfunction apply to type 1 diabetic patients? Diabetes Care. 2014;37:1418–1424.
34. Bril V, Perkins BA. Validation of the Toronto clinical scoring system for diabetic polyneuropathy. Diabetes Care. 2002;25(11):2048–2052. doi:10.2337/diacare.25.11.2048
35. Weisman A, Bril V, Ngo M, et al. Identification and prediction of diabetic sensorimotor polyneuropathy using individual and simple combinations of nerve conduction study parameters. PLoS One. 2013;8(3):e58783. doi:10.1371/journal.pone.0058783
36. Hamasaki H, Hamasaki Y. Diabetic neuropathy evaluated by a novel device: sural nerve conduction is associated with glycemic control and ankle-brachial pressure index in Japanese patients with diabetes. Front Endocrinol. 2017;8:203. doi:10.3389/fendo.2017.00203
37. Poulose S, Cheriyan E, Poulose A, Cheriyan R, Vadakkanezath B, Ziemer P. Usefulness of the NC-stat DPNCheck nerve conduction test in a community pharmacy as an educational tool for patients with diabetes. Can Pharm J. 2015;148(1):17–20. doi:10.1177/1715163514561055
38. Chow CK, Teo KK, Rangarajan S, et al. Prevalence, awareness, treatment, and control of hypertension in rural and urban communities in high-, middle-, and low-income countries. JAMA-J Am Med Assoc. 2013;310(9):959–968. doi:10.1001/jama.2013.184182
39. Gordin D, Hiilesmaa V, Fagerudd J, et al. Pre-eclampsia but not pregnancy-induced hypertension is a risk factor for diabetic nephropathy in type 1 diabetic women. Diabetologia. 2007;50(3):516–522. doi:10.1007/s00125-006-0544-5
40. Jia F, Tian J, Deng F, et al. Subclinical hypothyroidism and the associations with macrovascular complications and chronic kidney disease in patients with type 2 diabetes. Diabetic Med. 2015;32(8):1097–1103. doi:10.1111/dme.12724
41. McGloin H, Devane D, McIntosh CD, Winkley K, Gethin G. Psychological interventions for treating foot ulcers, and preventing their recurrence, in people with diabetes. Cochrane Db Syst Rev. 2021;2. doi:10.1002/14651858.CD012835.pub2
42. Schlesinger S, Herder C, Kannenberg JM, et al. General and abdominal obesity and incident distal sensorimotor polyneuropathy: insights into inflammatory biomarkers as potential mediators in the KORA F4/FF4 cohort. Diabetes Care. 2019;42(2):240–247. doi:10.2337/dc18-1842
43. Zhao Q, Chen X, Wu J, et al. Optimal cut-offs of body mass index and waist circumference to identify obesity in Chinese type 2 diabetic patients. Diabetes Metab Syndr Obes. 2020;13:1899–1909. doi:10.2147/DMSO.S251574
44. Tchernof A, Despres JP. Pathophysiology of human visceral obesity: an update. Physiol Rev. 2013;93(1):359–404. doi:10.1152/physrev.00033.2011
45. Zhen Q, Yao N, Chen X, Zhang X, Wang Z, Ge Q. Total body adiposity, triglycerides, and leg fat are independent risk factors for diabetic peripheral neuropathy in Chinese patients with type 2 diabetes mellitus. Endocr Pract. 2019;25(3):270–278. doi:10.4158/EP-2018-0459
46. Tayama K, Inukai T, Shimomura Y. Preperitoneal fat deposition estimated by ultrasonography in patients with non-insulin-dependent diabetes mellitus. Diabetes Res Clin Pract. 1999;43(1):49–58. doi:10.1016/s0168-8227(98)00118-1
47. Sheng H, Zhang H, Zhang W, Sun G. Dietary fructose intake is correlated with fat distribution in the Newfoundland population. Nutrition. 2022;93:111434. doi:10.1016/j.nut.2021.111434
48. Marshall SM, Flyvbjerg A. Prevention and early detection of vascular complications of diabetes. BMJ. 2006;333(7566):475–480. doi:10.1136/bmj.38922.650521.80
49. Rahimi-Madiseh M, Malekpour-Tehrani A, Bahmani M, Rafieian-Kopaei M. The research and development on the antioxidants in prevention of diabetic complications. Asian Pac J Trop Med. 2016;9(9):825–831. doi:10.1016/j.apjtm.2016.07.001
50. Coste TC, Gerbi A, Vague P, Pieroni G, Raccah D. Neuroprotective effect of docosahexaenoic acid-enriched phospholipids in experimental diabetic neuropathy. Diabetes. 2003;52(10):2578–2585. doi:10.2337/diabetes.52.10.2578
51. Man RE, Sabanayagam C, Chiang PP, et al. Differential association of generalized and abdominal obesity with diabetic retinopathy in asian patients with type 2 diabetes. JAMA Ophthalmol. 2016;134(3):251–257. doi:10.1001/jamaophthalmol.2015.5103
52. Sasongko MB, Widyaputri F, Sulistyoningrum DC, et al. Estimated resting metabolic rate and body composition measures are strongly associated with diabetic retinopathy in Indonesian adults with type 2 diabetes. Diabetes Care. 2018;41(11):2377–2384. doi:10.2337/dc18-1074
53. Yan P, Xu Y, Zhang Z, et al. Decreased plasma neuregulin 4 levels are associated with peripheral neuropathy in Chinese patients with newly diagnosed type 2 diabetes: a cross-sectional study. Cytokine. 2019;113:356–364. doi:10.1016/j.cyto.2018.10.007
54. Su JB, Zhao LH, Zhang XL, et al. HbA1c variability and diabetic peripheral neuropathy in type 2 diabetic patients. Cardiovasc Diabetol. 2018;17(1):47. doi:10.1186/s12933-018-0693-0
55. Wang N, Guo C, Han P, Li T. Glycated albumin indicates peripheral diabetic neuropathy. Acta Diabetol. 2016;53(6):973–979. doi:10.1007/s00592-016-0900-y
56. Zhang YX, Chen J, Liu XH. Profiles of anemia among school-aged children categorized by body mass index and waist circumference in Shandong, China. Pediatr Neonatol. 2021;62(2):165–171. doi:10.1016/j.pedneo.2020.11.002
57. Couto Alves A, Valcarcel B, Makinen VP, et al. Metabolic profiling of polycystic ovary syndrome reveals interactions with abdominal obesity. Int J Obes. 2017;41(9):1331–1340. doi:10.1038/ijo.2017.126
58. Wu O, Leng JH, Yang FF, et al. A comparative research on obesity hypertension by the comparisons and associations between waist circumference, body mass index with systolic and diastolic blood pressure, and the clinical laboratory data between four special Chinese adult groups. Clin Exp Hypertens. 2018;40(1):16–21. doi:10.1080/10641963.2017.1281940
59. Delgado C, Chertow GM, Kaysen GA, et al. Associations of body mass index and body fat with markers of inflammation and nutrition among patients receiving hemodialysis. Am J Kidney Dis. 2017;70(6):817–825. doi:10.1053/j.ajkd.2017.06.028
60. Takei R, Inoue T, Sonoda N, et al. Bilirubin reduces visceral obesity and insulin resistance by suppression of inflammatory cytokines. PLoS One. 2019;14(10):e0223302. doi:10.1371/journal.pone.0223302
61. Kim JA, Park HS. White blood cell count and abdominal fat distribution in female obese adolescents. Metabolism. 2008;57(10):1375–1379. doi:10.1016/j.metabol.2008.05.005
62. Haas AV, McDonnell ME. Pathogenesis of cardiovascular disease in diabetes. Endocrinol Metab Clin North Am. 2018;47(1):51–63. doi:10.1016/j.ecl.2017.10.010
63. Asakawa H, Tokunaga K, Kawakami F. Relationship of abdominal fat with metabolic disorders in diabetes mellitus patients. Diabetes Res Clin Pract. 2002;55(2):139–149. doi:10.1016/s0168-8227(01)00294-7
64. Wang Z, Zeng X, Chen Z, et al. Association of visceral and total body fat with hypertension and prehypertension in a middle-aged Chinese population. J Hypertens. 2015;33(8):1555–1562. doi:10.1097/HJH.0000000000000602
65. Fox CS, Massaro JM, Hoffmann U, et al. Abdominal visceral and subcutaneous adipose tissue compartments: association with metabolic risk factors in the Framingham Heart Study. Circulation. 2007;116(1):39–48. doi:10.1161/CIRCULATIONAHA.106.675355
66. Bullon-Vela V, Abete I, Tur JA, et al. Relationship of visceral adipose tissue with surrogate insulin resistance and liver markers in individuals with metabolic syndrome chronic complications. Ther Adv Endocrinol Metab. 2020;11:2042018820958298. doi:10.1177/2042018820958298
67. Song P, Xu L, Xu J, et al. Atherogenic index of plasma is associated with body fat level in type 2 diabetes mellitus patients. Curr Vasc Pharmacol. 2018;16(6):589–595. doi:10.2174/1570161116666180103125456
 © 2022 The Author(s). This work is published and licensed by Dove Medical Press Limited. The
full terms of this license are available at https://www.dovepress.com/terms
and incorporate the Creative Commons Attribution
- Non Commercial (unported, 3.0) License.
By accessing the work you hereby accept the Terms. Non-commercial uses of the work are permitted
without any further permission from Dove Medical Press Limited, provided the work is properly
attributed. For permission for commercial use of this work, please see paragraphs 4.2 and 5 of our Terms.
© 2022 The Author(s). This work is published and licensed by Dove Medical Press Limited. The
full terms of this license are available at https://www.dovepress.com/terms
and incorporate the Creative Commons Attribution
- Non Commercial (unported, 3.0) License.
By accessing the work you hereby accept the Terms. Non-commercial uses of the work are permitted
without any further permission from Dove Medical Press Limited, provided the work is properly
attributed. For permission for commercial use of this work, please see paragraphs 4.2 and 5 of our Terms.
Recommended articles
J-Shaped Relationship Between Visceral Fat Area and Large-Nerve Fiber Dysfunction Estimated by Vibration Perception Threshold in Type 2 Diabetes: A Cross-Sectional Study
Tang D, Gu X, Xuan Y, Liu Q, Lu L
Diabetes, Metabolic Syndrome and Obesity 2025, 18:2935-2943
Published Date: 20 August 2025