Back to Journals » Journal of Inflammation Research » Volume 15
Low-Dose Interleukin-2 Altered Gut Microbiota and Ameliorated Collagen-Induced Arthritis
Authors Li N ![]() , Li X, Su R, Wu R, Niu HQ, Luo J
, Li X, Su R, Wu R, Niu HQ, Luo J ![]() , Gao C, Li X, Wang C
, Gao C, Li X, Wang C
Received 21 October 2021
Accepted for publication 26 January 2022
Published 25 February 2022 Volume 2022:15 Pages 1365—1379
DOI https://doi.org/10.2147/JIR.S344393
Checked for plagiarism Yes
Review by Single anonymous peer review
Peer reviewer comments 2
Editor who approved publication: Professor Ning Quan
Na Li,1 Xuefei Li,1 Rui Su,1 Ruihe Wu,1 Hong-Qing Niu,1 Jing Luo,1 Chong Gao,2 Xiaofeng Li,1 Caihong Wang1
1Department of Rheumatology, The Second Hospital of Shanxi Medical University, Taiyuan, Shanxi, People’s Republic of China; 2Pathology, Joint Program in Transfusion Medicine, Brigham and Women’s Hospital/Children’s Hospital, Harvard Medical School, Boston, MA, USA
Correspondence: Caihong Wang, Tel +8613603515399, Fax +863513365551, Email [email protected]
Purpose: Low-dose interleukin-2 (ld-IL-2) has been shown to regulate the balance between effector T and regulatory T (Treg) cells and has been used in several clinical trials to treat autoimmune diseases including rheumatoid arthritis (RA). In this study, we investigated the effects of ld-IL-2 on collagen-induced arthritis (CIA) in mice.
Methods: Arthritis severity in CIA mice was measured using the arthritis index (AI), radiographs, and hematoxylin and eosin staining. Cytokines were detected using enzyme-linked immunosorbent assay. Gut microbiota alterations and short-chain fatty acid production were analyzed through 16S rRNA sequencing and gas chromatography.
Results: The AI scores of CIA mice treated with ld-IL-2 were significantly lower compared to the model group, which significantly reduced the severity of arthritis. Ld-IL-2 also altered the gut microbiota in CIA mice. The diversity, composition, and dominant species of gut microbiota were altered by ld-IL-2 treatment. Ld-IL-2 also increased short-chain fatty acid levels. There was a strong correlation between ld-IL-2 treatment and improved gut microbiota.
Conclusion: Ld-IL-2 significantly ameliorated joint inflammation and bone damage and improved gut microbial dysbiosis in CIA, indicating that it may be a promising therapy for RA patients.
Keywords: low-dose IL-2, CIA, gut microbiota, SCFA, 16sRNA
Introduction
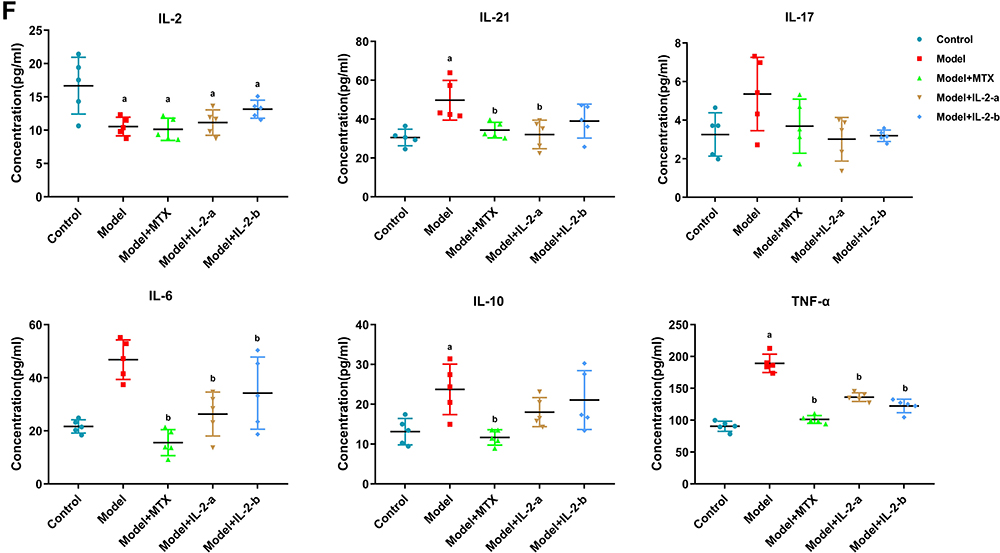
Rheumatoid arthritis (RA), a chronic inflammatory autoimmune disease that affects approximately 1% of the population worldwide, is characterized by synovial inflammation, and cartilage and bone destruction.1–3 At present, immunosuppression is the main treatment strategy, but has some disadvantages including risk of infections and malignant tumors, difficulties in long-term disease suppression, and serious side effects.4–7 Therefore, rheumatism research has focused on new treatment strategies. Figure 1 Continue. Figure 1 Low-dose interleukin-2 ameliorated collagen-induced arthritis in mice. (A) Workflow for the treatment of collagen-induced arthritis in mice. The mice were primarily immunized by injecting (s.c.) an emulsion containing CII and CFA on day 0; they were secondarily immunized with an emulsion containing CII and IFA on day 21. Mice were treated with the drug from day 28 to day 56. (Group I - Controls [non-induced + normal saline]; Group II - Model [treated with type II collagen (CII) for induction of RA + normal saline]; Group III - Model + MTX (0.25 mg/kg oral gavage feeding once per week after arthritis induction; Ld-IL-2 was administered in two doses (IL-2-a and IL-2-b); Group IV - Model + IL-2-a [IL-2: 600,000 IU/kg intraperitoneal (i.p.) injection on alternate days for 28 days after arthritis induction]; Group V - Model + IL-2-b [IL-2: 1,200,000 IU/kg i.p.on alternate days for 28 days after arthritis induction]). (B) Arthritis index scores from day 22 to day 56. Mice treated with MTX and IL-2 showed significantly lower AI scores than did the model group. (C) Representative images of paws from each group on day 56. (D) Radiographs of paws from each group on day 56. (E) Histological analysis of hind paw sections from each group, stained with hematoxylin and eosin (H&E), and assessed via light microscopy. (F) The concentrations of IL-2, IL-6, IL-17, IL-10, IL-21 and TNF-α in serum samples from each group at day 56 were evaluated using ELISA. Data are representative of three or more samples. Independent experiments with ≥4 mice per group. Data are the mean ± SEM. a. p<0.05 compared to control, b. p<0.05 compared to model.
TH cells can enhance the influx of inflammatory cells (eg, neutrophils), which leads to a systemic inflammatory response and stimulates specific B lymphocytes to produce autoantibodies that can promote an autoimmune response. Regulatory T (Treg) cells, a well-studied CD4+ T-cell subset with an immunomodulatory function, play a key role in self-tolerance and the suppression of deleterious immune responses.8,9 The imbalance between Th and Treg cells causes immune tolerance defects and eventually leads to autoimmune diseases. In our previous study, systemic lupus erythematosus (SLE) and Sjogren’s syndrome (SS) patients had significantly lower mean Treg cell numbers in peripheral blood than did healthy controls (HC).10,11 Decreased numbers and function of Treg cells are implicated in the pathogenesis of RA.12 A novel strategy involves increasing the number of Treg cells, and their function, to restore immune tolerance and manage disease progression in RA patients.
High expression of interleukin-2 receptor alpha protein (IL-2Rα)13 triggers IL-2 signaling, which induces the differentiation and proliferation of FOXP3+ Treg cells.14,15 Animal experiments have demonstrated a significant decrease in the numbers and proportions of Treg cells in mice with IL-2 or IL-2Rα deletion.16,17 Low-dose (ld) IL-2 has potential as a new therapeutic to restore Treg cell proportions in autoimmune diseases.18,19 He et al reported that human recombinant ld-IL-2 selectively modulated the quantities of Treg cells, follicular helper T (TFH) cells and IL-17-producing helper T (TH17) cells, but not TH1 or TH2 cells, accompanied by markedly reduced disease activity in SLE patients.20 Notably, ld-IL-2 restores CD4+ Treg cell numbers and the Th17/Treg ratio, which help control the disease.11
The mucosal origins hypothesis suggests that the most important event in the preclinical development of RA is not loss of self-tolerance, but loss of the mucosal barrier function21 .Bennike et al identified 21 citrullinated peptides in the colonic tissues of both RA patients and controls, which had previously been found in lung tissues and synovial fluids of RA patients. Three of these citrullinated proteins (citrullinated vimentin, fibrinogen-alpha, and actin) are targets of anti-citrullinated protein autoantibodies (ACPAs). This supports the hypothesis that colon mucosa is a potential target site to break immune tolerance to citrullinated epitopes.22 Citrullinated vimentin was found in the colons of these patients, but not in controls, indicating that the initial RA trigger point was not limited to the joints.23
The gut is an important component of the immune system. It has the highest microbial density and diversity in the body, and is essential for immune system development.24,25 Several mechanisms by which gut dysbiosis can promote RA progression have been proposed, including autoantigen modification, molecular mimicry between microbial and host epitopes, immune system activation and polarization toward proinflammatory phenotypes, and intestinal permeability.26 The composition of the gut microbiota plays a pivotal role in the balance between inflammatory TH cells and suppressive Treg cells, which is important to maintain immune tolerance under healthy conditions.27 An excessive intestinal mucosal immune response, activation of antigen-presenting cells, alterations in the permeability of the intestinal mucosa, an imbalance between Treg and TH cells, and impaired immune tolerance contribute to RA development.23 Lactobacillus and Bifidobacterium infantis exert anti-inflammatory effects by inducing Treg cells. Bacteroides fragilis polysaccharide A acts as an immunomodulator, and stimulates Treg cells through an IL-2-dependent mechanism to produce IL-10.27 Differences in the gut microbiome between RA patients and HCs have been demonstrated recently. The RA group reportedly had a lower Bacteroidetes: Firmicutes ratio than did the OA group. Lactobacillus and Prevotella spp., particularly Prevotella copri, were more abundant in the RA group than in the OA group. The relative abundances of Bacteroides and Bifidobacterium were lower in the RA group.28 Abnormal bacterial communities, associated with altered lymphocyte subpopulations and cytokine levels, might be involved in the pathogenesis of RA.29
Studies have demonstrated that dysbiotic microbiome were partially restored by treatment with methotrexate (MTX) and hydroxychloroquine.30 IL-2 is a pleiotropic cytokine that promotes the inflammatory response and maintains immune tolerance. In this study, we aimed to understand the anti-arthritic action of ld-IL-2, by investigating its effects on arthritic inflammation; gut microbiota composition, α and β diversity, and function; and short-chain fatty acids (SCFAs) in mice with collagen-induced arthritis (CIA).
Materials and Methods
Mice
Male DBA/1 mice (weight: 18–22 g; age: 8 weeks) were provided by GemPharmatech Co., Ltd. (Nanjing, China). The animals were placed in an SPF-grade holding house with ad libitum access to autoclaved water and sterilized food, under controlled conditions (temperature, 22 ± 2 °C; humidity, 40 ± 5%) with a 12/12 h light/dark cycle. All animals acclimated for at least 1 week before the experiments. The animal experiments were approved by the Ethics Committee of the Shanxi Medical University (reference number 2016LL151). Mice were included in the analysis if they ate normally; defecated; had no abdominal pain, diarrhea, or fever; and did not die during the experiment. The remaining mice were excluded from analysis.
Treatment Groups
Upon arrival from GemPharmatech Co., Ltd., all animals were assigned a group designation and were weighed. In total, 25 animals were randomly divided into five groups (n = 5 per group). Each animal was assigned a temporary random number, generated using SPSS Statistics software v.25.0, within the weight range group. On the basis of their position on the rack, cages were given a numerical designation. For each group, a cage was selected randomly from the pool. One animal was removed from each weight range group and given a permanent numerical designation in the cages. The cages were then randomized within the exposure group. The experimenters were blinded to the treatments administered to the animals; they were also blinded to the biochemical, histological, and statistical analyses.
Group I - Controls [non-induced + normal saline];
Group II - Model [treated with type II collagen (CII) for induction of RA + normal saline];
Group III - Model + MTX (0.25 mg/kg oral gavage feeding once per week after arthritis induction);
Ld-IL-2 was administered in two doses (IL-2-a and IL-2-b).
Group IV - Model + IL-2-a [IL-2: 600,000 IU/kg intraperitoneal (i.p.) injection on alternate days for 28 days after arthritis induction];
Group V - Model + IL-2-b (IL-2: 1,200,000 IU/kg intraperitoneal (i.p.) injection on alternate days for 28 days after arthritis induction).
The induction and treatment protocols are shown in Figure 1A.
The dosage of IL-2 for the treatment of autoimmune diseases has not been conclusively determined. Only ld-IL-2 led to an increase in circulating Tregs; other immune cells exhibited almost no activation. We administer 1000000 IU of ld-IL-2 subcutaneously to patients with autoimmune diseases. Based on the dose conversion between experimental animals and humans, two doses of IL-2 were used in this study.1,11,20,31–33 There is currently no unified standard for the therapeutic dose of methotrexate in CIA model mice; thus, we referred to the literature and considered the dose of methotrexate administered to patients in our department (7.5–10 mg once weekly). Accordingly, the dose of methotrexate administered to mice in the experiment was converted from the dose of methotrexate administered to experimental animals and humans.
Collagen-Induced Arthritis (CIA) and Assessment of Arthritis Severity
Arthritis was induced in the mice by subcutaneously injecting 100 μL of an emulsion containing bovine CII (Chondrex-20022; Chondrex Inc., Redmond, WA, USA) and complete Freund’s adjuvant (CFA; Chondrex-7001) in a 1:1 ratio on day 0. This was followed by subcutaneous injection of 100 μL of an emulsion containing CII and incomplete Freund’s adjuvant (IFA; Chondrex-7002) in a 1:1 ratio on day 21.34
The arthritis index (AI)35,36 for disease severity was determined based on the method in a previous report. The mice were examined three times per week. A 16-point scale was used to assess the severity of erythema and swelling in different parts of the four limbs:
0 - no signs of inflammation or erythema;
1 - slight erythema and mild swelling on the paw;
2 - mild erythema and swelling across the entire paw;
3 - severe swelling and erythema from the ankle to digits;
4 - maximal swelling and erythema, or obvious joint destruction.
The scoring was performed independently by two observers.
Radiography
The mice were anesthetized with 3% chloral hydrate at 28 and 56 days after the first immunization, and the UltraFocus veterinary X-ray machine (Faxitron, Tucson, AZ, USA) was used to acquire X-ray images.37
Enzyme-Linked Immunosorbent Assay (ELISA)
On day 56, peripheral blood was collected from the mice by the orbital blood sampling method and centrifuged in EDTA anticoagulant tubes at 2000–3000 RPM for 20 min to prepare serum samples. After serum preparation, cytokine levels (IL-2, IL-6, IL-17, IL-21, IL-10, and TNF-α) were quantified using commercial ELISA kits (Signalway Antibody Co., College Park, MD, USA), in accordance with the manufacturer’s instructions. Serum samples were added to 96-well plates coated with purified primary polyclonal antibodies against IL-2, IL-6, IL-17, IL-21, IL-10 and TNF-α, followed by washing and incubation. The absorbance at 450 nm was recorded using a microplate reader (Tecan Sunrise; Tecan, Männedorf, Switzerland), and the concentrations are expressed as pg/mL.38,39
Histopathology
On day 56, the mice were euthanized; their joints were fixed, embedded, and stained with hematoxylin and eosin.39,40
Gut Microbial Analysis
On day 56, mouse feces were collected and stored in a stool collection tube with a stable solution at −80°C, in accordance with the manufacturer’s instructions (E.Z.N.A.® soil RNA kit; Omega Bio-Tek, Norcross, GA, USA). RNA concentrations and purity were determined using the NanoDrop 2000 UV-Vis spectrophotometer (Thermo Fisher Scientific, Waltham, MA, USA), and RNA quality was checked by 1% agarose gel electrophoresis. The V3–V4 hypervariable regions of the bacterial 16S rRNA gene were amplified with primers 338F (5’-ACTCCTACGGGAGGCAGCAG-3’) and 806R (5’-GGACTACHVGGGTWTCTAAT-3’) using the thermocycler PCR system (GeneAmp 9700; Thermo Fisher Scientific, Waltham, MA, USA). The PCR reactions were conducted using the following programs: 3 min of denaturation at 95°C; 27 cycles (30 s each) at 95°C; annealing for 30s at 55°C; elongation for 45s at 72°C; and a final extension at 72°C for 10 min. PCR reactions were performed in triplicate 20-μL mixtures containing 4 μL of 5 × FastPfu Buffer, 2 μL of 2.5 mM dNTPs, 0.8 μL of each primer (5 μM), 0.4 μL of FastPfu Polymerase and 10 ng of template RNA. The PCR products were extracted using 2% agarose gel and further purified using the AxyPrep RNA Gel Extraction kit (Axygen Biosciences, Inc., Union City, CA, USA). They were then quantified using QuantiFluor™-ST (Promega, Madison, WI, USA), in accordance with the manufacturer’s instructions.
Purified amplicons were pooled equimolar, and paired-end sequenced (2 × 300) on the Illumina MiSeq platform (Illumina, San Diego, CA, USA), in accordance with standard protocols.
Fecal Metabolomics Analysis
On day 56, mouse feces were collected and stored in a stool collection tube with a stable solution at −80°C. The fecal concentrations of SCFAs were determined by gas chromatography (GC) as described previously.41 Then, 100 µL of aliquot was added into a 2-mL glass centrifuge tube, and mixed with 50 μL of 15% phosphoric acid and 150 µL of 5 µg/mL 4-methyl valeric acid (IS). We used 1 μL of the supernatant for gas chromatography-mass spectrometry (GC-MS) analysis using the Model 7890A/5975C GC-MS system (Agilent, Santa Clara, CA, USA). To quantify SCFAs, a calibration curve for the concentration range of 0.1–100 ug/mL was constructed. The IS was used to correct for injection variability between samples and minor changes in the instrument responses.42,43
Statistical Analysis
All values are expressed as mean ± standard error of the mean (SEM). The data were analyzed using GraphPad Prism 7.0 software (GraphPad Software Inc., San Diego, CA, USA). The cytokine concentration and SCFA assay data were analyzed using one-way analysis of variance (ANOVA). Nonparametric tests were used when the data were not normally distributed. Statistical significance was assessed at p < 0.05, < 0.01, and < 0.001.
16S rRNA Gene Sequencing Analysis and Bioinformatics
Demultiplexed sequences from each sample were quality filtered and trimmed, then de-noised and merged. Chimeric sequences were then identified and removed using the QIIME2 dada2 plugin to obtain the amplicon sequence variant feature table. The QIIME2 feature-classifier plugin was used to align amplicon sequence variant sequences to a pre-trained GREENGENES 13–8 99% database (trimmed to the V3–V4 region bound by the 338F/806R primer pair) to generate the taxonomy table. Appropriate methods (eg, ANCOM, ANOVA, Kruskal–Wallis, LEfSe, and DESeq2) were employed to identify the bacteria with different abundances within the samples and groups. Diversity metrics were calculated using the core-diversity plugin within QIIME2. Feature-level alpha diversity indices (eg, observed OTUs, Chao1 richness estimator, Shannon diversity index, and simpson diversity index) were calculated to estimate the microbial diversity within an individual sample. Beta diversity distance measurements (eg, Bray-Curtis, unweighted UniFrac, and weighted UniFrac) were performed to investigate the structural variation of microbial communities across samples; the results were visualized using principal coordinate analysis (PCoA) and nonmetric multidimensional scaling (NMDS). Partial least squares discriminant analysis (PLS-DA) was introduced as a supervised model to identify microbiota variations among groups, using the “plsda” function in the R package “mixOmics.” Redundancy analysis (RDA) was performed to investigate the associations of microbial communities with environmental factors based on their relative abundances at different taxa levels, using the R package “vegan.” Co-occurrence analysis was performed by calculating Spearman’s rank correlations between predominant taxa; network plots were used to display associations among taxa. In addition, the potential KEGG Orthology (KO) functional profiles of microbial communities were predicted using PICRUSt.
Results
Ld-IL-2 Administration Alleviated CIA
The details of the CIA model and ld-IL-2 treatment are presented in Figure 1A. The sample included 25 animals that completed the 56-day experiment (n = 25). All mice, except those in the control group, were immunized on days 0 and 21. Treatments were initiated in mice with AI scores ≥ 4 on day 28 after primary immunization. The AI scores of the control group remained as 0 throughout the experiment. The mice treated with MTX and IL-2 showed significantly lower AI scores compared to the model group (Figure 1B). The hind paws of the model group mice showed obvious joint swelling and ulnar deviation. On the other hand, the mice in the MTX group showed no joint or soft tissue swelling, while those in the IL-2-a and IL-2-b groups had slight swelling but no ulnar deviation (Figure 1C). The control group had clear articular surfaces, intact bone cortices, and normal joint spaces, while the model group had blurred articular surfaces, obvious bone defects, joint subluxations and stiffness, and narrow joint spaces. The MTX, IL-2-a, and IL-2-b groups showed joint osteoporosis and slight narrowing of the joint spaces, but no bone destruction (Figure 1D). We observed severe lymphocyte infiltration, cartilage erosion, bone destruction, and narrowing of the joint space in the hematoxylin and eosin-stained pathological sections of the model group, which were significantly alleviated in both the IL-2-a and IL-2-b groups (Figure 1E).
We also examined the serum levels of cytokines by ELISA (Figure 1F). Interestingly, the concentration of IL-2 in the model group was lower than in the control group (p < 0.05). After IL-2 and MTX treatments, the IL-2 levels in the model mice increased significantly, especially in the IL-2-b group, but did not reach the levels of the control group. The levels of pro-inflammatory cytokines (IL-6, IL-17, IL-10, IL-21, and TNF-α) in the model group were higher than in the control group, but could be decreased to the same or lower levels than the control group after IL-2 and MTX treatments (p < 0.05).
These findings demonstrated that ld-IL-2 was as effective as MTX in alleviating CIA.
Ld-IL-2 Treatment Altered Gut Microbiota Composition
Effects of Ld-IL-2 on Gut Microbiota in CIA Mice
We assessed the microbiota community structure of mouse fecal samples from each group based on 16S rRNA (V3–V4 region) sequencing. A total of 1,027,436 16S rRNA tags were obtained from the samples, with an average of 41,097 tags per mice; 1009 amplicon sequence variants were defined. The number of operational taxonomic units (OTUs) in the model group was lower than in the other groups; the number in the MTX group was similar to that of the control group; and the numbers in the IL-2-a and IL-2-b groups were significantly higher than in the model group (Supplementary Figure 1A). The rarefaction curves tended to be close to saturated, indicating that the number of samples was adequate. Shannon curves (Supplementary Figure 1B) indicated that the amount of sequencing data was sufficient to reflect most of the microbial species in the sample. The OTUs in each sample were annotated with the species (Supplementary Figure 1C).
To determine alpha diversity (Figure 2A–C), Chao1 (A) was used to calculate microbiota richness. Shannon and Simpson indices (B, C) were used to evaluate microbiota diversity. As shown by the Chao1 estimator, microbiota richness in the model group was significantly decreased (p < 0.05). No significant differences were found among the MTX, IL-2-a and IL-2-b groups. The Shannon and Simpson index results showed significant differences in microbial diversity between the model group and other groups (p < 0.05 and p < 0.01, respectively).
 |
Figure 2 Effects of ld-IL-2 on gut microbiota in CIA mice. (A) Chao1 calculates the microbiota richness. Microbiota richness in the model group was significantly decreased (*p < 0.05). No significant differences were found among the MTX, IL-2-a, and IL-2-b groups. (B and C) Shannon and Simpson evaluate microbiota diversity. There were significant differences in microbial diversity between the model group and the MTX, IL-2-a, and IL-2-b groups. (*P < 0.05 and **P < 0.01, respectively). (D) Beta diversity heatmap. The color in the heatmap represents the difference coefficient between samples; colors closer to Orange indicate larger differences, while colors closer to green indicate smaller differences. From top to bottom, the heat maps represent Bray-Curtis, weighted UniFrac, and unweighted UniFrac, respectively. The model group exhibited a more Orange color, indicating a considerable difference from the other groups. There were no significant differences in microbiome composition among the MTX, IL-2-a, IL-2-b, and control groups. (E) Bray-Curtis-PCoA-3D. The distance between points indicates the degree of difference between samples. A smaller distance between two points indicates greater microbial community structure similarity between the two samples. |
The beta diversity among groups was evaluated by calculating the Bray-Curtis distance, weighted UniFrac distance, and unweighted UniFrac distance according to the OTUs. The colors in the heatmap (Figure 2D) represent the difference coefficient between the two samples; colors closer to orange indicate larger differences. The model group exhibited a more orange color, indicating a considerable difference from the other groups. However, the MTX, IL-2-a, IL-2-b, and control groups exhibited more green colors, indicating minimal differences in microbiota composition among the groups.
PCoA analysis was used to reveal the evolutionary similarities and differences of microorganisms within the samples.44,45 Similar results were found in the PCoA of 3D images (Figure 2E). Furthermore, PCoA of 3D images showed that the distribution of the model group (represented by the red dots) was more clustered far from the control, MTX, IL-2-a, and IL-2-b groups. However, the control, MTX, IL-2-a, and IL-2-b groups were clustered together. Permutational multivariate analysis of variance (PERMANOVA) and analysis of similarity (ANOSIM) were used to compare differences in microbiota composition among the groups (Supplementary Figure 2).44,45 There were significant differences in microbiota composition between the model and control groups, but there were no obvious differences among the MTX, IL-2-a, IL-2-b, and control groups. All of the measurements showed that microbiota richness, diversity and composition in mice feces treated with ld-IL-2 were similar to the control group.
Phylum and Genus Composition of Gut Microbiota
In general, control group mice had the most species at seven levels (kingdom, phylum, class, order, family, genus, and species), while the model group had the lowest number of species. To analyze community structure, the 20 most abundant species at the phylum and genus levels were evaluated.
At the phylum level (Figure 3A), Firmicutes, Bacteroidetes, and Proteobacteria were the major species found in all five groups. In the model group Firmicutes showed the highest abundance (88%), followed by Bacteroidetes (11%). After ld-IL-2 treatment, the microbiota imbalance recovered slightly; the Firmicutes proportions decreased (72% and 63% in the IL-2-a and IL-2-b groups, respectively), those of Bacteroidetes increased (23% and 34% in the IL-2-a and IL-2-b groups, respectively). After MTX treatment, the Firmicutes proportion decreased (57%), while the Bacteroidetes proportion increased (39%). The numbers of species in the MTX, IL-2-a, and IL-2-b groups were similar to the control group. Kruskal–Wallis ANOVA was used to test the significance of differences in abundance among multiple groups; this non-parametric test has no distribution requirements and is generally suitable for bacterial community analysis.46 Kruskal–Wallis ANOVA showed significant differences in species among the five groups (p < 0.01).
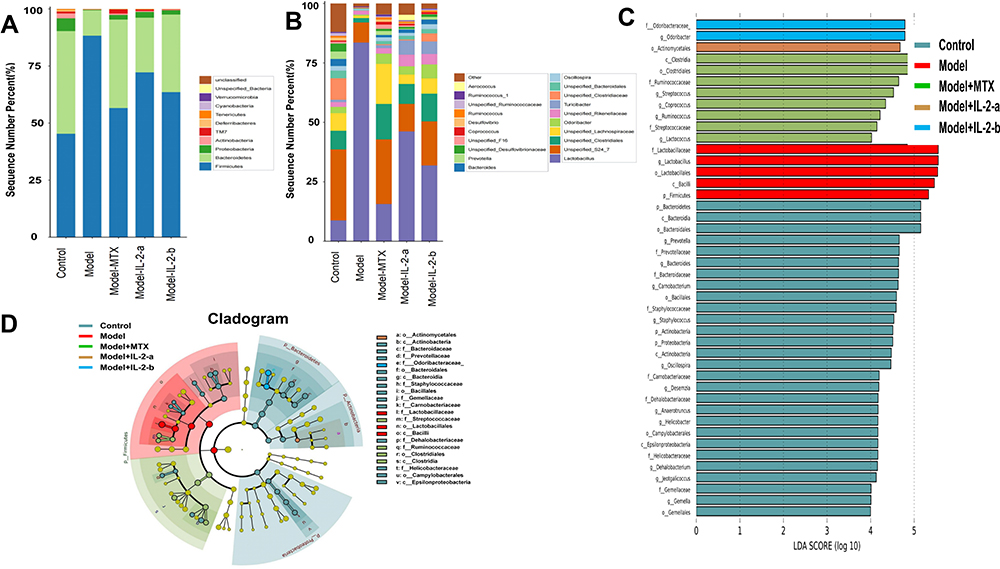 |
Figure 3 Ld-IL-2 treatment altered gut microbiota composition. (A) Relative abundances of gut microbiota at the phylum level. After ld-IL-2 treatment, the abundances of Firmicutes decreased (72% and 63% in the IL-2-a and IL-2-b groups, respectively), while the abundances of Bacteroidetes increased (23% and 34% in the IL-2-a and IL-2-b groups, respectively). (B) At the genus level, the Lactobacillus abundances decreased after ld-IL-2 treatment (46% and 31% in the IL-2-a and IL-2-b groups, respectively). (C) Distribution histograms of LEfSe analysis (LDA scores > 4). Each transverse cylinder represents a species; the length of the cylinder corresponds to the LDA value. A higher LDA value indicates a greater difference. The control group had the most obvious altered OTUs. In the model group, five OTUs showed significant differences. The eight most obviously altered OTUs were in the MTX group. There were one and two altered OTUs in the IL-2-a and IL-2-b groups, respectively. (D) Taxonomic cladogram of LEfSe analysis. The diagram shows different taxonomic levels from inside to outside; each connection represents a lineage relationship. Each circle node represents a species. A yellow node indicates no significant difference between groups. A non-yellow node indicates that the species is the characteristic microorganism of the corresponding color group. |
At the genus level (Figure 3B), the microbiota in the model group was mainly composed of Lactobacillus (83.5%) and Unspecified_S24_7 (8.47%); all other gut microbiota constituents were remarkably decreased, indicating an imbalance in the gut microbiota. After MTX treatment, the Lactobacillus proportion decreased (15.6%). After ld-IL-2 treatment, the Lactobacillus proportions decreased (46% and 31% in the IL-2-a and IL-2-b groups, respectively), but the abundance of microbiota was still higher compared to the control group; the other gut microbiota constituents were significantly increased. Kruskal–Wallis ANOVA showed significant differences in species among the five groups (p < 0.01).
We used DESeq2 for multiple comparisons to identify microorganisms with significantly different abundances between the two groups.47 At the phylum level, taking Firmicutes as an example, the model group showed significant differences to the control (p = 0.04), MTX (p = 0.00007), IL-2-a (p = 0.071), and IL-2-b (p = 0.055) groups, indicating that ld-IL-2 treatment altered Firmicutes abundance.
Linear discriminant analysis effect size (LEfSe) analysis was performed to identify statistically significant biomarkers of gut microbiota in the different groups. The linear discriminant analysis (LDA) score histogram (based on LDA scores > 4) and cladograms are shown (Figure 3C and D). In the control group, the most obviously altered OTUs were p_Bacteroidetes, c_Bacteroidia, o_Bacteroidales, f_Prevotellaceae, and g_Prevotella, followed by g_Bacteroides, f_Bacteroidaceae, g_Carnobacterium, o_Bacillales, and f__Staphylococcaceae. In the model group, five OTUs showed significant differences, namely p_Firmicutes, c_Bacilli, o_Lactobacillales, g_Lactobacillus, and f_Lactobacillaceae. The eight most obviously altered OTUs in the MTX group included g_Streptococcus, f_Ruminococcaceae, o_Clostridiales, and c_Clostridia. There were one and two altered OTUs in the IL-2-a and IL-2-b groups, respectively. o_Actinomycetales in the IL-2-a group was found to be abundant and markedly altered. f_Odoribacteraceae and g_Odoribacter were found to be substantially altered in the IL-2-b group.
Functional Predictions of Microbiota
PICRUSt2 is a computational approach to predict the functional composition of a metagenome using marker gene data and a database of reference genomes. PICRUSt2 compared the 16S rRNA gene sequencing data with the microbial reference genome database, using known metabolic functions to predict changes in microbial functions. Metagenomic analysis confirmed 19,789 knockouts and a total of 288 Kyoto Encyclopedia of Genes and Genomes (KEGG) pathways. Figure 4A shows the top 20 KEGG pathways for KEGG level 3. ANOVA, Duncan, and Dunn tests were used to analyze differences in microbial community predicted functions among groups. There were significant differences in functional pathways between the model and control groups. After the MTX and ld-IL-2 treatments, the differences between the model and control groups were reduced. The main differences were in fatty acid, histidine, glutathione, porphyrin, chlorophyll, purine, and cytochrome P450-mediated drug and xenobiotic metabolism, among other metabolic pathways. The functional differences involved multiple body functions including metabolism, cellular processes, environmental information processing, genetic information processing, human diseases, and organ systems (Figure 4B–E and Supplementary Figure 3). Regarding the KEGG pathway results, CIA model mice showed differences in intestinal microbiota composition, which led to significant differences in intestinal microbial functions. There were no significant differences in intestinal microbial functions between the ld-IL-2-treated mice and controls, indicating that ld-IL-2 may partially restore intestinal biological function (Figure 4B–E and Supplementary Figure 3).
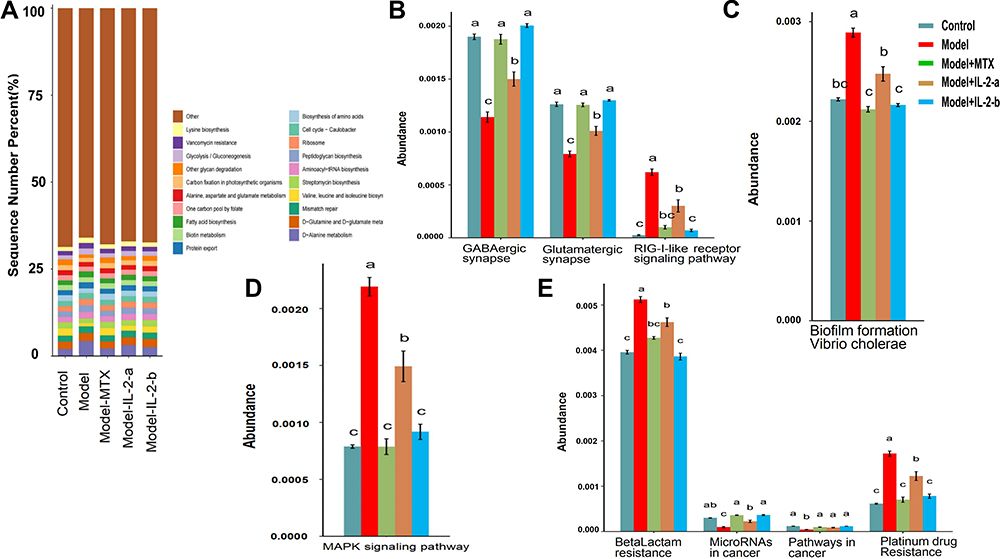 |
Figure 4 Ld-IL-2 may partially restore intestinal biological function. (A) Top 20 KEGG pathways for KEGG level 3. (B–E) ANOVA + Duncan analysis showed significant differences in predicted microbial community function between groups. In each channel, different colors are used to represent different groups. The letters a, b, c are arranged from high to low. Similar letters above two groups indicate a non-significant difference; different letters indicate a significant difference. For example, if one of the letters a and a, b is the same, there is no difference, and a and b are different. (B) Organismal systems. (C) Cellular processes. (D) Environmental information processing. (E) Human diseases. |
Impact of IL-2 Treatment on Fecal SCFA Concentrations
In this study, the SCFAs in the mouse-feces samples were analyzed, and found to consist mainly of acetic, propionic, and butyric acids, along with isobutyric, isovaleric, valeric, and hexanoic acids (Figure 5A). The control group was used as a reference to measure increases and decreases in SCFAs. The total SCFA content of the model group was lower compared to the control group, but increased with MTX and ld-IL-2 treatments. The IL-2-a group had the highest SCFA levels. All SCFAs increased after the ld-IL-2 and MTX treatments, except hexanoic acid. The increase in acetic, propionic, isobutyric, butyric, and isovaleric acids was greater in the IL-2-a and IL-2-b groups compared to the MTX group. ANOVA showed significant differences in isovaleric acid among the five groups (p < 0.05). The contents of acetic acid, isobutyric acid, and total SCFAs differed among the five groups (P = 0.05, P = 0.05, and P = 0.08, respectively). Butyric acid content in the model and MTX groups was higher than the valeric acid content (Figure 5B–I). These results suggested that ld-IL-2 treatment can improve the SCFA-related metabolic disorders caused by CIA. An interesting finding was that MTX treatment had little impact on SCFA metabolism.
 |
Figure 5 Ld-IL-2 treatment can improve the SCFA-related metabolic disorders caused by CIA. (A) The SCFA composition after treatment in each group was mainly acetic acid, propionic acid, and butyric acid. SCFA content was the lowest in the model group; it increased after ld-IL-2 treatment. (B–I) SCFA contents in each group after treatment. The IL-2-a group had the highest SCFA contents. There was a significant difference in isovaleric acid content among the five groups (P < 0.05). *P < 0.05, ***P < 0.001. (B) Total SCFA content. (C) Acetic acid. (D) Propionic acid. (E) Butyric acid. (F) Valeric acid. (G) Hexanoic acid. (H) Isobutyric acid. (I) Isovaleric acid. |
Relations of Gut Microbial Genera with Cytokines and SCFAs
Based on the fecal microbiome and metabonomic data, we performed redundancy analysis (RDA) to determine the relationships among gut microbiota, metabolites and cytokines. In the RDA (Figure 6A), the arrow represents SCFA and cytokines, the dot represents the microbiota, and the length of the arrow represents the strength of the correlation between SCFAs or cytokines and the microbiota; a longer arrow indicates a stronger correlation. The angle between the arrow and the sorting axis represents the strength of the correlation for a particular environmental factor; a smaller angle indicates a stronger correlation. Acute and obtuse angles reflect positive and negative correlations, respectively. IL-2 had the strongest correlation with the microbiota, followed by TNF-α, IL-21, IL-10, and IL-6. The correlation between SCFAs and the microbiota was weak.
 |
Figure 6 Correlations among gut microbiota, metabolites, and cytokines. (A) RDA of phylum level; IL-2 had the strongest correlation with the microbiota composition. SCFA: acetic, propionic, and butyric acids, along with isobutyric, isovaleric, valeric, and hexanoic acids. Cytokines: IL-2, IL-6, IL-17, IL-10, IL-21, and TNF-α. (B) Heatmap of Spearman correlation coefficients. IL-2 was positively correlated with Bacteroides abundance (P < 0.001). Positive correlations are shown using red color, while negative correlations are shown using blue color. Significance is indicated as: *P < 0.05, **P < 0.01, ***P < 0.001. |
A heatmap of the Spearman correlation coefficients showed that IL-2 was positively correlated with Bacteroides (p < 0.001), Gemella, Allobaculum, Bifidobacterium, and Prevotella (p < 0.05) and negatively correlated with Lactobacillus (p < 0.05). TNF-α was positively correlated with Lactobacillus (p < 0.001), and negatively correlated with Prevotella (p < 0.001), Bacteroides, Coprococcus (p<0.01), Gemella, Dehalobacterium, Anaerotruncus, Allobaculum, Bifidobacterium, Candidatus Arthromitus (p < 0.05). IL-10 was positively correlated with Lactobacillus (p < 0.05), and negatively correlated with Candidatus Arthromitus, Coprococcus (p < 0.01), Clostridium, Dehalobacterium, Prevotella, and Coprobacillus (p < 0.05). IL-6 was positively correlated with Lactobacillus and Mucispirillum (p < 0.05), and negatively correlated with Candidatus Arthromitus, Coprococcus, Lactococcus, and Prevotella (p < 0.05). IL-21 was positively correlated with Lactobacillus (p < 0.05), and negatively correlated with Carnobacterium (p < 0.01), Gemella, Desemzia, Desulfovibrio, Jeotgalicoccus, Lactococcus, Corynebacterium and Dehalobacterium (p < 0.05). IL-17 was negatively correlated with Dehalobacterium and Adlercreutzia (p < 0.05). SCFAs were positively correlated with most of the microbiota. Hexanoic acid was positively correlated with Prevotella and Lactobacillus (p<0.05), and negatively correlated with Anaerotruncus (p<0.01) and Dehalobacterium (p<0.05).There was a negative correlation between isovaleric acid and Staphylococcus (p < 0.05), and between valeric acid and Gemella (p < 0.01) and Jeotgalicoccus (p < 0.05). These results suggested that IL-2 may influence the microbiota and SCFAs (Figure 6B).
Discussion
Breakdown of immune tolerance is an important cause of RA. Restoration of immune tolerance may be an effective strategy for RA remission.48,49 Ld-IL-2 regulates the Th17/Treg ratio, exerts anti-inflammatory effects, and maintains immune tolerance in RA patients. Th17/Treg regulation by ld-IL-2 has been widely reported, but the relationship between ld-IL-2 and the gut microbiota is not clear and requires further study.18,50
Since CIA animal models share immunological and pathological features with human RA, they have been used extensively to study the pathogenesis of, and test therapeutics for RA.51 We used CIA mice in this study to assess gut microbiota alterations during the pathogenesis of RA. Because this was a preliminary study concerning the relationship between ld-IL-2 and the gut microbiota, we used a smaller sample size. MTX which is the first-line treatment for RA, was used as a positive control to evaluate the therapeutic effect of ld-IL-2 on joint inflammation.4,6
Our study demonstrated that both ld-IL-2 and MTX can relieve arthritis symptoms in CIA mice. Compared to the model group, they significantly reduced arthritis symptoms, as reflected in the AI score, histopathology, foot swelling, and radiographic findings (Figure 1A–E). During the experiment, ld-IL-2 and MTX also exhibited regulatory effects on the gut microbiota and metabolites.
Furthermore, ld-IL-2 inhibited the production of pro-inflammatory serum cytokines (IL-6, IL-17, IL-21, and TNF-α), and there were no significant differences between the IL-2-a and IL-2-b groups. In addition, MTX treatment inhibited pro-inflammatory cytokines, and there were no significant differences between the IL-2 and MTX groups. These results indicate that abnormal bacterial communities are associated with the altered lymphocyte subpopulations and cytokine levels, which may play a role in RA pathogenesis (Figure 1F).
There is general agreement that microflora composition changes in RA patients.52,53 Du reported that 13 phyla, including Firmicutes and Bacteroidetes (30.2% and 23.8%, respectively) were the dominant salivary microbes in RA patients.54 Liu reported that the lactic acid content of feces from RA patients was significantly higher compared to controls.55 Our results demonstrated significant differences in species diversity and microbial community composition between the model and control groups. At the phylum level, Firmicutes and Bacteroidetes accounted for 99% of the microbes in the model group, while at genus level, Lactobacillus accounted for 83.5% of the microbes, resulting in a serious imbalance (Figure 3A–D). The imbalance in diversity and abundance of gut microbiota may play an important role in RA pathogenesis.
Interestingly, both the ld-IL-2 and MTX treatments increased gut microbiota richness and diversity in CIA mice. After ld-IL-2 treatment, the proportions of Firmicutes and Lactobacillus decreased in CIA mice feces. We also analyzed the biomarkers of microbiota in all groups. After ld-IL-2 treatment, microbiota markers changed in CIA mice, which may be important in the control of arthritis symptoms. It was also found that fecal Bacteroides abundance decreased in model mice, and Lactobacilli became the main component of CIA mouse microbiota. Ld-IL-2 had a negative correlation with Lactobacillus, and a positive correlation with Bacteroides.56 The mechanisms of action for drugs that alleviate rheumatoid symptoms are reportedly related to Treg-cell regulation and improvements in gut microbiota. Furthermore, there have been reports concerning the complex interactions between immune cells and gut microbiota. Ld-IL-2 regulation may have a two-way regulatory effect on gut microflora. IL-2 regulation in gut microbiota may be related to immune regulation, but this speculation merits further investigation.23,57,58
SCFAs, the end products of the fermentation of dietary fibers by the anaerobic intestinal microbiota, have multiple beneficial effects on energy metabolism and the mammalian immune system. There have been few reports concerning normal SCFA levels in mice; the findings in these reports have been inconsistent. Therefore, the control group was used as the normal control in this study to observe changes in SCFA levels after ld-IL-2 administration. In a study by Shan,59 the concentrations of all SCFAs in CIA rats, especially acetic, propionic, butyric and valeric acids, were lower compared to controls, indicating that RA affected the SCFA content of mouse feces. Butyric acid exerts anti-inflammatory effects by activating mTOR and Blimp-1 in intestinal CD4+ T cells.60,61 Valerate also strongly induces IL-10 expression in T cells and regulatory B cells by increasing mTOR complex activity, promoting glucose oxidation, and producing additional acetyl-CoA.62 It was reported that the severity of type II CIA decreased after oral administration of acetate, propionate, or butyrate, which indicated a significant role of SCFAs in the regulation of inflammation.63 These findings were confirmed in our experiment, where butyric and valeric acid levels increased in the IL-2 group (Figure 5A–I). This is presumably because an increase in SCFAs regulates T cells and increase the number of Treg cells.64 This could inhibit excessive immune responses, maintain immune tolerance, and ultimately control arthritis.
Conclusion
In conclusion, ld-IL-2 can relieve the joint symptoms of RA in CIA mice. Furthermore, we found changes in the diversity and composition of gut microbiota, as well as their metabolite (SCFA) in CIA mice. Changes in the dominant species and SCFA could contribute to the regulation of immune tolerance, offering a potential novel mechanism for ld-IL-2 treatment. This mechanism requires further exploration.
Data Sharing Statement
The Research Article data used to support the findings of this study are available from the corresponding author upon request.
Ethics Approval
Mouse handling and experimentation were conducted in strict compliance with the Regulations for Administration of Affairs Concerning Experimental Animals of Shanxi Medical University. All protocols were approved by Ethics Committee of Shanxi Medical University (Permit Number:2016LL151).
Author Contributions
All authors made a significant contribution to the work reported, whether that is in the conception, study design, execution, acquisition of data, analysis and interpretation, or in all these areas; took part in drafting, revising or critically reviewing the article; gave final approval of the version to be published; have agreed on the journal to which the article has been submitted; and agree to be accountable for all aspects of the work.
My manuscript “low dose interleukin-2 altered gut microbiota and ameliorated collagen induced arthritis” - ID 344393 has uploaded the data to NCBI, the accession number ID: SUB10215088, the registration number of these SRA data is PRJNA755477.
Funding
This work was supported by the National Natural Science Foundation of China (No. 81971543).
Disclosure
The authors report no conflicts of interest in this work.
References
1. Zhang SX, Wang J, Wang CH, et al. Low-dose IL-2 therapy limits the reduction in absolute numbers of circulating regulatory T cells in rheumatoid arthritis. Ther Adv Musculoskelet Dis. 2021;13:1759720X211011370. doi:10.1177/1759720X211011370
2. Smolen JS, Aletaha D, McInnes IB. Rheumatoid arthritis. Lancet. 2016;388(10055):2023–2038. Epub 2016 May 3. Erratum in: Lancet. 2016 Oct 22;388(10055):1984. doi:10.1016/S0140-6736(16)30173-8
3. Zhu H, Li R, Da Z, et al. Remission assessment of rheumatoid arthritis in daily practice in China: a cross-sectional observational study. Clin Rheumatol. 2018;37(3):597–605. doi:10.1007/s10067-017-3850-z
4. Fraenkel L, Bathon JM, England BR, et al. 2021 American college of rheumatology guideline for the treatment of rheumatoid arthritis. Arthritis Care Res. 2021;73(7):924–939. doi:10.1002/acr.24596
5. Wang W, Zhou H, Liu L. Side effects of methotrexate therapy for rheumatoid arthritis: a systematic review. Eur J Med Chem. 2018;158:502–516. doi:10.1016/j.ejmech.2018.09.027
6. Friedman B, Cronstein B. Methotrexate mechanism in treatment of rheumatoid arthritis. Joint Bone Spine. 2019;86(3):301–307. PMID: 30081197. doi:10.1016/j.jbspin.2018.07.004
7. Hyndman IJ. Rheumatoid arthritis: past, present and future approaches to treating the disease. Int J Rheum Dis. 2017;20(4):417–419. doi:10.1111/1756-185X.12823
8. Ehrenstein MR, Evans JG, Singh A, et al. Compromised function of regulatory T cells in rheumatoid arthritis and reversal by anti-TNFalpha therapy. J Exp Med. 2004;200(3):277–285. doi:10.1084/jem.20040165
9. Sakaguchi S, Mikami N, Wing JB, et al. Regulatory T cells and human disease. Annu Rev Immunol. 2020;38:541–566. doi:10.1146/annurev-immunol-042718-041717
10. Zhang SX, Ma XW, Li YF, et al. The proportion of regulatory T cells in patients with systemic lupus erythematosus: a meta-analysis. J Immunol Res. 2018;2018:7103219. doi:10.1155/2018/7103219
11. Miao M, Hao Z, Guo Y, et al. Short-term and low-dose IL-2 therapy restores the Th17/Treg balance in the peripheral blood of patients with primary Sjögren’s syndrome. Ann Rheum Dis. 2018;77(12):1838–1840. doi:10.1136/annrheumdis-2018-213036
12. Paradowska-Gorycka A, Wajda A, Romanowska-Próchnicka K, et al. Th17/Treg-related transcriptional factor expression and cytokine profile in patients with rheumatoid arthritis. Front Immunol. 2020;11:572858. doi:10.3389/fimmu.2020.572858
13. Savage PA, Klawon DEJ, Miller CH. Regulatory T cell development. Annu Rev Immunol. 2020;38:421–453. doi:10.1146/annurev-immunol-100219-020937
14. Dominguez-Villar M, Hafler DA. Regulatory T cells in autoimmune disease. Nat Immunol. 2018;19(7):665–673. doi:10.1038/s41590-018-0120-4
15. Owen DL, Sjaastad LE, Farrar MA. Regulatory T cell development in the thymus. J Immunol. 2019;203(8):2031–2041. doi:10.4049/jimmunol.1900662
16. Klatzmann D, Abbas AK. The promise of low-dose interleukin-2 therapy for autoimmune and inflammatory diseases. Nat Rev Immunol. 2015;15(5):283–294. doi:10.1038/nri3823
17. Yokoyama Y, Iwasaki T, Kitano S, et al. IL-2-Anti-IL-2 monoclonal antibody immune complexes inhibit collagen-induced arthritis by augmenting regulatory T cell functions. J Immunol. 2018;201(7):1899–1906. doi:10.4049/jimmunol.1701502
18. Wu R, Li N, Zhao X, et al. Low-dose Interleukin-2: biology and therapeutic prospects in rheumatoid arthritis. Autoimmun Rev. 2020;19(10):102645. doi:10.1016/j.autrev.2020.102645
19. Zhang R, Miao J, Zhu P. Regulatory T cell heterogeneity and therapy in autoimmune diseases. Autoimmun Rev. 2021;20(5):102715. doi:10.1016/j.autrev.2020.102715
20. He J, Zhang X, Wei Y, et al. Low-dose interleukin-2 treatment selectively modulates CD4(+) T cell subsets in patients with systemic lupus erythematosus. Nat Med. 2016;22(9):991–993. doi:10.1038/nm.4148
21. Holers VM, Demoruelle MK, Kuhn KA, et al. Rheumatoid arthritis and the mucosal origins hypothesis: protection turns to destruction. Nat Rev Rheumatol. 2018;14(9):542–557. doi:10.1038/s41584-018-0070-0
22. Bennike TB, Ellingsen T, Glerup H, et al. Proteome analysis of rheumatoid arthritis gut mucosa. J Proteome Res. 2017;16(1):346–354. doi:10.1021/acs.jproteome.6b00598
23. Horta-Baas G, Romero-Figueroa MDS, Montiel-Jarquín AJ, et al. Intestinal dysbiosis and rheumatoid arthritis: a link between gut microbiota and the pathogenesis of rheumatoid arthritis. J Immunol Res. 2017;2017:4835189. doi:10.1155/2017/4835189
24. Schluter J, Peled JU, Taylor BP, et al. The gut microbiota is associated with immune cell dynamics in humans. Nature. 2020;588(7837):303–307. doi:10.1038/s41586-020-2971-8
25. Shi N, Li N, Duan X, et al. Interaction between the gut microbiome and mucosal immune system. Mil Med Res. 2017;4:14. doi:10.1186/s40779-017-0122-9
26. Reyes-Castillo Z, Valdés-Miramontes E, Llamas-Covarrubias M, et al. Troublesome friends within us: the role of gut microbiota on rheumatoid arthritis etiopathogenesis and its clinical and therapeutic relevance. Clin Exp Med. 2021;21(1):1–13. doi:10.1007/s10238-020-00647-y
27. Lee N, Kim WU. Microbiota in T-cell homeostasis and inflammatory diseases. Exp Mol Med. 2017;49(5):e340. doi:10.1038/emm.2017.36
28. Lee JY, Mannaa M, Kim Y, et al. Comparative analysis of fecal microbiota composition between rheumatoid arthritis and osteoarthritis patients. Genes. 2019;10(10):748. doi:10.3390/genes10100748
29. Li Y, Zhang SX, Yin XF, et al. The gut microbiota and its relevance to peripheral lymphocyte subpopulations and cytokines in patients with rheumatoid arthritis. J Immunol Res. 2021;2021:6665563. doi:10.1155/2021/6665563
30. Zhang X, Zhang D, Jia H, et al. The oral and gut microbiomes are perturbed in rheumatoid arthritis and partly normalized after treatment. Nat Med. 2015;21(8):895–905. doi:10.1038/nm.3914
31. Pol JG, Caudana P, Paillet J, Piaggio E, Kroemer G. Effects of interleukin-2 in immunostimulation and immunosuppression. J Exp Med. 2020;217(1):e20191247. PMID: 31611250; PMCID: PMC7037245. doi:10.1084/jem.20191247
32. Delville M, Bellier F, Leon J, et al. A combination of cyclophosphamide and interleukin-2 allows CD4+ T cells converted to Tregs to control scurfy syndrome. Blood. 2021;137(17):2326–2336. PMID: 33545713; PMCID: PMC8163490. doi:10.1182/blood.2020009187
33. Thornton S, Boivin GP, Kim KN, Finkelman FD, Hirsch R. Heterogeneous effects of IL-2 on collagen-induced arthritis. J Immunol. 2000;165(3):1557–1563. PMID: 10903764. doi:10.4049/jimmunol.165.3.1557
34. Miyoshi M, Liu S. Collagen-induced arthritis models. Methods Mol Biol. 2018;1868:3–7. doi:10.1007/978-1-4939-8802-0_1
35. Wang T, Jia Q, Chen T, et al. Alleviation of synovial inflammation of Juanbi-Tang on collagen-induced arthritis and TNF-Tg mice model. Front Pharmacol. 2020;11:45. doi:10.3389/fphar.2020.00045
36. Tu Y, Wang K, Liang Y, et al. Glycine tabacina ethanol extract ameliorates collagen-induced arthritis in rats via inhibiting pro-inflammatory cytokines and oxidation. J Ethnopharmacol. 2019;237:20–27. doi:10.1016/j.jep.2019.03.035
37. Ma X, Chen G, Wang J, et al. Pedunculoside attenuates pathological phenotypes of fibroblast-like synoviocytes and protects against collagen-induced arthritis. Scand J Rheumatol. 2019;48(5):383–392. doi:10.1080/03009742.2019.1600716
38. Chen HL, Lin SC, Li S, Tang KT, Lin CC. Alantolactone alleviates collagen-induced arthritis and inhibits Th17 cell differentiation through modulation of STAT3 signalling. Pharm Biol. 2021;59(1):134–145. PMID: 33556301. doi:10.1080/13880209.2021.1876102
39. Hui W, Yu D, Cao Z, Zhao X. Butyrate inhibit collagen-induced arthritis via Treg/IL-10/Th17 axis. Int Immunopharmacol. 2019;68:226–233. PMID: 30660077. doi:10.1016/j.intimp.2019.01.018
40. Kim M, Choe Y, Lee H, et al. Blockade of translationally controlled tumor protein attenuated the aggressiveness of fibroblast-like synoviocytes and ameliorated collagen-induced arthritis. Exp Mol Med. 2021;53(1):67–80. doi:10.1038/s12276-020-00546-y
41. Zhang S, Wang H, Zhu MJ. A sensitive GC/MS detection method for analyzing microbial metabolites short chain fatty acids in fecal and serum samples. Talanta. 2019;196:249–254. doi:10.1016/j.talanta.2018.12.049
42. Liu Y, Jin X, Hong HG, et al. The relationship between gut microbiota and short chain fatty acids in the renal calcium oxalate stones disease. FASEB J. 2020;34(8):11200–11214. doi:10.1096/fj.202000786R
43. Byndloss MX, Olsan EE, Rivera-Chávez F, et al. Microbiota-activated PPAR-γ signaling inhibits dysbiotic Enterobacteriaceae expansion. Science. 2017;357(6351):570–575. PMID: 28798125. doi:10.1126/science.aam9949
44. Morrison PK, Newbold CJ, Jones E, et al. The equine gastrointestinal microbiome: impacts of weight-loss. BMC Vet Res. 2020;16(1):78. doi:10.1186/s12917-020-02295-6
45. Cornejo-Granados F, Gallardo-Becerra L, Leonardo-Reza M, et al. A meta-analysis reveals the environmental and host factors shaping the structure and function of the shrimp microbiota. PeerJ. 2018;6:e5382. doi:10.7717/peerj.5382
46. Lozupone C, Knight R. UniFrac: a new phylogenetic method for comparing microbial communities. Appl Environ Microbiol. 2005;71(12):8228–8235. doi:10.1128/AEM.71.12.8228-8235.2005
47. Dhakal S, McCormack L, Dey M. Association of the gut microbiota with weight-loss response within a retail weight-management program. Microorganisms. 2020;8(8):1246. doi:10.3390/microorganisms8081246
48. Tao JH, Cheng M, Tang JP, et al. Foxp3, regulatory T cell, and autoimmune diseases. Inflammation. 2017;40(1):328–339. doi:10.1007/s10753-016-0470-8
49. Weyand CM, Goronzy JJ. The immunology of rheumatoid arthritis. Nat Immunol. 2021;22(1):10–18. doi:10.1038/s41590-020-00816-x
50. Abbas AK, Trotta E, R Simeonov D, et al. Revisiting IL-2: biology and therapeutic prospects. Sci Immunol. 2018;3(25):eaat1482. doi:10.1126/sciimmunol.aat1482.
51. Liu X, Zeng B, Zhang J, et al. Role of the gut microbiome in modulating arthritis progression in mice. Sci Rep. 2016;6:30594. doi:10.1038/srep30594
52. Maeda Y, Takeda K. Role of gut microbiota in rheumatoid arthritis. J Clin Med. 2017;6(6):60. doi:10.3390/jcm6060060
53. Toivanen P, Vartiainen S, Jalava J, et al. Intestinal anaerobic bacteria in early rheumatoid arthritis (RA), Arthritis Research, vol. 4, p. 5; 2002.
54. Du Q, Liu XH, Tian K, et al. Analysis of periodontal status and salivary microbial diversity in patients with rheumatoid arthritis. Sichuan Da Xue Xue Bao Yi Xue Ban. 2019;50(6):935–940. Chinese.
55. Liu X, Zou Q, Zeng B, et al. Analysis of fecal Lactobacillus community structure in patients with early rheumatoid arthritis. Curr Microbiol. 2013;67(2):170–176. doi:10.1007/s00284-013-0338-1
56. Zhang L, Song P, Zhang X, et al. Alpha-glucosidase inhibitors alter gut microbiota and ameliorate collagen-induced arthritis. Front Pharmacol. 2020;10:1684. doi:10.3389/fphar.2019.01684
57. Qiao S, Lian X, Yue M, et al. Regulation of gut microbiota substantially contributes to the induction of intestinal Treg cells and consequent anti-arthritis effect of madecassoside. Int Immunopharmacol. 2020;89(Pt A):107047. doi:10.1016/j.intimp.2020.107047
58. Brown EM, Kenny DJ, Xavier RJ. Gut microbiota regulation of T cells during inflammation and autoimmunity. Annu Rev Immunol. 2019;37:599–624. doi:10.1146/annurev-immunol-042718-041841
59. Shan J, Peng L, Qian W, et al. Integrated serum and fecal metabolomics study of collagen-induced arthritis rats and the therapeutic effects of the zushima tablet. Front Pharmacol. 2018;9:891. doi:10.3389/fphar.2018.00891
60. Sun M, Wu W, Chen L, et al. Microbiota-derived short-chain fatty acids promote Th1 cell IL-10 production to maintain intestinal homeostasis. Nat Commun. 2018;9(1):3555. doi:10.1038/s41467-018-05901-2
61. Park J, Kim M, Kang SG, et al. Short-chain fatty acids induce both effector and regulatory T cells by suppression of histone deacetylases and regulation of the mTOR-S6K pathway. Mucosal Immunol. 2015;8(1):80–93. doi:10.1038/mi.2014.44
62. Luu M, Visekruna A. Short-chain fatty acids: bacterial messengers modulating the immunometabolism of T cells. Eur J Immunol. 2019;49(6):842–848. doi:10.1002/eji.201848009
63. Mizuno M, Noto D, Kaga N, et al. The dual role of short fatty acid chains in the pathogenesis of autoimmune disease models. PLoS One. 2017;12(2):e0173032. doi:10.1371/journal.pone.0173032
64. Koh A, De Vadder F, Kovatcheva-Datchary P, et al. From dietary fiber to host physiology: short-chain fatty acids as key bacterial metabolites. Cell. 2016;165(6):1332–1345. doi:10.1016/j.cell.2016.05.041
 © 2022 The Author(s). This work is published and licensed by Dove Medical Press Limited. The
full terms of this license are available at https://www.dovepress.com/terms
and incorporate the Creative Commons Attribution
- Non Commercial (unported, 3.0) License.
By accessing the work you hereby accept the Terms. Non-commercial uses of the work are permitted
without any further permission from Dove Medical Press Limited, provided the work is properly
attributed. For permission for commercial use of this work, please see paragraphs 4.2 and 5 of our Terms.
© 2022 The Author(s). This work is published and licensed by Dove Medical Press Limited. The
full terms of this license are available at https://www.dovepress.com/terms
and incorporate the Creative Commons Attribution
- Non Commercial (unported, 3.0) License.
By accessing the work you hereby accept the Terms. Non-commercial uses of the work are permitted
without any further permission from Dove Medical Press Limited, provided the work is properly
attributed. For permission for commercial use of this work, please see paragraphs 4.2 and 5 of our Terms.