Back to Journals » Journal of Inflammation Research » Volume 14
Localized and Systemic Inflammatory Mediators in a Murine Acute Mastitis Model
Authors Takashima M ![]() , Lalonde C, Olszanski LA
, Lalonde C, Olszanski LA ![]() , Zhao FQ
, Zhao FQ ![]()
Received 1 April 2021
Accepted for publication 8 July 2021
Published 21 August 2021 Volume 2021:14 Pages 4053—4067
DOI https://doi.org/10.2147/JIR.S313799
Checked for plagiarism Yes
Review by Single anonymous peer review
Peer reviewer comments 3
Editor who approved publication: Professor Ning Quan
Miyuki Takashima,1,2 Christian Lalonde,1 Laura Ashley Olszanski,1 Feng-Qi Zhao1
1Department of Animal and Veterinary Sciences, University of Vermont, Burlington, VT, 05405, USA; 2Wakunaga Pharmaceutical Co. Ltd, Osaka, 532-0003, Japan
Correspondence: Feng-Qi Zhao Email [email protected]
Introduction: Milk depression is the major driver of economic loss due to mastitis in dairy animals. The aim of this study was to identify potential mediators of milk depression by investigating the local and systemic changes in gene expression or cytokine production during endotoxin challenge of the mammary gland in a mouse model.
Methods: The left and right sides of the 4th pair of mouse mammary glands were alternatively injected with either lipopolysaccharide (LPS, Escherichia coli 055: B5, 50 μL of 0.4 mg/mL) or sterile PBS through the teat meatus 3 days postpartum (n = 9). The 4th glands were individually collected 12 h after LPS injection and analyzed to identify gene expression changes by RNA sequencing and real-time PCR, and the plasma was collected before and after LPS challenge and analyzed to determine the levels of 32 cytokines.
Results: Transcriptome analysis showed that in addition to strong pro-inflammatory responses, which included granulocyte and monocyte migration and cytokine production and signaling, the LPS-treated glands exhibited strong ubiquitin-mediated and immune-mediated proteasome activation and an increase in nitric oxide-mediated oxidative stress. Furthermore, LPS induced a down-regulation in vesicle membrane, vesicle-mediated trafficking, and metabolic processes of amino acids and other organic molecules in the mammary gland. Of the 32 cytokines analyzed, the levels of 24 (mainly IL-6, G-CSF, MCP-1, RANTES, MIG, MIP-1b, KC, MIP-2, IP-10, and TNFα) were increased or tended to increase in the blood after LPS treatment, and only the levels of IL-9 were decreased. In the mammary gland after LPS challenge, the levels of IL-5, IL-6, IP-10, LIF, MCP-1, MIP-2, and TNFα were significantly increased, and the levels of INF&Ugr;, IL-2, IL-4, IL-10, and IL-12 (p40) were decreased.
Discussion: These observations provide potential markers and targets for further studies on the prevention and treatment of gram-negative bacteria-induced mastitis.
Keywords: cytokine, lipopolysaccharide, oxidative stress, proteasome, transcriptome change
Introduction
Mastitis is inflammation of the mammary gland that usually occurs in response to a bacterial infection, and it is a very widespread disease that affects both humans and dairy animals. In humans, mastitis affects up to 33% of lactating mothers, causing pain and discomfort.1 Additionally, women with a history of mastitis are considered at an increased risk of developing breast cancer later in life.2,3 In dairy cows, mastitis is both the most common and the costliest disease.4–6 The economic impact of mastitis in cows results from decreased fertility, increased rates of early culling of animals and increased veterinary care costs, but it mainly results from a decrease in both the quality and quantity of milk produced.5–7 The decrease in milk production can sometimes persist long after the infection and the inflammation have both been resolved, impacting later lactation.8 Last, as a known cause of pain and discomfort in animals, the prevention and/or swift and effective treatment of mastitis are also increasingly important socially, as there is growing animal welfare pressure on the dairy industry.
Mastitis can be further categorized into 3 main types based on the severity and suddenness of symptom onset; in decreasing order, these types are acute mastitis, chronic mastitis, and subclinical mastitis. While there is no definite consensus about which pathogen causes which form of the disease, acute mastitis is most often associated with either Staphylococcus or Streptococcus when it is caused by gram-positive bacteria, or with Escherichia coli (E. coli) when it is caused by gram-negative bacteria.9,10 For mammary pathogenic E. coli, lipopolysaccharide (LPS) is the most important virulence factor and can be used alone to mimic the inflammation induced by gram-negative bacteria; as such, LPS has been widely used in acute mastitis models in animals, such as mice and cows.
Acute mastitis is known to elicit a strong localized immune response in the infected gland but also has a distinct systemic effect in the host.11 Among the systemic effects, general lethargy and fever are common symptoms that have been shown to negatively impact behavior and feeding in cows.12 This decrease in food intake can have a strong negative impact on short-term milk production, and depending on how early it occurs in lactation, mastitis can significantly lower peak production for the whole lactation period, drastically reducing the total milk production of the animal in question. Mastitis has also been shown to induce lactation insufficiency in women.13 In addition, the localized proinflammatory response can cause significant oxidative stress in the affected mammary gland14 and lead to permanent tissue damage. Both reactive oxygen and reactive nitrogen species appear to be involved in this process.15,16 The precise roles that localized and systemic responses play in the recovery and long-term prognosis of the disease are not currently well established. For example, while mastitis increases the risk of developing breast cancer in women, this increased risk is not limited to the area affected by mastitis, suggesting implication of the systemic inflammatory response rather than direct tissue damage.17 Similarly, the factors that mediate the local and systemic responses are not fully clear.
Cytokines play key roles in inflammation.18 A number of cytokines are currently known to be associated with acute mastitis, including but not limited to the major proinflammatory cytokines IL-1β, IL-2, IL-6, and TNFα.19 TNFα, IL-6, and IL-1 are the cytokines that are most consistently reported to be elevated in the plasma of mastitis-affected cows20–22 and mice.23 The local response to mastitis includes elevated levels of IL-1β, IL-6, IL-10, IL-12, and TNFα.24–26 However, there is a lack of studies directly comparing systemic and local cytokine responses, and there is a lack of diversity in the cytokines that are typically evaluated.
For these reasons, it is important to study the inflammation associated with mastitis as a whole system and to give special attention to the differences between the systemic and localized responses in order to gain a better understanding of the pathology of mastitis in the hope of one day minimizing its negative impacts on both health and productivity. In this study, we set out to evaluate the changes in the transcriptome of an LPS-infused mammary gland compared to that of a PBS-infused contralateral gland in a murine acute mastitis model to identify genes associated with the localized immune response to LPS-induced mastitis. We then further investigated the localized and systemic changes in the levels of 32 different cytokines to corroborate the findings from gene expression observations.
Materials and Methods
Animals and Treatment
Eighteen 8-week-old female BALB/c mice were purchased from Jackson Laboratory (Bar Harbor, ME) and all the animal procedures were approved by the University of Vermont Institutional Animal Care and Use Committee (Protocol #18-030). The welfare and treatment of the laboratory animals followed the US federal Animal Welfare Act (AWA) and the Public Health Service Policy on Humane Care and Use of Laboratory Animals (PHS Policy). The mice were fed ad libitum and housed at the University of Vermont Small Animal Facility in breeding cages in a room with a temperature of 25 °C, humidity of 45% and 12-h dark-light cycles. The mice were bred and kept until 3 days after parturition. The mice were anesthetized with 4% isoflurane and 100 µL of blood was collected from the tail vein. Then, the fourth mammary gland on one side was injected with 50 µL of LPS (E. coli 055:B5, Sigma, St. Louis, MO, 0.4 mg/mL) through the teat meatus, while the contralateral gland was injected with 50 µL of PBS, and both treatments were administrated with 30G insulin needles (Becton, Dickinson & Company, Franklin Lakes, NJ). After 12 h, blood was once again collected from each animal and the animal was then sacrificed. The LPS- and PBS-infused mammary glands from each mouse were collected, frozen in liquid nitrogen, and stored at −80 °C.
RNA Sequencing (RNA-Seq)
A total of 30 mg of frozen mammary gland tissue was ground by a mortar and pestle chilled with liquid nitrogen and subsequently placed in 600 µL of lysis buffer (RLT, Qiagen, Germantown, MD). Total RNA was extracted from the LPS-infused and PBS-infused mammary glands of five randomly selected mice (n = 5) using the RNeasy Mini Kit (Qiagen) according to the manufacturer’s protocol. The RNA quality was assessed by the RNA integrity number (RIN) using Total RNA Nanochips on a Bioanalyzer 2100 (Agilent Technologies, Santa Clara, CA). The total RNA samples were sent to Novogene USA (Sacramento, CA) for library preparation using the NEBNext® UltraTM RNA Library Prep Kit for Illumina® (New England Biolabs, Ipswich, MA) and sequencing. First, mRNA was enriched from 1 µg of total RNA using poly-dT oligo-attached magnetic beads and fragmented using divalent cations under elevated temperature in NEBNext First Strand Synthesis Reaction Buffer (5X). The first-strand cDNA library was then prepared using random hexamer primer and M-MuLV Reverse Transcriptase, and second-strand cDNA was subsequently synthesized using DNA Polymerase I and RNase H. After the remaining overhangs were converted into blunt ends and 3ʹ ends of the DNA fragments were adenylated, cDNA was ligated to NEBNext Adaptor with a hairpin loop structure for hybridization. cDNA fragments (150–200 bp) were preferentially purified with the AMPure XP system (Beckman Coulter, Beverly, MA). The size-selected, adaptor-ligated cDNA was incubated with 3 μL USER Enzyme at 37 °C for 15 min followed by 5 min at 95 °C, and then PCR was carried out with Phusion High-Fidelity DNA polymerase, Universal PCR primers and Index (X) Primer. The PCR products were purified with the AMPure XP system and the library quality was assessed on the Agilent Bioanalyzer 2100 system. Finally, the libraries were sequenced after cluster generation on an Illumina NovaSeq sequencer (NovaSeq 6000 sequencer, Illumina, San Diego, CA) according to the manufacturer’s instructions.
Bioinformatics Analysis
Bioinformatic analysis of the RNA-seq data was performed by Novogene. Briefly, imaging data from sequencing were transformed into raw data by CASAVA recognition (base calling) and subjected to quality control by removing low-quality reads or reads with adaptors. Read mapping to the Mus musculus reference genome (GRCm38, mm10) was performed using the STAR (v2.5) aligner.27 The read numbers mapped for each gene were counted using HTSeq (v0.6.1) and calculated to determine the expected number of fragments per kilobase of transcript sequence per million base pairs sequenced (FPKM).28 Differential gene expression analysis was performed using the DESeq2 R package (v2_1.6.3).29 The resulting P-value was adjusted using Benjamini and Hochberg’s approach for controlling the false discovery rate (FDR), and an adjusted P-value (Padj) < 0.05 was set as the threshold for significant differential expression. Venn diagrams, correlations and clusters of gene expression in different groups were prepared using the functions in R. Functional analysis, including Gene Ontology (GO) and Kyoto Encyclopedia of Genes and Genomes (KEGG), was performed using the clusterProfiler R package.30
Quantitative Real-Time PCR Analysis (qPCR)
Total RNA was isolated from all the LPS-infused and PBS-infused mammary glands as described in 2.3 above (n = 9), and the RNA was reverse transcribed using SuperScript™ III Reverse Transcriptase (Invitrogen, Carlsbad, CA). The mRNA expression of individual genes was analyzed by qPCR using SYBR green. Briefly, 1 µL of cDNA solution was mixed with 500 nM forward and reverse primers16 in 10 µL, and 10 µL of iTaq SYBR Green Supermix (Bio-Rad, Hercules, CA) was added to each reaction. The primer sequences were provided in a previous study.16 The reactions were carried out in a Bio-Rad CFX96 Thermocycler using the following program: initial denaturation at 95 °C for 30 s and 40 cycles of 5 s at 95 °C for denaturation and 30 s at 60 °C for annealing and extension followed by melt curve analysis from 65 to 95 °C at 0.5 °C increments at every 5 s. The qPCR data were analyzed by the 2^^ (-ddCt) method31 and normalized by the average expression level of the housekeeping genes Hprt, Actb, Hnrnpab, and Stx5a. The analysis was conducted in duplicate or triplicate.
Oxidative Stress and Antioxidation Assays
Mammary gland tissues were ground with a mortar and pestle in liquid nitrogen and then lysed in RIPA lysis buffer [20 mM Tris-HCl (pH 7.5), 150 mM NaCl, 1 mM Na2EDTA, 1 mM EGTA, and 1% NP-40] with a protease inhibitor cocktail on ice. The lysates were centrifuged at 10,000 g for 15 min at 4 °C. The supernatants were collected, and the protein concentration was measured and adjusted to 0.5 mg/mL. The hydrogen peroxide (H2O2) levels in plasma and mammary tissue were quantified using a Sigma Fluorimetric Hydrogen Peroxide Assay Kit (#MAK166) according to the manufacturer’s specifications. The activities of catalase (CAT), superoxide dismutase (SOD), glutathione peroxidase (GPX), and glutathione reductase (GR) in the plasma and mammary tissues were measured using the CAT assay kit, SOD assay kit, GPX assay kit, and GR assay kit, respectively, purchased from Cayman Chemical Company (Ann Arbor, MI) and following the manufacturer’s instructions.
Cytokine Analysis
The plasma and tissue levels of 32 individual cytokines and chemokines [eotaxin, granulocyte colony-stimulating factor (G-CSF), granulocyte macrophage colony-stimulating factor (GM-CSF), interferon gamma (IFNγ), interleukin 1 alpha (IL-1α), interleukin 1 beta (IL-1β), interleukin 2 (IL-2), interleukin 3 (IL-3), interleukin 4 (IL-4), interleukin (IL-5), interleukin 6 (IL-6), interleukin 7 (IL-7), interleukin 9 (IL-9), interleukin 10 (IL-10), interleukin 12 p40 (IL-12p40), interleukin 12 p70 (IL-12p70), interleukin 13 (IL-13), interleukin 15 (IL-15), interleukin 17 (IL-17), interferon gamma-induced protein 10 (IP-10), keratinocyte chemoattractant (KC), leukemia inhibitory factor (LIF), C-X-C motif chemokine 5 (LIX), monocyte chemoattractant protein 1 (MCP-1), macrophage colony-stimulating factor (M-CSF), monokine induced by gamma interferon (MIG), macrophage inflammatory protein alpha (MIP-1α), macrophage inflammatory protein beta (MIP-1β), macrophage inflammatory protein 2 (MIP-2), regulated on activation normal T cell expressed and secreted (RANTES), tumor necrosis factor alpha (TNFα), and vascular epithelial growth factor (VEGF)] were simultaneously analyzed using the Milliplex® Mouse Cytokine Array/Chemokine Array 32-Plex (Millipore Sigma, Burlington, MA) on a BioPlex® 200 system (Bio-Rad, Hercules, CA) by Eve Technologies Corp. (Calgary, AB, Canada). Briefly, for serum samples, 25 µL of serum was diluted with 25 µL of PBS and sent to the company for analysis. For mammary gland samples, tissue lysates were adjusted to a protein concentration of 1 mg/mL in RIPA buffer, and 50 µL of each lysate was sent to the company for analysis.
Statistical Analysis
The statistical significance of qPCR, oxidative stress/antioxidation, and cytokine assay data was determined using a 2-tailed paired t-test when the data followed a normal distribution, or by a Wilcoxon matched-pairs rank test when the data were not normally distributed. A significant difference was defined when P < 0.05, and a trend was defined when 0.05 < P < 0.1.
Results
RNA-Seq
In RNA-seq, an average of 7G clean bases with an error rate between 0.02% and 0.03% depending on the positions were obtained for each of the 10 samples, from which an average of 96.74% of the 44,670,372 reads were mapped to the Mus musculus genome. The average Pearson correlation coefficient (R2) between replicates was 0.977 for the PBS samples and 0.981 for the LPS samples.
There were 908 statistically significant differentially expressed genes (DEGs, 608 upregulated and 300 downregulated) in the LPS-treated glands compared to the PBS-treated glands (Figure 1). As expected, many inflammation markers and immune function-related genes were greatly overexpressed in the LPS-treated glands. First, among them, the expression of the Klk10 gene, which encodes kallikrein-related peptidase 10, was increased 21.42-fold and was the most statistically significant DEG. Second, both subunits of the calprotectin protein (S100A8/A9), an important endogenous activator of TLR4, are also among the most overexpressed genes. Third, two stefins (intracellular thiol proteinase inhibitors), A3 and A2-like (Stfa3/2), were also greatly overexpressed. The most significantly downregulated gene was Gldc, which encodes glycine decarboxylase, a key enzyme of the glycine cleavage system.
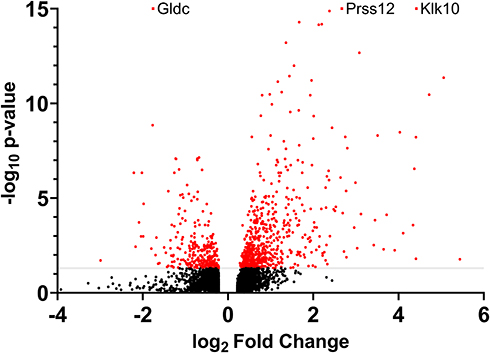 |
Figure 1 RNA sequencing analysis of differentially expressed genes in the mammary gland infused with lipopolysaccharide for 12 h compared with the gland treated with PBS (n = 5): Volcano plot. All the genes with a log2-fold change above 0.22 or below −0.22 are shown. The gray line represents the cutoff for an adjusted P-value of 0.05. Red dots represent genes that were statistically significant. Gdlc, Prss12 and Klk10 were more statistically significant than shown on the graph. |
Of the 908 significant DEGs, 13 were characterized as coming from an unknown species, and 895 were characterized as belonging to Mus musculus. The 895 confirmed mouse genes were deliberately classified into 16 categories by main cellular function (Figure 2, Table S1). Genes related to the immune response were the most frequently upregulated (173 genes). Genes related to metabolism/homeostasis were the second most frequently upregulated (64 genes) and the most downregulated (66 genes). More genes related to proliferation/growth, skin/wound healing, oxidative stress, and apoptosis were significantly upregulated in the LPS-treated glands, whereas more genes related to sex hormone/milk production were downregulated. The expression of genes related to cell organization appeared to be significantly changed, with the expression of a high number of genes directly related to vesicles, membranes, and cytoskeleton arrangements either up- or downregulated in the LPS-treated mammary gland.
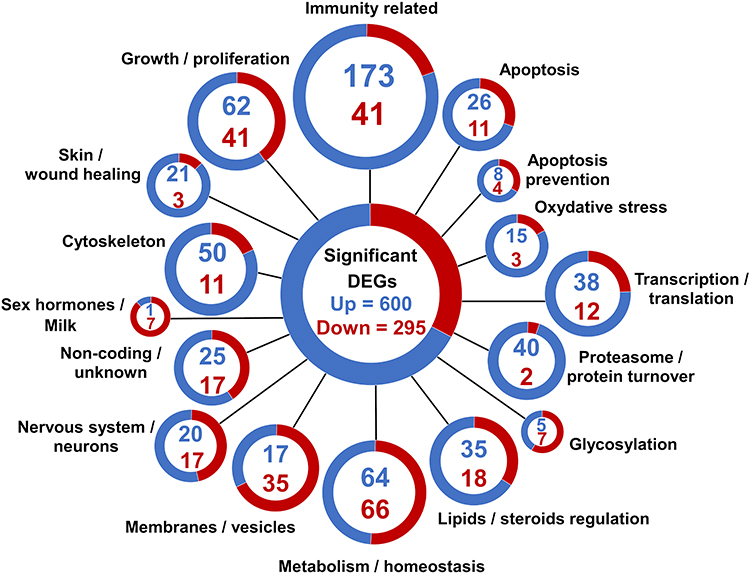 |
Figure 2 RNA sequencing analysis of differentially expressed genes (DEGs) in the mammary gland infused with lipopolysaccharide for 12 h compared with the gland treated with PBS (n = 5): Classification of DEGs. Genes were divided into 16 categories based on their gene ontology annotation, sequence homology, known pathways, and literature. Each gene was assigned to only one category. Blue and red colors represent up- and downregulated genes, respectively. The assignments are shown in Table S1. |
Both GO term and KEGG pathway enrichment analyses of upregulated DEGs in the LPS-treated glands returned proteasome as the most or second most significantly enriched term or pathway based on Padj (Figure 3A and B). This feature was particularly notable in the KEGG pathway enrichment analysis, with the proteasome pathway being considered more significant than the second most enriched pathway by a factor of 14 log10. For the constitutive proteasome, the genes encoding 13 out of the 14 core proteasome proteins were significantly upregulated, and the genes encoding 9 out of the 20 regulatory subunits were also upregulated (Figure 4). For the immunoproteasome, in addition to the core 20s proteasome, the expression of the 3 specific catalytic subunits and the 2 specific regulatory subunits was also upregulated, as well as the expression of the general proteasome maturation factor POMP (Figure 4).
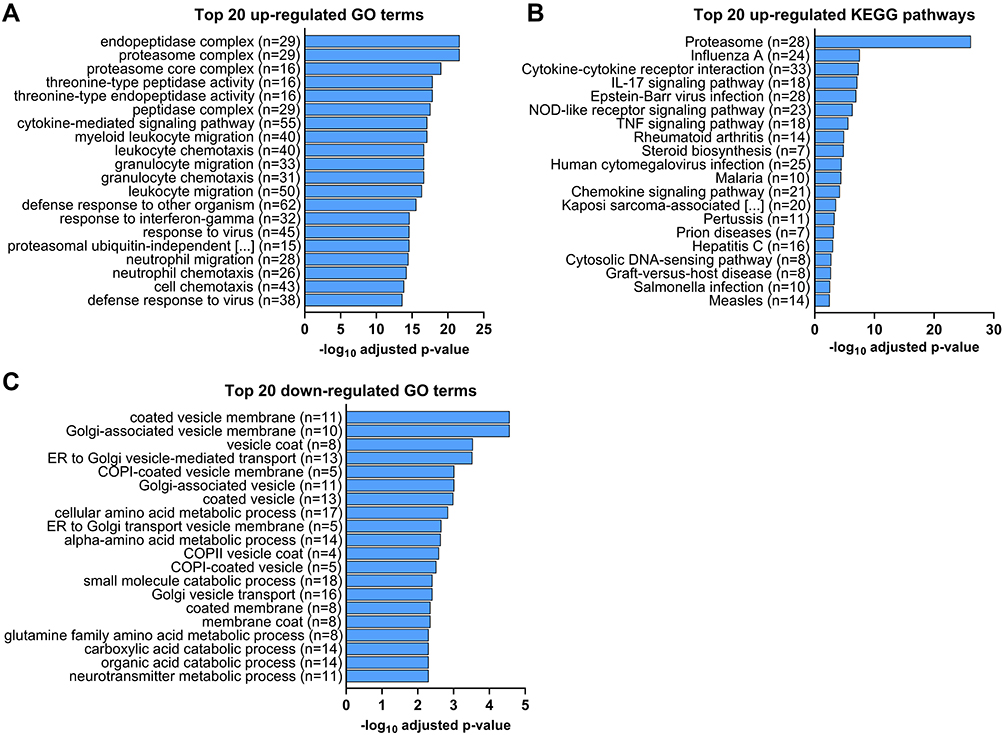 |
Figure 3 RNA sequencing analysis of differentially expressed genes (DEGs) in the mammary gland infused with lipopolysaccharide for 12 h compared with the gland treated with PBS (n = 5): Top 20 GO terms and KEGG pathways significantly enriched from up- (A and B) or downregulated (C) DEGs with the most significant adjusted P values (padj) by Benjamini-Hochberg correction for multiple testing (padj < 0.05). n represents the number of genes corresponding to each GO term that were up- or downregulated. |
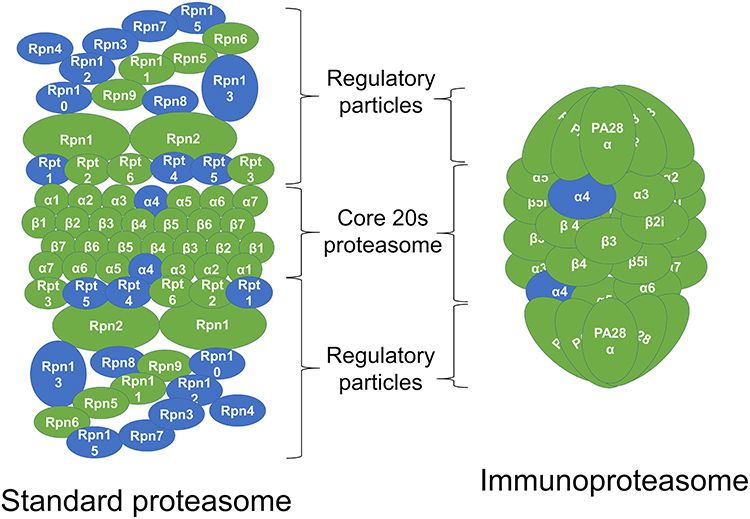 |
Figure 4 Upregulation of individual proteasome gene expression by lipopolysaccharide (LPS). In the schematic representation of the standard constitutive proteasome and the immunoproteasome, the subunits in green represent subunits for which the genes were upregulated in the LPS-treated mammary gland compared to the PBS-treated gland in RNA sequencing analysis. |
Other significantly enriched KEGG pathways from upregulated genes in the LPS-treated gland were almost all associated with inflammation and immune function, such as IL-17 and TNF signaling, cytokine-receptor interaction, nucleotide-binding oligomerization domain (NOD)-like receptor signaling or disease-specific pathways (Figure 3B). Interestingly, the steroid biosynthesis pathway was also significantly enriched. No significantly downregulated KEGG pathway was identified in this study. For GO terms, 7 of the top 20 enriched GO terms (Figure 3A) and the 7 most significant cellular component (CC) terms (Figure S1A) from upregulated genes based on Padj were all related to protein degradation. The majority of the other significantly upregulated GO terms were related to immune functions, such as chemotaxis of immune cells, response to virus or LPS, and cytokine secretion and activity (Figure 3A and S1A). In addition, other noticeably upregulated GO terms in biological processes (BP) included nitric oxide/reactive oxygen species biosynthetic/metabolic process, regulation of angiogenesis, and apoptotic signaling. The 7 most significantly downregulated GO terms and 13 of the top 20 were related to membrane vesicles and Golgi trafficking (Figure 3C and S1B). The other 7 of the top 20 downregulated GO terms were all related to amino acid and small organic molecule metabolism.
Of the 214 immune-related DEGs, 62 were directly associated with cytokines, while the rest were mostly lectins, pathway intermediates, and other immune function regulators. The expression of the genes encoding the cytokines CXCL16, ENA-78, eotaxin, fractalkine, G-CSF, IL-1α, IL-1β, IL-1f6, IL-6, IP-9, lungkine, MCP1, MCP3, M-CSF, MIF, MIP1α, MIP1β, MIP2β, MIP3A, and RANTES was upregulated, whereas the expression of the genes encoding CCL6, CXCL17, and VEGF-A was downregulated (Figure 5 and Table S2). Additionally, the expression of the genes encoding 4 types of IL-1 receptors, 2 types of IL-13 receptors, the chemerin receptor, an IL-8/MIP2β receptor, the G-CSF receptor, and an MCP1/RANTES/MCP3 receptor was upregulated, whereas the expression of the genes encoding the IL-6 receptor, M-CSF receptor, fractalkine receptor, TNF 13b receptor, and LIF receptor was downregulated. The expression of twenty various interferon response elements was also upregulated and the expression of 1 was downregulated.
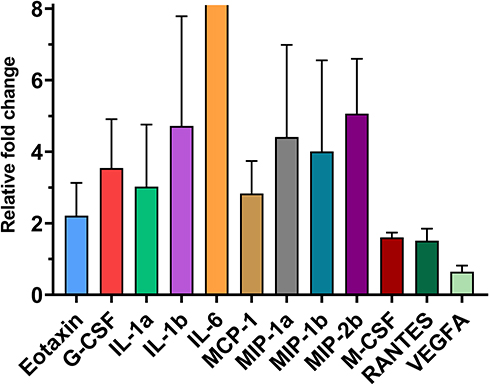 |
Figure 5 Differentially expressed cytokines (mean fold change ± sem) in RNA sequencing among 32 cytokines whose protein concentrations were evaluated (adjusted P < 0.05). The mRNA expression of 11 cytokines was significantly upregulated, and only the expression of VEGF-A was downregulated in lipopolysaccharide-treated mammary glands compared to PBS-treated glands. |
qPCR
In qPCR, the mRNA expression of all 3 cytokines analyzed (IL-1β, IL-6, and TNFα) increased from 2.4- to 44.8-fold in LPS-treated glands compared to the PBS glands (P < 0.01, Figure 6 and Table S3). In addition, the expression of two milk proteins, β-casein and α-lactalbumin, was decreased by LPS (P < 0.05), whereas the expression of α-S1-casein was not significantly changed. The expression of the cell apoptosis marker Bax was increased by LPS treatment, but the expression of Bcl-2 and Bad, as well as the expression ratio of Bax/Bcl-2, was not significantly affected. Moreover, the correlation coefficient between the fold changes of these gene levels obtained by RNA-seq and qPCR was very high, with an R2 value of 0.97 (Table S3).
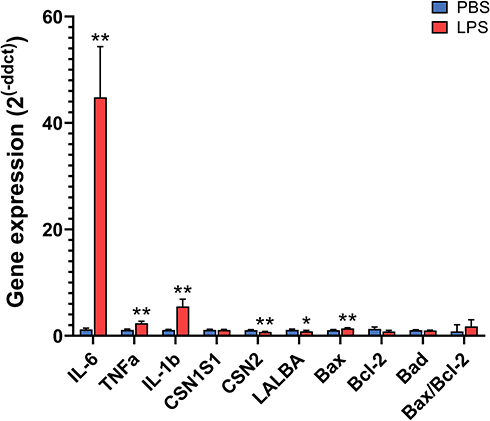 |
Figure 6 Relative gene expression in the mammary gland treated with lipopolysaccharide (LPS) for 12 h compared with the gland treated with PBS as determined by quantitative real-time PCR. Gene expression was calculated by the 2−ΔΔCt method and normalized to the levels of the housekeeping genes Actb, Hrpt, Hnrnpab, and Stx5a. Error bars represent standard error (n = 8). *P < 0.05, **P < 0.01. |
Oxidative Stress and Antioxidation Analyses
The levels of hydrogen peroxide were decreased in both the mammary tissue and plasma after 12 h of intramammary LPS challenge (P < 0.05, Figure 7). The enzyme activity of CAT and SOD was decreased in the mammary tissue, and the activity of SOD was also decreased in the plasma after LPS treatment (P < 0.05). The activity of GPX and GR did not show significant changes at 12 h in either the mammary tissue or plasma after LPS infusion.
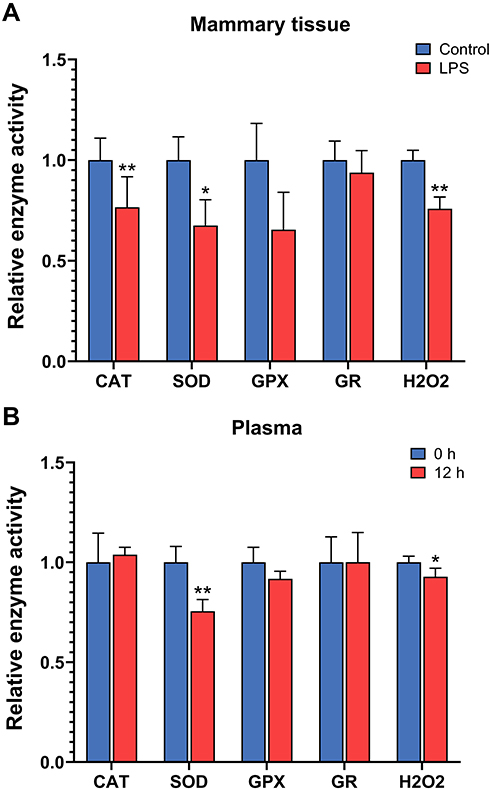 |
Figure 7 Relative activity of antioxidation enzymes catalase (CAT), superoxide dismutase (SOD), glutathione peroxidase (GPX), and glutathione reductase (GR) and levels of hydrogen peroxide (H2O2) in the mammary gland with intramammary infusion of either lipopolysaccharide (LPS) or PBS (Control) for 12 h (A) and in the plasma of mice before (0 h) and after intramammary infusion of LPS for 12 h (B). Error bars represent standard error (n = 9). *P < 0.05, **P < 0.01. |
Cytokine Analysis
The fold-change and P-values of the levels of all 32 cytokines analyzed in the mammary tissue and plasma are shown in Table S4. Of the 32 cytokines analyzed, 6 cytokines had significantly increased levels in both LPS-infused mammary glands and in plasma after LPS challenge (Figure 8A). Four of these cytokines are important chemoattractants for granulocytes and macrophages (IL-5, IP-10, MCP-1, and MIP-2) and exhibited 2.7-, 2.9-, 4.3- and 1.2-fold increases in the mammary tissue and 7.23-, 17.07-, 255.98- and 24.40-fold increases in plasma, respectively. The remaining two (IL-6 and TNFα) are very important regulators of inflammation and had a 5.5- and 1.9-fold increases in the mammary tissue and 2019.2- and 15.2-fold increases in plasma, respectively. The levels of 12 cytokines were significantly elevated in the plasma after LPS challenge but not in the LPS-infused mammary glands (Figure 8B). Eotaxin, KC, MIG, MIP-1α, MIP-1β, and RANTES, with 1.7-, 34.6-, 38.7-, 7.6-, 35.0- and 45.8-fold increases in concentration, respectively, are chemoattractant and recruiting cytokines for granulocytes, natural killers, monocytes, and other immune cells. M-CSF and G-CSF are two important colony stimulating factors, with 2.0- and 326.9-fold increased concentrations, respectively. IL-1α, IL-13, and IL-17, with 10.6-, 2.1- and 14.1-fold increased concentrations, respectively, are important proinflammatory cytokines, and VEGF is an important angiogenesis factor with a 2.1-fold increased concentration. However, eotaxin, MIP-1β, RANTES, and G-CSF also exhibited a trend of increased levels in mammary tissue (0.1 > P > 0.05).
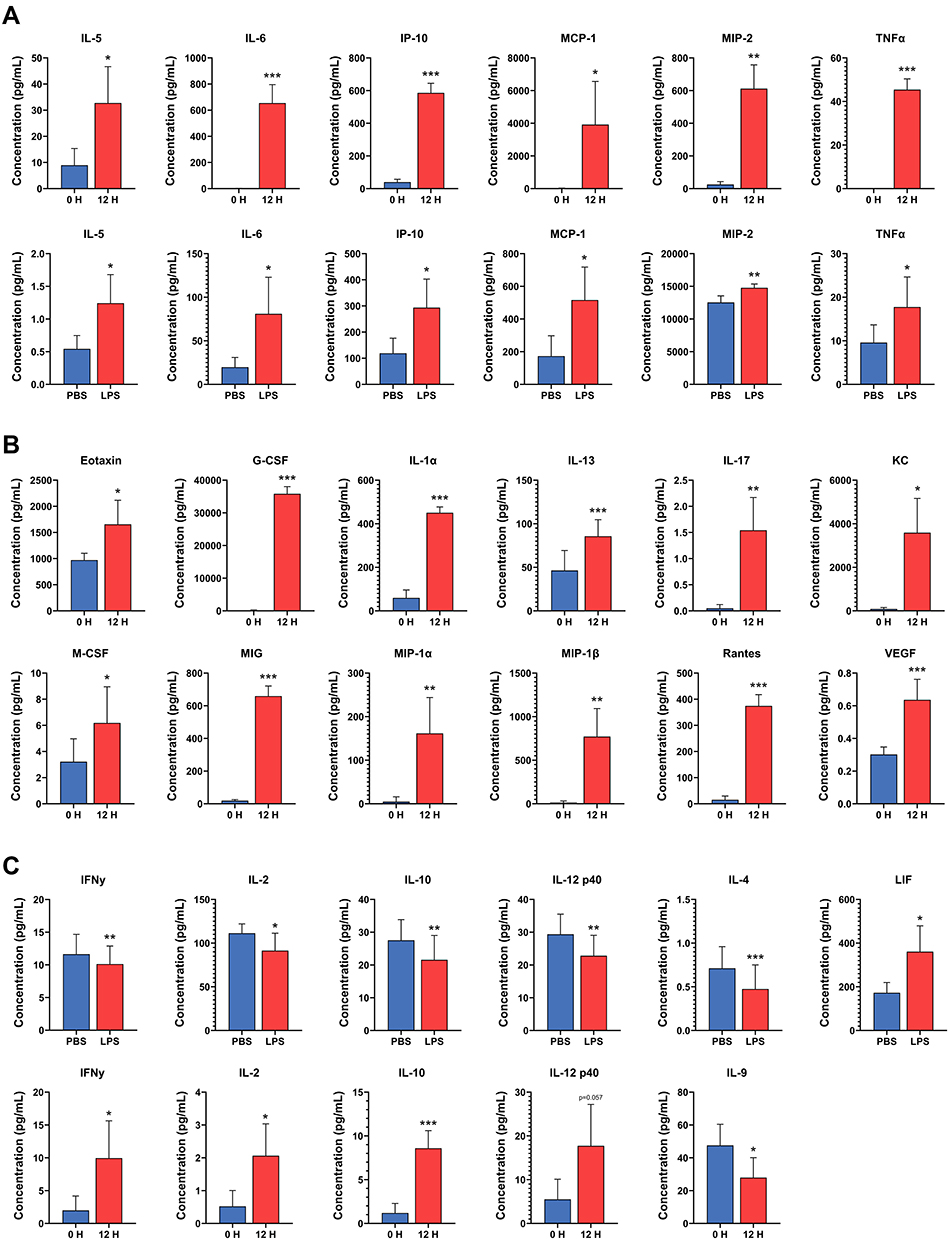 |
Figure 8 Changes in cytokine concentrations in the mammary gland after intramammary infusion of either lipopolysaccharide (LPS) or PBS for 12 h (bottom panel in A and upper panel in C) and in the plasma of mice before (0 H) and after (12 H) intramammary infusion of LPS for 12 h (B, upper panel in A, and bottom panel in C). (A) Cytokines with increased levels in both plasma and mammary tissue following LPS challenge. (B) Cytokines with increased systemic levels in plasma but not in mammary tissue after localized mammary LPS challenge. (C) Cytokines on whose levels LPS had opposite systemic and local effects or for which LPS resulted in decreased levels in either mammary tissue or plasma or increased levels in mammary tissue. Error bars represent standard error (n = 9). *P < 0.05, **P < 0.01, ***P < 0.001. |
The levels of three cytokines, namely, IFNγ, IL-10, and IL-2, were significantly lower in the LPS-infused mammary glands than in the PBS-infused glands (0.87-, 0.77- and 0.88-fold concentrations, respectively), but were significantly higher in the plasma after infusion of the mammary gland with LPS (7.0-, 9.4- and 2.7-fold, respectively) (P < 0.05, Figure 8C). IL-12 p40 also followed this trend, but the increase in plasma level was not significant (P = 0.058). Additionally, the level of IL-4 (0.64-fold) was significantly lower only in the LPS-infused mammary glands, and the level of IL-9 (0.66-fold) was significantly lower only in the plasma after infusion of the mammary gland with LPS (Figure 8C). The level of LIF (2.4-fold) was also significantly higher in tissue but not in the plasma after LPS challenge (Figure 8C).
Discussion
In our previous study, LPS induced dramatic inflammatory responses, as demonstrated by the massive recruitment of immune cells into alveoli and acute changes in the expression of cytokines (Il1B, Il6, and Tnfα), milk proteins (Csn2 and Lalba), and genes involved in apoptosis and oxidative stress (Bax and Nqo1) in the mammary gland after 12 h of LPS challenge.16 To extend that study, in the present research, we first carried out an RNA-seq analysis to profile the comprehensive transcriptome changes in the intramammary LPS-challenged gland compared to the contralateral gland treated with PBS for 12 h. Our RNA-seq results showed over 900 DEGs. It is no surprise to see that among these genes, 214 were related to inflammation and immune function (mainly cytokines and their pathway intermediates and other immune function regulators), of which the majority (over 170) showed upregulated expression.
However, the top enriched GO terms and KEGG pathways from the upregulated genes in the RNA-seq results were proteasome complex and endopeptidase activity. The proteasome is a multisubunit endopeptidase complex responsible for the degradation of unneeded or damaged intracellular proteins by proteolysis. Protein degradation by proteasomes plays important roles in the regulation of a variety of basic cellular processes, such as the cell cycle, apoptosis, tissue development, signal transduction, immune responses, metabolism and protein quality control, by degrading short-lived regulatory or structurally aberrant proteins often marked by polyubiquitination.32 The immunoproteasome is a specialized form of the proteasome that is abundantly expressed in immune cells.33 The proteasome plays a critical role in the function of the adaptive immune system by degrading peptide antigens derived from invading pathogens displayed by the major histocompatibility complex class I (MHC) proteins. LPS has been previously shown to be able to induce the formation of immunoproteasomes,34 which is essential to macrophage production of nitric oxides and various proinflammatory cytokines.35 Ubiquitin-mediated proteasome expression was also previously shown to be increased following LPS-mediated endotoxemia,36 although research has mainly concentrated on the catalytic subunits β1, β2, and β5. Here, we demonstrated an almost ubiquitous increase in the expression of all immunoproteasome subunits, as well as almost half of the regulatory subunits of the constitutive proteasome. The overwhelming increase in proteasome gene expression after LPS treatment in this study suggests that the proteasome is an essential part of the immune response.
The next top upregulated GO terms and KEGG pathways were cytokine signaling pathways (such as IL-17 and TNF signaling pathways) and macrophage and granulocyte migration which are also strongly associated with cytokine functions. The gene expression of the cytokines CXCL16, ENA-78, eotaxin, fractalkine, G-CSF, IL-1α, IL-1β, IL-1f6, IL-6, IP-9, lungkine, MCP1, MCP3, M-CSF, MIF, MIP1α, MIP1β, MIP2β, MIP3A, and RANTES was up-regulated, whereas the gene expression of CCL6, CXCL17, and VEGF-A was downregulated in the LPS-treated glands. To further identify the local and systemic cytokine responders, the protein concentrations of 32 cytokines in the mammary tissue and plasma were analyzed after LPS treatment. Unfortunately, CXCL16, ENA-78, fractalkine, IP-9, lungkine, MCP3, MIP3A, CCL6, and CXCL17 were not included in the cytokine array we used, and their protein levels were not evaluated, although their mRNA expression was significantly up- or downregulated in the mammary gland by LPS. Most of these cytokines are relatively novel cytokines and as such, they could represent potentially interesting candidates for future research.
Of 32 cytokines analyzed by cytokine array, the levels of 24 were significantly or tended to be increased in the blood following LPS administration, but only the levels of 12 were increased in the mammary tissue. Of the 12 cytokines whose levels were increased in the mammary gland, eotaxin, IP-10, MCP-1, MIP-1β, MIP-2, and RANTES are potent chemoattractants37 and may be the key players in inducing immune cell infiltration into the LPS-treated glands,16 whereas G-CSF, M-CSF, IL-5, IL-6, LIF, and TNFα are key mediators in the activation and proliferation of immune and inflammatory cells.37 Among these 12 cytokines, the mRNA expression of G-CSF, M-CSF, eotaxin, IL-6, MCP-1, MIP-1β, MIP-2β, and RANTES was also increased in the LPS gland, whereas the mRNA expression of IL-5, LIF, IP-10, and TNFα was not significantly changed, indicating potential posttranscriptional regulation of these 4 genes. Except for LIF, the 11 other cytokines also exhibited increased protein levels in the blood after intramammary LPS challenge, indicating both local and systemic roles of these cytokines in the acute phase of LPS-induced mastitis. The increased mammary production of these cytokines may at least partially contribute to the systemic rise of these cytokines in blood. Moreover, while the expression of IL-6 and M-CSF was increased in the LPS gland, the gene expression of their receptors was decreased, suggesting a potential feedback loop mechanism in the mammary gland.
In contrast, the protein levels of INFγ, IL-2, IL-4, IL-10, and IL-12 (p40) were lower in LPS-infused mammary tissue (the reads for these cytokines were too low to be analyzed by RNA-seq). Reductions of INFγ, IL-2, and IL-4 expression were also observed in bovine mammary glands at 3 or 12 h after LPS challenge (Choudhary et al., unpublished observation). These cytokines may play an anti-inflammatory role in the acute phase of LPS-mediated inflammation in the mammary gland. IL-4 and IL-10 are well-known potent anti-inflammatory cytokines.38,39 Reduction in the levels of these cytokines may support inflammatory reactions in the mammary gland at this phase of LPS challenge. All these anti-inflammatory cytokines, except IL-4, were or tended to be expressed at higher levels in the blood at 12 h after LPS treatment. The increase in these cytokine levels in the blood implies that these cytokines may play a systemic anti-inflammatory role to protect other tissues from inflammatory reactions.
The concentrations of IL-1α, IL-1β, IL-7, IL-13, IL-17, KC, MIG, MIP-1α, and VEGF were or tended to be higher in the blood, but not in the mammary gland after LPS injection. These cytokines must be produced and secreted from nonmammary sources, such as immune cells or hepatocytes, and contribute to systemic responses to LPS challenge together with other systemically increased cytokines discussed above. IL-9 was the only cytokine whose level was reduced in the blood after LPS challenge. IL-9 remains an understudied cytokine. There is evidence that IL-9 plays a role in regulating immunity to infectious disease through several mechanisms, including suppression of inflammatory cytokine production and the respiratory burst in monocytes.40,41 Thus, decreased levels of this cytokine may also help systemic immune responses.
Reactive oxygen species biosynthetic/metabolic processes were among the enriched GO terms from the upregulated genes in LPS-treated glands, consistent with increased oxidative stress in acute mastitis observed previously.42,43 However, these processes appeared to be mainly related to the biosynthetic/metabolic processes of nitric oxide because the nitric oxide synthase 2 (iNOS, Nos2), dynein light chain 1, cytoplasmic (Dynll1) and dimethylarginine dimethylaminohydrolase 1 (Ddah1) genes were among the upregulated genes. iNOS is a nitric oxide synthase induced by a combination of LPS and certain cytokines44 and plays a key role in the host defense of mammals against infectious agents. Cytoplasmic dyneins physically interact with neuronal nitric oxide synthase to destabilize the enzyme dimer and control its activity.45 Dimethylarginine dimethylaminohydrolase activity removes methylarginine accumulation to stimulate nitric oxide synthesis.46 Thus, these three genes are closely associated with nitric oxide production. In addition, upregulation of the immunoproteasome promotes macrophage production of nitric oxides as described above. Nitric oxide is a signaling molecule that plays a key role in the pathogenesis of inflammation. Nitric oxide plays an anti-inflammatory role under normal physiological conditions but can also be a proinflammatory mediator due to overproduction in abnormal situations. The release of nitric oxide was observed in milk somatic cells in cows during endotoxin-induced mastitis.47 The hydrogen peroxide concentration was decreased in the mammary gland after 12 h of LPS treatment in this study, which was contrary to the increased concentration in our previous study.16 The reason for the discrepancy between these two studies is not known, but we hypothesize that a high hydrogen peroxide concentration may be present at earlier times of LPS treatment. Supporting this notion, the hydrogen peroxide concentration was lower at 24 h post LPS challenge in our previous study. In supporting increased oxidative stress in LPS-treated glands, the activities of the antioxidant enzymes CAT and SOD were decreased in the mammary tissue and/or plasma after LPS treatment in this study, consistent with a decreasing trend in total antioxidant capacity observed in LPS-treated mammary glands at 12 and 24 h in our previous study.16
One of the top DEGs is the overexpression of Klk10, which encode a serine protease, consistent with the findings in cows.48 This finding is of particular interest because a modification of Klk10 expression has been implicated in various cancer types, including breast cancer,49 where it is thought to act as an antitumoral factor.50 To make matters more complicated, an upregulation of Klk10 expression has also been observed to promote metastasis and a poorer prognosis in some cancer types.51 The strong induction of Klk10 by LPS in the mammary gland suggests an important role of this protein in mastitis, but the exact role is unknown and may be related to its role in breast cancer tumorigenesis. In addition, could this overexpression of Klk10 from mastitis play a role in the long-term development of breast cancer? There is evidence that women with mastitis have a higher chance of developing breast cancer.2 Klk10 was not the only breast cancer marker to be affected by LPS treatment in this study. The expression of Ral GTPase activating protein alpha subunit 1 (Ralgapa1)52 and neuroepithelial cell transforming gene 1(Net1),53 both known markers of breast cancer, was found to be significantly downregulated in LPS treatment. Additionally, the expression of Krüppel-like factor 15 (Klf15),54 a known breast tumor suppressor, was downregulated, whereas the expression of estrogen-sensitive tetratricopeptide repeat domain 9 (Ttc9), thought to be implicated in metastasis of breast cancer,55 was upregulated. These findings suggest that LPS-induced mastitis activates both tumor-promoting and tumor-suppressing pathways in the mammary glands of mice.
The major significantly downregulated GO terms were vesicle membrane, ER to Golgi vesicle-mediated trafficking, and metabolism of amino acids and other organic molecules. Milk depression is the major driver of economic loss due to mastitis. In our previous study, intramammary LPS challenge resulted in a rapid decrease in milk yield in the cow mammary gland,11 which is consistent with the decreased expression of the major milk proteins β-casein and α-lactalbumin and the downregulation in metabolism observed in this study. α-Lactalbumin is also a component of lactose synthase, which controls milk volume by regulating lactose synthesis. The secretion of many milk components, including caseins and lactose, is mediated by exocytosis of membrane vesicles generated from the Golgi apparatus.56 Thus, the downregulation of the vesicle membrane and vesicle-mediated trafficking in this study may be a result of decreased milk synthesis, but it is also possible that this downregulation may contribute to the decrease in milk yield.
There are several limitations in this study. First, in this study, we adapted a mouse model in which the 4th pair of mammary glands was unilaterally challenged with either LPS or PBS through the teats. The model had a major advantage in reducing individual animal differences in studying the local effects of LPS in mammary tissue, but we cannot rule out the possibility that LPS injected into one gland entered the PBS-injected glands through the bloodstream, which could mask some local effects by causing a systemic effect on the PBS glands. Second, our mammary gland analyses were performed at the tissue level. The changes included local changes in mammary epithelial cells and other cells and may also include changes in cell types, particularly immune cells. Third, we cannot rule out the effect of time in our observations of cytokine levels in the plasma because our plasma cytokine analyses were conducted at 0 and 12 h of LPS treatment. However, the time effect should be minimal, as observed in other studies,16,57 and unlikely to impact our major observations. Finally, our observations were limited to only one time point (12 h after LPS treatment). Gene expression and cytokine production are dynamic processes that change over time. Our observations are only applicable to the early acute phase of LPS challenge at 12 h.
Conclusions
In the present study, we reported transcriptome changes in mammary tissues and changes in cytokine levels in the mammary gland and blood of mice after intramammary LPS challenge for 12 h. Transcriptome changes in the mammary gland indicated that LPS induced strong proinflammation responses, including granulocyte and monocyte migration and cytokine production and signaling. LPS activated both the ubiquitin-mediated and immune-mediated proteasomes and resulted in an increase in nitric oxide-mediated oxidative stress. Additionally, the expression of a few known breast cancer markers (Klk10, Ralgapa1, Net1, Klf15, and Ttc9) was either up- or downregulated. Furthermore, LPS induced downregulation of the vesicle membrane, vesicle-mediated trafficking, and metabolic processes of organic molecules in the mammary gland. Of the 32 cytokines analyzed, the levels of 24 (mainly IL-6, G-CSF, MCP-1, RANTES, MIG, MIP-1β, KC, MIP-2, IP-10, and TNFα) were increased or tended to increase, and only the level of IL-9 was decreased in blood after LPS treatment. These cytokines represent systemic responders. However, only the levels of IL-5, IL-6, IP-10, LIF, MCP-1, MIP-2, and TNFα were significantly increased (representing potential local proinflammatory cytokines), and the levels of INFγ, IL-2, IL-4, IL-10, and IL-12(p40) were decreased (representing local anti-inflammatory cytokines) in the mammary gland after LPS challenge. These observations provide potential markers and targets for further studies of the prevention and treatment of LPS-induced mastitis.
Data Sharing Statement
The RNA-seq data was submitted to the NCBI Gene Expression Omnibus (GEO) with the accession number of GSE178185 and other data to support the findings of this study are available from the corresponding author upon request.
Acknowledgments
We would like to thank Dr. Ruth Blauwiekl and the animal care staff at the University of Vermont (UVM) Small Animal Facility for help with animal work. We thank Dr. Jana Kraft for technical help in sample collection of animal blood. This project was partially supported by Wakunaga Pharmaceutical Co. Ltd., and the Hatch/Multistate Project (#NE1748) of USDA.
Disclosure
All the authors declare that they have no conflicts of interest.
References
1. Hughes K, Watson CJ. The mammary microenvironment in mastitis in humans, dairy ruminants, rabbits and rodents: a one health focus. J Mammary Gland Biol Neoplasia. 2018;23(1–2):27–41. doi:10.1007/s10911-018-9395-1
2. Lambe M, Johansson AL, Altman D, Eloranta S. Mastitis and the risk of breast cancer. Epidemiology. 2009;20(5):747–751. doi:10.1097/EDE.0b013e3181adbb1e
3. Chang CM, Lin MC, Yin WY. Risk of breast cancer in women with non-lactational mastitis. Sci Rep. 2019;9(1):15587. doi:10.1038/s41598-019-52046-3
4. Seegers H, Fourichon C, Beaudeau F. Production effects related to mastitis and mastitis economics in dairy cattle herds. Vet Res. 2003;34(5):475–491. doi:10.1051/vetres:2003027
5. Rollin E, Dhuyvetter KC, Overton MW. The cost of clinical mastitis in the first 30 days of lactation: an economic modeling tool. Prev Vet Med. 2015;122(3):257–264. doi:10.1016/j.prevetmed.2015.11.006
6. Aghamohammadi M, Haine D, Kelton DF, et al. Herd-level mastitis-associated costs on canadian dairy farms. Front Vet Sci. 2018;5:100. doi:10.3389/fvets.2018.00100
7. Halasa T, Huijps K, Østerås O, Hogeveen H. Economic effects of bovine mastitis and mastitis management: a review. Vet Q. 2007;29(1):18–31. doi:10.1080/01652176.2007.9695224
8. Houben EH, Dijkhuizen AA, Van Arendonk JA, Huirne RB. Short-and long-term production losses and repeatability of clinical mastitis in dairy cattle. J Dai Sci. 1993;76(9):2561–2578. doi:10.3168/jds.S0022-0302(93)77591-8
9. Pyörälä S, Syväjärvi J. Bovine acute mastitis part I. Clinical aspects and parameters of inflammation in mastitis caused by different pathogens. J Vet Med, Series B. 1987;34(1‐10):573–584. doi:10.1111/j.1439-0450.1987.tb00438.x
10. Ericsson Unnerstad H, Lindberg A, Persson Waller K, et al. Microbial aetiology of acute clinical mastitis and agent-specific risk factors. Vet Microbiol. 2009;137(1–2):90–97. doi:10.1016/j.vetmic.2008.12.005
11. Shangraw EM, Rodrigues RO, Witzke MC, Choudhary RK, Zhao F-Q, McFadden TB. Intramammary lipopolysaccharide infusion induces local and systemic effects on milk components in lactating bovine mammary glands. J Dairy Sci. 2020;103(8):7487–7497. doi:10.3168/jds.2019-18022
12. Siivonen J, Taponen S, Hovinen M, et al. Impact of acute clinical mastitis on cow behaviour. Appl Anim Behav Sci. 2011;132(3–4):101–106. doi:10.1016/j.applanim.2011.04.005
13. Ingman WV, Glynn DJ, Hutchinson MR. Inflammatory mediators in mastitis and lactation insufficiency. J Mammary Gland Biol Neoplasia. 2014;19(2):161–167. doi:10.1007/s10911-014-9325-9
14. Spitzer AJ, Tian Q, Choudhary RK, Zhao F-Q. Bacterial endotoxin induces oxidative stress and reduces milk protein expression and hypoxia in the mouse mammary gland. Oxid Med Cell Longev. 2020;2020:1–16. doi:10.1155/2020/3894309
15. Turk R, Piras C, Kovačić M, et al. Proteomics of inflammatory and oxidative stress response in cows with subclinical and clinical mastitis. J Proteom. 2012;75(14):4412–4428. doi:10.1016/j.jprot.2012.05.021
16. Spitzer AJ, Tian Q, Choudhary RK, Zhao FQ. Bacterial endotoxin induces oxidative stress and reduces milk protein expression and hypoxia in the mouse mammary gland. Oxid Med Cell Longev. 2020;2020:3894309.
17. Lambe M, Johansson AL, Altman D, Eloranta S. Mastitis and the risk of breast cancer. Epidemiology. 2009;20(5):747–751.
18. Kany S, Vollrath JT, Relja B. Cytokines in Inflammatory Disease. Int J Mol Sci. 2019;20:23. doi:10.3390/ijms20236008
19. Alluwaimi AM. The cytokines of bovine mammary gland: prospects for diagnosis and therapy. Res Vet Sci. 2004;77(3):211–222. doi:10.1016/j.rvsc.2004.04.006
20. Ohtsuka H, Kudo K, Mori K, et al. Acute phase response in naturally occurring coliform mastitis. J Vet Med Sci. 2001;63(6):675–678. doi:10.1292/jvms.63.675
21. Shuster DE, Kehrli ME, Stevens MG. Cytokine production during endotoxin-induced mastitis in lactating dairy cows. Am J Vet Res. 1993;54(1):80–85.
22. Nakajima Y, Mikami O, Yoshioka M, et al. Elevated levels of tumor necrosis factor-alpha (TNF-alpha) and interleukin-6 (IL-6) activities in the sera and milk of cows with naturally occurring coliform mastitis. Res Vet Sci. 1997;62(3):297–298. doi:10.1016/S0034-5288(97)90209-5
23. Notebaert S, Demon D, Vanden Berghe T, Vandenabeele P, Meyer E. Inflammatory mediators in Escherichia coli-induced mastitis in mice. Comp Immunol Microbiol Infect Dis. 2008;31(6):551–565. doi:10.1016/j.cimid.2007.10.004
24. Shao G, Tian Y, Wang H, Liu F, Xie G. Protective effects of melatonin on lipopolysaccharide-induced mastitis in mice. Int Immunopharmacol. 2015;29(2):263–268. doi:10.1016/j.intimp.2015.11.011
25. Nazemi S, Aalbaek B, Kjelgaard-Hansen M, Safayi S, Klaerke DA, Knight CH. Expression of acute phase proteins and inflammatory cytokines in mouse mammary gland following Staphylococcus aureus challenge and in response to milk accumulation. J Dairy Res. 2014;81(4):445–454. doi:10.1017/S0022029914000454
26. Trigo G, Dinis M, Franca A, et al. Leukocyte populations and cytokine expression in the mammary gland in a mouse model of Streptococcus agalactiae mastitis. J Med Microbiol. 2009;58(Pt 7):951–958. doi:10.1099/jmm.0.007385-0
27. Dobin A, Davis CA, Schlesinger F, et al. STAR: ultrafast universal RNA-seq aligner. Bioinformatics. 2013;29(1):15–21. doi:10.1093/bioinformatics/bts635
28. Mortazavi A, Williams BA, McCue K, Schaeffer L, Wold B. Mapping and quantifying mammalian transcriptomes by RNA-Seq. Nat Methods. 2008;5(7):621–628. doi:10.1038/nmeth.1226
29. Anders S, Huber W. Differential expression analysis for sequence count data. Genome Biol. 2010;11(10):R106. doi:10.1186/gb-2010-11-10-r106
30. Yu G, Wang LG, Han Y, He QY. clusterProfiler: an R package for comparing biological themes among gene clusters. OMICS. 2012;16(5):284–287. doi:10.1089/omi.2011.0118
31. Livak KJ, Schmittgen TD. Analysis of relative gene expression data using real-time quantitative PCR and the 2(-Delta Delta C(T)) Method. Methods. 2001;25(4):402–408. doi:10.1006/meth.2001.1262
32. Majumder P, Baumeister W. Proteasomes: unfoldase-assisted protein degradation machines. Bioll Chem. 2019;401(1):183–199. doi:10.1515/hsz-2019-0344
33. Murata S, Takahama Y, Kasahara M, Tanaka K. The immunoproteasome and thymoproteasome: functions, evolution and human disease. Nat Immunol. 2018;19(9):923–931. doi:10.1038/s41590-018-0186-z
34. Reis J, Guan XQ, Kisselev AF, et al. LPS-induced formation of immunoproteasomes: TNF-α and nitric oxide production are regulated by altered composition of proteasome-active sites. Cell Biochem Biophy. 2011;60(1–2):77–88. doi:10.1007/s12013-011-9182-8
35. Qureshi AA, Guan XQ, Reis JC, et al. Inhibition of nitric oxide and inflammatory cytokines in LPS-stimulated murine macrophages by resveratrol, a potent proteasome inhibitor. Lipids Health Dis. 2012;11(1):76. doi:10.1186/1476-511X-11-76
36. Jamart C, Gomes AV, Dewey S, Deldicque L. Regulation of ubiquitin-proteasome and autophagy pathways after acute LPS and epoxomicin administration in mice. BMC Musculoskeletal Disord. 2014;15(1):1–13. doi:10.1186/1471-2474-15-166
37. Turner MD, Nedjai B, Hurst T, Pennington DJ. Cytokines and chemokines: at the crossroads of cell signalling and inflammatory disease. Biochim Biophys Acta. 2014;1843(11):2563–2582.
38. de Vries JE. Immunosuppressive and anti-inflammatory properties of interleukin 10. Annals Med. 1995;27(5):537–541. doi:10.3109/07853899509002465
39. Opal SM, DePalo VA. Anti-inflammatory cytokines. Chest. 2000;117(4):1162–1172. doi:10.1378/chest.117.4.1162
40. Grohmann U, Van Snick J, Campanile F, et al. IL-9 protects mice from Gram-negative bacterial shock: suppression of TNF-alpha, IL-12, and IFN-gamma, and induction of IL-10. J Immunol. 2000;164(8):4197–4203. doi:10.4049/jimmunol.164.8.4197
41. Pilette C, Ouadrhiri Y, Van Snick J, et al. IL-9 inhibits oxidative burst and TNF-alpha release in lipopolysaccharide-stimulated human monocytes through TGF-beta. J Immunol. 2002;168(8):4103–4111. doi:10.4049/jimmunol.168.8.4103
42. Gu B, Zhu Y, Zhu W, Miao J, Deng Y, Zou S. Retinoid protects rats against neutrophil-induced oxidative stress in acute experimental mastitis. Int Immunopharmacol. 2009;9(2):223–229. doi:10.1016/j.intimp.2008.11.014
43. Xiaoyu H, Si H, Li S, et al. Induction of heme oxygenas-1 attenuates NLRP3 inflammasome activation in lipopolysaccharide-induced mastitis in mice. Int Immunopharmacol. 2017;52:185–190. doi:10.1016/j.intimp.2017.09.007
44. Okamoto T, Gohil K, Finkelstein EI, Bove P, Akaike T. Multiple contributing roles for NOS2 in LPS-induced acute airway inflammation in mice. Am J Physiol Lung Cell Mol Physiol. 2004;286(1):L198–209. doi:10.1152/ajplung.00136.2003
45. King SM. Dynein-independent functions of DYNLL1/LC8: redox state sensing and transcriptional control. Sci Signal. 2008;1(47):pe51. doi:10.1126/scisignal.147pe51
46. Sundar UM, Ugusman A, Chua HK, Latip J, Aminuddin A. Piper sarmentosum promotes endothelial nitric oxide production by reducing asymmetric dimethylarginine in tumor necrosis factor-alpha-induced human umbilical vein endothelial cells. Front Pharmacol. 2019;10:1033. doi:10.3389/fphar.2019.01033
47. Bouchard L, Blais S, Desrosiers C, Zhao X, Lacasse P. Nitric oxide production during endotoxin-induced mastitis in the cow. J Dairy Sci. 1999;82(12):2574–2581. doi:10.3168/jds.S0022-0302(99)75512-8
48. Xu T, Deng R, Li X, Zhang Y, Gao M-Q. RNA-seq analysis of different inflammatory reactions induced by lipopolysaccharide and lipoteichoic acid in bovine mammary epithelial cells. Microb Pathog. 2019;130:169–177. doi:10.1016/j.micpath.2019.03.015
49. Yousef G, Yacoub G, Polymeris M-E, Popalis C, Soosaipillai A, Diamandis E. Kallikrein gene downregulation in breast cancer. Br J Cancer. 2004;90(1):167–172. doi:10.1038/sj.bjc.6601451
50. Ehrenfeld P, Manso L, Pavicic MF, et al. Bioregulation of kallikrein-related peptidases 6, 10 and 11 by the kinin B1 receptor in breast cancer cells. Anticancer Res. 2014;34(12):6925–6938.
51. Cao X-Y, Zhang -X-X, Yang M-W, et al. Aberrant upregulation of KLK10 promotes metastasis via enhancement of EMT and FAK/SRC/ERK axis in PDAC. Biochem Biophys Res Commun. 2018;499(3):584–593. doi:10.1016/j.bbrc.2018.03.194
52. Marcotte R, Sayad A, Brown KR, et al. Functional genomic landscape of human breast cancer drivers, vulnerabilities, and resistance. Cell. 2016;164(1–2):293–309. doi:10.1016/j.cell.2015.11.062
53. Ecimovic P, Murray D, Doran P, McDonald J, Lambert D, Buggy D. Direct effect of morphine on breast cancer cell function in vitro: role of the NET1 gene. Br J Anaesth. 2011;107(6):916–923. doi:10.1093/bja/aer259
54. Yoda T, McNamara KM, Miki Y, et al. KLF15 in breast cancer: a novel tumor suppressor? Cell Oncol. 2015;38(3):227–235. doi:10.1007/s13402-015-0226-8
55. Cao S, Iyer JK, Lin V. Identification of tetratricopeptide repeat domain 9, a hormonally regulated protein. Biochem Biophys Res Commun. 2006;345(1):310–317. doi:10.1016/j.bbrc.2006.04.091
56. Neville MC, Allen JC, Watters C. The mechanisms of milk secretion. In: Neville MC, Neifert MR, editors. Lactation: Physiology, Nutrition, and Breast-Feeding. New York: Plenum; 1983:49–92.
57. Johnzon CF, Dahlberg J, Gustafson AM, et al. The effect of lipopolysaccharide-induced experimental bovine mastitis on clinical parameters, inflammatory markers, and the metabolome: a kinetic approach. Front Immunol. 2018;9:1487. doi:10.3389/fimmu.2018.01487
 © 2021 The Author(s). This work is published and licensed by Dove Medical Press Limited. The
full terms of this license are available at https://www.dovepress.com/terms
and incorporate the Creative Commons Attribution
- Non Commercial (unported, 3.0) License.
By accessing the work you hereby accept the Terms. Non-commercial uses of the work are permitted
without any further permission from Dove Medical Press Limited, provided the work is properly
attributed. For permission for commercial use of this work, please see paragraphs 4.2 and 5 of our Terms.
© 2021 The Author(s). This work is published and licensed by Dove Medical Press Limited. The
full terms of this license are available at https://www.dovepress.com/terms
and incorporate the Creative Commons Attribution
- Non Commercial (unported, 3.0) License.
By accessing the work you hereby accept the Terms. Non-commercial uses of the work are permitted
without any further permission from Dove Medical Press Limited, provided the work is properly
attributed. For permission for commercial use of this work, please see paragraphs 4.2 and 5 of our Terms.