")
Back to Journals » International Journal of General Medicine » Volume 16
Lipoprotein(a) as a Higher Residual Risk for Coronary Artery Disease in Patients with Type 2 Diabetes Mellitus than without
Authors Yu B, Hu X, Liu J, Nie Z, Ren Luo Bu C, Li G, Zhou Y, Dong H
Received 17 June 2023
Accepted for publication 31 July 2023
Published 8 August 2023 Volume 2023:16 Pages 3383—3391
DOI https://doi.org/10.2147/IJGM.S423458
Checked for plagiarism Yes
Review by Single anonymous peer review
Peer reviewer comments 2
Editor who approved publication: Dr Scott Fraser
Bingyan Yu,1,2,* Xiangming Hu,2,* Jieliang Liu,2 Zhiqiang Nie,3 Ci Ren Luo Bu,4 Guang Li,2 Yingling Zhou,2 Haojian Dong2,4
1School of Medicine, South China University of Technology, Guangzhou, People’s Republic of China; 2Department of Cardiology, Guangdong Provincial People’s Hospital (Guangdong Academy of Medical Sciences), Southern Medical University, Guangzhou, People’s Republic of China; 3Department of Cardiology, Hypertension Research Laboratory, Guangdong Provincial People’s Hospital (Guangdong Academy of Medical Sciences), Southern Medical University, Guangzhou, People’s Republic of China; 4Nyingchi People’s Hospital, Nyingchi, Tibet, People’s Republic of China
*These authors contributed equally to this work
Correspondence: Haojian Dong, Department of Cardiology, Guangdong Provincial People’s Hospital (Guangdong Academy of Medical Sciences), Southern Medical University, Guangzhou, 510080, People’s Republic of China, Tel +862083827812, Fax +862083827812, Email [email protected]
Purpose: Lipoprotein(a) (Lp[a]) is well-known as a residual risk factor for coronary artery disease (CAD). However, the different adverse effects of Lp(a) about CAD in patients with or without type 2 diabetes mellitus (T2DM) are unclear. This study aimed to investigate the Lp(a) thresholds for CAD diagnosis in T2DM and non-T2DM patients, and further compare the Lp(a) alarm values along with optimal low-density lipoprotein cholesterol (LDL-C) level.
Methods: This retrospective study consecutively enrolled patients with suspected CAD who underwent coronary angiography in Guangdong Provincial People’s Hospital between September 2014 and July 2015. A logistic regression model was established to explore the association of Lp(a) and CAD in patients. Restricted cubic splines were used to compare the threshold values of Lp(a) for CAD in patients with and without T2DM, and further in optimal LDL-C level situation.
Results: There were 1522 patients enrolled finally. After multivariable adjustment, Lp(a) was an independent risk factor for CAD in patients with T2DM (odds ratio [OR]: 1.98, 95% CI]: 1.12– 3.49, p = 0.019) and without T2DM (OR: 3.42, 95% CI: 2.36– 4.95, p < 0.001). In the whole population, the Lp(a) threshold of CAD was 155, while 145 mg/L for T2DM and 162 mg/L for non-T2DM ones, respectively. In patients with LDL-C< 1.8 mmol/l, the alarm value of Lp(a) was even lower in T2DM than non-T2DM patients (155 vs 174 mg/L).
Conclusion: Lp(a) was a significant residual risk for CAD in patients whether with T2DM or not. And Lp(a) had a lower alarm value in T2DM patients, especially in optimal LDL-C level.
Keywords: lipoprotein(a), coronary artery disease, type 2 diabetes mellitus, low-density lipoprotein cholesterol
Introduction
Despite efforts for early prevention and treatment of coronary artery disease (CAD), it remains one of the main causes of high morbidity and mortality. Type 2 Diabetes mellitus (T2DM) and hyperlipidemia are the most common risk factors for CAD.1 Studies have shown that T2DM patients have increased CAD risk, which is several times higher than that of patients without T2DM.2,3 Even prediabetes increases the incidence of CAD and heart failure.4,5 Therefore, it is of great significance to explore the predictive factors and novel biomarkers of CAD in patients with abnormal glucose metabolism.6–8 In addition, T2DM can also affect lipid metabolism through insulin resistance and reduce the level of high-density lipoprotein cholesterol (HDL-C), so that low-density lipoprotein cholesterol (LDL-C) is the dominant cholesterol type.9 Diabetic dyslipidemia, which accelerates the formation of coronary atherosclerotic plaque and plays an important role in the pathogenesis of CAD, has attracted more and more attention in recent years.10–12
Lipoprotein(a) (Lp[a]) consists of 2 components: LDL-like particle and apolipoprotein(a), connected by a disulphide bridge.13 Lp(a) increases the risk of cardiovascular disease, possibly by accelerating the process of atherosclerosis via prothrombotic/anti-fibrinolytic effects and promoting the deposition of cholesterol in the vascular intima.14–16 T2DM can cause a relative increase in LDL-C through insulin resistance.9 However, with the current widespread statin use, when LDL-C reaches optimal levels, the concentration of Lp(a) becomes a residual cardiovascular risk.17–19 Studies have shown that Lp(a) distribution is inconsistent in T2DM and non-T2DM patients,20–23 which may be one of the reasons why T2DM is prone to CAD, but no studies have investigated the effect of Lp(a) levels on CAD in T2DM and non-T2DM groups, especially under optimal LDL-C levels.
Serum lipid dyslipidemia are commonly seen in patients with T2DM. Elevated Lp(a) as residual risk increases the risks of CAD and cardiovascular events.24,25 The purpose of this study was to investigate the threshold value of Lp(a) for the occurrence of CAD in individuals with and without T2DM and effects of Lp(a) on CAD at optimal LDL-C levels.
Materials and Methods
Study Population
A retrospective analysis was performed on 1628 patients with suspected CAD admitted to Guangdong Provincial People’s Hospital between September 2014 and July 2015. Inclusion criteria are as follows: (1) Patients with highly suspected CAD; (2) Patients who underwent coronary angiography. The exclusion criteria are as follows: (1) Patients without measurement of Lp(a); (2) Patients missing information about coronary angiography. Eighty-two patients without Lp(a) measurements and 24 patients with missing angiographic information were excluded. Finally, a total of 1522 patients were included in this study. Clinical, laboratory, and coronary angiography data were collected. This study was approved by the Ethics Committee of Guangdong Provincial People’s Hospital and complied with the Declaration of Helsinki. Oral informed consent was obtained from all participants for this study.
Definition
Hypertension was diagnosed as a previous hypertension history or systolic blood pressure ≥ 140 mmHg and/or diastolic blood pressure ≥ 90 mmHg.26 According to the American Diabetes Association criteria, T2DM was defined as exhibiting a previous T2DM history or an FBG ≥7.0 mmol/L and/or random plasma glucose ≥11.1 mmol/L and/or an HbA1c ≥6.5%.27 The diagnostic criteria for CAD were left coronary artery stenosis ≥50% or major branch vessels stenosis ≥70%.28 History of chronic kidney disease and stroke were self-reported.
Laboratory Analysis
Blood glucose, HDL-C, LDL-C, total cholesterol (TC), and triglyceride (TG) levels were detected using AU5800 spectrophotometer (Beckman Coulter, USA) via colorimetry or immunoturbidimetry. Serum Lp(a) concentration was measured using Beckman Coulter AU automatic biochemical analyzer with a Lp(a) detection kit, using the immunoturbidimetric method.
Statistical Analysis
For the description of baseline data, continuous variables are expressed as mean ± standard deviation and categorical variables are expressed as percentages. Student’s t-test and chi-squared test were used to compare the differences between the two groups for numerical and categorical variables, respectively. Logistic regression analysis was used to evaluate the relationship between Lp(a) level and CAD by odds ratio (OR) in various populations with a 95% confidence interval (CI). Since the distribution of Lp(a) is skewed, we log-transform Lp(a) into Lg Lp(a) for further analysis. Based on the results of logistic regression analysis, restricted cubic spline curves with four knots were used to flexibly model and visualize the relation of Lg Lp(a) and CAD risk in a continuous range, and to identify the Lp(a) concentration associated with the lowest CAD risk. The solid red line represents multivariable adjusted OR, with the dashed red line showing the 95% confidence interval derived from restricted cubic spline. The reference point means the value of Lg Lp(a) corresponding to solid red lines at OR = 1. The threshold value of Lp(a) concentration associated with the occurrence of CAD was the concentration at the reference point of the curve. p<0.05 was considered statistically significant. The analyses were performed with Stata 15.0 (StataCorp LLC, College Station, TX, USA), R version 3.4.3 (R Project for Statistical Computing, Vienna, Austria), and EmpowerStats (X&Y Solutions Inc., Boston, MA, USA). We calculated the required sample size (1:1) for detecting a difference in the incidence of CAD between the two groups at α = 0.05 and 90% power, and the result was 140 cases in each group.
Results
Baseline Information
A total of 1522 patients were retrospectively included in this study (Figure 1). Based on the presence or absence of CAD, patients were divided into CAD and non-CAD groups. The baseline information of the two groups is shown in Table 1. Older age, male gender, smoking, hypertension, T2DM, chronic kidney disease, history of stroke, high serum creatinine, high hemoglobin A1C, high glucose, high Lp(a), low TC, low HDL-C, and the use of β-blockers and statins were more frequently seen in the CAD group compared to non-CAD group. Alcohol consumption, TG, LDL-C, and the use of angiotensin-converting enzyme inhibitor (ACEIs) or angiotensin II receptor blockers (ARBs), calcium channel blockers (CCBs), and diuretics did not differ between the two groups. For the comparison between the non-T2DM and T2DM group, the T2DM group tended to be older, have a history of diuretic use, have higher levels of serum creatinine, glycated hemoglobin, blood glucose, and TG, and slightly lower smoking rates and levels of Lp(a), TC, LDL -C and HDL-C (Table S1). Meanwhile, T2DM patients were often accompanied by hypertension, CAD and chronic kidney disease.
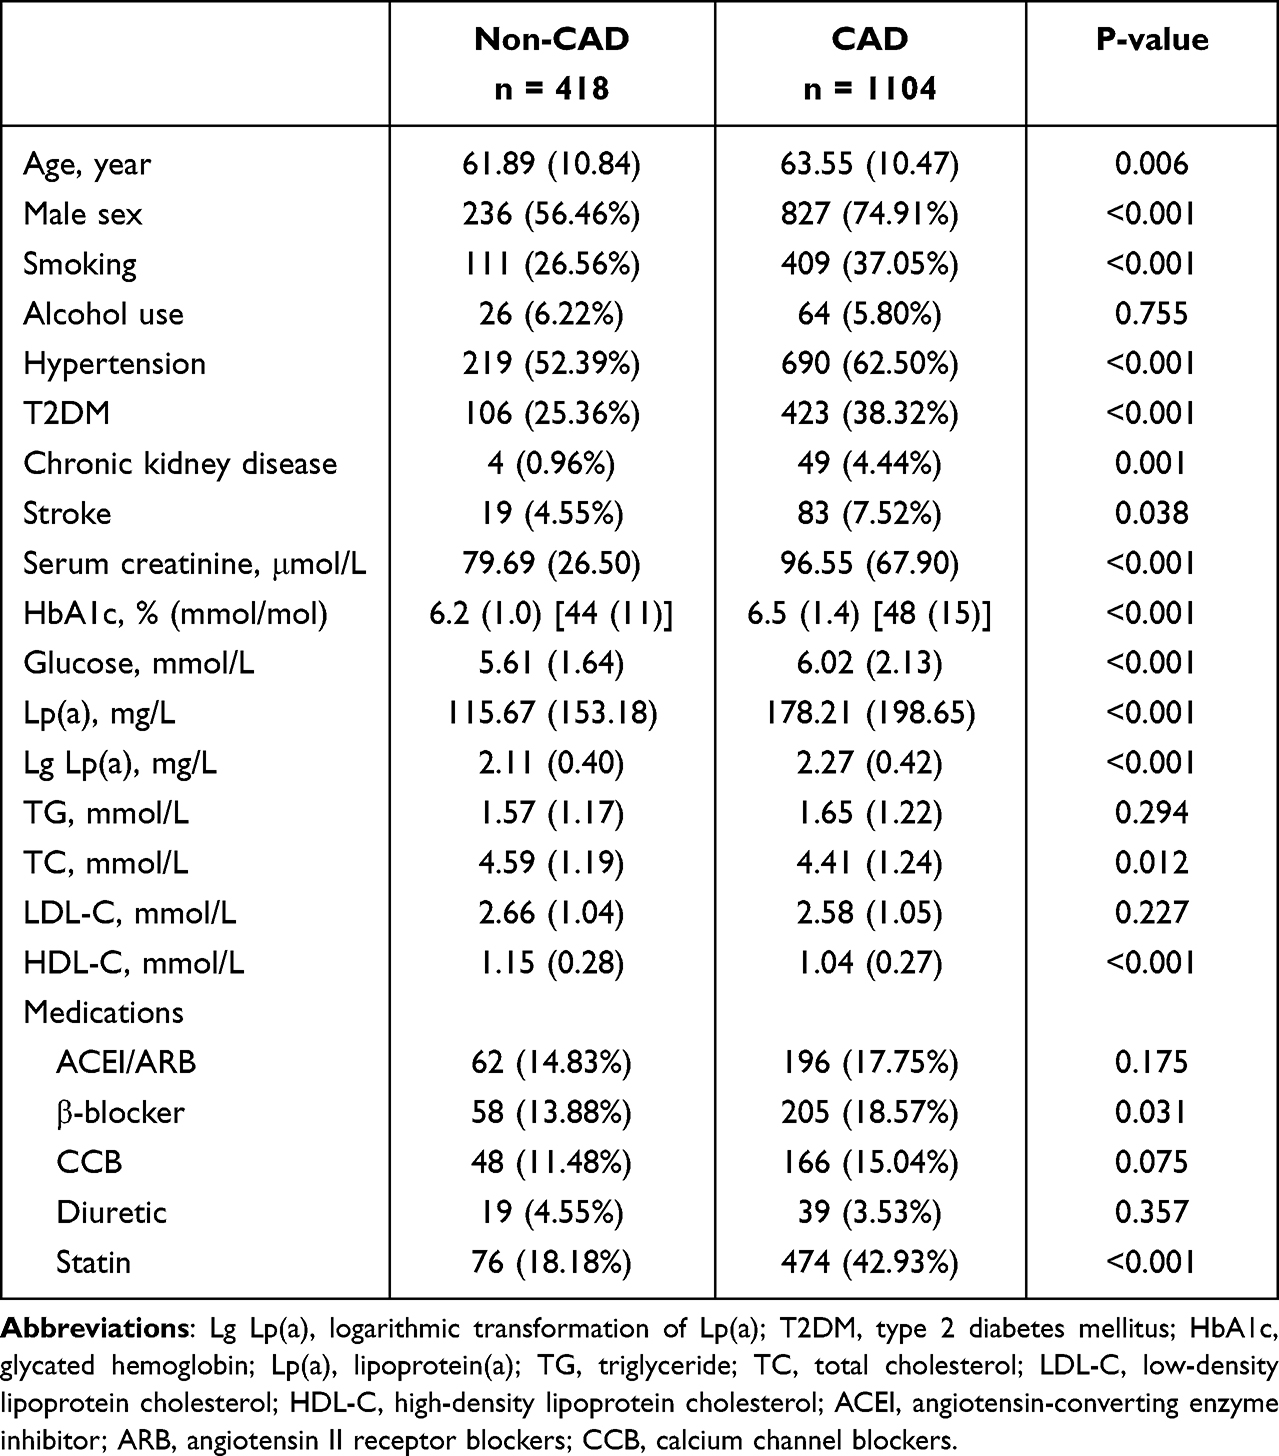 |
Table 1 Baseline Information |
 |
Figure 1 Study flowchart. |
Lp(a) and CAD Risk in Patients Without and with T2DM
In the unadjusted model, Lp(a) was significantly associated with CAD (OR: 2.55, 95% CI: 1.92–3.37, p < 0.05) (Table 2). After adjusting for age, sex, smoking, hypertension, chronic kidney disease, stroke, serum creatinine, TG, TC and HDL-C, increased Lp(a) levels remained an independent risk factor for CAD in all (OR: 2.72, 95% CI: 2.01–3.68, p < 0.001), non-T2DM (OR: 3.42, 95% CI: 2.36–4.95, p < 0.001), and T2DM (OR: 1.98, 95% CI: 1.12–3.49, p = 0.019) patients.
 |
Table 2 Odds Ratios (ORs [95% CIs]) of Lp(a) and CAD |
Association of Lp(a) with CAD in Patients with Different LDL-C Levels
At optimal LDL-C levels, the association between Lp(a) and CAD was significant in individuals without T2DM (OR:2.82, 95% CI: 1.09–7.26, p = 0.032). According to the dose-response relationship between Lp(a) and CAD, a high level of Lp(a) was positively correlated with CAD occurrence, which was present in the general population as well as non-T2DM and T2DM patients (Figures 2–4). The lowest Lp(a) levels associated with the occurrence of CAD were 155, 145, and 162 mg/L in the general, T2DM, and non-T2DM populations, respectively (Figures 2–4). The Lp(a) threshold value for CAD was higher among patients with optimal LDL-C level than those with at-risk LDL-C levels (166 vs 123 mg/L). Compared to the non-T2DM group, the Lp(a) threshold value for CAD was lower in the T2DM group, regardless of whether the LDL-C levels were optimal (155 vs 174 mg/L) or not (120 vs 129 mg/L).
 |
Figure 2 Association of Lp(a) with CAD in all patients and subgroups of different LDL-C level. Odds ratios and 95% CIs derived from restricted cubic spline regression, with knots placed at the 5th, 35th, 65th, and 95th percentiles of the distribution of Lg Lp(a). The reference point for Lg Lp(a) is located at OR=1. Ref is an abbreviation for reference. The lowest 2.5% and highest 2.5% of participants are not shown in the figures for small sample sizes. |
 |
Figure 3 Association of Lp(a) with CAD in Non-T2DM patients and subgroups of different LDL-C level. Odds ratios and 95% CIs derived from restricted cubic spline regression, with knots placed at the 5th, 35th, 65th, and 95th percentiles of the distribution of Lg Lp(a). The reference point for Lg Lp(a) is located at OR=1. Ref is an abbreviation for reference. The lowest 2.5% and highest 2.5% of participants are not shown in the figures for small sample sizes. |
 |
Figure 4 Association of Lp(a) with CAD in T2DM patient and subgroups of different LDL-C level. Odds ratios and 95% CIs derived from restricted cubic spline regression, with knots placed at the 5th, 35th, 65th, and 95th percentiles of the distribution of Lg Lp(a). The reference point for Lg Lp(a) is located at OR=1. Ref is an abbreviation for reference. The lowest 2.5% and highest 2.5% of participants are not shown in the figures for small sample sizes. |
Discussion
There were several important findings in this study. First, in high-risk population, high Lp(a) level was positively associated with the CAD risk. Second, the threshold value of Lp(a) for CAD varied between different populations, with a relatively low threshold in patients with T2DM. Third, T2DM population has a higher residual risk of CAD and a lower alert value of Lp(a) when LDL-C reaches optimal levels.
Lp(a) and T2DM, as risk factors for CAD, have pro-atherosclerotic effects.29 Lp(a) can not only be used for risk stratification of high-risk groups of cardiovascular factors, but also predict the severity of existing atherosclerotic disease and future cardiovascular events.24,25,30,31 Studies have clarified the relationship between Lp(a) and CAD. Elevated Lp(a) levels increase the risk of CAD, and this relationship persists even in people with T2DM.24,25,32,33 The results of a study conducted in a coronary care unit showed that after adjusting for other factors, elevated Lp(a) levels in patients with T2DM increased the risk of CAD by 2.4 times.34 This is consistent with the findings of the present study that elevated Lp(a) was an independent risk factor for CAD in patients with or without T2DM. People with T2DM have a 2–4 fold increased risk of cardiovascular events compared to people without T2DM, largely due to the aggravation of atherosclerosis caused by dyslipidemia in T2DM.2,3 Diabetic dyslipidemia is featured by elevated TG level, reduced HDL-C level and relatively increased LDL-C through insulin resistance,10 which had a great influence on the occurrence of cardiovascular disease. Furthermore, T2DM patients with high Lp(a) have poor cardiovascular outcomes.24 However, previous studies have inconsistent results on the relationship between Lp(a) levels and T2DM.20–22 Fu et al found that the distribution of Lp(a) differed in patients with T2DM and without T2DM, and Lp(a) has a lower level in patients with T2DM.35 A possible explanation for these findings is that high blood insulin level caused by insulin resistance affects the liver synthesis of Lp(a) at the level of gene transcription, thereby reducing the concentration of Lp(a).36,37 Nevertheless, Wang et al found the opposite results in the Chinese population, with higher levels of Lp(a) in individuals with T2DM than in individuals with non-T2DM.38 Even some studies have not found a correlation between Lp(a) and T2DM.39 This difference may be caused by different measurement methods of Lp(a), as well as the impact of gender differences on overall Lp(a) results (40). In a population survey,40 the relationship between Lp(a) and T2DM differed between genders, with an inverse relationship noted in men, but not women; therefore, women with T2DM had higher Lp(a) levels than men, which might be due to the difference in apolipoprotein(a) synthesis.41,42 Until now, there are few studies focusing on the effect of Lp(a) level on CAD in patients with T2DM, especially for those at high-risk situation. Our study showed that the Lp(a) level of patients with T2DM was lower than that of patients without T2DM, but the prevalence of CAD is still higher than that of patients without T2DM.
The 2019 ESC lipid management guidelines recommend that Lp(a) should be measured once in life to identify CAD risk.43 Chen et al found that serum Lp(a) levels increased the risk of coronary stenosis and the best predictive threshold for coronary stenosis was 0.185g/L.44 However, what level of Lp(a) will significantly increase the risk of CAD in patients with T2DM has not yet been studied. We explored the Lp(a) levels associated with the occurrence of CAD in different population and found that the threshold value of Lp(a) for the occurrence of CAD was lower in patients with T2DM than in patients without T2DM. In other words, at the same Lp(a) level, patients with T2DM have a higher risk of CAD. Understanding the difference in Lp(a) levels associated with the occurrence of CAD in patients with T2DM and without T2DM can provide another insight into the harm of Lp(a). Patients with T2DM should be screened for the level of Lp(a) and pay more attention to it to determine whether early lipid-lowering treatment is needed.
In addition, it was widely accepted that LDL-C plays a leading role in the process of CAD. Currently, guidelines recommend LDL-C as the first-line lipid-lowering target, but cardiovascular risk still remains when LDL-C reaches the target level, which can be explained by Lp(a).16,18,45 Our study also explored the effect of different levels of LDL-C on the threshold value of Lp(a) for the occurrence of CAD. We found that at different LDL-C levels, the threshold values of Lp(a) for CAD were different. Among patients with LDL-C at the target level, the CAD risk was increased if Lp(a) exceeds 166 mg/L, whereas in patients who have not achieved the target level, Lp(a) level > 100 mg/L increased CAD risk. Therefore, LDL-C level can influence the effect of Lp(a) in CAD. Not only that, but coexisting diabetic states can also influence this effect. Compared with the non-T2DM population, the T2DM population had a lower Lp(a) threshold value for CAD and showed a higher residual cardiovascular risk when LDL-C reached the optimal level. Diabetics not only need to achieve optimal LDL-C targets, but also need stricter Lp(a) management to reduce the risk of CAD. Therefore, individuals with different LDL-C levels have different requirements for Lp(a) control. When LDL-C does not reach the target level, we should pay more attention to lowering LDL-C, but when LDL-C reaches the target level, it is also necessary to manage the residual risk due to Lp(a). And the co-exist T2DM status also need to be considered.
This study also had certain limitations. First, this was a retrospective study; therefore, no causal conclusions can be drawn. Second, some patients may have received lipid-lowering therapy before admission, which may have an impact on Lp(a) levels. Finally, the once measurement of Lp(a) could not represent the exposure before suffering CAD, although the level of Lp(a) was highly constant in the whole life.
Conclusions
Lp(a) have different threshold value for the occurrence of CAD in populations with and without T2DM. The threshold value of Lp(a) for the risk of CAD in T2DM patients is the lowest, especially when LDL-C reaches target level. In individuals with T2DM, Lp(a) levels need to be more tightly controlled to reduce residual cardiovascular risk. This study has clinical guiding significance for the management of blood lipids disorder in patients with T2DM.
Data Sharing Statement
The data used and/or analyzed during the current study are available from the corresponding author, Haojian Dong, upon reasonable request by emailing [email protected].
Acknowledgments
Bingyan Yu and Xiangming Hu are co-first authors for this work. We thank LetPub for its linguistic assistance during the preparation of this manuscript.
Funding
This work was supported by the Science and technology program of Tibet (XZ202201ZY0051G), the Guangzhou Municipal Science and Technology Grant (202002030112) and the Department of Science and Technology of Guangdong Province (2020B1111170011).
Disclosure
The authors have declared that they have no competing or potential conflicts of interest for this work.
References
1. Piepoli MF, Hoes AW, Agewall S, et al. 2016 European Guidelines on cardiovascular disease prevention in clinical practice: the sixth joint task force of the European Society of Cardiology and other societies on cardiovascular disease prevention in clinical practice (constituted by representatives of 10 societies and by invited experts)Developed with the special contribution of the European Association for Cardiovascular Prevention & Rehabilitation (EACPR). Eur Heart J. 2016;37(29):2315–2381. doi:10.1093/eurheartj/ehw106
2. Almdal T, Scharling H, Jensen JS, Vestergaard H. The independent effect of type 2 diabetes mellitus on ischemic heart disease, stroke, and death: a population-based study of 13,000 men and women with 20 years of follow-up. Arch Intern Med. 2004;164(13):1422–1426. doi:10.1001/archinte.164.13.1422
3. Beckman JA, Creager MA, Libby P. Diabetes and atherosclerosis: epidemiology, pathophysiology, and management. JAMA. 2002;287(19):2570–2581. doi:10.1001/jama.287.19.2570
4. Cai X, Zhang Y, Li M, et al. Association between prediabetes and risk of all cause mortality and cardiovascular disease: updated meta-analysis. BMJ. 2020;370:m2297. doi:10.1136/bmj.m2297
5. Cai X, Liu X, Sun L, et al. Prediabetes and the risk of heart failure: a meta-analysis. Diabetes Obes Metab. 2021;23(8):1746–1753. doi:10.1111/dom.14388
6. Ma T, Huang X, Zheng H, et al. SFRP2 improves mitochondrial dynamics and mitochondrial biogenesis, oxidative stress, and apoptosis in diabetic cardiomyopathy. Oxid Med Cell Longev. 2021;2021:9265016. doi:10.1155/2021/9265016
7. Wu J, Zheng H, Liu X, et al. Prognostic value of secreted frizzled-related protein 5 in heart failure patients with and without type 2 diabetes mellitus. Circ Heart Fail. 2020;13(9):e007054. doi:10.1161/CIRCHEARTFAILURE.120.007054
8. Mai L, Wen W, Qiu M, et al. Association between prediabetes and adverse outcomes in heart failure. Diabetes Obes Metab. 2021;23(11):2476–2483. doi:10.1111/dom.14490
9. Krauss RM. Lipids and lipoproteins in patients with type 2 diabetes. Diabetes Care. 2004;27(6):1496–1504. doi:10.2337/diacare.27.6.1496
10. Hirano T. Pathophysiology of diabetic dyslipidemia. J Atheroscler Thromb. 2018;25(9):771–782. doi:10.5551/jat.RV17023
11. Thambiah SC, Lai LC. Diabetic dyslipidaemia. Pract Lab Med. 2021;26:e00248. doi:10.1016/j.plabm.2021.e00248
12. Taskinen MR. Diabetic dyslipidaemia: from basic research to clinical practice. Diabetologia. 2003;46(6):733–749. doi:10.1007/s00125-003-1111-y
13. Tsimikas S. A test in context: lipoprotein(a): diagnosis, prognosis, controversies, and emerging therapies. J Am Coll Cardiol. 2017;69(6):692–711. doi:10.1016/j.jacc.2016.11.042
14. Mehta A, Virani SS, Ayers CR, et al. Lipoprotein(a) and family history predict cardiovascular disease risk. J Am Coll Cardiol. 2020;76(7):781–793. doi:10.1016/j.jacc.2020.06.040
15. Nordestgaard BG, Chapman MJ, Ray K, et al. Lipoprotein(a) as a cardiovascular risk factor: current status. Eur Heart J. 2010;31(23):2844–2853. doi:10.1093/eurheartj/ehq386
16. Jang AY, Han SH, Sohn IS, Oh PC, Koh KK. Lipoprotein(a) and cardiovascular diseases- revisited. Circ J. 2020;84(6):867–874. doi:10.1253/circj.CJ-20-0051
17. Shah NP, Pajidipati NJ, McGarrah RW, et al. Lipoprotein(a): an update on a marker of residual risk and associated clinical manifestations. Am J Cardiol. 2020;126:94–102. doi:10.1016/j.amjcard.2020.03.043
18. Hu X, Yang X, Li X, Luo D, Zhou Y, Dong H. Lipoprotein(a) as a residual risk factor for atherosclerotic renal artery stenosis in hypertensive patients: a hospital-based cross-sectional study. Lipids Health Dis. 2020;19(1):173. doi:10.1186/s12944-020-01272-0
19. Kelly E, Hemphill L. Lipoprotein(a): a lipoprotein whose time has come. Curr Treat Options Cardiovasc Med. 2017;19(7):48. doi:10.1007/s11936-017-0549-z
20. Ye Z, Haycock PC, Gurdasani D, et al. The association between circulating lipoprotein(a) and type 2 diabetes: is it causal? Diabetes. 2014;63(1):332–342. doi:10.2337/db13-1144
21. Paige E, Masconi KL, Tsimikas S, et al. Lipoprotein(a) and incident type-2 diabetes: results from the prospective Bruneck study and a meta-analysis of published literature. Cardiovasc Diabetol. 2017;16(1):38. doi:10.1186/s12933-017-0520-z
22. Gudbjartsson DF, Thorgeirsson G, Sulem P, et al. Lipoprotein(a) concentration and risks of cardiovascular disease and diabetes. J Am Coll Cardiol. 2019;74(24):2982–2994. doi:10.1016/j.jacc.2019.10.019
23. Habib SS, Aslam M. Lipids and lipoprotein(a) concentrations in Pakistani patients with type 2 diabetes mellitus. Diabetes Obes Metab. 2004;6(5):338–343. doi:10.1111/j.1462-8902.2004.00352.x
24. Zhang HW, Zhao X, Guo YL, et al. Elevated lipoprotein(a) levels are associated with the presence and severity of coronary artery disease in patients with type 2 diabetes mellitus. Nutr Metab Cardiovasc Dis. 2018;28(10):980–986. doi:10.1016/j.numecd.2018.05.010
25. Waldeyer C, Makarova N, Zeller T, et al. Lipoprotein(a) and the risk of cardiovascular disease in the European population: results from the BiomarCaRE consortium. Eur Heart J. 2017;38(32):2490–2498. doi:10.1093/eurheartj/ehx166
26. Williams B, Mancia G, Spiering W, et al. 2018 ESC/ESH guidelines for the management of arterial hypertension. Eur Heart J. 2018;39(33):3021–3104. doi:10.1093/eurheartj/ehy339
27. American Diabetes Association Professional Practice Committee. 2. Classification and diagnosis of diabetes: standards of medical care in diabetes-2022. Diabetes Care. 2022;45(Suppl 1):S17–S38. doi:10.2337/dc22-S002
28. Patel MR, Calhoon JH, Dehmer GJ, et al. ACC/AATS/AHA/ASE/ASNC/SCAI/SCCT/STS 2016 appropriate use criteria for coronary revascularization in patients with acute coronary syndromes: a report of the American College of Cardiology Appropriate Use Criteria Task Force, American Association for Thoracic Surgery, American Heart Association, American Society of Echocardiography, American Society of Nuclear Cardiology, Society for Cardiovascular Angiography and Interventions, Society of Cardiovascular Computed Tomography, and the Society of Thoracic Surgeons. J Nucl Cardiol. 2017;24(2):439–463. doi:10.1007/s12350-017-0780-8
29. Stamler J, Vaccaro O, Neaton JD, Wentworth D. Diabetes, other risk factors, and 12-yr cardiovascular mortality for men screened in the multiple risk factor intervention trial. Diabetes Care. 1993;16(2):434–444. doi:10.2337/diacare.16.2.434
30. Zhang Y, Jin JL, Cao YX, et al. Lipoprotein(a) predicts recurrent worse outcomes in type 2 diabetes mellitus patients with prior cardiovascular events: a prospective, observational cohort study. Cardiovasc Diabetol. 2020;19(1):111. doi:10.1186/s12933-020-01083-8
31. Jin JL, Cao YX, Zhang HW, et al. Lipoprotein(a) and cardiovascular outcomes in patients with coronary artery disease and prediabetes or diabetes. Diabetes Care. 2019;42(7):1312–1318. doi:10.2337/dc19-0274
32. Sawabe M, Tanaka N, Nakahara K, et al. High lipoprotein(a) level promotes both coronary atherosclerosis and myocardial infarction: a path analysis using a large number of autopsy cases. Heart. 2009;95(24):1997–2002. doi:10.1136/hrt.2008.160879
33. Peela JR, Latiwesh OB, Elshaari F, et al. Investigating the atherogenic risk of lipoprotein(a) in type 2 diabetic patients. Cureus. 2018;10(7):e3030. doi:10.7759/cureus.3030
34. Lan NSR, Chan DC, Pang J, et al. Lipoprotein(a) in patients with type 2 diabetes and premature coronary artery disease in the coronary care unit. Heart Lung Circ. 2021;30(5):734–740. doi:10.1016/j.hlc.2020.09.932
35. Fu Q, Hu L, Xu Y, Yi Y, Jiang L. High lipoprotein(a) concentrations are associated with lower type 2 diabetes risk in the Chinese Han population: a large retrospective cohort study. Lipids Health Dis. 2021;20(1):76. doi:10.1186/s12944-021-01504-x
36. Rainwater DL, Haffner SM. Insulin and 2-hour glucose levels are inversely related to Lp(a) concentrations controlled for LPA genotype. Arterioscler Thromb Vasc Biol. 1998;18(8):1335–1341. doi:10.1161/01.ATV.18.8.1335
37. Neele T2DM, de Wit EC, Princen HM. Insulin suppresses apolipoprotein(a) synthesis by primary cultures of cynomolgus monkey hepatocytes. Diabetologia. 1999;42(1):41–44. doi:10.1007/s001250051110
38. Wang C, Niu DM, Hu J, et al. Elevated serum β2-glycoprotein-I-lipoprotein(a) complexes levels are associated with the presence and complications in type 2 diabetes mellitus. Diabetes Res Clin Pract. 2013;100(2):250–256. doi:10.1016/j.diabres.2013.03.002
39. Kamstrup PR, Nordestgaard BG. Lipoprotein(a) concentrations, isoform size, and risk of type 2 diabetes: a Mendelian randomisation study. Lancet Diabetes Endocrinol. 2013;1(3):220–227. doi:10.1016/S2213-8587(13)70064-0
40. Markus MRP, Ittermann T, Schipf S, et al. Association of sex-specific differences in lipoprotein(a) concentrations with cardiovascular mortality in individuals with type 2 diabetes mellitus. Cardiovasc Diabetol. 2021;20(1):168. doi:10.1186/s12933-021-01363-x
41. Bennion LJ, Drobny E, Knowler WC, et al. Sex differences in the size of bile acid pools. Metabolism. 1978;27(8):961–969. doi:10.1016/0026-0495(78)90140-3
42. Pirillo A, Catapano AL. Statins increase Lp(a) plasma level: is this clinically relevant? Eur Heart J. 2020;41(24):2285–2287. doi:10.1093/eurheartj/ehz505
43. Mach F, Baigent C, Catapano AL, et al. 2019 ESC/EAS guidelines for the management of dyslipidaemias: lipid modification to reduce cardiovascular risk. Eur Heart J. 2020;41(1):111–188. doi:10.1093/eurheartj/ehz455
44. Chen S, Luan H, He J, et al. Serum concentrations of small dense low-density lipoprotein cholesterol and lipoprotein(a) are related to coronary arteriostenosis in Takayasu arteritis. J Clin Lab Anal. 2021;35(12):e23966. doi:10.1002/jcla.23966
45. Khera AV, Everett BM, Caulfield MP, et al. Lipoprotein(a) concentrations, rosuvastatin therapy, and residual vascular risk: an analysis from the Jupiter trial (justification for the use of statins in prevention: an intervention trial evaluating rosuvastatin). Circulation. 2014;129(6):635–642. doi:10.1161/CIRCULATIONAHA.113.004406
 © 2023 The Author(s). This work is published and licensed by Dove Medical Press Limited. The full terms of this license are available at https://www.dovepress.com/terms.php and incorporate the Creative Commons Attribution - Non Commercial (unported, v3.0) License.
By accessing the work you hereby accept the Terms. Non-commercial uses of the work are permitted without any further permission from Dove Medical Press Limited, provided the work is properly attributed. For permission for commercial use of this work, please see paragraphs 4.2 and 5 of our Terms.
© 2023 The Author(s). This work is published and licensed by Dove Medical Press Limited. The full terms of this license are available at https://www.dovepress.com/terms.php and incorporate the Creative Commons Attribution - Non Commercial (unported, v3.0) License.
By accessing the work you hereby accept the Terms. Non-commercial uses of the work are permitted without any further permission from Dove Medical Press Limited, provided the work is properly attributed. For permission for commercial use of this work, please see paragraphs 4.2 and 5 of our Terms.