Back to Journals » Journal of Inflammation Research » Volume 17
Lipidomics Analysis Deepen Understanding the Molecular Mechanisms in a Gouty Model Induced by Combination of MSU Crystals Injection and High-Fat Diet Feeding and the Intervention Mechanisms of Allopurinol
Authors Li D, Shi W ![]() , Hu C
, Hu C ![]() , Wen C, Huang L, Wang Q
, Wen C, Huang L, Wang Q ![]()
Received 28 October 2023
Accepted for publication 30 January 2024
Published 13 February 2024 Volume 2024:17 Pages 1003—1018
DOI https://doi.org/10.2147/JIR.S443358
Checked for plagiarism Yes
Review by Single anonymous peer review
Peer reviewer comments 2
Editor who approved publication: Dr Tara Strutt
Dianming Li,1,* Weiman Shi,1,* Changfeng Hu,1,2 Chengping Wen,1,2 Lin Huang,1,2 Qiao Wang1,2
1College of Basic Medical Sciences, Zhejiang Chinese Medical University, Hangzhou City, People’s Republic of China; 2Key Laboratory of Chinese Medicine Rheumatology of Zhejiang Province, Hangzhou City, People’s Republic of China
*These authors contributed equally to this work
Correspondence: Lin Huang; Qiao Wang, College of Basic Medical Sciences, Key Laboratory of Chinese medicine rheumatology of Zhejiang Province, Zhejiang Chinese Medical University, Hangzhou City, Zhejiang Province, People’s Republic of China, Tel +86 571-86613587, Email [email protected]; [email protected]
Background: Gouty arthritis (GA) is a common inflammatory disease caused by deposition of monosodium urate (MSU) crystals in diarthrodial joints. GA attacks commonly involved in joint with red, swollen, heat and pain, and often happened in unilateral foot-first metatarsophalangeal. Accumulated studies have proved that lipids play critical roles in biological processes and lipids biomarkers can substitute for the diagnosis of various diseases.
Methods: Herein, shotgun lipidomics was used to quantitatively analyze serum lipidomes of a gouty model which was induced by injecting MSU crystals and feeding high-fat diet with/without treatment with allopurinol. Meanwhile, ELISA kit was used to detect mouse serum levels of inflammatory cytokines (eg, tumor necrosis factor-α, interleukin 1 beta) and HE staining was used to observe the infiltration of inflammatory cells in the foot pad.
Results: A total of 9 types of serum lipids were detected in lipidomics by shotguns, and the result of NMDS’ analysis demonstrated significant differences in lipids profiles between the control and model group. It is worth noting that lipid abnormality in GA (such as Ceramide (Cer), sphingomyelin (SM), 4-hydroxyalkenals (HNE), phosphatidylinositol (PI), ethanolamine glycerophospholipid (PE), etc.) is related with phospholipid and energy metabolism, and allopurinol treatment could correct the aberrant metabolism of lipid to some extent.
Conclusion: Our results indicated that various aberrant lipid metabolisms were present in the established gouty model, and allopurinol treatment could relief this aberrant metabolism of lipids to some degree.
Keywords: gouty arthritis, lipidomics, autoimmune reaction, glycerophospholipid metabolism, sphingolipid metabolism, inflammation
Introduction
Gout arthritis (GA) is a common and complex inflammatory disease and the initial clinical manifestation of GA is usually characterized by acute episodes of monoarticular pain.1,2 Gout affects a higher percentage of people in western countries (ranging from 2.7% to 6.7%) compared to China (~1.1%)3 and the morbidity continues to grow. The incidence of gout is linked to hyperuricemia and obesity with risk factors including sex, regular alcohol consumption, high purine intake, and external injury.4 The pathogenesis of GA is characterized by purine metabolism and/or uric acid excretion disorders leading to increased blood uric acid, and MSU crystals precipitation and deposition in joints or other tissues.5 However, the diagnosis and pathogenesis of gout are still not entirely foolproof and have room for improvement.
Accumulated studies have proved that lipid biomarkers can substitute for the diagnosis of various diseases. Lipidomic techniques have identified ceramides and sphingolipids as potential mediators of cellular dysfunction in diabetes, while phosphatidylinositol species like PI (16:0–16:1) and PI (18:0–20:4) have been identified as potential biomarkers for breast cancer.6,7 Other studies have also shown that lipid metabolism can induce the production of autoantibodies and increase the expression of various inflammatory factors, which can accelerate the progression of lupus nephritis.8 Scientists and clinicians are now aware of the correlation between lipid metabolism disorder and the onset of gout.9,10 In a study involving gout patients who received allopurinol treatment for 6 years, significant changes were noted in lipid and lipoprotein values in male gout patients compared to control populations. The gout group demonstrated the most significant changes, particularly in triglycerides, APOB, HDL, and HDL-PL.11 Gout patients with aberrant lipid metabolism and vascular disease are likely associated with hyperuricemia, which can cause endothelial cell damage and vascular smooth muscle cell proliferation.12 A Mendelian randomization study suggested that there is a bidirectional causal effect between HDL, serum urate, and gout.13 However, there is limited research on this topic that provides in-depth understanding of these relationships.
In this study, we aimed to uncover the relationship between gout and lipids in a gouty model. C57/BL6 mice was injected with MSU crystals and were fed with high-fat diet to induce the establishment of the compound gouty model.14,15 Targeted lipid analysis of mouse serum samples was performed by using multi-dimensional mass spectrometry-based shotgun lipidomics (MDMS-SL) technology, including triacylglycerol (labeled) and some non-free fatty acids, all classes of phospholipids, various classes of sphingolipids, HNE and other lipids. The ELISA kits were used to measure the levels of cytokines TNF-α and IL-1β, in mouse serum samples. Histopathological analysis and infiltration of inflammatory cells in the pads of different groups of mice were also performed to assess the severity of gout. Our results indicated that shotgun lipidomics revealed a significant lipid disorder in the serum lipid of the GA model. Treatment of allopurinol could relieve this aberrant metabolism on some lipids. These findings provide new insights into the pathogenesis of gout and hyperlipidemia and suggest potential therapeutic targets for their prevention and treatment.
Materials and Methods
Materials
Allopurinol tablets (Lot #:H20033683) was obtained from The PLACE Pharmaceutical Jiangsu Co., LTD, China. The synthetic phospholipids and other lipids used in the study, including triheptadecenoylglycerol (T17:1 TAG), 1.2-dimyristoleoyl-sn-glycero-3- phosphocholine (di14:1 PC), 1.2-dipa- lmitoleoyl-sn-glycero-3-phosphoethanolamine (di16:1 PE), 4-hydroxy −9, 9.9-d3 −2(E)- nonenal (4-HNE-d3), N-heptadecanoyl ceramide (N17:0 Cer), N-lauroyl-D-erythro- sphinganylphosphorylcholine (N12:0 SM), Palmityl-1,2,3, 4–13C4-L-carnitine hydrochloride (13C4 Car) and 7,7,8,8-d4-Palmitic Acid (d4 FFA) (100 μg in 200 μL of methyl acetate), used as internal standards were bought from Avanti Polar Lipid, Inc. (Alabaster, AL, USA), Matreya, Inc. (Pleasant Gap, State College, PA, USA), or Cayman Chemical Co. (Ann Arbor, MI, USA). All the solvents and chemicals were at least the analytical grade and obtained from Merck KGaA (Darmstadt, Germany), Sigma-Aldrich Chemical Company (St. Louis, MO, USA), or Fisher Scientific (Pittsburgh, PA, USA).
Animal Model Establishment and Drug Treatment
The animal experiments in this study were carried out in accordance with the National Institutes of Health (NIH) Guide for the Care and Use of Laboratory Animals and approved by the Institutional Animal Care and Use Committee of Zhejiang Chinese Medical University (Permission number: 20210517–20). The whole animal study lasted 49 days, as shown in Figure 1A. Fifteen male specific pathogen-free (SPF) C57BL/6 mice, aged 6 weeks old and weighing 18 ± 4 g, were purchased from Shanghai BK Laboratory Animal Co., Ltd. The mice were housed under a standard laboratory environment with a 12 h/12 h light/dark cycle and constant temperature (25 ± 1°C) and humidity (50 ± 5%). Food and water were provided ad libitum, and the diet was purchased from Trophic Animal Feed High-tech co, lid, China).
 |
Figure 1 Established the gouty arthritis C57BL/6 model. A diagram of the experimental treatments is shown (A), body weight (B), pain threshold (C), foot thickness (D) SUA (E), UUA (F), Crea (G), and HE analysis of the footpad (H). (B–G): “ns” Represents not significant; *Represents p < 0.05 compared with those in the control group; **Represents p < 0.01 compared with those in the control group; ***Represents p < 0.001 compared with those in the control group; ****Represents p < 0.0001 compared with those in the control group, #p < 0.001 compared with those in the model group; ##represents p < 0.01 compared with those in the model group; ###represents p < 0.001 compared with those in the model group; ####Represents p < 0.0001 compared with those in the control group. The measurement data were expressed as mean ± SEM. The normality of the three groups and the homogeneity of variance between groups were tested using one-way ANOVA. (H), the scale of the larger image is 400um, 100X, and the blue area is 100um, 400X. SUA, Serum uric acid; UUA, Urine uric acid; Crea, creatine. N = 5/group. |
After a 7-days of acclimatization period, 15 mice were randomly assigned to one of the three groups: 1) control group (CT, N=5 mice/group), fed with a normal diet, and oral gavage with sterile water each day (from day 14 to day 49); 2) gouty arthritis model group (N=5 mice/group), fed with a high fat and cholesterol diet (20.0% sucrose, 15% lard, 0.8% cholesterol, 0.2% sodium cholate, appropriate casein, calcium hydrogen phosphate, stone powder, etc. and oral gavage with sterile water each day (from day 14 to day 49); 3) Allopurinol group (N=5 mice/group), fed with a high fat and cholesterol diet, and oral gavage with 3.9mg/mL allopurinol each day (from day 14 to day 49). The gavage volume for each mouse was 0.1kg/mL (for example, the gavage volume of a 20g mouse is 0.2mL). The allopurinol dosage was calculated based on the conversions from clinical adult dosages and the body weight of mice. Every Mice (except normal group) was injected with 1mg MSU crystals dissolved in 40 μL PBS into the right hind footpad every 10 days beginning on day 7.
All mice were weighed each week throughout the trial, and the drug doses were adjusted accordingly. At the end of the trial (day 49), samples were collected 12h after the last drug administration and injection of MSU. Blood samples were obtained from the eye socket vein of each mouse and centrifuged at 12,000 rpm for 15 min with 4°C. The liver and left foot joint tissues were isolated immediately after collection, snap-frozen in liquid nitrogen, and stored at −80°C.
Evaluation of Gouty Symptoms
The threshold value was evaluated 48 hours after the right hind paw of mice was injected with MSU or PBS solution. The pain threshold of mice was determined by the up and down method described by Chaplan.16 The mechanical retraction threshold (MWT) was measured with von Frey hair (Stoelting, Wood Dale, IL) tool. Before the test, the mice were placed separately on the table with metal mesh in the operating room with constant temperature and humidity, and the test began after being quiet for at least 30 minutes. At the beginning of each test, a force of 0.16 g was perpendicular to the central sole surface of the hind paw for 3 seconds. The positive reactions included licking paws, withdrawal and avoidance. On the contrary, the mice had no positive reaction. In combination with Marcotti et al’s 2018 article,17 the threshold force required for the right hind paw of mice to induce retraction was determined. The threshold force value after the first positive reaction in the mouse was measured, and the threshold value was reduced to one level. If it is a negative reaction, the threshold force value will rise one level and be measured again. In a word, after the first positive reaction, according to the negative/positive reaction of mice, different threshold force values were selected and measured three times before the measurement was completed. The threshold force data is expressed as the difference from the baseline value, and a negative value represents mechanical ectopic pain. All behavioural tests were conducted by one researcher (Weiman Shi) who did not know about the experimental design.
The footpad thickness was measured using Lin’s method.14 Two important time points were considered, ie, before the stimulation and 48 hours after the injection of MSU. The footpad thickness was measured with a caliper (Meinaite, Germany) to quantify the foot swelling. The thickness of each mouse’s footpad was determined by calculating the difference between 48h after MSU injection and the baseline value (zero time point). The measurement of edema value was expressed as the ratio of D mm/mm (zero time point) of the joint.
Blood Biochemistry and Urine Biochemistry
The separated serum was tested for the serum uric acid (SUA), creatinine (Cr), alanine transaminase (ALT) and aspartate transaminase (AST) concentrations at the Zhejiang Chinese Medical University laboratory animal research center. They were determined strictly via the operation steps of the Hitachi 3100 Automatic Analyzer (Japan) and the related detection reagents were provided by medical system Biotechnology Co., Ltd. The urine uric acid (UUA) level of mice was detected by corresponding uric acid kit according to the manufacturer’s instructions (Nanjing Jiancheng Bioengineering Institute).
Histopathological Examination
According to standard procedures, right foot joint tissues were obtained from exsanguinated mice, immediately fixed with 4% formalin, and then embedded in paraffin. Sections (5 μm) were mounted on slides for hematoxylin and eosin (H&E) for conventional morphological evaluation.
Real-Time Quantitative PCR (qPCR)
Total RNAs from Liver tissue were extracted with Trizol reagent (Thermo Fisher Scientific, USA). According to the manufacturer’s instructions, the RNA was reverse transcribed into cDNA using random hexamers primers with Thunderbird Probe qPCR Mix (TOYOBO, Japan). Each reaction was performed at least in triplicate and normalized to β-actin level. qPCR was performed with Bio-Rad iQ5 PCR system (Bio-Rad, United States) using the UltraSYBR Mixture (CWBIO, China). The instrument software determined the CT value of each well. The average of the values was calculated. The relative quantification was analysed by the 2−ΔΔCt method. The primer sequences are shown in Table S1.
Enzyme Linked Immunosorbent Assay (ELISA)
The concentrations of TNF-α and IL-1β (Quanzhou Ruixin Biological Technology Co., LTD, China) in mouse’s serum was determined with corresponding ELISA kits according to the manufacturer’s instructions.
Preparation of Lipid Extracts from Serum Sample
The lipids of individual serum sample were extracted according to a modified protocol of Bligh and Dyer in the presence of internal standards as previously described.18,19 Each lipid extract was resuspended with 200 μL chloroform/methanol (1:1, v/v)/100 uL serum, and stored at −20 ◦C for lipid analysis. Derivatization of and the primary amine in phosphoethanolamine-containing species (eg, PE) with fluorenylmethoxycarbonyl chloride and 4-hydroxyalkenals with carnosine was performed according to the previously reported methods.20,21 Individual lipid species including FA isomers and regioisomers were identified using multidimensional MS analysis. Incidentally, analysis of 4-hydroxyalkenals was completed within one week and others were analysed within two weeks.22
Lipid Analysis, and Data Processing and Analysis
As previously reported, a triple-quadrupole mass spectrometer (Thermo TSQ Quantiva) equipped with an automated nanospray ion source (TriVersa NanoMate, Advion Bioscience Ltd., Ithaca, NY, USA) was used for lipidomic analysis of serum samples performed with.23 To prevent possible lipid aggregation, the solutions of lipid extracts were diluted in CHCl3/MeOH/isopropyl alcohol (1:2:4, v/v/v) prior to direct infusion. All mass spectral data were obtained by different customized sequence subroutines operated under Xcalibur software (Xcalibur 3.0, Thermo Fisher Scientific Inc., San Jose, CA, USA). Data processing was conducted according to the previous method.24 The data about mass levels of individual lipid species in mouse liver analysed by shotgun lipidomics could be found in Table S2.
Statistical Analysis
SPSS 25.0 was used to analyse the statistical difference of the experimental data. GraphPad Prism 9.0 software was used for drawing. The measurement data were expressed as mean ± SEM. The normality of the three groups and the homogeneity of variance between groups were tested using one-way ANOVA while Statistical significance between the two groups was determined by Student’s unpaired t-tests, where * p < 0.05, ** p < 0.01, *** p < 0.001 and **** p < 0.0001. p-value below 0.05 was considered statistically significant. Pearson Correlation Analysis by using GraphPad Prism 9.0 software. Kolmogorov–Smirnov test was used to check the normality of each group of variables. All p-values were greater than 0.05, indicating that the data follow the normal distribution.
Results
Established the Gouty Arthritis Animal Model: Combined Injection of MSU Crystals with High Fat and Cholesterol Diet
An MSU-induced animal model was established via intra-articular injection therapy in C57BL/6 mice (Figure 1A). During this experiment, the weight gains trend of the mice in all groups remained consistent (Figure 1B). On day 7 of the experiment, there was no statistically significant difference observed in the baseline levels of serum uric acid, urine uric acid, creatinine (Crea), and pad swelling (Figure S1C–S1F), but on day 49, the results demonstrated there were obvious changes in the groups. As shown in Figure 1C, pain threshold was significantly decreased in model mice as compared to control group and ankle injected with MSU is more swollen (Figure 1D). Serum uric acid (Figure 1E) is increased, while urine uric acid is decreased (Figure 1F) after modelling. There is no significant change in Crea within the two groups (Figure 1G). Results of H&E staining of synovial tissue (Figure 1H) in the ankle joint show increased inflammatory infiltration in the MSU injected group. After modelling, liver index (Figure S1G) was higher in model group than control group and there are no significant differences in spleen index, kidney index ratio (Figure S1H–S1I), ALT (Figure S1A) and AST (Figure S1B).
The Expression of Inflammatory Factors in Gouty Mice Was Significantly Increased
In addition to serum uric acid and swelling, it is important to evaluate inflammatory factors in the gouty model. The levels of TNFα, IL6, and IL1β were measured using Elisa and qPCR in both local and systemic levels. As shown in Figure 2A–C, the mRNA expressions of IL-1β, TNF-α, and IL-6 were significantly increased in the model group compared to the normal control. Furthermore, ELISA was used to detect the levels of TNF-α (Figure 2E) and IL-1β (Figure 2D) in mice serum. As expected, the ELISA analysis indicated similar trends to the previous qPCR results.
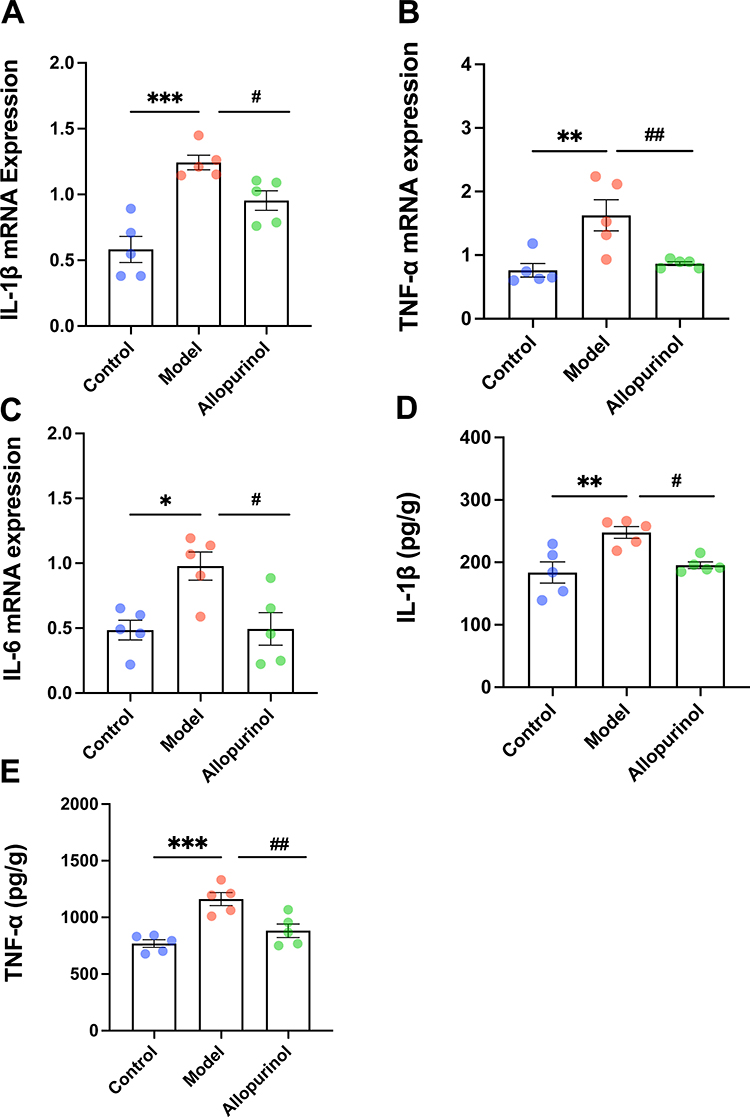 |
Figure 2 The expression of inflammatory factors in gouty mice. The mRNA expressions of IL-1β (A), TNF-α (B) and IL-6 (C) were determined by qPCR. The concentrations of IL-1β (D) and TNF-α (E) and were determined by Elisa. “ns” represents not significant; *Represents p < 0.05 compared with those in the control group; **Represents p < 0.01 compared with those in the control group; ***Represents p < 0.001 compared with those in the control group; #p < 0.001 compared with those in the model group; ##Represents p < 0.01 compared with those in the model group. The normality of the three groups and the homogeneity of variance between groups were tested using one-way ANOVA. TNF-α, tumor necrosis factor-α; IL-6, interleukin 6; IL-1β, interleukin 1 beta; N=5/group. |
NMDS Analysis of Nine Lipidomics Showed Significant Differences Between Control Group and Model Group
We used a “shotgun” approach to define the changes in lipidomics. A total of 9 types of lipids were detected in this lipidomics by shotguns, specifically Cer, SM, PC, PE, PI, Car, HNE, TAG and FA. R software was used to analyze the 9 types of total lipid NMDS among the three groups (Figure 6) The NMDS result indicated that the groups are obviously dis-tinct, and the stress value is 0.0322 and R square is 0.97, demonstrating significant differences in lipid profiles between the control and model group.
Lipomic Analysis Showed Abnormal Serum Phospholipid Metabolism in Gouty Mice
The Metabolism of Sphingolipid in Serum of Gouty Mice Was Detected by MDMS-SL
Firstly, we measured sphingolipid metabolism-related indexes such as SM and Cer by MDMS_SL. MDMS-SL analysis revealed that the content of most SM species in lipid extracts was increased in model group (Figure 3A). Specifically, it rose from 75.28 ± 3.453 nmol/mL serum in control to 91.73 ± 3.821 nmol/mL serum in mouse although had suggestive statistic difference (p > 0.05). The elevation of N 15:0 (~89 mol% increase, p < 0.0001), N 23:1 (~65 mol% increase, p < 0.005), and N 24:1 (~39 mol% increase, p < 0.05) (Figure 3A) are most obvious between the control and model group.
Similar to the went up in SM species, the total Cer amount (Figure 3B) and the majority of its subclasses also marked rise. The climbing of total Cer took up an ~70% increase (from 5.574 ± 0.6103 nmol/mL serum in the control group to 9.456 ± 0.4091 nmol/mL serum in the model group, p < 0.005). Interestingly, the amount of N 23:0 and N 24:1 in model groups significantly rose the amount, ~196 mol% increase p < 0.005, ~124 mol% increase p < 0.0001, respectively. In summary, abnormal metabolism of sphingomyelin in serum occurred in gouty mice.
Some reports demonstrated that the increase of pro-inflammatory cytokines in inflammatory diseases may be caused by the activation of SM, leading to the increase of Cer. Therefore, we conducted the correlations analyses between Cer with TNF-α and IL-6. The results showed the level of Cer was strongly positive correlated with TNF-α and IL-6 (Figure 3C–D, p < 0.05 and p < 0.005) as some studies.25,26 In addition, we also did the correlations of SUA, Cer and SM. It can be noticed that SUA had a strong positive link with Cer (p < 0.005, Figure 3E) but had no correlation with SM (p > 0.05, Figure 3F).
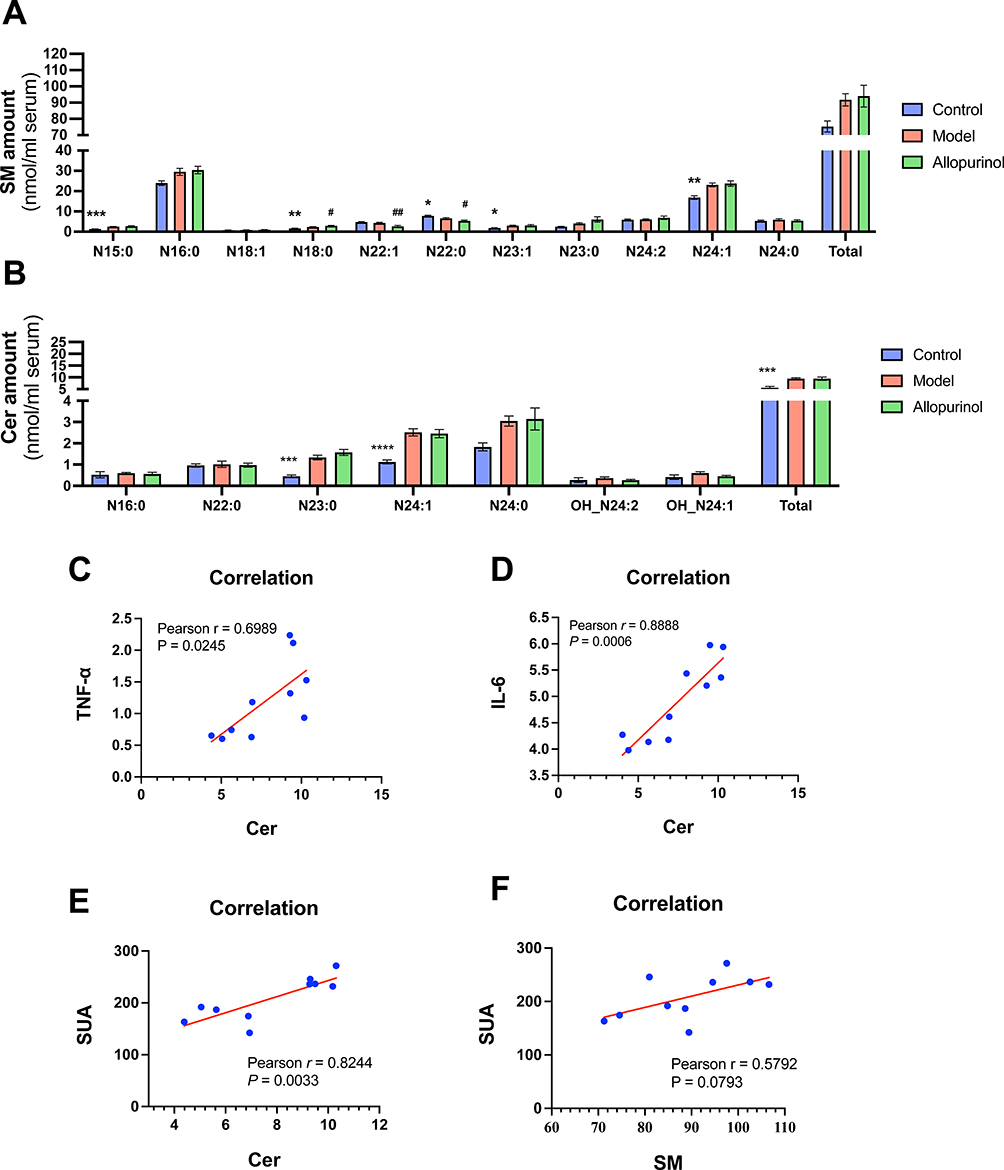 |
Figure 3 Representative comparison of lipidomics data of serum obtained from gouty mouse and control mouse. Lipidomics analysis of SM and Cer presented in lipid extracts of serum from mouse (N=5/group) was conducted by using multi-dimensional mass spectrometry-based shotgun lipidomics. The data represent means ± SEM from different individuals of SM amount (A), Cer amount (B). *Represents p < 0.05 compared with those in the control group; **Represents p < 0.01 compared with those in the control group; ***Represents p < 0.001 compared with those in the control group; ****Represents p < 0.0001 compared with those in the control group, #p < 0.001 compared with those in the model group; ##Represents p < 0.01 compared with those in the model group. The normality of the data and the homogeneity of variance between control and model groups were tested using Student’s unpaired t-tests and the normality of the three groups and the homogeneity of variance between groups were tested using one-way ANOVA. The correlation of Cer VS TNF-α (C), Cer VS IL-6 (D), Cer VS SUA (E) and SM VS SUA (F) as is shown. There were used Pearson Correlation Analysis in (C–F). |
MDMS-SL for Detecting the Metabolism of Serum Glycerophospholipids in Gouty Mice
Glycerol phospholipids are the main component of cell membrane lipids and an indispensable component of cell membranes, playing an important participant role in regulating and controlling cell functions and diseases.27 To further find the lipid alterations accompanying with the progression of gouty arthritis, the MDMS-SL technology was performed to quantitatively analyze three of the most important classes of phospholipids (eg, phosphatidylinositol (PI), choline glycerophospholipid (PE) and ethanolamine glycerophospholipid (PC)) in the serum from different groups.
Compared with the control group, model mice had the significant marked increasing in total PI amount and most subclass of PI amount (Figure 4A). In other words, the total PI amount in control (p < 0.005) was much lower than that of in model, where it ascended from 33.74 ± 2.225 nmol/mL serum in the control group to 49.91 ± 2.221 nmol/mL serum in the model group with the ascending made up an ~48 mol% of its total content. We can also notice the greatest changes of the subclasses from PI species (Figure 4A) were 16:0–18:1 (~133 mol% increase, p < 0.0001), 18:1–20:4 (~161 mol% increase, p < 0.005) and 18:0–20:3 (~168 mol% increase, p < 0.0001). In contrast to the rising of the total PI amount, the PE was seriously reduced (Figure 4D) in the serum of mouse (p < 0.0001) from the control group (101.7 ± 7.256 nmol/mL serum) to the model group (53.09 ± 6.779 nmol/mL serum). Almost subclasses of PE were declined heavily (Figure 4D) especially in P 18:0–22:4 and P 18:0–20:4, an ~68 mol% decrease, p < 0.0001 and an ~60 mol% decrease, p < 0.0001 respectively. Moreover, the specific subclasses of PE, expect the D 18:0–18:2, D 16:0–18:2 and P 18:0–20:3 were changed unobvious, the magnitude of reduction of rest species were ~46 mol% to ~68 mol% reduction around.
However, the MDMS-SL results (Figure 4B) indicated that compared to the control group, the total level of the PC species did not change in the model although there were some changes in the subclasses of PC species. The D 16:0–18:2 and the D 18:1–18:2 both had the increasing trends from the control to the model, while the D16:0–22:6 was decreasing in the two group in detail. The result of PC/PE ratio (Figure 4C) suggested that the gouty mice had much higher figure than the control’s (p < 0.0001), which may be related to abnormal energy metabolism. Overall, abnormal glycerophospholipids metabolism occurred in the serum of gouty mice.
Lipomic Analysis Showed Abnormal Serum Energy Metabolism in Gouty Mice
As mentioned earlier, the increased PC/PE ratio in model group may be related to abnormal energy metabolism. To further determine whether energy metabolism is abnormal in gout, the levels of Car, HNE, TAG and FA species in serum from different groups of mice also examined using the MDMS-SL approach, since the four categories are playing important roles in energy metabolism, implicated in the regulation of energy changes in disease. As anticipated, there was an increasing trend of total Car amount (p < 0.005) in model, contributing to elevating the total level from 748.8 ± 48.19 nmol/mL serum in control to 1205 ± 74.28 nmol/mL serum in model, with an ~61 mol% increase in serum (Figure 5A). The three categories of Car species changed the most were 14:1, 18:0 and 18:1, along with an ~129 mol% increase (p < 0.05), an ~108 mol% increase (p < 0.005) and ~95 mol% increase (p < 0.005) in model group, respectively. As for the HNE species (Figure 5B), it presented an opposite change with Car (p < 0.05). We observed that HNE species decreased significantly in the model group, and the subclasses of HHE (p < 0.05) and HNDE (p > 0.05) showed a significant difference in detail in Figure 5B.
In this study, TAG (Figure 5C) and FA lipids in TAG pool (Figure 5C–D) were significantly decreased in the model group compare to Car. Specifically, the result of total TAG level was decreased sharply from 637.2 ± 69.66 nmol/mL serum in the control group to 237.1 ± 16.91 nmol/mL serum in the model group (an ~63 mol% decrease, p < 0.0001) while the result of total FA level was 1912 ± 209.0 nmol/mL serum in the control group to 711.2±50.73 nmol/mL serum in the model group (an ~63 mol% decrease, p < 0.0001). The subclasses of TAG and FA species (Figure 5C and D) were also heavily decreased in the model group, at least down to ~50 mol%, and the detailed changes can be seen in Table S2.
Allopurinol Alleviated Obviously Gouty Symptoms and Did Certain Anti-Inflammatory Effect
According to the 2020 American College of Rheumatology guideline for the management of gout, allopurinol is strongly recommended as the first-line drug for all patients. In this research allopurinol was chosen as the positive medicine to treat gout. It was observed that after treating gout with allopurinol for 5 weeks, gouty-related symptoms and inflammation were significantly reduced. For example, the pain threshold (Figure 1C) was improved in the allopurinol group compared to the model and the foot thickness ratio (Figure 1D) was reduced in allopurinol group. As is shown in Figure 1E–1G, the allopurinol group had lower SUA levels (Figure 1E), and higher UUA level (Figure 1F), along with no difference of Crea (Figure 1G) and fewer inflammatory cells in footpad (Figure 1H) than the model group, indicating that allopurinol had a good impact on gouty arthritis in this experiment. Additionally, the release of related inflammatory and pro-inflammatory mediators was decreased in the treatment group than in the model group, such as serum concentrations of IL-1β (Figure 2A) and TNF-α (Figure 2B) and the mRNA expressions (Figure 2C–E) in footpad tissue (IL-1β, TNF-α and IL-6), demonstrating that allopurinol had anti-inflammatory effects to some degree. In conclusion, allopurinol alleviated obviously gouty symptoms and reduced inflammatory and pro-inflammatory mediators.
The Intervention of Allopurinol on Phospholipid Metabolism and Energy Metabolism in Gouty Arthritis
To observe the intervention effect of allopurinol on the chaos of phospholipid metabolism in gouty mice, NMDS analysis was performed on the overall levels of the nine lipid categories. As shown inFigure 6, the results of NMDS showed that the lipidomic data of the control, model, and treatment groups were clustered, forming three homeostasis. The stress value and R-square value were 0.0322 and 0.97, respectively. Furthermore, the lipids of SM, Cer, PI, PC, and PE were detected by MDMS-SL. It was observed that treating gout with allopurinol could not change the total level of SM (as shown in Figure 3A), Cer (as shown in Figure 3B), and PC (as shown in Figure 4B) species, but it could slightly influence N 18:0, N 22:0, and N 22:1 of SM subclasses (as shown in Figure 3A), with no statistically significant effects on Cer (as shown in Figure 3B) and PC (as shown in Figure 4B) subclasses. These results indicate that allopurinol cannot effectively intervene in the sphingolipid metabolism in this research.
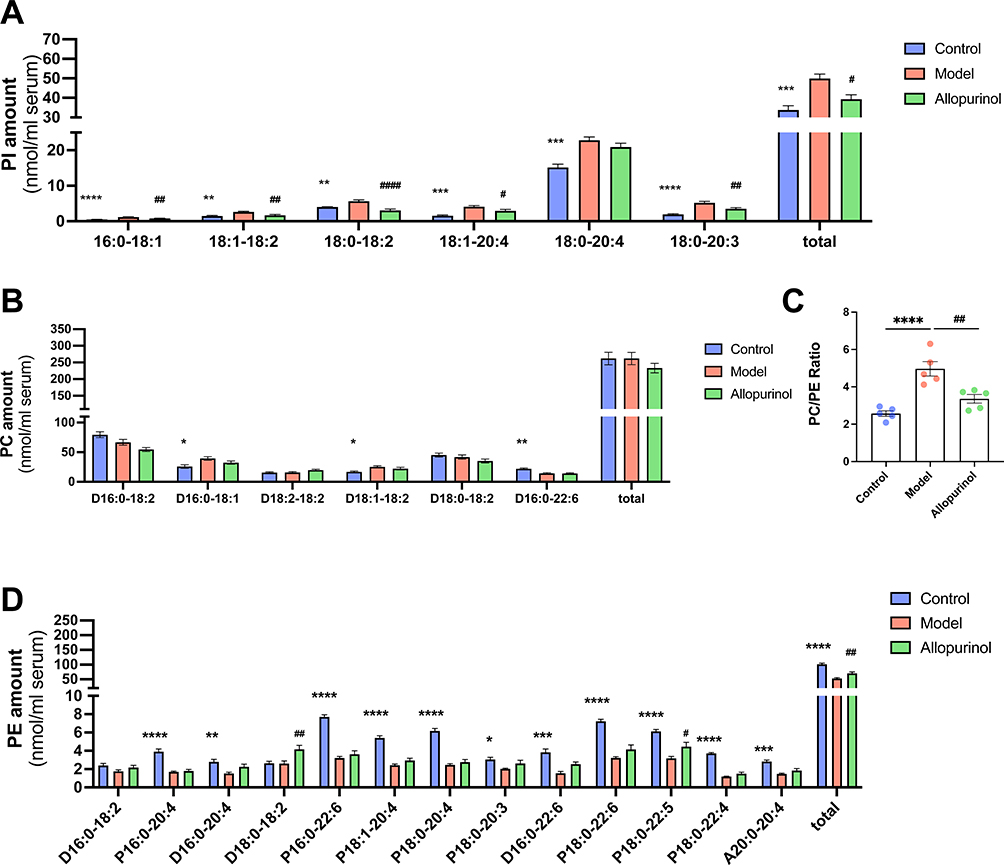 |
Figure 4 Representative comparison of lipidomics data of serum obtained from gouty mouse and control mouse. Lipidomics analysis of PI, PC and PE presented in lipid extracts of serum from mouse (N=5/group) was conducted by using multi-dimensional mass spectrometry-based shotgun lipidomics. The data represent means ± SEM from different individuals of PI amount (A), PC amount (B), total PE amount (D) and the PC/PE ratio (C). *Represents p < 0.05 compared with those in the control group; **Represents p < 0.01 compared with those in the control group; ***Represents p < 0.001 compared with those in the control group; ****Represents p < 0.0001 compared with those in the control group, #p < 0.001 compared with those in the model group; ##Represents p < 0.01 compared with those in the model group. The normality of the three groups and the homogeneity of variance between groups were tested using one-way ANOVA. |
 |
Figure 5 Representative comparison of lipidomics data of serum obtained from gouty mouse and control mouse. Lipidomics analysis of Car, HNE, TAG and FA presented in lipid extracts of serum from mouse (N=5/group) was conducted by using multi-dimensional mass spectrometry-based shotgun lipidomics. The data represent means ± SEM from different individuals of total Car amount (A), HNE amount (B), TAG amount (C) and FA amount (D). *Represents p < 0.05 compared with those in the control group; **Represents p < 0.01 compared with those in the control group; ***Represents p < 0.001 compared with those in the control group; ****Represents p < 0.0001 compared with those in the control group, #p < 0.001 compared with those in the model group; ##Represents p < 0.01 compared with those in the model group. The normality of the three groups and the homogeneity of variance between groups were tested using one-way ANOVA. |
In contrast to Cer and PC, allopurinol significantly regulated the total PI (p < 0.05) and PE (p < 0.05) amount in gouty mouse (Figure 4A–D). There was an obvious decrease in the allopurinol group of the all subclasses of PI (Figure 4E) than the model especially in 18:0–18:2, from 3.082 ± 0.7674 nmol/mL serum in the allopurinol group to 5.664 ± 0.8093 nmol/mL serum in the model (p < 0.0001). Although there were not many statistic differences between the allopurinol group and the model group in almost PE species, these changes had not just reached statistical differences yet since they had the increasing trend. The result of P 18:0–22:5 showed that allopurinol could regulate this item’s level in gouty mice and D 18:0–18:2 in the allopurinol group had the abnormal rising in PE species (Figure 4D). Moreover, the ratio of PC/PE (Figure 4C) was marked decreasing in the treated group when using allopurinol in gouty mice. In summary, allopurinol can only interfere with some of the disturbed lipid regulation.
We also used MDMS-SL to detect lipids related to energy metabolism in allopurinol treatment group, such as Car, HNE, TAG and FA, trying to further whether allopurinol could regulate the chaos of these lipids. Obviously, using allopurinol to treat gout cannot change the abnormal total amounts of Car (Figure 5A), HNE (Figure 5B), TAG (Figure 5C) and FA lipids in TAG pool (Figure 5D). The levels of Car and HNE in the treated group remained at about the same level in that of the model group, p = 0.7856 and P = 0.9993, respectively. In the gouty mice, only 20:1 of Car decreased significantly after treatment and approached the normal group while 16:0,14:1 and 18:1 had abnormally rising tend (Figure 5A). Oppositely, after treating by allopurinol, the majority of HNE, TAG and FA species were decreased than that of in the model, such as the HNE of HNE (Figure 5B), C 52:3/C 53:10 of TAG (Figure 5C) and 16:0 of FA species in TAG pool (Figure 5D). These results suggest that allopurinol is difficult to improve Car, HNE, TAG and FA lipid disorders in gouty mice.
 |
Figure 6 NMDS analysis of lipidomics showed significant differences between the three groups. NMDS is drawn by R software and select the total expression levels of these 9 categories of lipids. Among them, the three groups had 5 samples each. The horizontal coordinate is NMDS1, and the vertical coordinate is NMDS2. If the Stress value is less than 0.2 with the larger the R square is, the data is reliable. |
Discussion
Gout is a chronic inflammatory disease that is often associated with hyperuricemia and can cause acute and recurring arthritis. It is well-known that excessive production or/and low excretion of uric acid can lead to the accumulation of MSU crystals in tissues, which could lead to gouty arthritis. In recent years, it has been found that hyperlipidemia is often associated with gout.28,29 However, the mechanism remains unclear. In this study, we established an animal model of gout via injecting MSU crystals and feeding them with high-fat cholesterol diets to mimic the clinical characteristics of hyperlipidemia in gout patients.14 As is shown in Figure 1, gouty symptoms were exhibited in the gouty mice (Figure 1), including increased serum uric acid levels, footpad swelling, decreased pain threshold, and increased levels of inflammatory factors (as shown in Figure 2). Treatment with allopurinol, a first-line uric-lowering agent, significantly improved the aforementioned symptoms, demonstrating potent anti-inflammatory and therapeutic effects. The utilization of this animal model and allopurinol treatment provided valuable insights into the pathogenesis and potential treatment options for gout.30–32
To investigate aberrant serum lipid metabolism underlying the development of gouty arthritis, we utilized MDMS-SL technology to perform class-targeted lipid analysis, including carotenoids, HNE, TAG, and all classes of phospholipids and sphingolipids in the serum of C57BL/6 mice with or without allopurinol treatment. The results of NMDS analysis revealed that the control, model, and allopurinol groups formed distinct groups with different lipid homeostasis (as shown in Figure 6). These findings suggest that the development of gouty arthritis may contribute to the lipid metabolism disorders and that allopurinol treatment may exert beneficial effects on lipid homeostasis in individuals with gout.
Phospholipids are the most important components of biofilms, accounting for 40% of erythrocyte membrane lipids and 95% of mitochondrial membrane lipids. They are divided into glycolipids and sphingolipids. PC, PE and PI are the main glycerol phospholipids. The PC is the most widely distributed and is a major component of various cell membrane structures. Lipidomics analysis showed that glycerophospholipid metabolism in the serum of gouty mice were significantly abnormal especially in PI and PE. Gouty mice had the highest PI level and the lowest PE level, and allopurinol regulated the total PI and PE levels and some small aberrant lipid metabolism in gouty mice (Figure 4). The increase in the number of PI species in the model group may be due to altered signaling, as the dynamics of PI synthesis and accumulation are important for the level and availability of these signaling metabolites, and it has been suggested that the PI3K/Akt signaling pathway changes significantly after treatment in an MSU-induced inflammatory environment.33 Therefore, we concluded that abnormal PI lipid metabolism is related to PI3K signal. Interestingly, we need focus on the PC/PE ratio. Studies have shown that changes in PC and/or PE content in various tissues are associated with metabolic disorders such as atherosclerosis, insulin resistance and obesity.27,34
Sphingolipid is an important component of biofilm. Ceramides (Cer) are precursors to all complex sphingolipids, such as sphingolipids (SM), so their abnormal metabolism logically leads to corresponding changes in SM. SM can be hydrolyzed by sphingolipid enzymes to produce metabolites such as Cer, which can block insulin signaling and induce inflammation.35 Cer is the core compound of sphingolipid metabolism. This lipid plays an important role in regulating intracellular processes such as proliferation, differentiation, and apoptosis. It can be hydrolyzed by Cer located in the membrane or formed by de novo synthesis.36,37 In our results, the total levels of SM and Cer in model mice were significantly higher than in control, and the levels of Cer were positively correlated with the levels of IL-6 (p < 0.005) and TNF-α (p < 0.05), as it seen in some inflammatory diseases. We also found a strong correlation between Cer and SUA (p < 0.005). However, allopurinol could not change the chaos of Sphingolipid (Figure 3).
Car is a lipid material combining carnitine and fatty acids, which can transport long-chain fatty acids to mitochondria for beta oxidation, and is a vital marker of energy metabolism level.38 The Car, TAG and FA lipid results (Figure 5) showed that energy metabolism was significantly abnormally enhanced in gouty mice. HNE is the signature product of lipid peroxidation expression,39 but its physiological state should maintain a certain range. Our results indicate that HNE is declined in gouty mice. These results all indicate that there is excessive energy metabolism in gouty mice. SUA has a clear bi-directional effect, which promotes inflammation and oxidation in cells and has obvious antioxidant effects outside of cells.40 It has been suggested that the increase of SUA level can inhibit lipid peroxidase and reduce LPL level. Excluding dietary factors, as for the large reduction of TAG and the FA lipids in TAG pool in model mice, my suppose is that large amount of TAG and FA are involved in energy metabolism and used to produce energy such as Car, which requires high consumption to combat the inflammatory state of high uric acid. Hence, the levels of HNE, TAG and FA were reduced heavily and Car increased in gouty mice.
Allopurinol therapy, from the gouty symptoms to related inflammation mediators, from blood lipids to the lipoproteins and apolipoproteins, has a good effect on gouty arthritis. As for the nine lipids, using it has different effects on various categories. For example, it can reduce the total PI amount and the ratio of PC/PE (Figure 4), and enhance the PE level, but it is difficult to regulate the levels of SM, Cer, Car, HNE, TAG and FA lipids in TAG pool (Figures 4 and 5). We guess that allopurinol can regulate the related lipids, whose mechanisms are linked to gout or inflammation such as PI while it could not regulate the lipids involved in energy mechanism.
However, in this study, the result of lipidomics analysis clearly suggested that some lipid abnormality did not recover at the serum lipids level even after treatment with allopurinol for 6 weeks (Figures 3–5). In addition, we should expand the sample size to reduce the difference in the next study. Because in this study, small sample size per group (n = 5), there were some limitations in the study. Some significant differences between the model and the allopurinol treatment group might be demonstrated if more mice per group were used (eg, Figure 3).
In summary, the present study successfully established an animal model of gout using MSU crystal injection and high-fat diet feeding, which exhibited gouty symptoms, inflammation, and aberrant lipid metabolism, particularly showing abnormalities in eight lipids in serum. The study demonstrated that Cer had strong correlations with IL-6, TNF, and SUA, indicating its potential as an early biomarker for gout. Furthermore, the study revealed that allopurinol treatment could inhibit the progression of gouty arthritis and regulate aberrant PI and PE lipids and PC/PE ratio. These findings provide new insights into the pathogenesis of gout and hyperlipidemia and suggest potential therapeutic targets for their prevention and treatment.
Conclusions
In conclusion, the present study indicated that various aberrant lipid metabolisms were present in the established gouty model, and allopurinol treatment could relieve this aberrant metabolism of lipids to some degree. These findings provide new insights into the pathogenesis of gout and hyperlipidemia and suggest potential therapeutic targets for their prevention and treatment.
Abbreviations
GA, gouty arthritis; MSU, monosodium urate; Cer, ceramide; SM, sphingomyelin; HNE, 4-hydroxyalkenals; PI, phosphatidylinositol; PE, ethanolamine glycerophospholipid; MDMS-SL, multi-dimensional mass spectrometry-based shotgun lipidomics; SPF, specific pathogen-free; NIH, National Institutes of Health; SUA, serum uric acid; Crea, creatinine; ALT, alanine transaminase; AST, aspartate transaminase; UUA, urine uric acid; PC, choline glycerophospholipid; Car, Carnitine; TAG, triacylglycerol; FA, Fatty acid.
Ethics Statement
The animal study protocol was approved by the Ethics Committee of Laboratory Animal Management and Welfare Ethical Review Committee of Zhejiang Chinese Medical University (Permission number: 20210517-20) for studies involving animals.
Acknowledgments
Dianming Li and Weiman Shi are co-first authors for this study. We appreciate the technical support from the Public Platform of Medical Research Center, Academy of Chinese Medical Science, Zhejiang Chinese Medical University.
Author Contributions
All authors made a significant contribution to the work reported, whether that is in the conception, study design, execution, acquisition of data, analysis and interpretation, or in all these areas; took part in drafting, revising or critically reviewing the article; gave final approval of the version to be published; have agreed on the journal to which the article has been submitted; and agree to be accountable for all aspects of the work.
Funding
This study was funded by the Department of Science and Technology of the State Administration of Traditional Chinese Medicine-Zhejiang Province Joint Construction Project(GZY-ZJ-KJ-24012), National Key R&D Program of China (No.2022YFC3501204), the Zhejiang Provincial Administration of Traditional Chinese Medicine (NO.2021ZQ028) and Zhejiang science and technology plan (NO.2023C03040).
Disclosure
The authors declare that they have no competing interests in this work.
References
1. Neogi T, Jansen TL, Dalbeth N, et al. Gout classification criteria: an American college of rheumatology/European league against rheumatism collaborative initiative. Ann Rheum Dis. 2015;74(10):1789–1798. doi:10.1136/annrheumdis-2015-208237
2. Ashiq K, Bajwa MA, Tanveer S, et al. A comprehensive review on gout: the epidemiological trends, pathophysiology, clinical presentation, diagnosis and treatment. J Pak Med Assoc Apr. 2021;71(4):1234–1238.
3. Dalbeth N, Choi HK, Joosten LAB, et al. Gout. Nat Rev Dis Primers. 2019;5(1):69. doi:10.1038/s41572-019-0115-y
4. Zhang M, Zhu X, Wu J, et al. Prevalence of hyperuricemia among Chinese adults: findings from two nationally representative cross-sectional surveys in 2015–16 and 2018–19. Front Immunol. 2021;12:791983. doi:10.3389/fimmu.2021.791983
5. Viet TD, Xuan TD, Anh H. alpha-amyrin and beta-amyrin isolated from Celastrus hindsii leaves and their antioxidant, anti-xanthine oxidase, and anti-tyrosinase potentials. Molecules. 2021;26(23):7248. doi:10.3390/molecules26237248
6. Kim EJ, Ramachandran R, Wierzbicki AS. Lipidomics in diabetes. Curr Opin Endocrinol Diabet Obes. 2022;29(2):124–130. doi:10.1097/MED.0000000000000704
7. Zhang L, Han X, Wang X. Is the clinical lipidomics a potential goldmine? Cell Biol Toxicol. 2018;34(6):421–423. doi:10.1007/s10565-018-9441-1
8. Hu C, Zhang J, Hong S, et al. Oxidative stress-induced aberrant lipid metabolism is an important causal factor for dysfunction of immunocytes from patients with systemic lupus erythematosus. Free Radic Biol Med. 2021;163:210–219. doi:10.1016/j.freeradbiomed.2020.12.006
9. Roddy E, Choi HK. Epidemiology of gout. Rheum Dis Clin North Am. 2014;40(2):155–175. doi:10.1016/j.rdc.2014.01.001
10. Georgel PT, Georgel P. Where epigenetics meets food intake: their interaction in the development/severity of gout and therapeutic perspectives. Front Immunol. 2021;12:752359. doi:10.3389/fimmu.2021.752359
11. Ulreich A, Kostner GM, Pfeiffer KP, Sedlmayr P, Rainer F. Serum lipids and lipoproteins in patients with primary gout. Rheumatol Int. 1985;5(2):73–77. doi:10.1007/BF00270300
12. Zhang QB, Zhu D, Wen Z, et al. High levels of serum uric acid, cystatin c and lipids concentration and their clinical significance in primary gouty arthritis patients. Curr Rheumatol Rev. 2019;15(2):141–145. doi:10.2174/1573397114666180705095625
13. Yang Y, Xian W, Wu D, et al. The role of obesity, type 2 diabetes, and metabolic factors in gout: a Mendelian randomization study. Front Endocrinol. 2022;13:917056. doi:10.3389/fendo.2022.917056
14. Lin X, Shao T, Huang L, et al. Simiao decoction alleviates gouty arthritis by modulating proinflammatory cytokines and the gut ecosystem. Front Pharmacol. 2020;11:955. doi:10.3389/fphar.2020.00955
15. Wen X, Lou Y, Song S, et al. Qu-Zhuo-tong-bi decoction alleviates gouty arthritis by regulating butyrate-producing bacteria in mice. Front Pharmacol. 2020;11:610556. doi:10.3389/fphar.2020.610556
16. Chaplan SR, Bach FW, Pogrel JW, Chung JM, Yaksh TL. Quantitative assessment of tactile allodynia in the rat paw. J Neurosci Methods. 1994;53(1):55–63. doi:10.1016/0165-0270(94)90144-9
17. Marcotti A, Miralles A, Dominguez E, et al. Joint nociceptor nerve activity and pain in an animal model of acute gout and its modulation by intra-articular hyaluronan. Pain. 2018;159(4):739–748. doi:10.1097/j.pain.0000000000001137
18. Bligh EG, Dyer WJ. A rapid method of total lipid extraction and purification. Can J Biochem Physiol. 1959;37(8):911–917. doi:10.1139/y59-099
19. Han X. Lipid alterations in the earliest clinically recognizable stage of Alzheimer’s disease: implication of the role of lipids in the pathogenesis of Alzheimer’s disease. Curr Alzheimer Res. 2005;2(1):65–77. doi:10.2174/1567205052772786
20. Wang M, Fang H, Han X. Shotgun lipidomics analysis of 4-hydroxyalkenal species directly from lipid extracts after one-step in situ derivatization. Anal Chem. 2012;84(10):4580–4586. doi:10.1021/ac300695p
21. Han X, Yang K, Cheng H, Fikes KN, Gross RW. Shotgun lipidomics of phosphoethanolamine-containing lipids in biological samples after one-step in situ derivatization. J Lipid Res. 2005;46(7):1548–1560. doi:10.1194/jlr.D500007-JLR200
22. Hu C, Luo W, Xu J, Han X. Recognition and avoidance of ion source-generated artifacts in lipidomics analysis. Mass Spectrom Rev. 2022;41(1):15–31. doi:10.1002/mas.21659
23. Han X, Gross RW. Shotgun lipidomics: electrospray ionization mass spectrometric analysis and quantitation of cellular lipidomes directly from crude extracts of biological samples. Mass Spectrom Rev. 2005;24(3):367–412. doi:10.1002/mas.20023
24. Yang K, Cheng H, Gross RW, Han X. Automated lipid identification and quantification by multidimensional mass spectrometry-based shotgun lipidomics. Anal Chem. 2009;81(11):4356–4368. doi:10.1021/ac900241u
25. Al-Rashed F, Ahmad Z, Snider AJ, et al. Ceramide kinase regulates TNF-alpha-induced immune responses in human monocytic cells. Sci Rep. 2021;11(1):8259. doi:10.1038/s41598-021-87795-7
26. Hamada Y, Nagasaki H, Fujiya A, et al. Involvement of de novo ceramide synthesis in pro-inflammatory adipokine secretion and adipocyte-macrophage interaction. J Nutr Biochem. 2014;25(12):1309–1316. doi:10.1016/j.jnutbio.2014.07.008
27. van der Veen JN, Kennelly JP, Wan S, Vance JE, Vance DE, Jacobs RL. The critical role of phosphatidylcholine and phosphatidylethanolamine metabolism in health and disease. Biochim Biophys Acta Biomembr. 2017;1859(9 Pt B):1558–1572. doi:10.1016/j.bbamem.2017.04.006
28. Kuo CF, Grainge MJ, Zhang W, Doherty M. Global epidemiology of gout: prevalence, incidence and risk factors. Nat Rev Rheumatol. 2015;11(11):649–662. doi:10.1038/nrrheum.2015.91
29. Liang J, Jiang Y, Huang Y, et al. Comorbidities and factors influencing frequent gout attacks in patients with gout: a cross-sectional study. Clin Rheumatol. 2021;40(7):2873–2880. doi:10.1007/s10067-021-05595-w
30. Shih HJ, Kao MC, Tsai PS, Fan YC, Huang CJ. Long-term allopurinol use decreases the risk of prostate cancer in patients with gout: a population-based study. Prostate Cancer Prostatic Dis. 2017;20(3):328–333. doi:10.1038/pcan.2017.14
31. Liang G, Nie Y, Chang Y, et al. Protective effects of rhizoma smilacis glabrae extracts on potassium oxonate- and monosodium urate-induced hyperuricemia and gout in mice. Phytomedicine. 2019;59:152772. doi:10.1016/j.phymed.2018.11.032
32. Kang L, Miao JX, Cao LH, et al. Total glucosides of herbaceous peony (Paeonia lactiflora pall.) flower attenuate adenine- and ethambutol-induced hyperuricaemia in rats. J Ethnopharmacol. 2020;261:113054. doi:10.1016/j.jep.2020.113054
33. Cao L, Zhao T, Xue Y, et al. The anti-inflammatory and uric acid lowering effects of si-miao-san on gout. Front Immunol. 2021;12:777522. doi:10.3389/fimmu.2021.777522
34. Wei R, Ning R, Han C, et al. Lipidomics analysis reveals new insights into the goose fatty liver formation. Poult Sci. 2023;102(3):102428. doi:10.1016/j.psj.2022.102428
35. Lemaitre RN, Yu C, Hoofnagle A, et al. Circulating Sphingolipids, Insulin, HOMA-IR, and HOMA-B: the strong heart family study. Diabetes. 2018;67(8):1663–1672. doi:10.2337/db17-1449
36. Rivas Serna IM, Sitina M, Stokin GB, et al. Lipidomic profiling identifies signatures of poor cardiovascular health. Metabolites. 2021;11(11):doi:10.3390/metabo11110747
37. Kojta I, Chacinska M, Obesity B-ZA. Bioactive lipids, and adipose tissue inflammation in insulin resistance. Nutrients. 2020;12(5):1305. doi:10.3390/nu12051305
38. Adeva-Andany MM, Calvo-Castro I, Fernandez-Fernandez C, Donapetry-Garcia C, Pedre-Pineiro AM. Significance of l-carnitine for human health. IUBMB Life. 2017;69(8):578–594. doi:10.1002/iub.1646
39. Ayala A, Munoz MF, Arguelles S. Lipid peroxidation: production, metabolism, and signaling mechanisms of malondialdehyde and 4-hydroxy-2-nonenal. Oxid Med Cell Longev. 2014;2014:360438. doi:10.1155/2014/360438
40. Copur S, Demiray A, Kanbay M. Uric acid in metabolic syndrome: does uric acid have a definitive role? Eur J Intern Med. 2022;103:4–12. doi:10.1016/j.ejim.2022.04.022
 © 2024 The Author(s). This work is published and licensed by Dove Medical Press Limited. The
full terms of this license are available at https://www.dovepress.com/terms
and incorporate the Creative Commons Attribution
- Non Commercial (unported, 3.0) License.
By accessing the work you hereby accept the Terms. Non-commercial uses of the work are permitted
without any further permission from Dove Medical Press Limited, provided the work is properly
attributed. For permission for commercial use of this work, please see paragraphs 4.2 and 5 of our Terms.
© 2024 The Author(s). This work is published and licensed by Dove Medical Press Limited. The
full terms of this license are available at https://www.dovepress.com/terms
and incorporate the Creative Commons Attribution
- Non Commercial (unported, 3.0) License.
By accessing the work you hereby accept the Terms. Non-commercial uses of the work are permitted
without any further permission from Dove Medical Press Limited, provided the work is properly
attributed. For permission for commercial use of this work, please see paragraphs 4.2 and 5 of our Terms.