
Back to Journals » Journal of Pain Research » Volume 19
Linear Association of Derivatives of Triglyceride-Glucose Index with Incident Lower Limb Joint Pain in Middle-Aged and Older Chinese Adults: A Prospective Cohort Study
Authors Xue M, Chen X, Deng Q, Ye Y, Xun T, Liu Y, Yang X
Received 29 October 2025
Accepted for publication 19 February 2026
Published 28 February 2026 Volume 2026:19 577438
DOI https://doi.org/10.2147/JPR.S577438
Checked for plagiarism Yes
Review by Single anonymous peer review
Peer reviewer comments 2
Editor who approved publication: Dr Alaa Abd-Elsayed
Man Xue,1,* Xi Chen,1,* QuanWen Deng,1 YingDan Ye,1 TianRong Xun,1 Yong Liu,2 XiXiao Yang1
1Department of Pharmacy, Shenzhen Hospital of Southern Medical University, Shenzhen, People’s Republic of China; 2Department of Critical Care Medicine, Shenzhen Hospital of Southern Medical University, Shenzhen, People’s Republic of China
*These authors contributed equally to this work
Correspondence: Yong Liu, Department of Critical Care Medicine, Shenzhen Hospital of Southern Medical University, Shenzhen, 518000, People’s Republic of China, Email [email protected] XiXiao Yang, Department of Pharmacy, Shenzhen Hospital of Southern Medical University, Shenzhen, 518000, People’s Republic of China, Email [email protected]
Background: Metabolic factors play a critical role in the onset of lower limb joint pain, especially in middle-aged and older individuals. TyG and its derivatives, have emerged as promising indicators of insulin resistance, and are linked with several metabolic diseases, yet their relationships with lower limb joint pain remains insufficiently studied.
Methods: This study utilized 9-year longitudinal data (2011– 2020) from the China Health and Retirement Longitudinal Study (CHARLS). TyG and its derivatives were collected at baseline (2011). Incident lower limb joint pain was recorded during follow-up. The associations were evaluated using Multivariable Cox proportional hazards models, Restricted Cubic Spline (RCS), and Kaplan-Meier curves. The robustness of the findings was assessed by Fine-Gray competing risk model and subgroup analyses.
Results: Among 6817 participants, 2909 (42.67%) developed lower limb joint pain. The highest incidence occurred in the fourth quartile of TyG-BMI, TyG-WHtR and TyG-WC, but not TyG alone. There existed significant positive associations of TyG-BMI (p for trend: 0.015) and TyG-WHtR (p for trend: 0.004) with lower limb joint pain risk, especially the fourth quartiles of TyG-BMI (HR: 1.15; 95% CI: 1.02– 1.30), TyG-WHtR (1.18 [1.05– 1.32]) and TyG-WC (1.14 [1.01– 1.27]). The Fine-Gray competing risk model confirmed this robust association, and RCS indicated significant positive linear relationships of TyG-BMI and TyG-WHtR with new-onset lower limb joint pain. Subgroup analysis identified gender as a significant interactive factor for TyG-BMI, with a notable association in females. These results suggested that TyG derivatives, specifically adiposity-integrated indices, were associated with an increased risk of new-onset lower limb joint pain in middle-aged and older individuals, rather than TyG alone.
Conclusion: These results highlight the importance of monitoring TyG derivatives, specifically adiposity-integrated indices (TyG-BMI and TyG-WHtR) for early clinical detection and intervention in high-risk individuals, and offer novel perspectives for the assessment and treatment of lower limb joint pain.
Keywords: lower limb joint pain, CHARLS, triglyceride-glucose index, triglyceride-glucose derivatives, longitudinal study
A Letter to the Editor has been published for this article.
A Response to Letter by Dr Li has been published for this article.
Introduction
Lower limb joint pain refers to acute or chronic pain that occurs in weight-bearing joints such as the hip, knee, and ankle. It represents a significant and growing public health challenge, contributing substantially to impaired mobility and disability, and exerts a sharp decline in the quality of life among middle-aged and older populations globally. Data from the 2019 National Health Interview Survey showed that 36.5% of the patients had lower limb pain in the past 3 months.1 Lower limb joint pain is highly prevalent among middle-aged and older individuals. Studies have shown that knee pain affects approximately 25% of adults.2,3 Hence, greater attention must be paid to the potential risk factors of lower limb joint pain in older adults.
Lower limb joint pain is a common clinical symptom, usually caused by osteoarthritis (OA), rheumatoid arthritis (RA), or arthrolithiasis. Particularly the interplay between insulin resistance (IR) and adiposity, play a critical role in joint pathophysiology. IR promotes systemic inflammation and alters adipokine secretion, while excess adipose tissue not only increases mechanical load but also secretes pro-inflammatory cytokines that can sensitize peripheral nociceptors and promote central pain sensitization.4,5 This metabolic-adipose axis provides a compelling rationale for investigating composite indicators that capture both dysmetabolism and adiposity. Studies have shown that obesity and metabolic syndrome (MetS) contribute to the pathogenesis of OA primarily through obesity-related chronic low-grade inflammation and metabolic disorders associated with lipid and glucose homeostasis.6,7 Previous studies have predominantly focused on investigating the associations between potential risk factors and joint pathologies, with arthritis as the primary outcome. Joint pain is the hallmark symptom of arthritis; OA, as the leading driver of chronic pain worldwide, evokes subjective pain experiences through both peripheral and central sensitization.8–10 In addition, a 23-year follow-up study showed that knee pain with or without ROA can be regarded as an independent predictor of mortality; a significantly increased risk of all-cause and CVD-specific mortality was observed in middle-aged women experiencing knee pain, but not the hand.11 Therefore, adequate attention should be paid to lower limb joint pain in future studies.
Several recent studies have established a connection between obesity, metabolic syndrome, and joint pain phenotypes, highlighting roles for mechanical stress, adipose tissue dysfunction, and systemic inflammation.12–14 Studies showed that the accumulation of MetS components is linked to greater knee pain severity.15,16 Insulin resistance (IR) is the underlying cause and central driver of MetS. While the triglyceride-glucose (TyG) index and its derivatives (eg, TyG-BMI, TyG-WHtR) have emerged as promising surrogate markers of IR and have been associated with chronic pain conditions like low back pain and migraine in initial studies,17–21 the existing evidence has significant limitations. Critically, these investigations have primarily been cross-sectional in design, precluding causal inference regarding the role of IR in the development of joint pain. Moreover, there is a notable lack of prospective evidence specifically focusing on lower limb joint pain. The methodological limitations of previous work-including homogeneous populations, short follow-up periods, and inadequate control for potential confounders-highlight the need for well-designed longitudinal studies in diverse populations.
Based on the interplay between metabolic dysfunction and adiposity in joint pathophysiology, we hypothesized that TyG derivatives integrating adiposity measures (TyG-BMI, TyG-WC, and TyG-WHtR) would demonstrate stronger associations with incident lower limb joint pain than the TyG index alone. Specifically, we postulated that these composite indices would exhibit positive, dose-response relationships with joint pain risk, with variation by joint site (knee vs ankle) and potential effect modification by gender. To rigorously test these hypotheses, we conducted a nine-year prospective cohort analysis utilizing data from the China Health and Retirement Longitudinal Study (CHARLS). Our analytical approach employed multivariable Cox proportional hazards models, supplemented by sensitivity analyses (including Fine-Gray competing risk models) to verify robustness, restricted cubic splines to evaluate dose-response relationships, and subgroup analyses to identify potential effect modifiers.
Methods
Study Design and Data Source
This study was a retrospective analysis originating from the CHARLS database (http://charls.pku.edu.cn/), a nationally representative longitudinal survey conducted in China in strict accordance with the Declaration of Helsinki. This survey was initiated in 2011 to investigate policy and health-related data, including basic demographics of participants and their families, physical and psychological health, economic status, and medical examinations among adults aged 45 years and above, and focused on population aging. Specifically, participants were recruited from 450 villages/resident communities in 150 counties/districts spanning 28 provinces, including both rural and urban areas, using a multistage probability-proportional-to-size (PPS) sampling technique. Subsequently, a follow-up survey was conducted every two to three years. The CHARLS study for the main household survey was approved by the Biomedical Ethics Review Committee of the Peking University (IRB00001052-11015). The IRB approval number for biomarker collection was IRB00001052-11014. All participants provided signed informed consent forms before survey.22–24 All methods were carried out in accordance with relevant guidelines and regulations.
Study Population
Our study utilized five-wave CHARLS data for the years 2011, 2013, 2015, 2018, and 2020. Data from the first-wave survey (2011–2012) were collected as the baseline and included a total of 17708 respondents. The participants were followed up for a subsequent four-wave survey. A detailed flowchart of the study is presented in Figure 1. The exclusion criteria were as follows: 1) no fasting participants; 2) missing values of fasting blood glucose (FBG), triglycerides (TG); 3) missing values of height, weight, and waist circumference (WC). Before setting this exclusion criteria, we first corrected the obvious unit or recording errors and conducting imputation according to longitudinal repeated measurements of these three values; and 4) age < 45 years old. Participants were included if they had no lower limb joint pain (knee and/or ankle pain) at baseline and had follow-up data available from 2013 to 2020. Ultimately, 6817 participants without lower limb joint pain at baseline in 2011 were enrolled in our longitudinal cohort study.
 |
Figure 1 The screening flowchart for the study population from CHARLS 2011 to 2020 (n = 6817). (A) The inclusion and exclusion criteria of study cohort. (B) The follow-up flowchart of study population. Abbreviations: TG, triglyceride; WC, waist circumference. |
TyG and TyG Derivatives
In this study, TyG and its derivatives were used to assess the IR levels. TG and FBG levels were measured using a standard enzymatic colorimetric method. Height and weight were measured using a stadiometer and a weighing scale, respectively. Waist circumference (WC) was measured using flexible tape. TyG index was formulated as ln [fasting triglyceride (mg/dL) × fasting glucose (mg/dL)/2]. TyG derivatives were calculated based on the measured values of height, weight, and WC. BMI was computed as weight (kg)/height squared (m2) and WHtR was determined as WC (cm)/height (cm). TyG derivatives were calculated using the following formula:


Additionally, these participants were categorized into four distinct groups (Q1, Q2, Q3, and Q4) based on the quartiles of TyG and its derivatives, among which Q1 was regarded as the reference, to reveal the potential role of different levels of TyG and its derivatives on joint pain.25
Outcomes
Lower limb joint pain (knee or ankle pain) was determined by self-reporting in a subsequent four-wave follow-up questionnaire. In the survey, the following question was answered: “On what part of your body do you feel pain?” Please list all parts of the body you are currently feeling pain. Knee and/or ankle pain was considered new-onset lower limb joint pain. These participants were followed until the incidence of lower limb joint pain or the date of the last survey in 2020.
Baseline Data Collection
This study collected comprehensive information from participants, including demographics such as age, gender, marital status, education level, and residential area; lifestyle including drinking and smoking status; physical examination including height, weight, and WC; and laboratory indicators including white blood cell count (WBC, 10^9/L), mean corpuscular volume (MCV), hemoglobin (g/dL), hematocrit, platelet count (PLT, 10^9/L), creatinine (Cr, mg/dL), total cholesterol (TC, mg/dL), high-density lipoprotein cholesterol (HDL-C, mg/dL), low-density lipoprotein cholesterol (LDL-C, mg/dL), and glycated hemoglobin (%). In addition, comorbidities were collected, including 12 chronic diseases, such as hypertension, kidney, stomach diseases and cancer. The participants were categorized based on different variable characteristics.
Covariates
The univariate Cox regression analysis was conducted to explore the association of different risks with lower limb joint pain. The covariates were selected and adjusted based on comprehensive consideration of the results of univariate Cox regression analysis and clinical experience. Finally, elected covariates included demographics, lifestyle, laboratory indicators, and comorbidities. Gender, education, marital status, residence, smoking and drinking status, hypertension, kidney disease, stomach disease, rheumatism and cancer were identified as categorical variables. Age and glycated hemoglobin and LDL-C levels were continuous variables.
Statistical Analysis
In this study, data processing and statistical analyses were performed using R language (R version 4.4.2). All figures were plotted using R language, OriginPro2021, and GraphPad Prism 9.5. Statistical significance was set at p < 0.05. Descriptive statistics were used to summarize the baseline characteristics of the participants, grouped according to whether they progressed to lower limb joint pain and categorized based on quartiles. All continuous variables were expressed as mean ± standard deviation (SD). Normally distributed continuous variables were statistically analyzed using two-paired Student’s t-test or ANOVA, and non-normally distributed continuous variables were analyzed using the Kruskal–Wallis test or Mann–Whitney U-test. Categorical variables are presented as frequencies and percentages (n, %) and were analyzed using the χ2 test for categorical variables.
In the statistical analysis plan, we pre-specified our primary hypothesis to test the association between adiposity-integrated TyG derivatives (TyG-BMI and TyG-WHtR) and incident lower limb joint pain. Secondary analyses included: (1) examination of TyG and TyG-WC indices; (2) separate analyses for knee pain and ankle pain; and (3) subgroup analyses by age, gender, residence. These secondary analyses were considered exploratory in nature. While we acknowledge the potential for increased Type I error due to multiple testing, we chose not to apply formal statistical corrections for multiple comparisons in our exploratory analyses, as such adjustments can be overly conservative in observational studies and mask potentially important findings. The consistency of results across different statistical models was considered as supporting evidence for the robustness of the findings.
Subgroup analyses were conducted to assess effect modification by key demographic and clinical variables.Given the multiple comparisons arising from testing four TyG-related indices and conducting subgroup analyses, we acknowledge the potential for Type I error inflation. However, no formal statistical correction for multiple comparisons was applied to the exploratory analyses, as such adjustments can be overly conservative in observational studies and potentially increase Type II error by masking clinically relevant associations.
Variables with significant differences were calculated using a univariate Cox proportional hazards regression model to determine their correlation with lower limb joint pain. In the multivariable Cox proportional hazards regression, covariates were selected and adjusted based on comprehensive considerations of these univariates (p < 0.05) and clinical experience. Multivariable Cox proportional hazards regression models were used to assess the relationship between the TyG index and lower limb joint pain. Three models were developed for the analysis, each with different levels of covariate adjustment: Model I (crude model); Model II (adjusted by age, gender, education, marriage, residence, smoking, drinking); Model III (included all variables from Model II with further adjustments for glycated hemoglobin, LDL, hypertension, kidney disease, stomach disease, rheumatism and cancer); Furthermore, in order to comprehensively assess the relationship, the Fine-Gray competing risk model was performed, in which the death factor was considered as a competing risk and mortality case was excluded if the lower limb joint pain event occurred prior to death.
A restricted cubic spline (RCS) model was used to assess the potential nonlinear relationship between TyG and TyG derivatives and lower limb joint pain, with three knots at 10%, 50%, and 90%. Kaplan-Meier (KM) curves were used to compare different survival patterns among all participants with TyG and TyG derivative quartiles using Log rank tests. Furthermore, a stratified multivariate cox regression analysis was conducted for subgroup analysis according to age, gender, residence. Moreover, interaction analyses were conducted to assess the potential impact of the interactions between different factors on the study results. Knee and ankle pain were analyzed separately for two different outcomes among these participants.
Results
Baseline Characteristics of Study Population
In this study, 6817 participants were enrolled, including 3495 females (51.0%) and 3322 males (49.0%). The distributed diagrams of TyG-BMI, TyG-WHtR, TyG-WC, and TyG were showed in Figure 2, with mean ± SD of 203.70 ± 39.31, 4.70 ± 0.77, 742.51 ± 118.94, and 8.66 ± 0.66 respectively (Figure 2A–D).
 |
Figure 2 Distribution diagram of TyG and TyG-derivatives of study population. (A) TyG-BMI index distribution with mean value of 203.70 kg/m2. (B) TyG-WHtR index distribution with mean value of 4.70. (C) TyG-WC index distribution with mean value of 742.51 cm. (D) TyG index distribution with mean value of 8.66. Abbreviations: TyG-BMI, triglyceride glucose-body mass index; TyG-WHtR, triglyceride-glucose waist-to-height ratio; TyG-WC, triglyceride glucose-waist circumference; TyG, triglyceride glucose. |
Table 1 presents the baseline characteristics of the participants, grouped according to whether they progressed to new-onset lower limb joint pain. The average age of the participants was 59.44 ± 9.42 years old. Among them, 2909 participants (42.67%) experienced lower limb joint pain, including 2692 (39.49%) participants with new-onset knee pain and 1348 (19.77%) participants with ankle pain during the follow-up period. Compared to non-progressors, participants with lower limb joint pain exhibited a higher proportion of females (61.22%) and a higher prevalence of being married (83.19%). The majority of participants lived in rural areas (86.87%) and had a lower education level (73.15% with only primary school education). PLT, TC, and LDL-C levels were higher in participants with lower limb joint pain than in those without pain. Participants with hypertension, dyslipidemia, heart disease, stroke, kidney disease, stomach disease, and rheumatism had a higher incidence of lower limb joint pain. Furthermore, quartile stratification by TyG-BMI, TyG-WHtR, and TyG-WC revealed a greater number of incident cases with increased TyG derivative indices.
 |
Table 1 Baseline Characteristics of Participants Classified by Outcomes |
The incidence rates for each quartile of the TyG-related indices were as follows: TyG-BMI (38.89% for Q1, 42.66% for Q2, 42.31% for Q3, 46.83% for Q4), TyG-WHtR (37.83% for Q1, 41.43% for Q2, 42.55% for Q3, and 48.88% for Q4), TyG-WC (40.12% for Q1, 43.13% for Q2, 42.55% for Q3, 44.89% for Q4), and TyG (40.59% for Q1, 42.29% for Q2, 43.22% for Q3, 44.60% for Q4). The incidence of knee or ankle pain was related to increased TyG and TyG derivatives (Figure 3).
 |
Figure 3 Heat map analysis for the incidence of lower limb joint pain. And the incident rate of knee or ankle pain was analyzed respectively. Abbreviations: TyG-BMI, triglyceride glucose-body mass index; TyG-WHtR, triglyceride-glucose waist-to-height ratio; TyG-WC, triglyceride glucose-waist circumference; TyG, triglyceride glucose. |
The baseline characteristics of these participants are also presented based on the TyG-BMI index quartiles (Table S1). Participants with higher TyG-BMI levels were more likely to be female, married, have higher WBC, hemoglobin, hematocrit, PLT, TC, LDL, and glycated hemoglobin levels, and comorbid diseases including hypertension, dyslipidemia, diabetes, heart disease, and stroke (Table S1).
Association of TyG and TyG Derivatives with Lower Limb Joint Pain
Table S2 shows the results of the univariate Cox regression analysis. Demographics, including age, gender, marital status, residence, educational level, smoking and drinking status, some laboratory indicators, and comorbidities, were significantly associated with lower limb joint pain.
To observe the correlation between TyG and TyG derivatives and lower limb joint pain, multivariable Cox proportional hazards models were used after adjusting for different risk factors (Table 2). Confounders were selected and adjusted based on comprehensive consideration of the above variables (p < 0.05) and clinical experience. Finally, these variables, including age, gender, education, marriage, residence, smoking, drinking, hypertension, kidney disease, stomach disease, glycated hemoglobin, LDL, rheumatism and cancer, were selected as covariates for the different levels of model adjustment. We divided TyG and TyG derivatives into categorical variables based on quartiles. This association was observed in both the crude and fully adjusted models. In the crude model (Model I), the highest quartile (Q4) of TyG-BMI, TyG-WHtR, and TyG-WC was associated with an elevated risk of lower limb joint pain (HR 1.18, 95% CI: 1.06–1.31; HR 1.41, 95% CI: 1.27–1.56; HR 1.12, 95% CI: 1.01–1.24 respectively) compared with Q1. After adjusting for multiple variables (Model III), those in the highest quartiles of TyG-BMI, TyG-WHtR and TyG-WC were significantly associated with a higher risk of new-onset lower limb joint pain, and the adjusted HR (95% CI) were 1.15 (1.02–1.30), 1.18 (1.05–1.32) and 1.14 (1.01–1.27), respectively. Notably, the p value for the trend was not significant in the crude model (p = 0.083) or fully adjusted model (p = 0.074) for TyG-WC. However, the TyG index was not significantly associated with the incidence of lower limb joint pain (HR 1.05, 95% CI: 0.94–1.18).
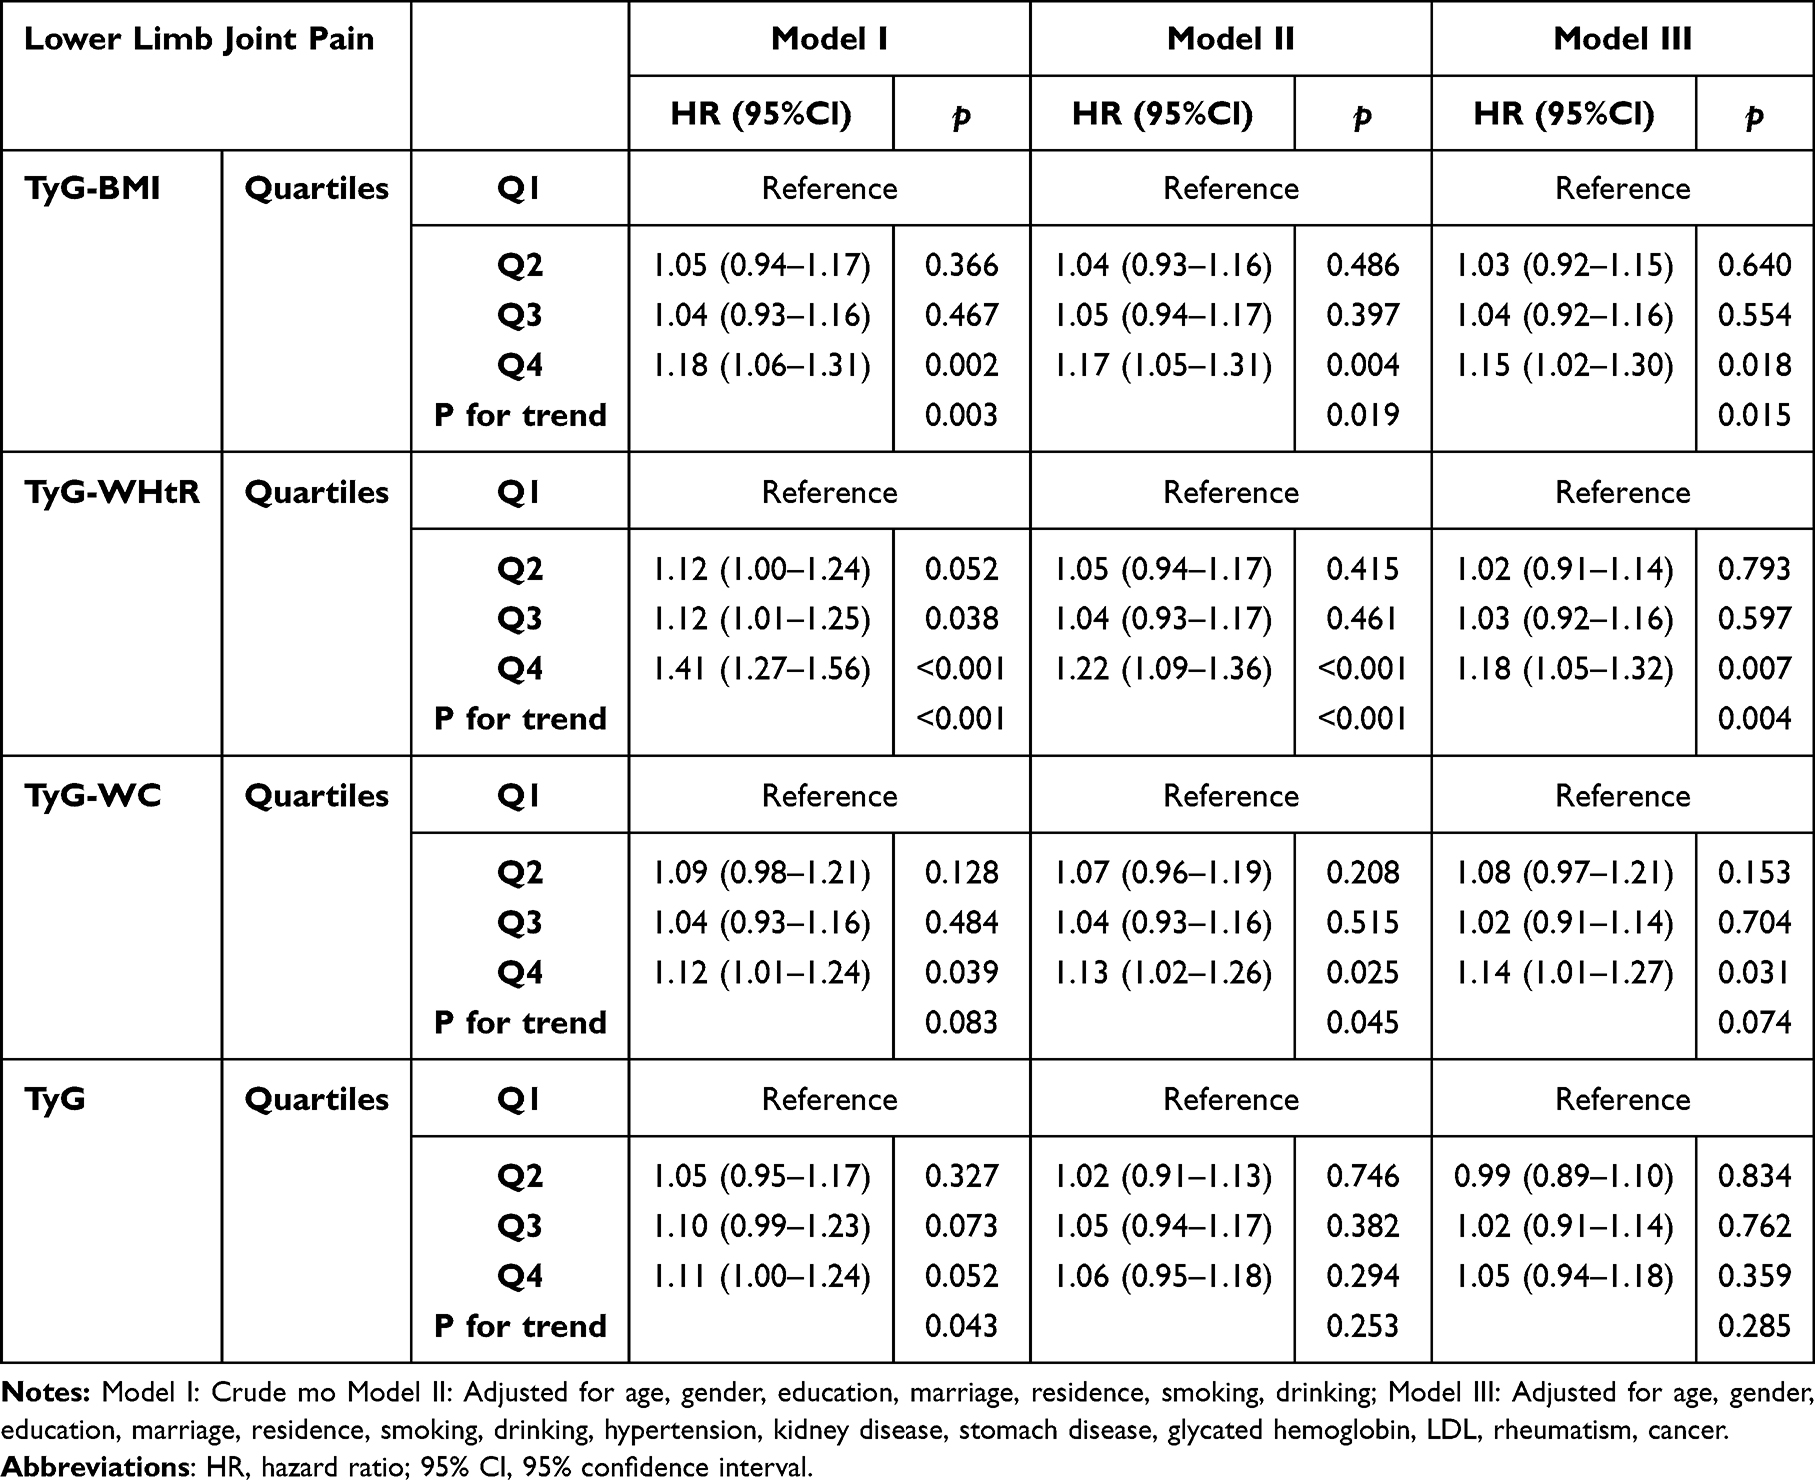 |
Table 2 Relationship Between TyG-Associated Indexes and Lower Limb Joint Pain Based on Cox Proportional Hazards Model |
Separately, in both the crude and fully adjusted models, knee pain had a significant positive relationship with the Q4 group of TyG-BMI, TyG-WHtR and TyG-WC. For ankle pain, there was a significant relationship in the Q4 group for TyG-BMI, TyG-WHtR and TyG and in the crude model, but no significant relationship was observed in the fully adjusted model (Tables S3 and S4).
Totally, these results suggest that TyG derivatives specifically integrated adiposity indicators, but not TyG alone, are significantly associated with new-onset lower limb joint pain, indicating that adiposity indicators played important roles in this association.
Association of TyG and TyG Derivatives with Lower Limb Joint Pain Considering Death Factor as Competing Risk
In addition to classic Cox proportional hazards models, we also used a modified Cox regression analysis using the Fine and Gray method to investigate the association between quartiles of TyG or TyG derivatives and incident lower limb joint pain, with death as a competing risk (Table 3). The highest quartiles (Q4) of TyG-BMI, TyG-WHtR, and TyG-WC, but not TyG, were significantly associated with a higher risk of new-onset lower limb joint pain, and this significant relationship persisted across the crude model and all adjusted models (TyG-BMI: HR 1.18, 95% CI: 1.06–1.32; TyG-WHtR: HR 1.17, 95% CI: 1.05–1.30; TyG-WC: HR 1.13, 95% CI: 1.02–1.26; TyG: HR 1.01, 95% CI: 0.91–1.13). p value for the trend for TyG-BMI and TyG-WHtR also showed a significant difference across all the models.
 |
Table 3 Relationship Between TyG-Associated Indexes and Lower Limb Joint Pain (Fine-Gray Competing Risk Model) |
For knee pain, significant relationships were observed in the Q4 group for TyG-BMI, TyG-WHtR, and TyG-WC across all the models. A higher risk of ankle pain was only associated with Q4 of TyG-BMI and TyG-WHtR; however, this correlation diminished in the fully adjusted model (Tables S5 and S6). These results further confirmed the robust association of TyG derivatives of integrated adiposity indicators with new-onset lower limb joint pain, particularly the knee pain.
Kaplan-Meier curves indicated that the cumulative incidence of lower limb joint pain was significantly higher in the groups with the highest quartile than in those with the lower quartiles of TyG-BMI (p = 0.016 for Log rank test; Figure 4A) and TyG-WHtR (p < 0.001 for Log rank test; Figure 4B), but not in the TyG-WC and TyG (Figure 4C and D).
 |
Figure 4 Kaplan-Meier curves for new-onset lower limb joint pain across quartiles of TyG-BMI (A), TyG-WHtR (B), TyG-WC (C) and TyG (D). Abbreviations: TyG-BMI, triglyceride glucose-body mass index; TyG-WHtR, triglyceride-glucose waist-to-height ratio; TyG-WC, triglyceride glucose-waist circumference; TyG, triglyceride glucose. |
Dose-Response Relationship of TyG and TyG Derivatives with New-Onset Lower Limb Joint Pain
The crude RCS models showed a significant positive linear connection between TyG-BMI and TyG-WHtR and new-onset lower limb joint pain as shown in Figure 5A and B (TyG-BMI: p for overall < 0.005, p for nonlinearity = 0.182; TyG-WHtR: p for overall < 0.001, p for nonlinearity = 0.703). Similarly, consistent conclusions were obtained in the fully adjusted model (TyG-BMI: p for overall = 0.0222, p for nonlinearity = 0.257; TyG-WHtR: p for overall = 0.0272, p for nonlinearity = 0.984) (Figure 5E and F). However, no significant linear or non-linear relationships between TyG-WC (Figure 5C and G) and TyG (Figure 5D and H) and lower limb joint pain were observed. TyG derivatives including TyG-BMI, TyG-WHtR and TyG-WC, showed significant linear relationships with knee pain in the fully adjusted model (Figure S1).
 |
Figure 5 The restricted cubic spline (RCS) analysis between the association of TyG or TyG-derivatives and the risk of lower limb joint pain. RCS was used to assess the potential nonlinear relationship between TyG-BMI, TyG-WHtR, TyG-WC, TyG and lower limb joint pain respectively, with three knots at 10%, 50%, and 90%. The Cox proportional hazards models were fitted, with solid lines representing estimated values and shaded areas representing the corresponding 95% CI. (A–D) RCS analysis for crude model. (E–H) The model was adjusted for age, gender, education, marriage, residence, smoking, drinking, hypertension, kidney disease, stomach disease, glycated hemoglobin, LDL, rheumatism, cancer. Abbreviations: TyG-BMI, triglyceride glucose-body mass index; TyG-WHtR, triglyceride-glucose waist-to-height ratio; TyG-WC, triglyceride glucose-waist circumference; TyG, triglyceride glucose. |
Subgroup Analysis of TyG and TyG Derivatives in Predicting the Risk of Lower Limb Joint Pain
To further explore the relationship between TyG-related indices and the risk of lower limb joint pain, we conducted a stratified analysis based on age, gender, and residential area (Figure 6). We found a significant gender interaction in the relationship between TyG-BMI (p for interaction = 0.020) and lower limb joint pain (Figure 6A). In particular, a significant correlation was observed among female participants. Otherwise, no significant interactions were detected between these subgroups and the combined effects of TyG and TyG derivatives and lower limb joint pain risk (all p for interaction > 0.05) (Figure 6A–D). These results showed the notable association of TyG-BMI and the risk of lower limb joint pain in female individuals. Additionally, the impact of TyG derivatives on lower limb joint pain risk is consistent across other different subgroups. These results highlight the potential value of identifying and managing individuals with an increased risk of incident lower limb joint pain within specific subgroups.
 |
Figure 6 Forest plot of subgroup analyses for the association of TyG-BMI (A), TyG-WHtR (B), TyG-WC (C) and TyG (D) with new-onset lower limb joint pain. The model was adjusted for age, gender, education, marriage, residence, smoking, drinking, hypertension, kidney disease, stomach disease, glycated hemoglobin, LDL, rheumatism, cancer in the cox regression analysis. Abbreviations: TyG-BMI, triglyceride glucose-body mass index; TyG-WHtR, triglyceride-glucose waist-to-height ratio; TyG-WC, triglyceride glucose-waist circumference; TyG, triglyceride glucose. |
Discussion
Few studies have reported the relationships of TyG and TyG derivatives with joint pain. This large-scale, nationally representative cohort study (CHARLS) suggests that elevated baseline levels of specific TyG derivatives, particularly TyG-BMI and TyG-WHtR, are significantly associated with new-onset lower limb joint pain among middle-aged and older Chinese individuals over a 9-year follow-up period. Notably, the association followed a positive, linear dose-response relationship between TyG-BMI or TyG-WHtR and lower limb joint pain. These associations remained robust after multivariate adjustment for potential confounders and were verified using Fine-Gray competing risk analyses that considered death factors. By contrast, the baseline TyG index alone did not show a significant association after multivariate adjustment. While the hazard ratios indicated the modest increase in risk, these associations may have substantial implications. As the easily calculated integrated measures, TyG derivatives, particularly integrating adiposity measures (BMI, WHtR) with the TyG index, would be critical for the pathogenesis of lower limb joint pain and offer valuable insights for early risk stratification aimed on weight management and metabolic health.
Previous studies reported that accumulation of MetS components appears to be associated with a higher intensity of knee pain, and this association of MetS and its components with pain severity trajectory can be mediated through BMI (largely by central obesity). And the excessive weight but not IR, can explain the association between MetS and radiographic knee OA.15,16 Another study showed that obese women with cardiometabolic clustering reported significantly more persistent knee pain compared with those of non-obese and obese without cardiometabolic clustering, or those of non-obese with cardiometabolic clustering.26 These studies showed that indicators integrated both metabolic dysfunctions and adiposity factors played important roles in new-onset musculoskeletal pain, and the adiposity factors are particularly crucial. Similar with these studies, our findings showed that TyG derivatives which integrated metabolic dysfunction and adiposity indicators were linked to new-onset lower limb joint pain, but not TyG alone. On the one hand, the increased joint loading and subsequent structural damage induced by the excessive body weight and adipose tissue-derived systemic inflammation could be the key factors of lower limb joint pain,12,14 and a meta-analysis also showed significant associations between elevated body fat and increased risk of incident or worsening joint pain;27 on the other hand, the neuropathy, joint infection, cartilage damage and bone marrow lesions caused by metabolic factors (such as elevated blood glucose and triglycerides et al) are also associated with the progression of joint pain.28–30 In contrast, metabolic factors may be a more gradual process compared to the adiposity, which could be the possible reason that TyG derivatives were linked to lower limb joint pain, but not TyG alone. The convergence of insulin resistance and adiposity produces a cascade that heightens the overall pathological impact on lower limb joint pain.
Specifically, many mechanisms were involved in this process. In addition to the structural and mechanical weight-bearing joint damage caused by the body weight load,12,14 some adipokines related to the presence of adipose tissue and adipose tissue-derived cytokines played critical roles in this process. Studies have shown that leptin deficiency and leptin receptor modulation are associated with decreased nociceptive pain, and adipose tissue macrophages have been linked to joint pain.31–33 Crucially, adipose tissue is a prolific source of pro-inflammatory cytokines (eg, TNF-α and IL-6) that can contribute to a state of chronic low-grade systemic inflammation. These inflammatory factors may promote synovitis and accelerate cartilage degradation, thereby precipitating and perpetuating joint pain. These proinflammatory factors can directly sensitize peripheral nociceptors in the joint and promote central pain sensitization, even in the absence of severe structural joint damage.34 Studies also showed that MetS also influenced multiple neurotransmitters and neuromodulators, such as substance P and brain-derived neurotrophic factor (BDNF), etc.35 In addition, hyperglycemia and dyslipidemia caused by IR lead to the accumulation of advanced glycation end products (AGEs) in the joint,36 renal dysfunction,37,38 diabetic peripheral neuropathy, and sarcopenia,39,40 eventually contributing to the development of lower limb joint pain. Overall, there is a complex interplay between these factors that forms a vicious cycle that exacerbates the progression of joint pain.
Another noteworthy finding of this study is the anatomical heterogeneity in risk associations: the relationships between TyG derivatives and incident knee pain remained robust across multiple adjusted models, whereas associations with ankle pain were largely attenuated after full covariate adjustment. This discrepancy reflects fundamental differences in the biomechanics, histology, and metabolic susceptibility of different joints. The knee is the largest and most complex synovial joint in human which played a central role in weight-bearing (especially during walking and stair climbing) and locomotor stability. And central obesity has been the most frequently observed factors associated with knee OA.30 In contrast, ankle cartilage is believed to have a greater capacity for self-regeneration and repair than other cartilage of the lower extremity, and the higher degree of water and protein glycogen content, and the extracellular matrix in the ankle joint, improved load-bearing capacity and reduced the mechanical damage.41 These heterogeneities may be the reason of the largely attenuated/diminished association of TyG derivatives with ankle pain.
Notably, our present study showed that there is a gender interaction between TyG-BMI and lower limb joint pain, and this association was significant in women, which may be related to hormonal differences. Postmenopausal women, who constituted a large proportion of our cohort, experienced a decline in estrogen levels. Decreased estrogen not only aggravates the degeneration of articular cartilage and reduces synovial fluid secretion but also accelerates bone resorption, leading to bone loss and an increased risk of osteoporosis. Additionally, worsening joint inflammation and increased pain sensitivity caused by decreased estrogen levels exacerbate joint pain.42–44 Therefore, women with elevated metabolic abnormalities and adiposity may represent a particularly vulnerable subgroup for developing lower limb joint pain.
Previous cross-sectional studies have mainly focused on the association between insulin resistance and pain based on the cross-sectional study.45,46 However, these studies precluded the establishment of temporal sequence. Our longitudinal cohort study extends this evidence by examining the prospective association between TyG derivatives (TyG-BMI and TyG-WHtR) and the development of joint pain. And TyG-BMI and TyG-WHtR are calculated from routine, inexpensive laboratory and anthropometric measurements, making them practical and accessible tools for clinical applications. Our findings are helpful for identifying individuals at elevated risk for future lower limb joint pain.
The primary strength of this study lies in the consistency of our findings across different statistical approaches. The associations between adiposity-integrated TyG indices (particularly TyG-BMI and TyG-WHtR) and incident lower limb joint pain were consistently observed in both traditional Cox proportional hazards models and Fine-Gray competing risk models that accounted for mortality as a competing event. Additionally, restricted cubic spline analyses demonstrated significant linear dose-response relationships for these indices, with higher values corresponding to progressively increased risk of joint pain. This methodological triangulation - where multiple analytical approaches yield congruent results - substantially strengthens the inference that these associations are robust and unlikely to be attributable to chance alone or methodological artifacts.
Although this study yielded some noteworthy observations, it had certain limitations. First, the assessment of joint pain was based on self-reporting, which is subjective and is potentially susceptible to reporting bias. The etiology and severity of pain were not distinguished and we cannot exclude acute injury-related pain. Furthermore, due to the limited datasets, TyG indices were measured only at baseline with no assessment of changes over time, limiting ability to infer causality. Additionally, given that this is an observational study, causal inferences cannot be made and some unmeasured cofounders (such as physical activity, diet et al) cannot be tracked. In the subsequent research, we will incorporate clinical diagnoses, regularly monitored clinical indicators and regular follow-up of physical health status to validate our findings. Although we observed a biologically plausible gender interaction, we still require larger cohort study to validate this association, avoiding the limited statistical power induced by insufficient sample sizes. Lastly, our study cohort comprised only middle-aged and older Chinese adults, and the generalizability of our findings to other ethnicities requires further validation.
Conclusions
In summary, this observational longitudinal cohort study explored the associations of TyG and TyG derivatives with lower limb joint pain in middle-aged and older individuals from China. Our results highlighted that TyG derivatives (TyG-BMI and TyG-WHtR), which specifically integrate metabolic dysfunction with adiposity, but not TyG alone, have significant positive linear relationships with new-onset lower limb joint pain, indicating that adiposity-integrated TyG derivatives, can be regarded as the predictors of new-onset lower limb joint pain risk, especially the knee pain. And this association was particularly observed among women. Even so, considering the modest effect sizes and the limited causal inference in this observational study, interventional studies are needed to determine whether targeting these factors can reduce pain burden. Generally, our findings underscore the potential public health significance on the management of lower limb joint pain towards a more integrated approach for realizing early risk stratification.
Data Sharing Statement
Online repositories (https://charls.pku.edu.cn/) contain the datasets used in this study. Our researchers obtained these data by registering and logging into the official CHARLS website for an application. The datasets generated and analyzed during this work are available from the last corresponding author (XiXiao Yang) upon reasonable request.
Ethics Approval and Consent to Participate
This study is a retrospective analysis originating from the publicly available CHARLS database (http://charls.pku.edu.cn/), a nationally representative longitudinal survey conducted in China in strict accordance with the Declaration of Helsinki. The CHARLS study for the main household survey was approved by the Biomedical Ethics Review Committee of the Peking University (IRB00001052-11015). The IRB approval number for biomarker collection was IRB00001052-11014. All participants provided signed informed consent forms before survey. And this study was conducted by using anonymized information data and these datasets were obtained legally. According to Article 32 (Items 1 and 2) of the “Ethical Review Measures for Life Science and Medical Research Involving Human Subjects in China” (February 18, 2023), this study met the criteria for exemption from ethical review. All methods were conducted in accordance with relevant guidelines and regulations.
Acknowledgment
Man Xue and Xi Chen are co-first authors for this study. Yong Liu and Xixiao Yang contributed equally as co-corresponding authors for this study. We thank the China Health and Retirement Longitudinal Study team for providing the datasets and the guidelines for using data. We also thank the CHARLS field team and every respondent for their time and effort devoted to the CHARLS project.
Author Contributions
All authors made a significant contribution to the work reported, whether that is in the conception, study design, execution, acquisition of data, analysis and interpretation, or in all these areas; took part in drafting, revising or critically reviewing the article; gave final approval of the version to be published; have agreed on the journal to which the article has been submitted; and agree to be accountable for all aspects of the work.
Funding
This research was supported by the Hospital Pharmacy Research Fund of Guangdong Provincial Hospital Association (YXKY202213), SHENZHEN YECHENGHAI CHARITY FOUNDATION (No. 2024-30) and Medical Scientific Research Foundation of Guangdong Province of China (B2023371), and Bao’an District Healthcare Research Project (2022JD046 and 2024JD105).
Disclosure
The authors declare that they have no competing interests in this work.
References
1. Lucas JW, Connor EM, Bose J. Back, lower limb, and upper limb pain among U.S. adults, 2019. NCHS Data Brief. 2021;415:1–17.
2. Bunt CW, Jonas CE, Chang JG. Knee pain in adults and adolescents: the initial evaluation. Am Fam Physician. 2018;98(9):576–585.
3. Peat G, Thomas E, Wilkie R, Croft P. Multiple joint pain and lower extremity disability in middle and old age. Disabil Rehabil. 2006;28(24):1543–1549. doi:10.1080/09638280600646250
4. Okifuji A, Hare BD. The association between chronic pain and obesity. J Pain Res. 2015;8:399–408. doi:10.2147/JPR.S55598
5. Shimobayashi M, Albert V, Woelnerhanssen B, et al. Insulin resistance causes inflammation in adipose tissue. J Clin Invest. 2018;128(4):1538–1550. doi:10.1172/JCI96139
6. Sampath SJP, Venkatesan V, Ghosh S, Kotikalapudi N. Obesity, metabolic syndrome, and osteoarthritis-an updated review. Curr Obes Rep. 2023;12(3):308–331. doi:10.1007/s13679-023-00520-5
7. Zhuo Q, Yang W, Chen J, Wang Y. Metabolic syndrome meets osteoarthritis. Nat Rev Rheumatol. 2012;8(12):729–737. doi:10.1038/nrrheum.2012.135
8. Conaghan PG, Cook AD, Hamilton JA, Tak PP. Therapeutic options for targeting inflammatory osteoarthritis pain. Nat Rev Rheumatol. 2019;15(6):355–363. doi:10.1038/s41584-019-0221-y
9. Goncalves S, Gowler PRW, Woodhams SG, Turnbull J, Hathway G, Chapman V. The challenges of treating osteoarthritis pain and opportunities for novel peripherally directed therapeutic strategies. Neuropharmacology. 2022;213:109075. doi:10.1016/j.neuropharm.2022.109075
10. Valdes AM. Metabolic syndrome and osteoarthritis pain: common molecular mechanisms and potential therapeutic implications. Osteoarthritis Cartilage. 2020;28(1):7–9. doi:10.1016/j.joca.2019.06.015
11. Kluzek S, Sanchez-Santos MT, Leyland KM, Judge A, Newton J, Arden NK. Response to: ‘Painful knee but not hand osteoarthritis is an independent predictor of mortality over 23 years follow-up of a population-based cohort of middle-aged women’ by Gao et al. Ann Rheum Dis. 2016;75(4):e23. doi:10.1136/annrheumdis-2015-209029
12. Binvignat M, Sellam J, Berenbaum F, Felson DT. The role of obesity and adipose tissue dysfunction in osteoarthritis pain. Nat Rev Rheumatol. 2024;20(9):565–584. doi:10.1038/s41584-024-01143-3
13. Adamson J, Ebrahim S, Dieppe P, Hunt K. Prevalence and risk factors for joint pain among men and women in the West of Scotland Twenty-07 study. Ann Rheum Dis. 2006;65(4):520–524. doi:10.1136/ard.2005.037317
14. Emery CF, Finkel D, Dahl Aslan AK. Bidirectional associations between body mass and bodily pain among middle-aged and older adults. Pain. 2022;163(10):2061–2067. doi:10.1097/j.pain.0000000000002603
15. Shin D. Association between metabolic syndrome, radiographic knee osteoarthritis, and intensity of knee pain: results of a national survey. J Clin Endocrinol Metab. 2014;99(9):3177–3183. doi:10.1210/jc.2014-1043
16. Pan F, Tian J, Cicuttini F, Jones G. Metabolic syndrome and trajectory of knee pain in older adults. Osteoarthritis Cartilage. 2020;28(1):45–52. doi:10.1016/j.joca.2019.05.030
17. Yan Z, Zhang H, Liu S, et al. A cross-sectional study exploring relationships between triglyceride glucose index, atherogenic index of plasma, and chronic pain: NHANES 1999–2004. Lipids Health Dis. 2025;24(1):73. doi:10.1186/s12944-025-02496-8
18. Que Z, Chen D, Cai H, Lan W, Huang Y, Rui G. Associations between insulin resistance and low back pain risk in US adults: a cross-sectional study. Front Med. 2025;12:1538754. doi:10.3389/fmed.2025.1538754
19. Sun X, Song J, Yan R, et al. The association between lipid-related obesity indicators and severe headache or migraine: a nationwide cross sectional study from NHANES 1999 to 2004. Lipids Health Dis. 2025;24(1):10. doi:10.1186/s12944-025-02432-w
20. Wu J, Yuan X, Zhao J, et al. Association of the insulin resistance marker triglyceride glucose index with migraine: results of a cross-sectional and prospective cohort study. J Oral Facial Pain Headache. 2025;39(1):165–175. doi:10.22514/jofph.2025.017
21. Samavarchitehrani A, Mercantepe F, Behnoush AH, Klisic A. Exploring the TyG index and the homeostasis model assessment of insulin resistance as insulin resistance markers: implications for fibromyalgia management and understanding-a narrative review. Diagnostics. 2025;15(4):494. doi:10.3390/diagnostics15040494
22. Zhao Y, Hu Y, Smith JP, Strauss J, Yang G. Cohort profile: the China Health and Retirement Longitudinal Study (CHARLS). Int J Epidemiol. 2014;43(1):61–68. doi:10.1093/ije/dys203
23. Chen X, Crimmins E, Hu PP, et al. Venous blood-based biomarkers in the china health and retirement longitudinal study: rationale, design, and results from the 2015 wave. Am J Epidemiol. 2019;188(11):1871–1877. doi:10.1093/aje/kwz170
24. Gong J, Wang G, Wang Y, et al. Nowcasting and forecasting the care needs of the older population in China: analysis of data from the China Health and Retirement Longitudinal Study (CHARLS). Lancet Public Health. 2022;7(12):e1005–e1013. doi:10.1016/S2468-2667(22)00203-1
25. Wang M, Teng T, Zhang N, et al. Derivatives of the triglyceride-glucose index and their association with incident hypertension in prehypertensive individuals: a 4-year cohort study augmented by mendelian randomization. Cardiovasc Diabetol. 2025;24(1):284. doi:10.1186/s12933-025-02813-6
26. Sowers M, Karvonen-Gutierrez CA, Palmieri-Smith R, Jacobson JA, Jiang Y, Ashton-Miller JA. Knee osteoarthritis in obese women with cardiometabolic clustering. Arthritis Rheum. 2009;61(10):1328–1336. doi:10.1002/art.24739
27. Walsh TP, Arnold JB, Evans AM, Yaxley A, Damarell RA, Shanahan EM. The association between body fat and musculoskeletal pain: a systematic review and meta-analysis. BMC Musculoskelet Disord. 2018;19(1):233. doi:10.1186/s12891-018-2137-0
28. Davies-Tuck ML, Hanna F, Davis SR, et al. Total cholesterol and triglycerides are associated with the development of new bone marrow lesions in asymptomatic middle-aged women - a prospective cohort study. Arthritis Res Ther. 2009;11(6):R181. doi:10.1186/ar2873
29. Chen Y, Huang YC, Yan CH, et al. Abnormal subchondral bone remodeling and its association with articular cartilage degradation in knees of type 2 diabetes patients. Bone Res. 2017;5(1):17034. doi:10.1038/boneres.2017.34
30. Niu J, Clancy M, Aliabadi P, Vasan R, Felson DT. Metabolic syndrome, its components, and knee osteoarthritis: the framingham osteoarthritis study. Arthritis Rheumatol. 2017;69(6):1194–1203. doi:10.1002/art.40087
31. Zhang DH, Fan YH, Zhang YQ, Cao H. Neuroendocrine and neuroimmune mechanisms underlying comorbidity of pain and obesity. Life Sci. 2023;322:121669. doi:10.1016/j.lfs.2023.121669
32. Hu ZJ, Han W, Cao CQ, Mao-Ying QL, Mi WL, Wang YQ. Peripheral leptin signaling mediates formalin-induced nociception. Neurosci Bull. 2018;34(2):321–329. doi:10.1007/s12264-017-0194-2
33. Xie J, Huang Z, Yu X, Zhou L, Pei F. Clinical implications of macrophage dysfunction in the development of osteoarthritis of the knee. Cytokine Growth Factor Rev. 2019;46:36–44. doi:10.1016/j.cytogfr.2019.03.004
34. Stannus OP, Jones G, Blizzard L, Cicuttini FM, Ding C. Associations between serum levels of inflammatory markers and change in knee pain over 5 years in older adults: a prospective cohort study. Ann Rheum Dis. 2013;72(4):535–540. doi:10.1136/annrheumdis-2011-201047
35. Gowler PRW, Li L, Woodhams SG, et al. Peripheral brain-derived neurotrophic factor contributes to chronic osteoarthritis joint pain. Pain. 2020;161(1):61–73. doi:10.1097/j.pain.0000000000001694
36. Chong ZZ, Menkes DL, Souayah N. Targeting neuroinflammation in distal symmetrical polyneuropathy in diabetes. Drug Discov Today. 2024;29(8):104087. doi:10.1016/j.drudis.2024.104087
37. Kim YJ, Bae YS, Chang Y, Shin S. Sex-specific associations between changes in Triglyceride-Glucose (TyG) index and risk of chronic kidney disease: a cohort study of young and middle-aged adults. Nutrients. 2025;17(18):2986. doi:10.3390/nu17182986
38. Yoshida D, Ikeda S, Shinohara K, et al. Triglyceride-glucose index associated with future renal function decline in the general population. J Gen Intern Med. 2024;39(16):3225–3233. doi:10.1007/s11606-024-08809-4
39. Kim B, Kim G, Lee Y, Taniguchi K, Isobe T, Oh S. Triglyceride-glucose index as a potential indicator of sarcopenic obesity in older people. Nutrients. 2023;15(3). doi:10.3390/nu15030555
40. Park JH, Lee MY, Shin HK, Yoon KJ, Lee J, Park JH. Lower skeletal muscle mass is associated with diabetes and insulin resistance: a cross-sectional study. Diabetes Metab Res Rev. 2023;39(7):e3681. doi:10.1002/dmrr.3681
41. Anastasio AT, Lau B, Adams S. Ankle Osteoarthritis. J Am Acad Orthop Surg. 2024;32(16):738–746. doi:10.5435/JAAOS-D-23-00743
42. Tang J, Liu T, Wen X, et al. Estrogen-related receptors: novel potential regulators of osteoarthritis pathogenesis. Mol Med. 2021;27(1):5. doi:10.1186/s10020-021-00270-x
43. Chen L, Hong H, Yang Z, et al. Osteoclast-secreted galectin-3 promotes articular cartilage degeneration in OVX rats via LRP1/beta-catenin axis. Osteoarthritis Cartilage. 2025. doi:10.1016/j.joca.2025.06.013
44. Li G, Wang A, Tang W, et al. Progranulin deficiency associates with postmenopausal osteoporosis via increasing ubiquitination of estrogen receptor alpha. Genes Dis. 2025;12(1):101221. doi:10.1016/j.gendis.2024.101221
45. Hu Y, Yu J, Xu Z, Gao Y, Li Y, Li L. Association between metabolic score for insulin resistance and lower limb pain among the elderly: a cross-sectional study. Front Endocrinol. 2025;16:1530067. doi:10.3389/fendo.2025.1530067
46. Yan Z, Duan L, Yin H, et al. The value of triglyceride-glucose index-related indices in evaluating migraine: perspectives from multi-centre cross-sectional studies and machine learning models. Lipids Health Dis. 2025;24(1):230. doi:10.1186/s12944-025-02648-w
 © 2026 The Author(s). This work is published and licensed by Dove Medical Press Limited. The
full terms of this license are available at https://www.dovepress.com/terms
and incorporate the Creative Commons Attribution
- Non Commercial (unported, 4.0) License.
By accessing the work you hereby accept the Terms. Non-commercial uses of the work are permitted
without any further permission from Dove Medical Press Limited, provided the work is properly
attributed. For permission for commercial use of this work, please see paragraphs 4.2 and 5 of our Terms.
© 2026 The Author(s). This work is published and licensed by Dove Medical Press Limited. The
full terms of this license are available at https://www.dovepress.com/terms
and incorporate the Creative Commons Attribution
- Non Commercial (unported, 4.0) License.
By accessing the work you hereby accept the Terms. Non-commercial uses of the work are permitted
without any further permission from Dove Medical Press Limited, provided the work is properly
attributed. For permission for commercial use of this work, please see paragraphs 4.2 and 5 of our Terms.
Recommended articles
Association of Triglyceride-Glucose Index with the Risk of Hyperhomocysteinemia Among Chinese Male Bus Drivers: A Longitudinal Study
Xiong J, Wu Y, Huang L, Zheng X
International Journal of General Medicine 2023, 16:2857-2866
Published Date: 4 July 2023