Back to Journals » Journal of Inflammation Research » Volume 17
LINC00998 Modulating M2 Macrophage Activation in Allergic Rhinitis by Stabilizing BOB.1 mRNA
Authors He Y, Tang Y, Wen S, Dong L, Li F, Deng Y, Tao Z
Received 1 November 2023
Accepted for publication 9 April 2024
Published 16 April 2024 Volume 2024:17 Pages 2309—2326
DOI https://doi.org/10.2147/JIR.S444692
Checked for plagiarism Yes
Review by Single anonymous peer review
Peer reviewer comments 2
Editor who approved publication: Professor Ning Quan
Yan He,1,* Yulei Tang,1,* Silu Wen,1 Lin Dong,1 Fen Li,1,2 Yuqing Deng,1 Zezhang Tao1
1Department of Otolaryngology-Head and Neck Surgery, Renmin Hospital of Wuhan University, Wuhan, Hubei, People’s Republic of China; 2Research Institute of Otolaryngology-Head and Neck Surgery, Renmin Hospital of Wuhan University, Wuhan, Hubei, People’s Republic of China
*These authors contributed equally to this work
Correspondence: Zezhang Tao; Yuqing Deng, Email [email protected]; [email protected]
Background: Allergic rhinitis (AR) is globally recognized as a considerable threat to human health with a rising prevalence and a substantial medical and socioeconomic burden. Numerous studies have emphasized the significance of long noncoding RNAs (lncRNAs) in allergic responses. Hence, this research dealt with exploring the involvement of the lncRNA LINC00998 in the mechanism of AR.
Methods: LINC00998 expression was assessed by qRT-PCR in peripheral blood mononuclear cells acquired from individuals with AR. Additionally, the potential relationship between LINC00998 and macrophage polarization was observed in vitro. Then we constructed AR mice model and macrophage polarization models using THP-1 cells as well as primary human macrophages to verify the M2 shift in AR and the low expression level of LINC00998 in M2 macrophages. We used gain- and loss-of-function experiments to explore the modification of LINC00998 in macrophage polarization. Furthermore, we explored the underlying mechanism of LINC00998 mediates through qRT-PCR, flow cytometry, and Western blot.
Results: The analysis revealed a significant decrease in LINC00998 expression in the samples obtained from patients with AR. LINC00998 is markedly increased in M1 macrophages whereas decreased in M2 macrophages in vitro. Furthermore, suppression of LINC00998 caused a remarkable enhancement in M2 polarization, whereas its overexpression led to its attenuation. Knockdown of LINC00998 led to a remarkable downregulation of BOB.1 mRNA and protein, while overexpression of LINC00998 upregulated their expression. Moreover, it was found that BOB.1 modulated macrophage polarization through the PU.1/IL-1β axis. Meanwhile, the modulation of LINC00098 overexpression on macrophage polarization and PU.1/ IL-1β can be reversed by BOB.1 siRNA.
Conclusion: This research revealed the lncRNA LINC00998 altered M2 macrophage polarization by regulating the BOB.1/PU.1/IL-1β axis, which open up new avenues for studying the pathogenesis of AR.
Keywords: allergic rhinitis, allergy, macrophage polarization, LncRNA, LINC00998
Graphical Abstract:

Introduction
Allergic rhinitis (AR), one of the most prevalent diseases globally, affects an estimated 10 to 40% of people worldwide.1 AR is characterized by clinical symptoms like paroxysmal sneezing, nasal itching, nasal congestion, and a runny nose, all of which significantly impair quality of life.2 Various treatments, including intranasal cortico-steroids (ICS), antihistamines, and allergen immunotherapy, have been constantly developed to alleviate these symptoms.3 However, a complete cure for AR remains elusive, and the underlying pathological mechanism is still poorly understood. AR is a chronic, non-infectious inflammatory condition strongly associated with “type 2” immune responses characterized by cytokines such as interleukin-4 (IL-4) and IL-13.4 To further comprehend the molecular mechanisms underlying AR and identify new targets for treatment, it is crucial to identify the primary pathogenic molecules implicated in the pathogenesis of AR.
Immunity and tissue repair are among the many biological and pathological processes that macrophages contribute to. However, they can also contribute to tissue damage when activated inappropriately during inflammation response.5 Similar to Th1/Th2 polarization, uncommitted macrophages (M0) can polarize into classically activated M1 macrophages or alternatively activated M2 macrophages triggered by specific microenvironment exposure.6 The M1 phenotype is stimulated by Th1 cytokines such as interferon-gamma (IFN-γ) or tumor necrosis factor-α (TNF-α), as well as some pathogen-associated molecular patterns like lipopolysaccharide (LPS). Conversely, M2 macrophages are stimulated by IL-4 or IL-13 stimulation.7 Phenotypically, M1 macrophages are characterized by enhanced expression of pro-inflammatory Th1 cytokines (IL-1β, IL-6, and IL-12) and major histocompatibility complex (MHC) class II molecules. Conversely, M2 macrophages exhibit high levels of CD206, ARG1, and CD163.8 Dysregulation of the M1/M2 equilibrium is often associated with various diseases, particularly allergic diseases where M2 macrophages, as part of the type 2 immune response, play a significant role.9 Therefore, acquiring a deeper comprehension of the mechanisms underlying different macrophage polarizations could contribute to the diagnosis and treatment of allergic diseases.
Long non-coding RNAs (lncRNAs) are an extensive category of non-coding RNAs longer than 200 nucleotides.10 Although the lower sequence conservation of encoding sequences compared to protein-coding genes, it has been demonstrated that lncRNAs have important functions. Irregular lncRNAs have been reported in various physiological and pathological processes such as cancer, autoimmunity and other immune dysfunctional diseases.11 Furthermore, it has emerged as crucial regulators of inflammation responses, influencing factors such as Th1/Th2 balance, Th2 cell migration, and the generation of IFNs and inflammatory cytokines.12 This research dealt with investigating the expression and function of the lncRNA LINC00998 in AR. In our study, LINC00998 was found to be downregulated in patients with AR. Furthermore, in macrophages, IL-4 and IL-13 stimulation led to decreased expression of LINC00998. Importantly, deficiency of LINC00998 promoted M2 polarization through the inhibition of the BOB.1/PU.1/IL-1β pathway. The data acquired in this research highlight the involvement of LINC00998 in the regulation of allergic reactions.
Materials and Methods
Bioinformatics Analysis
To find the dysregulated lncRNAs, the GSE73680 dataset was obtained from the Gene Expression Omnibus (GEO) to discover differentially expressed genes (DEGs) across healthy controls and individuals with allergic asthma. Additionally, the GSE165934 dataset comprised gene expression profiles of 19 peripheral blood mononuclear cells (PBMCs) from 10 patients with allergic asthma and 9 controls (healthy individuals). Analysis of the dataset GSE165934 and its annotation data from the GPL23126 platform was executed utilizing R (v 4.1.0) and R Studio software. To standardize the data and ensure data quality, the limma, and simpleaffy packages were used, respectively. In cases where duplicate data existed, the average RNA expression value was used. The DEGs were analyzed through the limma package, considering a threshold of lg|FC| >1 and an adjusted P-value <0.05. The DEGs were visualized through heatmap and volcano plot analysis through R software.
Patients, Clinical Specimens and Ethics Statement
To further determine the dysregulation of LINC00998 in AR patients, a total of 22 patients diagnosed with AR were obtained from the Otorhinolaryngology Department of Renmin Hospital of Wuhan University in the second half of 2022. The collected information from each participant included general data, past medical history, family history and necessary medical laboratory data. The criteria for diagnosis of AR were based on the AR and its Impact on Asthma Guidelines (ARIA).1 During the same period, 22 sex- and age-matched healthy individuals from physical examinations without allergy-related symptoms were recruited as control group. The AR group (n = 22) comprised individuals with a clinical history of AR, positive skin prick tests or allergen-specific IgE (sIgE) levels of ≥ 0.7 kU/L (measured using the ImmunoCAP 250 allergen detection device). The control group (n = 22) included individuals with allergen sIgE concentrations <0.35 IU/mL who did not exhibit any allergic symptoms or have a history of allergies. Patients with severe nasal septum deviation, systemic disorders, tumor diseases, or nasal infectious diseases were excluded from the study. Table S1 displays the enrolled participants’ basic clinical characteristics. Peripheral venous blood samples (5 mL) were acquired from the participants using ethylenediaminetetraacetic acid (EDTA)-anticoagulated tubes. PBMCs were isolated from the samples using a lymphocyte separation medium (TBD, Tianjin, China) through density gradient centrifugation for subsequent qRT-PCR assays. This research was subjected to approval by the Institutional Ethical Review Board of Renmin Hospital at Wuhan University. Prior to their participation in the research, written informed consent was provided by all adult subjects (above 18) or children (under 18)’ legal guardian (WDRY2018-KO52), and the case complies with the Helsinki Declaration’s ethical standards.
Animal Model and Ethics Statement
To investigate the M2 polarization in AR phenotype, 14 specific pathogen-free (SPF) BALB/C mice, aged 6 to 8 weeks, were retrieved from Vital River Laboratory Animal Technology (Beijing, China; License No. SCXK2016-0006). The mice were housed in an SPF-barrier environment at the Animal Experiment Center of Renmin Hospital of Wuhan University (License No. SYXK2015-0027). Before the investigation, the mice underwent a one-week adaptive feeding period. The animal study strictly followed the Guidelines for the Care and Use of Laboratory Animals. And the Institutional Animal Care and Animal Use Committee of Renmin Hospital of Wuhan University (License No. WDRM-20200602) granted its approval for the animal procedures utilized in this research.
14 mice were categorized randomly into two groups: the control and the AR groups. In the AR group (n = 7), basic sensitization was achieved by intraperitoneal injection of 400 μL of a normal saline suspension containing 100 μg of ovalbumin (OVA; A5503, Sigma-Aldrich, MO, USA) and 2 mg of aluminum hydroxide (Al (OH)3). This injection was administered every other day for the initial two weeks. From days 15 to 28, a daily intranasal administration of normal saline suspension (20 μL) containing 10% OVA was performed on both sides of the nasal cavity (10 μL per nasal cavity) for one week. The control group (n = 7) received saline instead of OVA for both basic sensitization and nasal stimulation (Figure S1A). Within 30 min following the final nasal challenge, allergy-associated symptoms were observed. These symptoms included sneezing, scratching, and a runny nose and were counted to quantitatively evaluate the symptoms of AR (Figure S1B). Eyeball extirpation and blood collection were performed 24 hours after the final nasal challenge, followed by the euthanasia of the mice for the subsequent experimentation process. The paraffin-embedded nasal mucosa was exposed to hematoxylin and eosin (H&E) as well as Periodic acid–Schiff (PAS) stains (Figure S1C). The spleen was then collected and kept at −80 °C for qRT-PCR assays.
Primary Human Macrophages Culture and Stimulation
To explore the expression level of LINC00998 in different polarized macrophages, primary monocytes were retrieved from leukocyte-enriched buffy coats (The Blood Bank, Renmin Hospital of Wuhan University, China). As per the prior description, the PBMC was isolated and seeded in cell plates and allowed to adhere for two hours. Prior to washing the cells, the removal of the growth media was executed. The adherent monocytes were cultured in Roswell Park Memorial Institute (RPMI) 1640 (PAA Laboratories, Austria) containing 10% fetal bovine serum (FBS; Gibco), macrophage-colony stimulating factor (M-CSF; 50 ng/mL; R&D Systems, MN) and 1% penicillin-streptomycin (Sigma-Aldrich) for seven days. The medium was replaced every three days. Concerning M1 differentiation, during the last 48 hours, LPS (20 ng/mL, Sigma-Aldrich, Germany) and IFN-γ (20 ng/mL, R&D Systems) were introduced into the culture. However, for M2 differentiation, IL-4 (20 ng/mL, R&D Systems) was added instead. The cells were harvested after the differentiation period.
THP-1 Cell Line Culture, Stimulation and Transfection
To determine the function of LINC00998 in macrophage polarization, the THP-1 monocyte and HEK293T cell lines employed in this research were accessed at the Cell Bank of the China Academy of Sciences (Shanghai, China). Dulbecco’s Modified Eagle Medium-high glucose (HyClone, UT, USA) supplemented with 10% FBS (Gibco, USA) was employed to grow the HEK293T cells under 5% CO2 and 95% air with the temperature kept at 37 °C. Additionally, THP-1 cells were cultured in RPMI-1640 medium (HyClone, UT, USA), with 10% FBS (Gibco, CA, USA), antibiotics (penicillin [100 U/mL], and streptomycin [0.1 mg/mL]) added. Only cells in the logarithmic growth phase were selected for the experiment in this study.
The differentiation of THP-1 cells into M0 macrophages was triggered through Phor-bol-12-myristate-13-acetate (PMA, Sigma-Aldrich, Germany). To further polarize the cells, 100 ng/mL of LPS was added to induce M1 polarization, while 20 ng/mL of IL-13 (Sigma-Aldrich, Germany) and 20 ng/mL of IL-4 (Sigma-Aldrich, Darmstadt, Germany) were added to induce M2 polarization. Afterward, varying concentrations of OVA (A5503; 50–500 μg/mL, Sigma-Aldrich, USA) were exposed to the cells for 48 hours to assess the impact on macrophage polarization.
The short-interfering RNAs (siRNAs) used in this study were obtained from Sangon Biotech (Shanghai, China). The sequences of the siRNAs are presented below: si-NC, 5’-UUCUCCGAACGUGUCACGUTT-3’ (sense) and 5’-ACGUGACACGUUCGGAGAATT-3’ (antisense); si-LINC00998, 5’-GACAGUAAUUUGAGGUUCATT-3’ (sense) and 5’-UGAACCUCAAAUUACUGUCTT-3’ (antisense); h-BOB.1-si-1, 5’-CGCCACUCAUCACCAAUGUTT-3’ (sense) and 5’-ACAUUGGUGAUGAGUGGCGTT-3’ (antisense); h-BOB.1-si-2, 5’-GGACACCUUACACCGAGUATT-3’ (sense) and 5’-UACUCGGUGUAAGGUGUCCTT-3’ (antisense); h-BOB.1-si-3, 5’-CUAUGCGCUUAACCACACUTT-3’ (sense) and 5’-AGUGUGGUUAAGCGCAUAGTT (antisense). Furthermore, ZetaLife (CA, USA, AD600075) was used to transfect the siRNAs into cells that had been plated overnight in a six-well plate. The lentivirus (LV) construct for the overexpression of LINC00998 (LINC00998 LV) was obtained from GeneChem (Shanghai, China). Virus-infected cells were treated with a puromycin (2 μg/mL)-containing solution (MCE, NJ, USA). Moreover, the clones were sustained in a medium containing 1 μg/mL of puromycin for 72 hours after transfection to ensure stable expression.
Flow Cytometry for Macrophage Subset Analysis
To examine the polarization state of macrophage, PE-conjugated anti-CD11b (TONBO, USA, 50–0118-T100) was employed as a pan-macrophage cell surface marker. To distinguish between macrophage M1 and M2 polarization subsets, PE-Cy™7-conjugated anti-CD206(321,124; BioLegend, USA) was selected to label the M2 phenotype, and allophycocyanin (APC)-conjugated anti-CD80 (20–0809-T100; TONBO, USA) was used for the M1 phenotype. The M1 phenotype was defined as CD11b+CD80+, while the M2 macrophage was defined as CD11b+CD206+.
THP-1 cells were suspended in cold stain buffer (FBS). Afterward, these cells were exposed to anti-CD11b along with either anti-CD80 or anti-CD206 antibodies on ice for 30 min in the dark. The cells were then washed thrice with FBS and analyzed utilizing a CytoFlex flow Cytometer (Beckman Coulter, USA) within two hours with the acquired images assessed through Flowjo.
qRT-PCR
Isolation of the total RNA from the samples was conducted through the TRIzol™ reagent (15,596,026; Invitrogen, CA, USA). Additional assessments concerning the purity and the concentration of the RNA were executed through the NanoDrop 2000 spectrophotometer (Thermo Scientific, USA). Furthermore, the synthesis of complementary DNA (cDNA) was conducted through the Evo M-MLV RT Mix Kit (Accurate Biotechnology, Hunan, China, AG11705). Concerning the qRT-PCR, an SYBR® Green Premix Pro Taq HS qPCR Kit (Accurate Biotechnology, China, AG11701) was employed on a BIO-RAD CFX RT-PCR system (Bio-Rad, CA, USA). The expression of mRNA was measured using β-actin as the internal reference. The primers employed in the research are presented in Additional File: Table S2.
Immunofluorescence
Fixation of the THP-1 cells involved exposure to 4% paraformaldehyde (20 mins), followed by permeabilization with 0.5% Triton X-100 (15 min) and blocking with 5% bovine serum albumin (BSA) (1 hour). Consequently, the cells were exposed to primary antibodies against BOB.1, PU.1, and IL-1β overnight at 4 °C, followed by exposure to secondary antibodies. Additionally, 4’,6-diamidino-2-phenylindole (DAPI) was utilized to stain the nuclei. Fluorescent images were acquired and quantified using ImageJ software under a fluorescent microscope.
Western-Blotting Analysis
After blocking non-specific binding, overnight incubation of the membranes with primary antibodies against BOB.1 (1:1000; Affinity), PU.1 (1:1000; Immunoway), IL-1β (1:1000; Affinity), and β-actin (1:1000; Cell Signaling Technology) were performed. Afterward, they were exposed to horseradish peroxidase (HRP)-labeled goat anti-rabbit immunoglobulin G (IgG) antibody for one hour. The levels of protein were quantified through comparison with standardized β-actin. Visualization of the protein bands was executed via enhanced chemiluminescence (ECL) substrates.
mRNA Stability Assay
LINC00998 was overexpressed by the LV infection for 48 hours. To block de novo RNA synthesis, actinomycin D (5 μg/mL) (MCE, NJ, USA) was introduced into the medium. Total RNA was collected at specific time points, whereas the expression of the mRNA was determined through qRT-PCR. Through comparative assessment of the levels of mRNA prior to and after adding actinomycin D, the mRNA half-life of BOB.1 was determined.
Dual Luciferase Reporter Gene Assays
The potential interaction between LINC00998 and BOB.1 was predicted using bioinformatics, and the dual luciferase reporter gene assays validated the interaction. The designing and synthesis of wild-type (WT) and mutant reporter (MUT) constructs pmirGLO-BOB.1 were executed by Duolaimi Biotechnology (Wuhan, China). These plasmids were co-transfected with pcDNA3.1-LINC00998 or pcDNA3.1-Control into HEK293T cells for 24 hours. Following transfection, measurement and normalization of the quantified relative luciferase activity to the Renilla luciferase activity were executed. The number of replicates for each experiment was set at three.
Statistical Analysis
Data analysis was conducted using IBM SPSS Statistics for Windows (IBM Corp., Armonk, USA). The mean ± standard error of the mean (SEM) format was employed for data presentation. Each experiment was repeated independently three times. The normality of distributions was assessed using the Shapiro–Wilk test. A t-test was utilized for normally distributed data, while a rank sum test was used for non-normally distributed data. Group comparisons were performed using one-way analysis of variance (ANOVA) with a Tukey post-hoc test. All tests were two-tailed, with a significance level set at P < 0.05.
Results
Remarkable Downregulation by LINC00998 in Allergic Disease and Its Association with M2 Macrophage Activation
To examine the involvement of lncRNAs in allergic diseases, microarray data on allergic airway disease were retrieved from GEO (GSE165934). Utilizing the R “limma”, differentially expressed lncRNAs were determined in individuals with AR. Consistent with our expectations, remarkable variation was noted in the expression data of lncRNAs, with 136 upregulated and 78 downregulated lncRNAs (Figure 1A) in the GSE165934 dataset.
 |
Figure 1 Remarkable downregulation by LINC00998 in allergic disease and its association with M2 macrophage activation. (A) Volcano plots depicting the fold changes and significance of variation in LINC00998. (B and C) Validation of the relative mRNA expression level of ARG1 and CD206 in individuals with AR (n = 22) and healthy controls (n = 22) (B) as well as in the AR animal model (seven AR mice and seven controls) (C). (D) Validation of the relative RNA levels of LINC00998 in patients with AR (n = 22) and healthy controls (n = 22) through qRT-PCR. (E) Correlation analysis between lgE and LINC00998 and correlation analysis between CD206, ARG1, and LINC00998(Spearman rank correlation). *p <0.05, **p <0.01, ***p <0.001. Abbreviations: SEM, standard error of the mean, qRT-PCR, quantitative real-time polymerase chain reaction; iNOS, inducible nitric oxide synthase; LPS, lipopolysaccharide; IL, interleukin; siRNA, short-interfering RNA; OVA, ovalbumin; IFN, interferon; Ig, immunoglobulin. |
A total of 22 AR patients and 22 healthy individuals were included in the current analysis. The clinical characteristics of the participants are shown in Table S2, where groups are categorized according to whether or not they have AR. The mean ages of the Control group and AR group were 26.23±2.91 years old and 23.91±3.33 years old. Male-female ratios were 12/10 and 9/13. The average histories of AR among control group and AR group were 0 year and 1.88 ± 0.26 years, respectively.
Furthermore, we detected the expression of LINC00998 and M2 biomarkers in the PBMCs collected from 22 patients with AR and 22 control individuals using qRT-PCR. Our data showed that the expression levels of two M2-associated inflammatory molecules, ARG1 and CD206, were lowered in PBMCs of individuals with AR in comparison with controls (Figure 1B) (p <0.05 and p<0.001), as well as in spleen tissue of AR mice relative to control mice (AR vs control mice, 7 vs 7) (p <0.05 and p<0.05) (Figure 1C), which both suggested the role of type 2 inflammation in AR. And consistent with the microarray data, LINC00998 expression was remarkably attenuated in PBMCs of individuals with AR in contrast to control individuals (p <0.01) (Figure 1D). We also observed a negative correlation between LINC00998 and lgE (R=−0.67, p=0.0013) (Figure 1E), a vital player in the pathogenesis of atopic diseases and an indicator of allergic inflammation.13 Additionally, it was noted that LINC00998 was negatively correlated with ARG1 and CD206 (R=−0.64, p=0.0018 and R=−0.49, p=0.0021) (Figure 1E). These outcomes indicated that the reduction of LINC00998 may contribute to M2-related inflammation.
LINC00998 Expression is Remarkably Enhanced in LPS-Induced M1 Macrophages and Downregulated in IL-4, IL-13, and OVA-Induced M2 Macrophages
To assess the involvement of LINC00998 in macrophage polarization, THP-1 cells were stimulated to the polarized M1 phenotype through 24-hour exposure to LPS and to the M2 phenotype through 48-hour exposure to IL-4 and IL-13. Subsequently, the qRT-PCR assay confirmed the successful induction of M1 and M2 phenotype macrophages. The results of qRT-PCR demonstrated that M1 macrophage indicators, inducible nitric oxide synthase (iNOS), and CD80, were remarkably upregulated in macrophages exposed to LPS compared to the inactivated control (p <0.01 and p<0.01) (Figure 2A). Furthermore, compared to the control, M2 macrophage indicators CD206 and ARG1 were remarkably upregulated in macrophages treated with IL-4 and IL-13 (p <0.05 and p<0.01) (Figure 2A). Additionally, the surface markers CD80 (M1) and CD206 (M2) were detected using flow cytometry. It was observed that the CD80 levels were elevated in macrophages exposed to LPS in comparison with the control (p <0.01). Additionally, the expression of CD206 in macrophages was significantly upregulated when stimulated with IL-4 and IL-13 (p <0.01) (Figure 2B). These outcomes confirmed the successful induction of M1 and M2 macrophages.
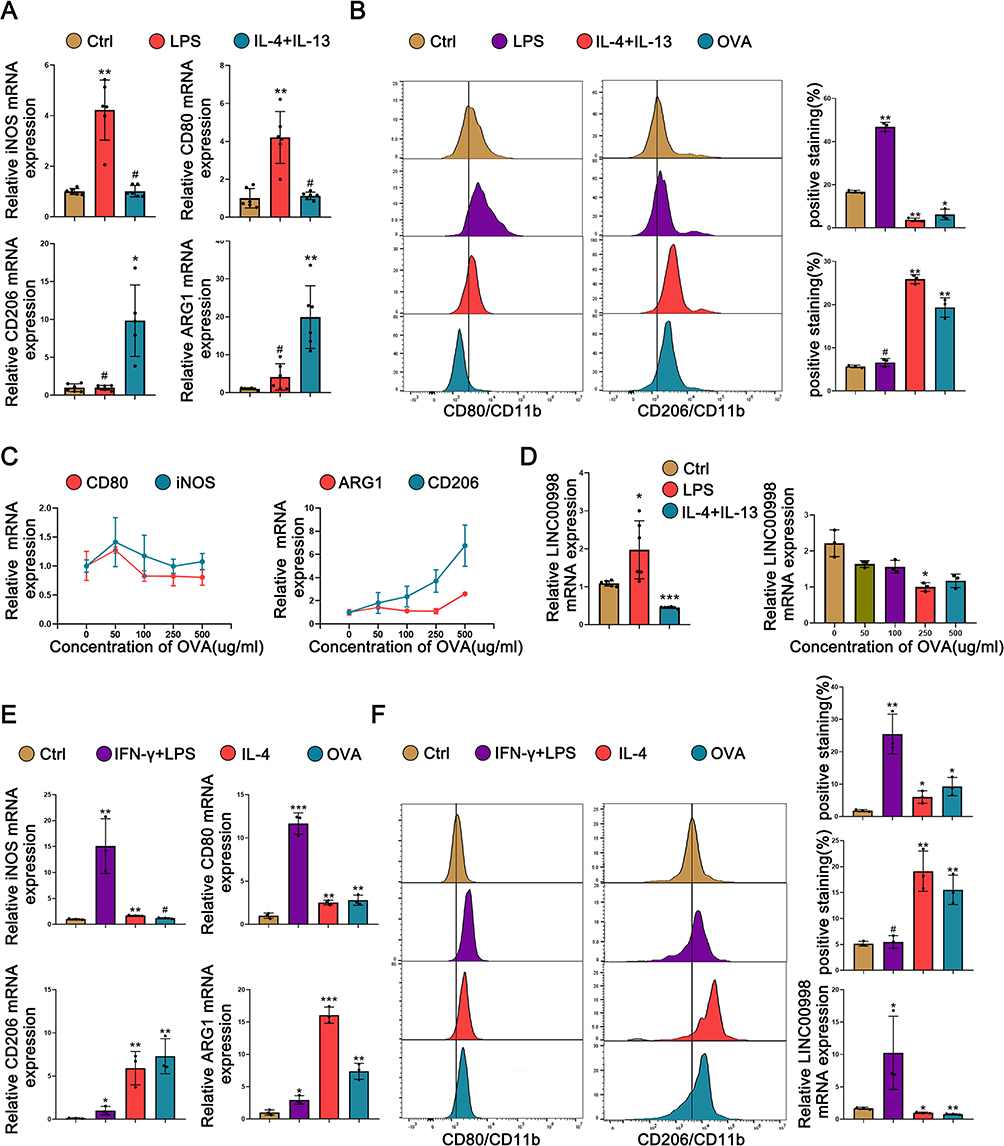 |
Figure 2 LINC00998 expression is remarkably enhanced in LPS-induced M1 macrophages and downregulated in IL-4, IL-13, and OVA-induced M2 macrophage. (A) qRT-PCR analysis demonstrates the levels of iNOS, CD80, CD206, and ARG1 in LPS-triggered M1 and IL-4 + IL-13-triggered M2 THP-1 cells. (B) The flow cytometry analysis exhibits the surface expression of CD80 and CD206 in LPS-triggered M1 and IL-4+ IL-13, and OVA (500 μg/mL)-triggered M2 THP-1 cells. (C) qRT-PCR analysis shows the LINC00998 levels in THP-1 cells exposed to varying concentrations of OVA (50–500 μg/mL) for 48 hours. The internal control was set as β-actin. (D) qRT-PCR analysis shows the relative RNA expression of LINC00998 in THP-1 cells treated with LPS, IL-4+ IL-13, and various concentrations of OVA (50–500 μg/mL) for 48 hours. (E) qRT-PCR shows the relative expression of the mRNA of iNOS, CD80, CD206, and ARG1 in LPS-triggered M1 and IL-4+IL-13, and OVA (500 μg/mL)-triggered M2 human macrophages. β-actin was used as an internal control. (F) The flow cytometry analysis shows the surface expression of CD80 and CD206 in LPS+IFN-γ-induced M1 human primary macrophages and IL-4 and OVA (500 μg/mL)-induced M2 human primary macrophages. qRT-PCR analysis shows the LINC00998 levels in human primary macrophages treated with IFN-γ, IL-4, and OVA (500 μg/mL) for 48 hours. β-actin served as an internal control. The format of mean ± SEMs from at least 3 independent experiments is utilized for presenting the data. *p <0.05, **p <0.01, ***p <0.001, #No significance. |
To simulate an allergic response at the cellular level, varying concentrations of OVA (50–500 μg/mL) were utilized to treat the THP-1 cells for 48 hours to assess the impact of treatment with OVA on macrophage polarization. The data indicated that the expression of M2 macrophage indicators, CD206 and ARG1, was enhanced as the concentration of OVA stimulation on THP-1 cells increased. However, the expression of M1 macrophage indicators, iNOS and CD80, did not show remarkable changes (Figure 2C). This finding suggests that higher concentrations of OVA can enhance macrophage polarization toward the M2 phenotype. Furthermore, the data demonstrated that the LINC00998 level was downregulated with increasing concentrations of OVA (Figure 2D). It was also noted that LINC00998 was under upregulation in M1 macrophages treated with LPS and downregulated in M2 macrophages exposed to IL-4 and IL-13 (p <0.05 and p<0.001) (Figure 2D). These findings show that LINC00998 might participate in the regulation of macrophage polarization. Similar results were obtained in human primary macrophages, supporting the consistency of our findings (Figures 2E and F).
Overexpression or Knockdown of LINC00998 Correlate with M1/M2 Balance
To investigate the involvement of LINC00998 in macrophage polarization, gain- and loss-of-function experiments were constructed with LINC00998 in THP-1 cells. This was achieved by transfecting the LINC00998 LV and LINC00998 siRNA. To confirm the effectiveness of the transfection, an immunofluorescence examination and qRT-PCR analysis was executed. The transfection efficiency of LINC00998 LV was both >80% (Figures 3A). Furthermore, the qRT-PCR analysis demonstrated that LINC00998 LV transfection remarkably enhanced the expression of LINC00998(p <0.001). Subsequently, THP-1 cells transfected with LINC00998 LV were induced to M2 macrophage polarization. The overexpression of LINC00998 decreased the percentage of CD206+ cells and elevated the count of CD80+ cells (p <0.01 and p<0.01) (Figure 3B). Consistent with the results of flow cytometry, the overexpression of LINC00998 elevated the mRNA levels of M1 markers (iNOS and CD80) (p <0.01 and p<0.01) and reduced the mRNA expression of CD206 in comparison with the negative control (NC) group (p <0.01) (Figure 3C).
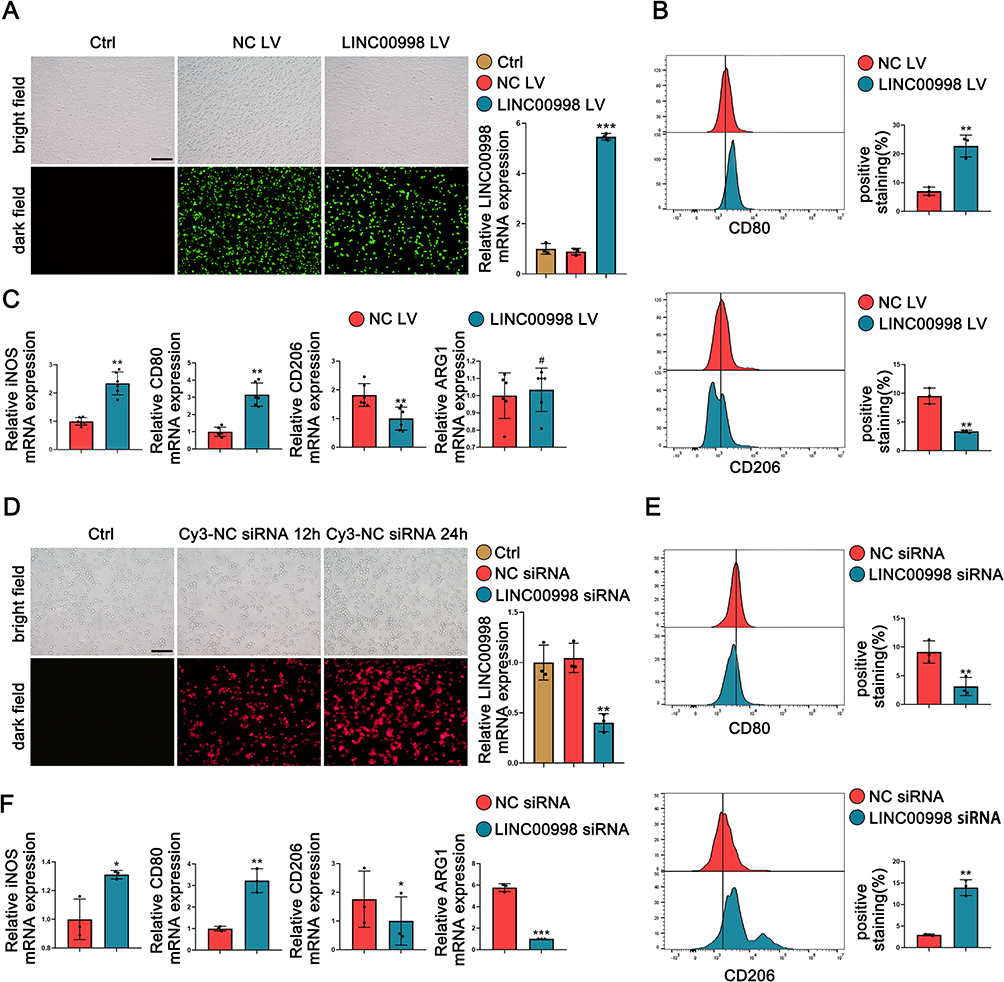 |
Figure 3 Overexpression or knockdown of LINC00998 correlate with M1/M2 balance. THP-1 cells are transfected with LINC00998 siRNA, NC siRNA, LINC00998 LV, or NC LV, respectively. Then, THP-1 cells transfected with LINC00998 siRNA and NC siRNA are subjected to 100 ng/mL of LPS for 24 hours, whereas THP-1 cells transfected with LINC00998 LV and NC LV are treated with 20 ng/mL IL-4+20 ng/mL IL-13 for 48 hours. (A and D) The efficiency of siRNA transfection and LV overexpression was assessed through immunofluorescence analysis and qRT-PCR assays. Scale bar = 200 µM (A) and 100 µM (D). (B and E) The results of flow cytometry analysis show the surface expression of CD80 and CD206. (C and F) The results of qRT-PCR analysis show the relative mRNA expression of iNOS, CD80, CD206, and ARG1. The format of mean ± SEMs from at least 3 independent experiments is utilized for presenting the data. *p <0.05, **p <0.01, ***p <0.001, #No significance. |
We silenced LINCC0098 expression in THP-1 cells using LINC00998 siRNA (Figure 3D). LINC00998 suppression exhibited an inhibitory effect on M1 macrophage polarization and a promotive impact on M2 macrophage polarization in THP-1 cells. Inhibition of the expression of LINC00998 increased the percentage of CD206+ cells and decreased the count of CD80+ cells when treated with LPS (p <0.01 and p<0.01) (Figure 3E). In comparison with the NC group, the knockdown of LINC00998 enhanced the mRNA expression of M1 markers (p <0.05 and p<0.01) and attenuated the mRNA expression of M2 markers (p <0.05 and p<0.001) (Figure 3F). These findings indicated that the LINC00998 deficiency promoted M2 macrophage polarization.
LINC0098 Regulates Macrophage Polarization by Stabilizing BOB.1 mRNA
Furthermore, through bioinformatics analysis, it was discovered that BOB.1 mRNA contained conserved target sites for LINC00998 (Figure 4A). Given that lncRNAs have been known to function as mRNA stabilizers,14–16 we investigated whether LINC00998 could bind to and stabilize BOB.1 mRNA. Consistent with our expectations, bioinformatics predictions showed that LINC00998 is predominantly expressed in the cytoplasm (Figure S2) and that the decay rate of BOB.1 mRNA was attenuated in LINC00998 LV-infected cells (Figure 4B). Moreover, a luciferase reporter analysis revealed that pc-DNA3.1 LINC00998 increased the activity of BOB.1 mRNA 3′-untranslated regions (3’ UTRs) (Figure 4C). These findings collectively suggest that LINC00998 may directly bind to BOB.1 mRNA to modulate its expression level.
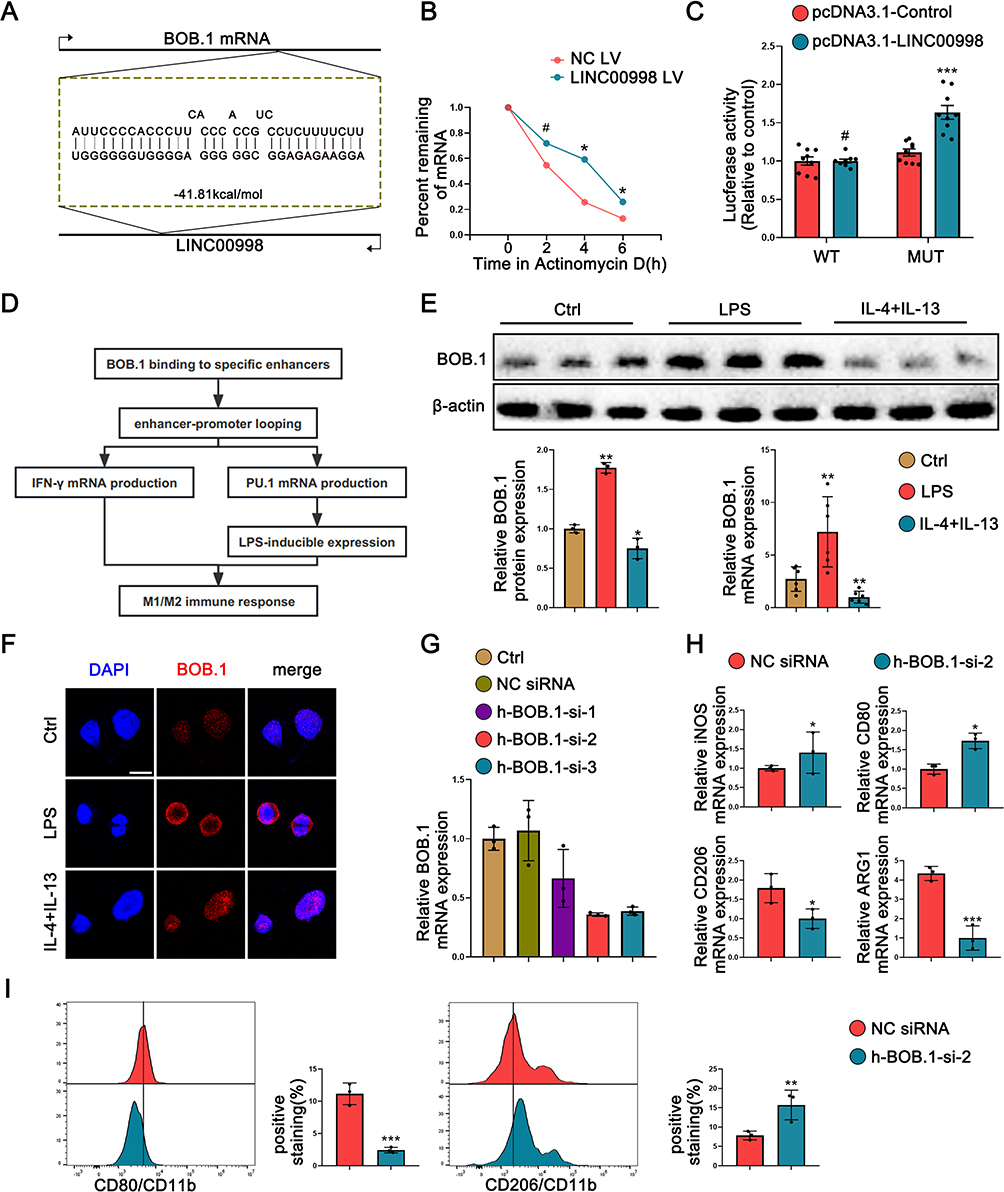 |
Figure 4 LINC0098 regulates macrophage polarization by stabilizing BOB.1 mRNA. (A) A schematic diagram illustrates one of the potential binding sites of LINC0098 on BOB.1 mRNA 3’UTR. (B) RNA-stability analysis was performed in LINC0098-overexpressed cells. mRNA levels of BOB.1 were quantified at various time points utilizing qRT-PCR. (C) Luciferase reporter gene assays were conducted to verify the association between BOB.1 mRNA 3’UTR and LINC0098 in 293T cells. (D) Proposed sequence of events involved in the M1/M2 immune response through specific enhancer binding by BOB.1. (E and F) Immunofluorescence analysis, Western blot, and qRT-PCR show subcellular localization (F) and expression (E) of BOB.1 in THP-1 cells treated with LPS and IL-4 + IL-13 respectively. Scale bar = 5 µM. (G) qRT-PCR assay verified the transfection efficiency of BOB.1 siRNAs. (H) The qRT-PCR analysis reveals the relative mRNA expression levels of iNOS, CD80, CD206, and ARG1 in h-BOB.1-si-2-transfected THP-1 cells. (I) Flow cytometry analysis reveals the surface expression of CD80 and CD206 in h-BOB.1-si-2-transfected THP-1 cells. The format of mean ± SEMs from at least 3 independent experiments is utilized for presenting the data. *p <0.05, **p <0.01, ***p <0.001, #No significance. |
BOB.1, traditionally recognized as a B cell-specific factor, has been increasingly acknowledged for its crucial role in the T-cell compartment.17 However, its biological function in macrophages has remained elusive. BOB.1 serves as a regulatory molecule in immune cells by enhancing octamer-dependent transcription, directly activating the IFN-γ promoter, and influencing the expression of PU.1,18 all of which have an impact on the balance between M1 and M2 macrophages. Taking these facts into consideration, we hypothesized that BOB.1 might function as a regulator of macrophage polarization (Figure 4D). Consistent with our prediction, we observed that BOB.1 was upregulated in M1 macrophages treated with LPS and downregulated in M2 macrophages treated with IL-4 and IL-13 (Figure 4E), which predominantly expressed in the nucleus of macrophage cells (Figure 4F).
To further explore whether BOB.1 is a potential target of LINC00998 and how it influences macrophage polarization, three siRNAs (h-BOB.1-si-1, h-BOB.1-si-2, and h-BOB.1-si-3) targeting BOB.1 were designed based on the RNA sequence. Among these, h-BOB.1-si-2 led to an approximate 60% reduction in BOB.1 mRNA expression, prompting us to select h-BOB.1-si-2 as the inhibitor of BOB.1 mRNA (Figure 4G). As anticipated, the resulting data of qRT-PCR depicted that h-BOB.1-si-2 increased the levels of mRNA of two M1 markers (p <0.05 and p<0.05) and reduced the mRNA expression of M2-related genes in THP-1 cells treated with IL-4 and IL-13 as compared to the NC siRNA group (p <0.05 and p<0.001) (Figure 4H). Furthermore, flow cytometry indicated that the CD80 expression was attenuated while the CD206 levels were elevated in IL-4- and IL-13-treated THP-1 cells transfected with h-BOB.1-si-2 (p <0.001 and p<0.01) (Figure 4I). Overall, these data proposed that BOB.1 may hold promise as a regulatory marker in macrophage polarization and that its expression is influenced by LINC00998.
PU.1/IL-1β is Related to M1 or M2 Macrophage Polarization and is Downregulated by the Knockdown of BOB.1
Based on the aforementioned results, the research demonstrated that the knockdown of BOB.1 contributes to M2 macrophage polarization. To investigate whether BOB.1 regulates macrophage polarization through PU.1 and IL-1β, we first determined the expression status of PU.1 and IL-1β in THP-1 cells. Western blot and qRT-PCR analyses were conducted. Compared to the control group, treatment with LPS increased the relative expression of PU.1 and IL-1β, whereas treatment with IL-4 and IL-13 reduced their expression levels (Figures 5A and B). Subsequently, immunofluorescence indicated that PU.1 was predominantly expressed in the nucleus, while IL-1β was mainly localized in the cytoplasm (Figure 5C).
 |
Figure 5 PU.1/IL-1β is related to M1 or M2 macrophage polarization and is downregulated by the knockdown of BOB.1. (A and B) Western blot (A) and qRT-PCR (B) analyses are executed to demonstrate the expression of PU.1 and IL-1β in THP-1 cells treated with LPS and IL-4 + IL-13, respectively. (C) Immunofluorescence analysis shows the subcellular localization of PU.1 and IL-1β in THP-1 cells. Scale bar = 5 µM. Subsequently, THP-1 cells are transfected with h-BOB.1-si-2 and NC siRNA, and these cells are treated with 100 ng/mL of LPS for 24 hours. (D and E) Western blot (D) and qRT-PCR (E) analyses show the relative mRNA expression of BOB.1, PU.1, and IL-1β. The format of mean ± SEMs from at least 3 independent experiments is utilized for presenting the data. *p <0.05, **p <0.01. |
To further confirm that PU.1 and IL-1β are potential targets of BOB.1, h-BOB.1-si-2 were transfected into THP-1 cells. As anticipated, our results demonstrated that the deficiency of BOB.1 downregulated the expression levels of PU.1 and IL-1β in THP-1 cells (Figure 5D and E).
Overexpression or Knockdown of LINC00998 Correlate with the Expression of BOB.1/PU.1/ IL-1β
To investigate the impact of LINC00998 on the downstream axis BOB.1/PU.1/IL-1β, overexpression and knockdown experiments targeting LINC00998 were conducted. In THP-1 cells cultured with only 50 ng/mL PMA treatment for 24h, Western blotting and qRT-PCR analyses suggested that the levels of BOB.1, PU.1, and IL-1β protein and mRNA were elevated in the LINC00998 LV group (Western blotting: p <0.01, p <0.05 and p<0.01; qRT-PCR: p <0.01, p <0.05 and p<0.01), while they were reduced in the LINC00998 siRNA group in comparison with the control group (Western blotting: p <0.001, p <0.05 and p<0.01; qRT-PCR: p <0.001, p <0.01 and p<0.001) (Figure 6A–D). Additionally, the results obtained from immunofluorescence analysis corroborated the above-mentioned experimental findings (Figure 6E).
 |
Figure 6 Overexpression or knockdown of LINC00998 correlate with the expression of BOB.1/PU.1/ IL-1β. (A–D) Western blot (A and B) and qRT-PCR (C and D) show the expression levels of BOB.1, PU.1, and IL-1β in THP-1 cells with the knockdown or overexpression of LINC00998. (E) immunofluorescence assay detects the expressions of BOB.1, PU.1, and IL-1β in LINC00998-overexpressed THP-1 cell lines and controls. Scale bar = 50 uM. The format of mean ± SEMs from at least 3 independent experiments is utilized for presenting the data. *p <0.05, **p <0.01, ***p <0.001. |
Knockdown of BOB.1 Facilitates M2 Macrophage Polarization and Reverses M1 Macrophage Polarization Triggered by Overexpressing LINC00998
Since we have established that BOB.1 is a direct target of LINC00998 and that BOB.1/PU.1/IL-1β plays a role in macrophage polarization, the regulatory impact of the LINC00998/BOB.1/PU.1/IL-1β axis was explored. The following groups were established for this study: NC LV + NC siRNA, LINC00998 LV + NC siRNA, and LINC00998 LV + h-BOB.1-si-2. Flow cytometry and qRT-PCR analyses were conducted to assess the polarization states of each group. The results indicated that M2-related genes were enhanced in the LINC00998 LV + h-BOB.1-si-2 group, while M1-related genes were inhibited compared to the LINC00998 LV + NC siRNA group. Thus, these findings indicate that transfection with h-BOB.1-si-2 relieved the suppression of M2 macrophage polarization induced by the overexpression of LINC00998 (Figures 7A and B). Furthermore, the results of Western blotting and qRT-PCR analyses consistently demonstrated significant BOB.1/PU.1/IL-1β axis activation due to the overexpression of LINC00998, distinguishing it from the NC LV + NC siRNA and LINC00998 LV + h-BOB.1-si-2 groups. This suggests that the h-BOB.1-si-2 transfection promoted the suppression of M2 polarization caused by the overexpression of LINC00998 (Figures 7C and D).
 |
Figure 7 Knockdown of BOB.1 facilitates M2 macrophage polarization and reverses M1 macrophage polarization triggered by overexpressing LINC00998. Transfection of THP-1 cells with NC LV + NC siRNA, LINC0098 LV + NC siRNA, and LINC0098 LV + h-BOB.1-si-2, respectively. The transfected THP-1 cells are then treated with 20 ng/mL of IL-4 and 20 ng/mL of IL-13 for 48 hours. Flow cytometry (A) is conducted to assess the surface expression of CD80 and CD206. qRT-PCR (B) is carried out to measure the relative mRNA expression levels of iNOS, CD80, CD206, and ARG1. (C and D) Western blot (C) and qRT-PCR (D) are employed to assess the relative expression levels of BOB.1, PU.1, and IL-1β. The format of mean ± SEMs from at least 3 independent experiments is utilized for presenting the data. *p <0.05, **p <0.01, ***p <0.001. |
Discussion
Being a chronic inflammatory illness, AR is a serious threat to public health. It has been established that lncRNAs regulate inflammatory diseases including AR.11,12 Herein, the differential expression profiles of lncRNAs in AR were analyzed using microarray data from GEO. In an initial examination, we found that revealed that LINC00998 was under remarkable downregulation in in the PBMCs of AR patients. We intended to investigate potential correlations between AR and LINC00998.
In our following analysis, it is shown that in AR patients, LINC00998 had a negative correlation with lgE levels. lgE is released by B cells and plasma cells (generally) in reaction to an antigenic stimulus. Induced by IL-4 and IL-13, Immunoglobulin class switching from other isotypes to IgE.19 It is frequently detected circulating in the blood with a short half-life of roughly two days and bound to a wide variety of cell types via its receptors.20 Hence, serum lgE level is commonly used to evaluate the severity of allergic inflammation. The negative relationship between lgE and our target gene suggested a potential role for LINC00998 in the type-2 inflammatory response.
Acknowledgement of immune cells’ heterogeneity would lead to a deeper comprehension of the pathophysiology of AR and the developing of mechanism-oriented precision treatments. Notable advancements have recently been found to better understand the function of different immune cells in AR such as type 2 innate lymphocytes (ILC2s) and basophils, which contributed to this early production of type-2 inflammatory cytokines especially IL-4.21–23 Clinical and animal model studies have consistently exhibited a positive association between elevated levels of M2 macrophages, which are significantly involved in the onset and progression of allergic diseases, and the severity of allergies.24–27 Due to the high plasticity of macrophages,28 there are various intriguing strategies to alter the M1/M2 balance, such as utilizing monoclonal antibodies targeting Fc-gamma receptor (FcγRI)29 or employing adoptive polarized macrophage transfer therapy.30,31 Remarkably, increasing evidence indicates that ncRNAs exert complex and precise regulatory functions in allergic diseases, acting as promotors or suppressors of M2 macrophages.32,33 Furthermore, studies on ncRNA-based therapies for modulating macrophage polarization in autoimmune disorders are currently underway.34
We discovered that the expression level of LIN00998 is positively linked to M2-specific biomarker (CD206 and ARG1). We examined LINC00998 expression in both M1 and M2 phenotype macrophages in vitro. LINC00998 is markedly increased in M1 macrophages whereas decreased in M2 macrophages. It was also found that the overexpression of LINC00998 in macrophages using LV led to a reduction in the expression of CD206 while increasing the production of M1-specific molecules, such as iNOS and CD80. Conversely, the knockdown of LINC00998 using siRNAs in macrophages reversed these effects. These findings indicate that decreased levels of LINC00998 exacerbate allergic inflammation triggered by allergens by promoting M2 macrophage polarization. M2 macrophages produce IL-10 and IL-13 and further stimulate the recruitment of eosinophils and the differentiation of Th2 cells,35 which influenced the switch of lgE from other immunoglobulin isotypes.
Then we intended to explore the way LINC00098 modulates macrophage polarization. LncRNAs are recognized as crucial regulators of gene expression, influencing various physiological and pathological processes.36 They exert their regulatory effects by modulating transcriptional levels, translation, and mRNA stability.37 In the study, bioinformatics predictions were conducted, which revealed that LINC00998 is predominantly expressed in the cytoplasm, where it interacts with BOB.1 mRNA (Figure S2). Furthermore, multiple binding sites were identified between LINC00998 and the BOB.1 mRNA 3’UTR (Figure S3). Through gain- and loss-of-function experimental techniques, it was determined that the expression of LINC00998 directly impacts the levels of mRNA and protein of BOB.1, indicating that LINC00998 plays a regulatory function in controlling the expression of BOB.1. Furthermore, the RNA stability analysis and dual luciferase reporter assay indicated that LINC00998 forms a duplex with BOB.1 mRNA, leading to the stabilization of BOB.1 mRNA and subsequently increasing its expression level. Additionally, since RNA-binding proteins (RBPs) can also influence mRNA stability by directly binding to mRNA 3’UTRs and can be recruited by lncRNAs, it would be valuable to determine if RBPs participate in the LINC00998-mediated modulation of BOB.1 mRNA stemness in future studies.
BOB.1/OBF.1 is a lymphocyte-specific transcriptional co-activator involved in octamer-dependent transcription. Several studies have demonstrated the role of BOB.1 in various diseases, including rheumatoid arthritis,38 primary biliary cirrhosis,39 and multiple sclerosis.40 However, its biological function in allergic diseases remains unknown. Previous studies have shown that BOB.1 deficiency leads to reduced production of Th1 cytokines and increased production of Th2 cytokines. This effect is achieved through cooperative binding with OCT1 to the IFN-γ and IL-2 promoters, resulting in an imbalance between Th1 and Th2 responses.18 Moreover, IFN-γ, a stimulator involved in M1 macrophage polarization within the microenvironment, is a direct target of BOB.1.6 In addition to IFN-γ and IL-2, another significant target of BOB.1 is the transcriptional factor PU.1, which has been linked to macrophage activation.41 Several studies have reported that PU.1 promotes the toll-like receptor (TLR4) promoter,42 and is required for NF-kB recruitment and subsequent H3K27ac, both of which regulate the transcription of IL-1β mRNA.43,44
The main strength of this research is that we offered evidences of a new LncRNA aberrantly expressed in PBMCs of AR patients and regulated the macrophage polarization. However, the present study has various limitations. Firstly, more clinical research with a larger sample size is necessary because of the study’s small sample size. Secondly, the current study did not exclude the possibility of LINC00998 affecting other genes associated with AR, necessitating further investigation. Thirdly, a deeper understanding of ncRNAs holds promise for the development of diagnostic tools and treatments for AR is needed. Several other lncRNAs, including lncRNA HCP5,45 LncRNA MIAT,46 lncRNA NEAT1,47 MALAT1,48 lnc-THRIL,49 Linc00632,50 HOTAIRM1,51 have been implicated in the pathogenesis of AR. Further research is required to confirm whether these lncRNAs interconnect and form a regulatory network that precisely controls the onset and severity of AR. Additionally, investigating the potential of combining these lncRNAs for improved prediction and diagnosis of AR would be an avenue for future research.
In conclusion, the findings indicate that decreased levels of LINC00998 enhanced the severity of AR by promoting M2 macrophage polarization through the BOB.1/PU.1/IL-1β axis. Maintaining a balance of macrophage polarization to prevent allergic inflammation has been thought for AR treatment approaches, Therefore, LINC00998 may serve as a potential diagnostic molecular marker and therapeutic target for patients with AR.
Ethical Statement
The study was conducted in accordance with the Declaration of Helsinki and was approved by the institutional ethical review board of Renmin Hospital of Wuhan University (approval WDRY2018-K052). Written informed consent to participate in this study was provided by all adult subjects (above 18) or children (under 18)’ legal guardian. The animal study strictly followed the Guidelines for the Care and Use of Laboratory Animals and approved by Institutional Animal Care and Animal Use Committee of the Renmin Hospital of Wuhan University (License No.: WDRM-20200602).
Acknowledgments
This study was supported by National Natural Science Foundation of China, grant number 81970860.
Disclosure
The authors report no conflicts of interest in this work.
References
1. Brozek JL, Bousquet J, Agache I, et al. Allergic rhinitis and its impact on asthma (ARIA) guidelines-2016 revision. J Allergy Clin Immunol. 2017;140(4):950–958. doi:10.1016/j.jaci.2017.03.050
2. Bousquet J, Anto JM, Bachert C, et al. Allergic rhinitis. Nat Rev Dis Primers. 2020;6(1):95. doi:10.1038/s41572-020-00227-0
3. Tomazic PV, Lang-Loidolt D. Current and emerging pharmacotherapy for pediatric allergic rhinitis. Expert Opin Pharmacother. 2021;22(7):849–855. doi:10.1080/14656566.2020.1808622
4. Di Lorenzo G, Di Bona D, Belluzzo F, et al. Immunological and non-immunological mechanisms of allergic diseases in the elderly: biological and clinical characteristics. Immun Ageing. 2017;14:23. doi:10.1186/s12979-017-0105-4
5. Wang A, Singh K, Ibrahim W, et al. The promise of JAK inhibitors for treatment of sarcoidosis and other inflammatory disorders with macrophage activation: a review of the literature. Yale J Biol Med. 2020;93(1):187–195.
6. Shapouri-Moghaddam A, Mohammadian S, Vazini H, et al. Macrophage plasticity, polarization, and function in health and disease. J Cell Physiol. 2018;233(9):6425–6440. doi:10.1002/jcp.26429
7. Ivashkiv LB. Epigenetic regulation of macrophage polarization and function. Trends Immunol. 2013;34(5):216–223. doi:10.1016/j.it.2012.11.001
8. Saradna A, Do DC, Kumar S, et al. Macrophage polarization and allergic asthma. Transl Res. 2018;191:1–14. doi:10.1016/j.trsl.2017.09.002
9. Ogulur I, Pat Y, Ardicli O, et al. Advances and highlights in biomarkers of allergic diseases. Allergy. 2021;76(12):3659–3686. doi:10.1111/all.15089
10. Huang Y. The novel regulatory role of lncRNA-miRNA-mRNA axis in cardiovascular diseases. J Cell Mol Med. 2018;22(12):5768–5775. doi:10.1111/jcmm.13866
11. Guidi R, Wedeles CJ, Wilson MS. ncRNAs in Type-2 Immunity. Noncoding RNA. 2020;6(1):10. doi:10.3390/ncrna6010010
12. Xu F, Jin L, Jin Y, et al. Long noncoding RNAs in autoimmune diseases. J Biomed Mater Res A. 2019;107(2):468–475. doi:10.1002/jbm.a.36562
13. Ribatti D. The discovery of immunoglobulin E. Immunol Lett. 2016;171:1–4. doi:10.1016/j.imlet.2016.01.001
14. Xiao Y, Pan J, Geng Q, et al. Retracted: lnc RNA MALAT 1 increases the stemness of gastric cancer cells via enhancing SOX 2 mRNA stability. FEBS Open Bio. 2019;9(7):1212–1222. doi:10.1002/2211-5463.12649
15. Wu H, He Y, Chen H, et al. Retracted: lnc RNA THOR increases osteosarcoma cell stemness and migration by enhancing SOX 9 mRNA stability. FEBS Open Bio. 2019;9(4):781–790. doi:10.1002/2211-5463.12620
16. Mao C, Li X. Long noncoding RNA OIP5-AS1 promotes the stemness of lung cancer cells through enhancing Oct4 mRNA stability. Environ Toxicol: Int J. 2022;37(5):1104–1112. doi:10.1002/tox.23468
17. Yeremenko N, Danger R, Baeten D, et al. Transcriptional regulator BOB.1: molecular mechanisms and emerging role in chronic inflammation and autoimmunity. Autoimmun Rev. 2021;20(6):102833. doi:10.1016/j.autrev.2021.102833
18. Brunner C, Sindrilaru A, Girkontaite I, et al. BOB.1/OBF.1 controls the balance of TH1 and TH2 immune responses. EMBO J. 2007;26(13):3191–3202. doi:10.1038/sj.emboj.7601742
19. Kelly BT, Grayson MH. Immunoglobulin E, what is it good for? Ann Allergy Asthma Immunol. 2016;116(3):183–187. doi:10.1016/j.anai.2015.10.026
20. Waldmann TA, Sherwood LM, Parris EE. Disorders of immunoglobulin metabolism. N Engl J Med. 1969;281(21):1170–1177. doi:10.1056/NEJM196911202812107
21. Zhang Y, Lan F, Zhang L. Update on pathomechanisms and treatments in allergic rhinitis. Allergy. 2022;77(11):3309–3319. doi:10.1111/all.15454
22. Poddighe D, Mathias CB, Brambilla I, Marseglia GL, Oettgen HC. Importance of basophils in eosinophilic asthma: the murine counterpart. J Biol Regul Homeost Agents. 2018;32(2):335–339.
23. van Rijt L, von Richthofen H, van Ree R. Type 2 innate lymphoid cells: at the cross-roads in allergic asthma. Semin Immunopathol. 2016;38(4):483–496. doi:10.1007/s00281-016-0556-2
24. Chupp GL, Lee CG, Jarjour N, et al. A chitinase-like protein in the lung and circulation of patients with severe asthma. N Engl J Med. 2007;357(20):2016–2027. doi:10.1056/NEJMoa073600
25. Ford AQ, Dasgupta P, Mikhailenko I, et al. Adoptive transfer of IL-4Ralpha+ macrophages is sufficient to enhance eosinophilic inflammation in a mouse model of allergic lung inflammation. BMC Immunol. 2012;13:6. doi:10.1186/1471-2172-13-6
26. Draijer C, Robbe P, Boorsma CE, et al. Characterization of macrophage phenotypes in three murine models of house-dust-mite-induced asthma. Mediators Inflamm. 2013;2013:632049. doi:10.1155/2013/632049
27. Melgert BN, ten Hacken NH, Rutgers B, et al. More alternative activation of macrophages in lungs of asthmatic patients. J Allergy Clin Immunol. 2011;127(3):831–833. doi:10.1016/j.jaci.2010.10.045
28. Funes SC, Rios M, Escobar‐Vera J, et al. Implications of macrophage polarization in autoimmunity. Immunology. 2018;154(2):186–195. doi:10.1111/imm.12910
29. Akinrinmade OA, Chetty S, Daramola AK, et al. CD64: an attractive immunotherapeutic target for M1-type macrophage mediated chronic inflammatory diseases. Biomedicines. 2017;5(3):56. doi:10.3390/biomedicines5030056
30. Ma SF, Chen Y-J, Zhang J-X, et al. Adoptive transfer of M2 macrophages promotes locomotor recovery in adult rats after spinal cord injury. Brain Behav Immun. 2015;45:157–170. doi:10.1016/j.bbi.2014.11.007
31. Harusato A, Naito Y, Takagi T, et al. BTB and CNC homolog 1 (Bach1) deficiency ameliorates TNBS colitis in mice: role of M2 macrophages and heme oxygenase-1. Inflamm Bowel Dis. 2013;19(4):740–753. doi:10.1097/MIB.0b013e3182802968
32. Xia L, Wang X, Liu L, et al. lnc-BAZ2B promotes M2 macrophage activation and inflammation in children with asthma through stabilizing BAZ2B pre-mRNA. J Allergy Clin Immunol. 2021;147(3):921–932.e9. doi:10.1016/j.jaci.2020.06.034
33. Han X, Huang S, Xue P, et al. LncRNA PTPRE-AS1 modulates M2 macrophage activation and inflammatory diseases by epigenetic promotion of PTPRE. Sci Adv. 2019;5(12):x9230. doi:10.1126/sciadv.aax9230
34. Self-Fordham JB. MicroRNA: dynamic regulators of macrophage polarization and plasticity. Front Immunol. 2017;8:1062.
35. Nagarkar DR, Bowman ER, Schneider D, et al. Rhinovirus infection of allergen-sensitized and -challenged mice induces eotaxin release from functionally polarized macrophages. J Immunol. 2010;185(4):2525–2535. doi:10.4049/jimmunol.1000286
36. Fatica A, Bozzoni I. Long non-coding RNAs: new players in cell differentiation and development. Nat Rev Genet. 2014;15(1):7–21. doi:10.1038/nrg3606
37. Wang KC, Chang HY. Molecular mechanisms of long noncoding RNAs. Mol Cell. 2011;43(6):904–914.
38. Maurano MT, Humbert R, Rynes E, et al. Systematic localization of common disease-associated variation in regulatory DNA. Science. 2012;337(6099):1190–1195. doi:10.1126/science.1222794
39. Nakamura M, Nishida N, Kawashima M, et al. Genome-wide association study identifies TNFSF15 and POU2AF1 as susceptibility loci for primary biliary cirrhosis in the Japanese population. Am J Hum Genet. 2012;91(4):721–728. doi:10.1016/j.ajhg.2012.08.010
40. Ban M. Linkage disequilibrium screening for multiple sclerosis implicates JAG1 and POU2AF1 as susceptibility genes in Europeans. J Neuroimmunol. 2006;179(1–2):108–116. doi:10.1016/j.jneuroim.2006.06.003
41. Shakerian L, Ghorbani S, Talebi F, et al. MicroRNA-150 targets PU.1 and regulates macrophage differentiation and function in experimental autoimmune encephalomyelitis. J Neuroimmunol. 2018;323:167–174. doi:10.1016/j.jneuroim.2018.06.010
42. Ueno N, Nishimura N, Ueno S, et al. PU.1 acts as tumor suppressor for myeloma cells through direct transcriptional repression of IRF4. Oncogene. 2017;36(31):4481–4497.
43. Marecki S, Riendeau CJ, Liang MD, et al. PU.1 and multiple IFN regulatory factor proteins synergize to mediate transcriptional activation of the human IL-1 beta gene. J Immunol. 2001;166(11):6829–6838. doi:10.4049/jimmunol.166.11.6829
44. Ha SD, Cho W, DeKoter RP, et al. The transcription factor PU.1 mediates enhancer-promoter looping that is required for IL-1beta eRNA and mRNA transcription in mouse melanoma and macrophage cell lines. J Biol Chem. 2019;294(46):17487–17500. doi:10.1074/jbc.RA119.010149
45. Yang C, Shangguan C, Cai C, et al. LncRNA HCP5 participates in the tregs functions in allergic rhinitis and drives airway mucosal inflammatory response in the nasal epithelial cells. Inflammation. 2022;45(3):1281–1297. doi:10.1007/s10753-022-01620-5
46. Ma Z, Lian H, Lin X, et al. LncRNA MIAT promotes allergic inflammation and symptoms by targeting MiR-10b-5p in allergic rhinitis mice. Am J Rhinol Allergy. 2021;35(6):781–789. doi:10.1177/1945892421998143
47. Wu X, Zhao S, Huang W, et al. Aberrant expressions of circulating lncRNA NEAT1 and microRNA-125a are linked with Th2 cells and symptom severity in pediatric allergic rhinitis. J Clin Lab Anal. 2022;36(3):e24235. doi:10.1002/jcla.24235
48. Wu XH, Zhao SJ, Huang WQ, et al. Long non-coding RNA MALAT1 promotes Th2 differentiation by regulating microRNA-135b-5p/GATA-3 axis in children with allergic rhinitis. Kaohsiung J Med Sci. 2022;38(10):971–980.
49. Song J, Liu D, Yin W. lnc-THRIL and miR-125b relate to disease risk, severity, and imbalance of Th1 cells/Th2 cells in allergic rhinitis. Allergol Immunopathol. 2022;50(3):15–23. doi:10.15586/aei.v50i3.528
50. Yue L, Yin X, Hao F, et al. Long noncoding RNA linc00632 inhibits interleukin-13-induced inflammatory cytokine and mucus production in nasal epithelial cells. J Innate Immun. 2020;12(1):116–128. doi:10.1159/000500420
51. Li L, Deng J, Huang T, et al. IRF4 transcriptionally activate HOTAIRM1, which in turn regulates IRF4 expression, thereby affecting Th9 cell differentiation and involved in allergic rhinitis. Gene. 2022;813:146118. doi:10.1016/j.gene.2021.146118
 © 2024 The Author(s). This work is published and licensed by Dove Medical Press Limited. The
full terms of this license are available at https://www.dovepress.com/terms
and incorporate the Creative Commons Attribution
- Non Commercial (unported, 3.0) License.
By accessing the work you hereby accept the Terms. Non-commercial uses of the work are permitted
without any further permission from Dove Medical Press Limited, provided the work is properly
attributed. For permission for commercial use of this work, please see paragraphs 4.2 and 5 of our Terms.
© 2024 The Author(s). This work is published and licensed by Dove Medical Press Limited. The
full terms of this license are available at https://www.dovepress.com/terms
and incorporate the Creative Commons Attribution
- Non Commercial (unported, 3.0) License.
By accessing the work you hereby accept the Terms. Non-commercial uses of the work are permitted
without any further permission from Dove Medical Press Limited, provided the work is properly
attributed. For permission for commercial use of this work, please see paragraphs 4.2 and 5 of our Terms.
Recommended articles
Knowledge and Attitude Among Patients and Physicians on Allergic Rhinitis (KAPPA): An International Survey
Bhargave C, Verma M, Jakes RW, Okamoto Y
Journal of Asthma and Allergy 2022, 15:1645-1664
Published Date: 14 November 2022
Severity-Dependent Association Between Allergic Rhinitis and Adenoid Hypertrophy in Dust Mite–Sensitized Children from Northern China: A Cross-Sectional Analysis of 170 Cases
Zhao B, Wang Y, Zhang H, Jin P, Jia T
Journal of Asthma and Allergy 2026, 19:598696
Published Date: 16 May 2026