Back to Journals » Medical Devices: Evidence and Research » Volume 15
Lens Autofluorescence Based Advanced Glycation End Products (AGEs) Measurement to Assess Risk of Osteopenia Among Individuals Under the Age of 50
Authors Li S, Li Y, Xu X, Shao J, Xie R, Liu S, Peng L, Wang J, Zhou K, Feng H
Received 8 July 2022
Accepted for publication 24 August 2022
Published 8 September 2022 Volume 2022:15 Pages 341—347
DOI https://doi.org/10.2147/MDER.S381115
Checked for plagiarism Yes
Review by Single anonymous peer review
Peer reviewer comments 2
Editor who approved publication: Dr Scott Fraser
Shaoyun Li,1,* Yuefei Li,1,* Xiyan Xu,1 Jian Shao,2 Ruifeng Xie,3 Sheng Liu,1 Li Peng,1 Jin Wang,1 Kaixin Zhou,3 Huyi Feng1
1The Fifth People’s Hospital of Chongqing, Chongqing, People’s Republic of China; 2Guangzhou Laboratory, Guangzhou, People’s Republic of China; 3Department of Life Sciences, University of Chinese Academy of Sciences, Beijing, People’s Republic of China
*These authors contributed equally to this work
Correspondence: Kaixin Zhou; Huyi Feng, Email [email protected]; [email protected]
Introduction: Simple non-invasive biomarker is urgently needed to detect the largely silent osteopenia in order to prevent osteoporosis-related fracture later in life. The accumulation of advanced glycation end products (AGEs) has been related to reduced bone density and osteoporotic fractures. Whether lens autofluorescence (LAF) based AGEs (LAF-AGEs) measurement could be used to assess the risk of osteopenia is aimed to investigate in this paper.
Methods: Through routine health examination, 368 individuals under the age of 50 were enrolled. A dual-energy X-ray absorptiometry (DXA) device was used to measure bone mineral density (BMD) of the forearm and determine osteopenia. AGE levels were derived with LAF along with the other demographic and laboratory parameters. After deriving the age-adjusted AGE levels (AALs), a linear regression analysis and an ordered logistic regression analysis were applied to examine the associations between osteopenia and LAF-AGEs as well as AALs.
Results: Negative correlations (Pearson r = − 0.16, p < 0.001) were found between LAF-AGEs and T-scores. Higher AALs were significantly associated (p = 0.004) with escalated level of osteopenia in the ordered logistic analysis.
Discussion: After reviewing the relevant studies, it is concluded that LAF-AGE is a more stable measure of long-term metabolic dysfunction than circulating AGE. LAF-AGEs are a valid, practical and non-invasive parameter for osteopenia risk evaluation. Further studies with longer follow-up will be helpful to clarify its effectiveness for osteoporosis risk assessment.
Keywords: lens autofluorescence, LAF, osteopenia, advanced glycation end products, AGEs, bone mineral density, T-scores
Introduction
The prevalence of osteoporosis is 19.2% in people aged over 50 and increases to 65% for those over 65 in China.1 Osteopenia is the gradual loss in bone mineral density (BMD) prior to osteoporosis.2 Chronic osteopenia increases the risk of osteoporosis, fracture or stooped posture. Although early detection of osteopenia and intervention could reduce the risk for osteoporosis-related fracture later in life,3 the awareness rate of osteopenia is only 7% people in those aged over 50 and even lower in the young adults.1 This is largely due to the fact that osteopenia is asymptomatic and its diagnosis often relies on the hazardous X-ray scan.
Alternative biomarkers had been eagerly pursued to inform the early detection of osteopenia.4 Previous studies demonstrated that biochemical factors such as bone serum osteocalcin, alkaline phosphatase (ALP), and osteoprotegerin were associated with osteopenia.5,6 These biomarkers are useful to provide the early assessment of osteopenia and osteoporosis however they are invasive approaches and require laboratory to get the test results. On the other hand, efforts to combine multiple non-invasive measurements such as biceps brachii elasticity and percentage thigh muscle had been proven informative, but the clinical implementation had been severely hindered by its complexity.7 Simple non-invasive biomarkers of osteopenia are still on demand.
Advanced glycation end products (AGEs) include heterogeneous molecules that are nonenzymatically generated by glycation of proteins.8,9 Although distributed across multiple tissues, AGEs are well established to interact with proteins constituting extracellular matrix in bone to form covalent cross-links, damaging the bone properties. Since its distribution across tissues are correlated, AGEs from different compartments of the body had been examined for association with bone quality and fracture.7,8,10 Those from serum and urine were poorly associated due to the short half-life of AGEs related proteins in these tissues.7 Skin autofluorescence-based AGEs were also examined, but their association with bone strength was prone to confounding by renal function.11
Lens autofluorescence (LAF) measurement is a non-invasive technique for determining AGEs initially used for the evaluation of diabetes risk.12 This is largely driven by the fact that proteins in lens are long-lived and the uptake of glucose by lens is not regulated by insulin. Therefore, lens proteins are more likely to be carriers of glycosylation and the LAF-based AGEs (LAF-AGEs) levels are relatively stable. However, whether LAF-AGEs are associated with the risk of bone health and osteopenia is unknown.
In this study, we set out to examine the association between LAF-AGEs and osteopenia in a group of individuals under the age of 50, aiming to establish whether LAF-AGEs could inform early intervention of osteopenia to reduce its related risks later in life.
Materials and Methods
Participants
We recruited 773 adult participants from the Physical Examination Center of the Fifth People’s Hospital of Chongqing between February and December 2019 while they took their annual physical check. Individuals were excluded if they were aged over 50 or suffer from crystal turbidity, or severe renal functional impairment, or diagnosed with osteoporosis. With the exclusion, 368 patients were selected in the study for the further analysis. In addition to the BMD test and the measurement of Lens Autofluorescence specific to this study, we also collected routine demographic and biochemistry measures such as age, sex, body mass index (BMI), serum creatinine and ALP. Both serum creatinine level and ALP were tested through a blood test where the amount of creatinine in blood and the amount of ALP were obtained. Estimated glomerular filtration rate (eGFR) was calculated by the chronic kidney disease epidemiology collaboration (CDK-EPI) equation.13 The study protocol was approved by the local appointed ethics committee and all participants gave their informed consent.
Measurement of Osteopenia
BMD was measured at the forearm with a dual-energy X-ray absorptiometry (DXA) device (SGY-I, TEDA Shenghong Medical Apparatus Co. Ltd., China). All scans were performed and verified by a trained technician who applied adjustments when necessary. The T-scores produced from each scan were used to identify participants with osteopenia or osteoporosis according the Manufacturer Instruction.14 Based on their T-scores, the participants were classified into five groups of normal (T-score ≥ −1), low level osteopenia (−1.2 ≤ T-score < −1), medium level osteopenia (−1.4 ≤ T-score < −1.2), high level osteopenia (−2 ≤ T-score < −1.4) and osteoporosis (T-score < −2).
Measurement of AGEs
The AGEscan Lens Fluorescence Microscope (Sinocare Co. Ltd., China) was used to detect autofluorescence of lens. The equipment adopted the ClearPath DS-120 Lens Fluorescence Biomicroscope that had been most widely used in previous LAF studies.15,16 The system reported the ratio of green fluorescence to scattered light as the raw measurement of LAF-AGEs. The raw ratios were further adjusted by age and referenced against a normal population profile to derive four age-adjusted AGE levels (AALs):
- Level 3 – high (above 95% line)
- Level 2 – medium (between 95% and 80%)
- Level 1 – low (between the 80% and 50%)
- Level 0 – normal (below 50%)
Statistical Analysis
Data was expressed as mean ±SD for continuous variables, and number of cases and percentage for categorical variables. Continuous variables were compared by the t or ANOVA test for normally distributed variables. Chi-Square test was used to compare categorical variables. The linear regression analyses were applied to examine whether T-scores were associated with LAF-AGEs as well as AALs. The co-impacts of the confounders, such as sex, BMI, eGFR and ALP were analyzed by the comparison between the values in two groups divided based on T-Scores. In addition, an ordered logistic regression analysis was applied to investigate whether the change of AALs between different levels affected impacts the different levels of osteopenia. p < 0.05 was considered statistically significant. Data processing was performed using Python (version 3.8.5) and statistical analyses were carried out using R (version 4.0.3).
Results
After excluding individuals with existing osteoporosis (T-score < −2), the key characteristics of the remaining 368 participants in the study were summarized in Table 1. They were divided into the low osteopenia risk group (T-score ≥ −1.2) and the high osteopenia risk group (−2 ≤ T-score < −1.2). In keeping with previous studies, individuals in the group with higher risk of osteopenia tend to be slimmer and older (both p < 0.001). No significant difference in ALP (p = 0.83) and eGFR (p = 0.13) was observed between the two groups. In addition, there was no significant gender ratio difference between the two osteopenia risk groups.
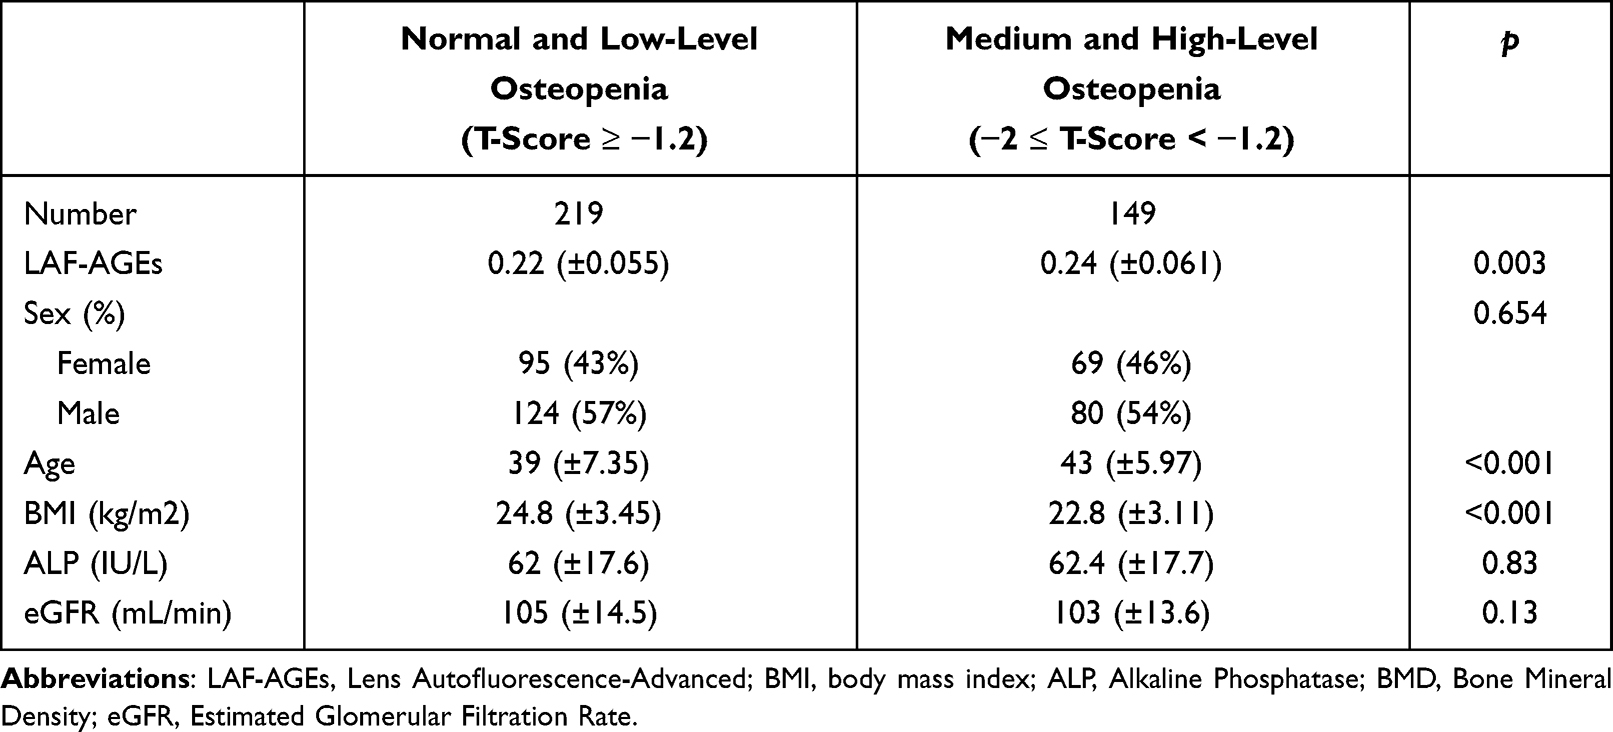 |
Table 1 Characteristics of the Participants |
The joint distribution of osteopenia T-Scores and raw LAF-AGEs levels was plotted in Figure 1A. In a linear regression model, LAF-AGEs were significantly (Pearson r = −0.20, p < 0.001) and negatively correlated with T-Scores. As shown in Figure 1B, when LAF-AGEs were age standardized into AALs, there remained a significant (p = 0.025) negative correlation between AAL and T-score.
 |
Figure 1 The correlation results: (A) Association between T-scores and LAF-AGEs; (B) association between T-scores and AALs. |
In order to predict the transition between osteopenia severity levels with the LAF-AGEs, an ordered logistic regression model was employed with the AALs as the predicator and the leveled osteopenia diagnosis as the ordered outcome. This univariate analysis identified AAL was a factor for lower osteopenia level [p = 0.004, odds ratio (OR) = 1.28, 95% confident interval (CI) 1.08–1.51]. In the multivariate model with gender, BMI, eGFR and ALP as covariates, AAL remained a significant predictor [p = 0.02, OR = 1.22, 95% CI: 1.02–1.45].
Discussion
In this cross-sectional study of 368 normal individuals under the age of 50, we showed an inverse association between LAF-AGE levels and osteopenia risk as measured by T-score. The age standardized LAF-AGE levels remained a statistically significant risk after adjusting for other known osteopenia risk factors.
The present investigation was set out to focus on the young adults. Abundant previous evidence had shown that people aged over 50 or menopausal women had increased risk of osteopenia.8,10,17 Yet the bone mass loss in young adults did not receive much attention with the osteopenia risk profile poorly defined.16 Early diagnosis and treatment of osteopenia for young people have been demonstrated to decrease fracture rates, improve life quality when they grow into elderly.18,19 Thus, we opted to extend existing knowledge by examining whether LAF-AGE could serve as a biomarker to inform early assessment of osteopenia.
AGEs are diverse compounds with tissue specific origin, reflecting the metabolic properties of multiple correlated tissues.17 The formation of covalant cross-links with collagen and other bone proteins which affect the mechanical properties of tissue and disturbs bone remodelling, deterioration and bone mass loss, underlying osteoporosis, is induced by the accumulation of AGEs within the bone. It is known that circulating AGEs plays a major role in the progression of osteopenia with a negative correlation of r = −0.26 to the T-score of lumbar spines.20 Here, we showed LAF-AGEs had a similar level of negative correlation (r = −0.16) with the T-scores of forearms. Thus, our study confirmed the LAF-AGEs, another form of AGEs existing in eyes, also had the inverse association with bone mass loss, raising the potential for osteopenia risk evaluation.
As with AGEs measured from other tissues, LAF-AGEs increase with natural aging. We then adopted the age standardized LAF-AGEs in this study to explore its association with T-score and osteopenia risk. The result of the ordinal logistic regression showed the transition between AALs also resulted in a risk escalation of osteopenia, even after accounting for other known risk factors. Moreover, it has been shown that LAF-AGE is a more stable measure of long-term metabolic dysfunction than circulating AGE. Compared to skin measures of SAF-AGEs, it is less perturbed by short term physiological change which is relevant to the accumulating risk of osteopenia. Taken together, our results demonstrated LAF-AGEs as a valid and practical parameter for osteopenia risk evaluation, adding a non-invasive biomarker to the existing risk profile.
Our study references the bone mineral assessment at the forearm with the low radiation dose DXA which is commonly used in health care setting.21 In contrast, previous AGEs studies mostly measured bone mass at other body parts such as femoral neck and lumbar spine with higher accuracy.10,20 However, a recent study showed that BMD measured at different sites, including lumber, left hip and non-superiority forearm with DXA, were comparable in screening osteoporosis.22 Therefore, the association between LAF-AGEs and T-score observed in this study is likely to be a valid indicator of osteopenia risk.
The present study utilized a cross-sectional dataset and could only focus on the risk predication of osteopenia with LAF-AGEs. However, previous studies did suggest that skin measures of SAF-AGEs were associated with long-term outcomes of osteoporotic fractures and vertebral fractures in susceptible individuals.10,23 Given that LAF-AGEs and SAF-AGEs are significantly correlated,24 it would be reasonable for future studies to examine whether LAF-AGEs could serve as a valid indicator of fracture risk in longitudinal investigations of young cohort. On the other hand, this study used the BMD data measured by DXA at forearm which is widely in routine physical examinations. More analysis should be undertaken to explore whether and how strong the correlations are between LAF-AGEs and bone mass loss at other body sites such as lumbar spine and ward’s triangle. Further studies with longer follow-up will be helpful to establish whether LAF-AGEs could be used as a risk indicator of osteopenia and later osteoporosis.
Conclusion
In conclusion, this cross-sectional study of normal individuals under the age of 50 confirmed significant association between LAF-AGE levels and osteopenia. Together with other known risk of factors of osteopenia, the non-invasive and reliable measure of LAF-AGEs provides the possibility of more accurate risk profiling and early diagnosis of osteopenia.
Authors’ Information
Dr. Huyi Feng is a chief medical doctor in hepatobiliary surgery and the director of the Fifth People’s Hospital of Chongqing. He received his MD in 1984 from West China Medical University and MMed in 2002 from Chongqing Medical University. He published 20 academic papers, had completed 9 research projects and is in charge of one on-going research project in medical science. He is the vice-chairman of Chongqing General Surgery Committee of Chinese Medical Association Integrative Medicine and a member of Chongqing Minimally Invasive Surgery Committee. He is also an editor of the journal Chongqing Medicine. He is expert in diagnosis and treatment of hepatobiliary and pancreatic diseases, especially in laparoscopic technique and laparoscopic cholecystectomy. His research interests include hepatobiliary and pancreatic diseases, endocrine system and advanced glycation end products.
Dr. Shaoyun Li is a data scientist working in the Big Data Laboratory of the Fifth People’s Hospital of Chongqing. She received her PhD in computer science from De Montfort University in the UK in 2007. She has been working on the research and development in software engineering and data analysis for more than 20 years, especially focusing on medical science in the past 2 years. She has published more than 20 academic research papers in software engineering and medical science. Her current research interests include integration and analysis of medical data to discover the association between diseases and medication.
Data Sharing Statement
The electronic medical record data retrieved from the Fifth People’s Hospital of Chongqing was anonymized for this study. Summary data that were used to support the findings of this study may be requested from the correspondent author.
Ethics Approval and Informed Consent
The study was conducted in accordance with the Declaration of Helsinki, and approved by the Ethics Committee of the Fifth People’s Hospital of Chongqing (protocol code: 2019CQSDWRMYYEC-003) on 10th March 2019.
Acknowledgments
We thank Sinocare Co. Ltd., China for providing the AGEscan Lens Fluorescence Microscope which was used to measure LAF-AGEs in our research.
Author Contributions
All authors made a significant contribution to the work reported, whether that is in the conception, study design, execution, acquisition of data, analysis and interpretation, or in all these areas; took part in drafting, revising or critically reviewing the article; gave final approval of the version to be published; have agreed on the journal to which the article has been submitted; and agree to be accountable for all aspects of the work.
Funding
This research was funded by two National Key R&D Programs of China, grant numbers: 2018YFC2001003 and 2018YFC2001001.
Disclosure
The authors have declared that no competing interest exists.
References
1. National Health Commission of the People’s Republic of China. Results of the first epidemiological survey of osteoporosis in China; 2018. Available from: http://www.nhc.gov.cn/wjw/xwdt/201810/d816a5c72f6b45e399a1e7214642cd47.shtml.
2. Varacallo M, Seaman TJ, Jandu JS, Pizzutillo P. Osteopenia. In: Statpearls. Treasure Island (FL): StatPearls Publishing; 2020.
3. Tucci JR. Importance of early diagnosis and treatment of osteoporosis to prevent fractures. Am J Manag Care. 2006;12:181–190.
4. Kuo T-R, Chen C-H. Bone biomarker for the clinical assessment of osteoporosis: recent developments and future perspectives. Biomark Res. 2017;5:18. doi:10.1186/s40364-017-0097-4
5. Mekkawy ND, Elsaeed WF, Ahmed HS, Khaliel AM. Importance of serum osteocalcin as early biomarker for osteopenia in preterm neonates receiving total parenteral nutrition. Zagazig Univ Med J. 2019;28:497–504.
6. Parveen B, Parveen A, Divya V. Biomarkers of osteoporosis: an update. endocrine. Metab Immune Disord Drug Targets. 2019;19:895–912. doi:10.2174/1871530319666190204165207
7. Kida Y, Saito M, Shinohara A, Soshi S, Marumo K. Non-invasive skin autofluorescence, blood and urine assays of the advanced glycation end product (age) pentosidine as an indirect indicator of age content in human bone. BMC Musculoskelet Disord. 2019;20:627. doi:10.1186/s12891-019-3011-4
8. Tabara Y, Ikezoe T, Yamanaka M, et al. Advanced glycation end product accumulation is associated with low skeletal muscle mass, weak muscle strength, and reduced bone density: the nagahama study. J Gerontol: Med Sci. 2018;74:1446–1453. doi:10.1093/gerona/gly233
9. Steenbeke M, Bruyne SD, Aken EV, et al. Uv Fluorescence-based determination of urinary advanced glycation end products in patients with chronic kidney disease. Diagnostics. 2020;10:34. doi:10.3390/diagnostics10010034
10. Waqas K, Chen J, Koromani F, et al. Skin autofluorescence, a noninvasive biomarker for advanced glycation end-products, is associated with prevalent vertebral and major osteoporotic fractures: the Rotterdam study. J Bone Miner Res. 2020;35:1904–1913. doi:10.1002/jbmr.4096
11. Simó-Servat O, Planasa A, Ciudin A, Simó R, Hernández C. Assessment of advanced glycation end-products as a biomarker of diabetic outcomes. Endocrinología, Diabetes y Nutrición. 2018;65:540–545. doi:10.1016/j.endien.2018.06.003
12. Cahn F, Burd J, Ignotz K, Mishra S. Measurement of lens autofluorescence can distinguish subjects with diabetes from those without. J Diabetes Sci Technol. 2014;8:43–49. doi:10.1177/1932296813516955
13. Levey AS, Stevens LA, Schmid CH, et al. Equation to estimate glomerular filtration rate. Ann Intern Med. 2009;150:604–612. doi:10.7326/0003-4819-150-9-200905050-00006
14. Teda Shenghong Medical Apparatus Co. Ltd. C. Manufacturer Instruction: sgy-I. 2010.
15. Burd J, Lum S, Cahn F, Ignotz K. Simultaneous noninvasive clinical measurement of lens autofluorescence and Rayleigh scattering using a fluorescence biomicroscope. J Diabetes Sci Technol. 2012;6:1251–1259. doi:10.1177/193229681200600603
16. Pehlivanoğlu S, Acar N, Albayrak S, Karakaya M, Ofluoğlu A. The assessment of autofluorescence of the crystalline lens in diabetic patients and healthy controls: can it be used as a screening test? Clin Ophthalmol. 2018;12:1163–1170. doi:10.2147/OPTH.S164960
17. Yamamoto M, Sugimoto T. Advanced glycation end products, diabetes, and bone strength. Curr Osteoporos Rep. 2016;14:320–326. doi:10.1007/s11914-016-0332-1
18. Karaguzel G, Holick MF. Diagnosis and treatment of osteopenia. Rev Endocr Metab Disord. 2011;11:237–251. doi:10.1007/s11154-010-9154-0
19. Teng Z, Zhu Y, Yu X, et al. An analysis and systematic review of sarcopenia increasing osteopenia risk. PLoS One. 2021;16:1–14. doi:10.1371/journal.pone.0250437
20. Yang D-H, Chiang T-I, Chang I-C, Lin F-H, Wei -C-C, Cheng Y-W. Increased levels of circulating advanced glycation end-products in menopausal women with osteoporosis. Int J Med Sci. 2014;11:453–460. doi:10.7150/ijms.8172
21. Augat P, Fuerst T, Genant H. Quantitative bone mineral assessment at the forearm: a review. Osteoporosis Internationa. 1998;8:299–310. doi:10.1007/s001980050068
22. Wang Y, Zhang Z. Comparision forearm bone mineral density between lumbar spine and hip: a useful tool to screen osteoporsis in female patients with rheumatoid arthritis. Ann Rheum Dis. 2019;78:1634.
23. Waqas K, Chen J, Koromani F, et al. Dietary advanced glycation end-products (Dages) intake and bone health: a cross-sectional analysis in the Rotterdam study. Nutrients. 2020;12:2377. doi:10.3390/nu12082377
24. Skrha J, Soupal J, Prazny M, Skrha J. Lens autofluorescence relates to skin autofluorescence but poorly to glycated haemoglobin in patients with diabetes. Diabetologia. 2015;58:560.
 © 2022 The Author(s). This work is published and licensed by Dove Medical Press Limited. The
full terms of this license are available at https://www.dovepress.com/terms
and incorporate the Creative Commons Attribution
- Non Commercial (unported, 3.0) License.
By accessing the work you hereby accept the Terms. Non-commercial uses of the work are permitted
without any further permission from Dove Medical Press Limited, provided the work is properly
attributed. For permission for commercial use of this work, please see paragraphs 4.2 and 5 of our Terms.
© 2022 The Author(s). This work is published and licensed by Dove Medical Press Limited. The
full terms of this license are available at https://www.dovepress.com/terms
and incorporate the Creative Commons Attribution
- Non Commercial (unported, 3.0) License.
By accessing the work you hereby accept the Terms. Non-commercial uses of the work are permitted
without any further permission from Dove Medical Press Limited, provided the work is properly
attributed. For permission for commercial use of this work, please see paragraphs 4.2 and 5 of our Terms.
Recommended articles
Association of Plasma Sex-Related Hormones Levels with Bone Mineral Densities and Risk of Osteoporosis and Osteopenia in Men and Menopausal Women with Type 2 Diabetes Mellitus
Lu W, Zheng S, Zhou J, Huang S, Chen N, Li Z
Diabetes, Metabolic Syndrome and Obesity 2023, 16:457-468
Published Date: 14 February 2023
The Influence of Obesity on Bone Health in Post-COVID-19 Recovery- Single-Center Experience
Chaturvedi B, Debnath S, Bareth H, Raj P, Singh P, Singh M, Nathiya D, Tomar BS
International Journal of General Medicine 2024, 17:29-36
Published Date: 6 January 2024