")
Back to Journals » International Journal of General Medicine » Volume 17
The Influence of Obesity on Bone Health in Post-COVID-19 Recovery- Single-Center Experience
Authors Chaturvedi B , Debnath S, Bareth H , Raj P, Singh P, Singh M , Nathiya D , Tomar BS
Received 12 October 2023
Accepted for publication 13 December 2023
Published 6 January 2024 Volume 2024:17 Pages 29—36
DOI https://doi.org/10.2147/IJGM.S444318
Checked for plagiarism Yes
Review by Single anonymous peer review
Peer reviewer comments 3
Editor who approved publication: Dr Scott Fraser
Bhumi Chaturvedi,1 Sourav Debnath,1 Hemant Bareth,1 Preeti Raj,2 Pratima Singh,3 Mahaveer Singh,4 Deepak Nathiya,1,5,6 Balvir Singh Tomar5– 7
1Department of Pharmacy Practice, National Institute of Medical Sciences and Research, Jaipur, Rajasthan, India; 2School of Health Sciences, Faculty of Biology, Medicine and Health, University of Manchester, Manchester Academic Health Science Centre, Manchester, UK; 3Public Health and Preventive Medicine, University of Alberta, Edmonton, AB, Canada; 4Department of Endocrinology, National Institute of Medical Sciences and Research, Jaipur, Rajasthan, India; 5Department of Clinical Studies, Fourth Hospital of Yulin (Xingyuan), Yulin, Shaanxi, People’s Republic of China; 6Department of Clinical Sciences, Shenmu Hospital, Shenmu, Shaanxi, People’s Republic of China; 7Institute of Pediatric Gastroenterology and Hepatology, National Institute of Medical Sciences and Research, Jaipur, Rajasthan, India
Correspondence: Mahaveer Singh, Department of Endocrinology, National Institute of Medical Sciences and Research, Nims University, Jaipur, Rajasthan, India, Email [email protected]
Introduction: The ongoing repercussions of the COVID-19 pandemic include potentially deleterious impacts on bone health.
Aim: This research aimed to ascertain the effects of COVID-19 on the bone health of obese and non-obese Indian individuals.
Methods: We executed a case-control study enrolling individuals who recovered from COVID-19. Participants were stratified into obese and non-obese groups based on their BMI. Comprehensive assessments encompassed anthropometric evaluations, laboratory tests, and bone mineral density (BMD) measurements using dual-energy X-ray absorptiometry (DEXA).
Results: From April to July 2022, we enrolled obese (n = 27, mean BMI = 30.54 ± 4.51 kg/m 2) and non-obese (n = 23, mean BMI = 21.97 ± 2.20 kg/m 2) individuals. The cohort’s average age was 36.08 ± 15.81 years, with a male-to-female ratio of 1.6:1. There was a difference in BMD, especially at the total hip, between the two groups. BMD at the spine (L1-L4), the neck of the femur, and ultra-distal radius were consistent across both groups. Weight exhibited a significant positive correlation with BMD at L1-L4 (r = 0.40, p = 0.003) and the left femur total (r = 0.27, p = 0.001). Haemoglobin levels were lower in the obese group compared to their non-obese counterparts (12.3 ± 2.0 vs 13.6 ± 1.9, p = 0.01). Multivariate analysis underscored weight as a crucial predictor for BMD at the spine (L1-L4, p = 0.003) and total hip (p = 0.001).
Conclusion: Even with advanced age, obese post-COVID-19 individuals demonstrate a higher bone mineral density (BMD) at the hip than non-obese subjects.
Keywords: COVID-19, obesity, bone mineral density, osteopenia, fracture risk
Introduction
COVID-19, triggered by the coronavirus, wreaked global chaos. As of November 2023, the pandemic has resulted in seven million fatalities.1 The disease has been categorized into two phases to enhance management strategies: Acute COVID-19 and Chronic COVID-19 (also known as Long COVID). The burden of long COVID is increasing day by day as most of the patients progress in the long COVID phase of the COVID 19.2 The most common manifestations of the long COVID syndrome are fatigue, muscle pain, headache, brain fogginess, and autonomic dysfunction.3,4 COVID-19 was linked to significant health impacts due to its influence on the immune system.5 This disease triggered an abnormal immune response known as cytokine release syndrome, leading to multi-organ dysfunction, especially in the lungs, blood vessels, and heart. This syndrome was particularly severe in patients with co-morbidities such as diabetes, obesity, chronic kidney disease, and hypertension.6 Among these, obesity was the most common co-morbidity linked to complications from COVID-19. Research has indicated that obesity can affect bone health in various ways. For instance, the mechanical loading on the hip and spine, increased levels of IGF-1, and higher production of oestradiol in body tissues contribute to bone protection. Conversely, factors like hypogonadism, increased inflammation, and a sedentary lifestyle are associated with bone loss.7–10 Post-COVID-19 bone loss is linked to severity, steroid use, hypogonadism, vitamin D deficiency, and inactivity. SARS-CoV2 entered cells via ACE 2 receptors during acute COVID-19. Downregulation of ACE 2 increased Angiotensin-2, a potent proinflammatory molecule. Angiotensin 2 increases E and P selectin, IL-8, CCL-2, and 5 expressions.2,9,11 Angiotensin 2 and inflammatory cytokines increased osteoblast RANKL expression. RANK and RANKL activation caused bone loss by activating osteoclasts. This caused bone loss after months of recovery from the acute COVID-19.12,13
Data concerning the interplay of obesity and bone mineral density in post-COVID patients is scarce. In this case-control study, we aimed to assess the bone mineral density in patients who recovered from acute COVID-19. We also tried to assess the effect of obesity on bone mineral density.
Methodology
From April 2022 to July 2022, we conducted a case-control study at the National Institute of Medical Sciences Hospital in Jaipur, Rajasthan, India. The medical record section searched for data on COVID-19 patients (n=4000) who were discharged from the COVID-19 acute care facility. We called the eligible patients and asked them to come to the outpatient department of medicine. One hundred sixty-six patients agreed to come for a screening visit out of 400 who were found to be eligible. Ninety-two consented to take part in the study out of a total of 166.
Study Population
Data Review and Study Recruitment
The files of individuals admitted to the NIMS hospital’s acute COVID care facility and discharged without oxygen support were reviewed. The study’s eligibility was determined using the following criteria. Patients over the age of 18 who had a positive RT PCR test at the time of admission were included. Patients who had malignancy, chronic gastrointestinal diseases, chronic kidney disease, chronic liver disease, or who were taking drugs that could impair bone health were excluded.
The ethical approval was obtained from the NIMS Institutional Ethics Committee (approval number–NIMSUR/IEC/2022/252). Figure 1 provides the details on patients included in the study.
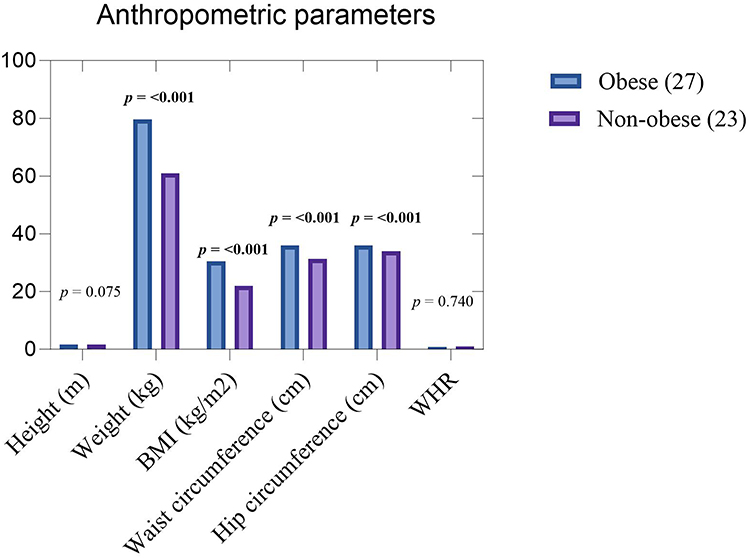 |
Figure 1 Comparative Analysis of Anthropometric Measurements in Obese and Non-Obese Participants. The figure illustrates the differences in Height (p = 0.075), Weight (p <0.001), BMI (p = <0.001), waist circumference (p = <0.001), Hip circumference (p = <0.001), and WHR (p = 0.740) between the two groups. p value < 0.05 are considered statistically significant and marked in bold. |
Evaluation at the Out-Patient Department of the General Medicine
We assessed these patients in the outpatient medicine department. Weight, height, waist circumference, hip circumference, and waist-to-hip ratio were measured to calculate BMI. Underweight and normal weight were categorized as “non-obese” (BMI: 18.5–22.9) and overweight and obese as “obese” (BMI ≥ 23).
Bone Mineral Density Assessment
Before sending these individuals for bone mineral density, all precautions were explained (Stop taking calcium supplements 24 hours before the DEXA scan; wear loose-fitting, comfortable clothes without metal zippers, belts, or buttons, and remove any jewellery). The Lunar Prodigy Advance DXA System measured bone mineral density (GE Healthcare). Lumbar vertebrae (L1-L4), left femur neck, left femur total, and left forearm ultra-distal radius BMD and BMC were measured. Right hip BMD was used if left femur BMD was unavailable. BMC (Bone Mineral Content) was calculated by summing the product of area and pixel value (density) for each pixel in the region of interest. The area was determined from the number of pixels within the bone’s defined edges. BMD (Bone Mineral Density) was then calculated by dividing the BMC by area.
Lab Investigations
We did a complete blood count (Auto Haematology Analyzer, BC-6200, Mindray Bio- Medical Electronics, Shenzhen, China) to see the haematological markers of the inflammation. To assess the inflammation, Serum C-reactive protein (CRP) was measured (model Elite 580, Erba Mannheim Germany). Serum calcium and serum phosphate were also assessed (model Elite 580, Erba Mannheim Germany).
Statistical Analysis
Patient characteristics are presented as the number and percentages for categorical variables explore any underlying factors contributing variables. Pearson’s chi-squared test was used for the relationship between categorical variables. The correlation between BMI and BMD was analysed separately for the obese and non-obese groups using Pearson’s correlation coefficient (r) for normally distributed data. All statistical tests were two-sided, and a p-value of less than 0.05 was considered statistically significant. Statistical analyses were performed using a statistical software package (eg, SPSS version 28, IBM Corp., Armonk, NY, USA).
Results
Fifty individuals could complete the entire study from the initial seventy individuals who agreed to participate. Twenty patients were excluded due to various reasons (8 patients did not agree to BMD due to fear of radiation, three patients were found to have a pregnancy, and five patients took drugs that can affect bone mineral density: 3 took steroids, 2 took diuretics), four patients developed diseases (diabetes-2, ILD-1, RA-1).
Demographics
The average age of the study population was 36.08 ± 15.81 years (range 18–70 years). In the study, the male: female ratio was 1.6:1. Twenty-seven of the fifty individuals were categorized as obese (mean BMI = 30.54 ± 4.51 kg/m2) and twenty-three as non-obese (mean BMI = 21.97 ± 2.20 kg/m2). This means obese patients were more common than non-obese patients. The anthropometric data are compared in Figure 1. Obese individuals were older than non-obese participants (41.48 ± 18.28 vs 29.74 ± 9.14 years, p = 0.006). The demographic details are shown in Table 1.
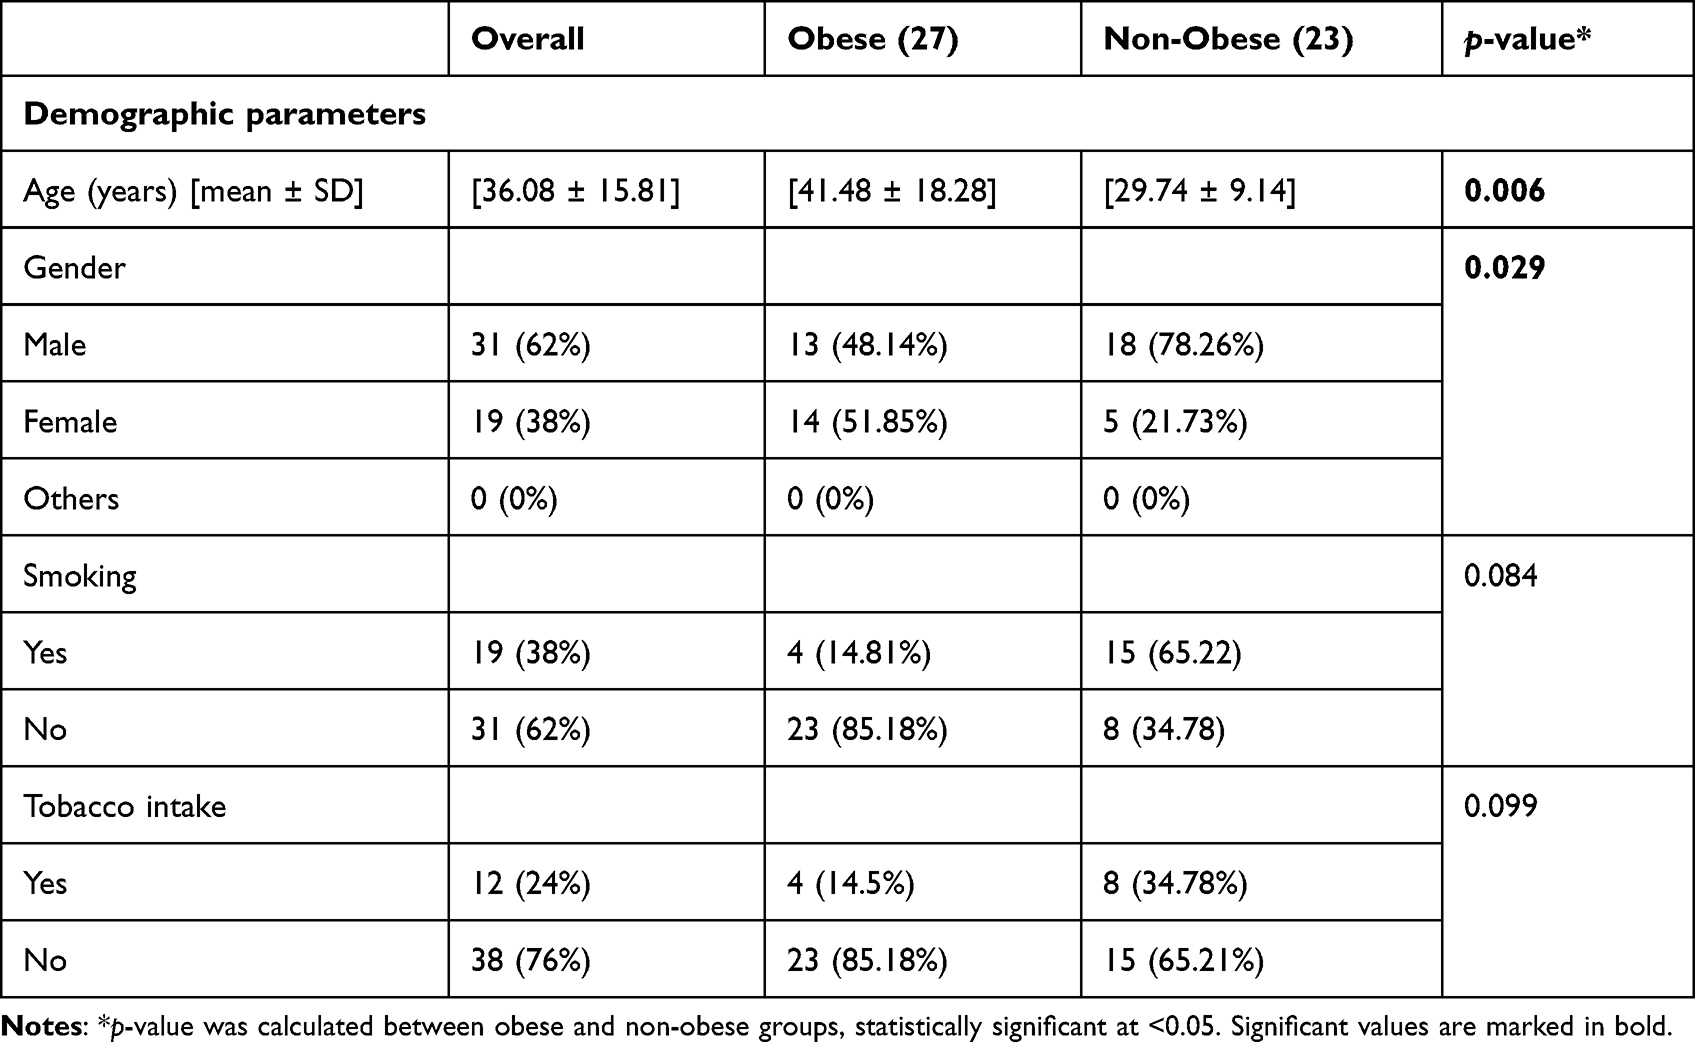 |
Table 1 Demographic Characteristics of the Study Cohort: A Comparative Analysis Between 27 Obese and 23 Non-Obese Participants |
Lab Investigations
The serum calcium was 9.1 ± 0.57 mg/dl (8.0–10.5). Serum phosphorus was 3.6 ± 0.71 mg/dl (range-2.2–5.4). The median serum CRP was 1.4 mg/dl (IQR-0.74 to 6.5). Obese patients had similar serum calcium, phosphorus, and C-reactive protein, suggestive of no excess inflammation in the obese group but lower haemoglobin than non-obese (12.3 ± 2.0 vs 13.6 ± 1.9, p = 0.01). The haematological and biochemical parameters are shown in Table 2.
 |
Table 2 Comparison of Hematological and Biochemical Laboratory Parameters Between Obese and Non-Obese Participants |
Baseline Bone Mineral Density
Obese patients have more bone mineral density at the total hip (1.06 ± 0.12 vs 0.97 ± 0.10, p = 0.010). There was no difference in the BMD at the spine (L1-L4), neck of femur, and ultra-distal radius in the obese and non-obese groups. This comparison of the BMD at different anatomical sites is shown in Figure 2.
 |
Figure 2 Comparative Analysis of Bone Mineral Density (BMD) in Obese and Non-Obese Participants. This figure depicts the differences in BMD measurements at specific anatomical sites: Lumbar Spine (L1-L4), Left Neck of Femur, Left Total Hip, and Distal Radius. Notably, obese participants exhibited higher BMD values at the Left Total Hip. |
Bone Mineral Density and Its Determinants
The weight correlated positively with the L1-L4 BMD (g/cm2) (r-0.40, p = 0.003) and left femur total BMD (r-0.27, p = 0.001). This is shown in Figure 2. Left femur neck BMD positively correlated with weight (r-0.28, p = 0.047). The correlation of the weight with the BMD at different anatomical sites is shown in Figure 3. The BMD at total hip showed a negative correlation with the CRP (r-0.26, p = 0.06). Left femur neck BMD positively correlated with height (r-0.33, p = 0.02). In the multivariate stepwise analysis using BMD at the spine (L1-L4) as a dependent variable and age, CRP, weight, and waist-hip ratio as independent variables, weight was a significant predictor (p = 0.003). Similarly, weight was the only predictor of BMD at total hip (p = 0.001) in the multivariate analysis.
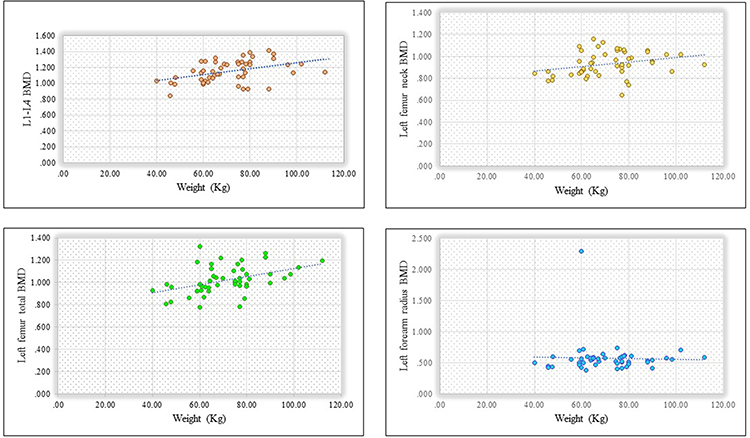 |
Figure 3 Scatter plots with linear regression lines showing the correlation of weight with bone mineral density (BMD) at specific anatomical sites. The figure displays the relationship between weight and BMD measurements at the lumbar spine (L1-L4), left neck of the femur, left total Hip, and distal radius. A positive correlation was observed between weight and BMD at L1-L4 (r = 0.40, p = 0.003) and with left total Hip BMD (r = 0.27, p = 0.001). |
Discussion
Our investigation sought to elucidate the relationship between bone mineral density (BMD) and prior COVID-19 infection, especially in obese patients. We used a dual-energy absorptiometry scan to evaluate the bone mineral density. Our study provided some significant findings.
One of our key findings was the pronounced age difference between obese and non-obese groups. The mean age for the obese cohort was significantly higher at 41.5±18.2 years compared to the non-obese group at 29.8 ± 9.1 years (p-value 0.006). We deliberately chose not to randomize our dataset, believing that retaining its real-world structure would better reflect the genuine trajectory of obesity over time. This age disparity may be concordant with the previously published research and attributed to the natural increase in fat mass (approximately 1% per decade) due to sedentary habits, hormonal shifts, and perturbations in fat regulation mechanisms.14,15
An interesting demographic trend also emerged from our study, pointing to the disparate prevalence of obesity between genders. The gender ratio in the obese group was more balanced at 48.15% male to 51.85% female, contrasting with the predominantly male non-obese group (78.26% to 21.73%). High proportions of females in the obese group can explain the BMI difference in the obese and non-obese groups. This is concordant with the previous study, “Family Health Survey 5”, from Jaipur, where the prevalence of abdominal obesity was found to be higher in females (40% vs 12%).16 Such gender disparities might be rooted in cultural norms; particularly in India. For instance, domestic responsibilities predominantly rest on women, and cultural barriers might limit their opportunities for physical activity.
An important observation from our study was the higher BMD at the total hip in obese participants, even though they were older and had an unequal (more females) gender distribution. The BMD readings at the spine (L1-L4) and ultra-distal radius remained relatively consistent between the two cohorts. The correlation between obesity and BMD is a nuanced and debated study area. Dr. Beck et al studied hip BMD and geometry about BMI among postmenopausal non-Hispanic whites from the WHI-OS. While heavier women had stronger femurs, the strength increase was not proportionate to weight. One might assume heavier women would have more hip fractures. However, data from 78,013 NHW women showed hip fracture incidents decreased as BMI increased. This highlights the complex relationship between obesity and bone health.17
BMI and obesity can serve as a protective factor for bone health. Such protective effects can be ascribed to increased mechanical loading on bones, elevated osteocyte signalling, intensified estrogen production, diminished synthesis of SHBG, and hyperinsulinemia.18–20
This was supported by a meta-analysis, which employed a random-effect model with the inverse-variance method and showed that postmenopausal women with obesity had a 25% and 15% reduced risk for hip and wrist fractures, respectively.21 While obesity may confer BMD benefits the hip and spine; its influence is negligible at the radius, likely due to the Latter’s minimal exposure to mechanical stress.
In our study, the obese patients had lower haemoglobin than the non-obese patients. This can be due to the gender proportions (the obese group had more females than the non-obese). The other possible cause is the iron deficiency associated with obesity.
The study analysed the influence of obesity on bone mineral density in a post-COVID population, offering timely insights given the global relevance of COVID-19’s aftermath. A strength lies in its utilization of anthropometry data, ensuring a thorough assessment of participants. However, the small sample size, likely due to COVID-related apprehensions, poses generalizability concerns. A more extended follow-up period and inclusion of body fat analysis would have further enriched the study’s depth and scope.
Conclusions
Our study revealed that post-COVID obese individuals, despite being older, exhibited a higher bone mineral density (BMD) at the hip compared to non-obese counterparts. These findings challenge the perceived association between obesity, inflammation, and reduced BMD post-COVID.
Institutional Review Board Statement
The study was conducted according to the guidelines of the Declaration of Helsinki and approved by the Institutional Ethics Committee of the National Institute of Medical Sciences and Research (NIMSUR/IEC/2022/252 and 11.04.2022).
Data Sharing Statement
The data presented in this study are available on request from the corresponding author.
Informed Consent Statement
Informed consent was obtained from all subjects involved in the study.
Acknowledgment
We are writing to express our sincere gratitude for the swift administrative support of NIMS University. We also thank Mr. Onkar for conducting and analyzing the result of the DEXA scan and Mr. Hazari Lal for his support during the laboratory test. We also want to thank the Department of Orthopedics for their continuous support.
Author Contributions
All authors made a significant contribution to the work reported, whether that is in the conception, study design, execution, acquisition of data, analysis and interpretation, or in all these areas; took part in drafting, revising or critically reviewing the article; gave final approval of the version to be published; have agreed on the journal to which the article has been submitted; and agree to be accountable for all aspects of the work.
Disclosure
The authors declare no conflict of interest.
References
1. Kumar A, Malla MA, Dubey A. With corona outbreak: nature started hitting the reset button globally. Front Public Health. 2020;8:569353. doi:10.3389/fpubh.2020.569353
2. Sapra L, Saini C, Garg B, et al. Long-term implications of COVID-19 on bone health: pathophysiology and therapeutics. Inflammation Res. 2022;71(9):1025–1040. doi:10.1007/s00011-022-01616-9
3. Ceban F, Ling S, Lui LMW, et al. Fatigue and cognitive impairment in Post-COVID-19 Syndrome: a systematic review and meta-analysis. Brain Behav Immun. 2022;101:93–135. doi:10.1016/j.bbi.2021.12.020
4. Pandharipande P, Williams Roberson S, Harrison FE, Wilson JE, Bastarache JA, Ely EW. Mitigating neurological, cognitive, and psychiatric sequelae of COVID-19-related critical illness. Lancet Respir Med. 2023;11(8):726–738. doi:10.1016/S2213-2600(23)00238-2
5. Azkur AK, Akdis M, Azkur D, et al. Immune response to SARS‐COV‐2 and mechanisms of immunopathological changes in Covid‐19. Allergy. 2020;75(7):1564–1581. doi:10.1111/all.14364
6. Lutz SZ, Stefan N, Peter A, et al. Obesity, diabetes and COVID-19: an infectious disease spreading from the east collides with the consequences of an unhealthy western lifestyle. Front Endocrinol. 2020;11:582870. doi:10.3389/fendo.2020.582870
7. Rinonapoli G, Pace V, Ruggiero C, et al. Obesity and bone: a complex relationship. Int J Mol Sci. 2021;22(24):13662. doi:10.3390/ijms222413662
8. Palermo A, Tuccinardi D, Defeudis G, et al. BMI and BMD: the potential interplay between obesity and bone fragility. Int J Environ Res Public Health. 2016;13(6):544. doi:10.3390/ijerph13060544
9. de Tejada-Romero MJ, Saavedra-Santana P, de la Rosa-Fernández F, et al. Effect of obesity on fragility fractures, BMD and vitamin D levels in postmenopausal women influence of type 2 diabetes mellitus. Acta Diabetologica. 2022;59(9):1201–1208. doi:10.1007/s00592-022-01923-x
10. Salamat MR, Salamat AH, Janghorbani M. Association between obesity and bone mineral density by gender and menopausal status. Endocrinol Metab. 2016;31(4):547. doi:10.3803/enm.2016.31.4.547
11. Turner JS, Kim W, Kalaidina E, et al. SARS-COV-2 infection induces long-lived bone marrow plasma cells in humans. Nature. 2021;595(7867):421–425. doi:10.1038/s41586-021-03647-4
12. Epsley S, Tadros S, Farid A, Kargilis D, Mehta S, Rajapakse CS. The effect of inflammation on bone. Front Physiol. 2020;11:511799. doi:10.3389/fphys.2020.511799
13. Redlich K, Smolen JS. Inflammatory bone loss: pathogenesis and therapeutic intervention. Nat Rev Drug Discov. 2012;11(3):234–250. doi:10.1038/nrd3669
14. Boneva-Asiova Z, Boyanov M. Age-related changes of body composition and abdominal adipose tissue assessed by bio-electrical impedance analysis and computed tomography. Endocrinol Nutr. 2011;58(9):472–477. doi:10.1016/j.endonu.2011.07.004
15. Haapanen MJ, Mikkola TM, Kortelainen L, et al. Body composition in late midlife as a predictor of accelerated age-associated deficit-accumulation from late midlife into old age: a longitudinal birth cohort study. J Gerontol a Biol Sci Med Sci. 2023;78(6):980–987. doi:10.1093/gerona/glac233
16. Chaudhary M, Sharma P. Abdominal obesity in India: analysis of the National Family Health Survey-5 (2019–2021) data. Lancet Region Health Southeast Asia. 2023;14:100208. doi:10.1016/j.lansea.2023.100208
17. Beck TJ, Petit MA, Wu G, LeBoff MS, Cauley JA, Chen Z. Does obesity really make the femur stronger? BMD, geometry, and fracture incidence in the women’s health initiative-observational study. J Bone Miner Res. 2009;24(8):1369–1379. doi:10.1359/jbmr.090307
18. Filip R, Raszewski G. Bone mineral density and bone turnover in relation to serum leptin, α-ketoglutarate and sex steroids in overweight and obese postmenopausal women. Clin Endocrinol. 2009;70(2):214–220. doi:10.1111/j.1365-2265.2008.03313.x
19. Yoshimura N, Kasamatsu T, Sakata K, Hashimoto T, Cooper C. The relationship between endogenous estrogen, sex hormone-binding globulin, and bone loss in female residents of a rural Japanese community: the Taiji Study. J Bone Miner Metab. 2002;20(5):303–310. doi:10.1007/s007740200044
20. Yüksel O, Dökmetaş HS, Topcu S, Erselcan T, Şencan M. Relationship between bone mineral density and insulin resistance in polycystic ovary syndrome. J Bone Miner Metab. 2001;19(4):257–262. doi:10.1007/s007740170029
21. Turcotte AF, O’Connor S, Morin SN, Gibbs JC, Willie BM, Jean S, Gagnon C. Association between obesity and risk of fracture, bone mineral density and bone quality in adults: a systematic review and meta-analysis. PLoS One. 2021;16(6):e0252487. doi:10.1371/journal.pone.0252487
 © 2024 The Author(s). This work is published and licensed by Dove Medical Press Limited. The full terms of this license are available at https://www.dovepress.com/terms.php and incorporate the Creative Commons Attribution - Non Commercial (unported, v3.0) License.
By accessing the work you hereby accept the Terms. Non-commercial uses of the work are permitted without any further permission from Dove Medical Press Limited, provided the work is properly attributed. For permission for commercial use of this work, please see paragraphs 4.2 and 5 of our Terms.
© 2024 The Author(s). This work is published and licensed by Dove Medical Press Limited. The full terms of this license are available at https://www.dovepress.com/terms.php and incorporate the Creative Commons Attribution - Non Commercial (unported, v3.0) License.
By accessing the work you hereby accept the Terms. Non-commercial uses of the work are permitted without any further permission from Dove Medical Press Limited, provided the work is properly attributed. For permission for commercial use of this work, please see paragraphs 4.2 and 5 of our Terms.