Back to Journals » International Journal of Nanomedicine » Volume 16
Label-Free Iron Oxide Nanoparticles as Multimodal Contrast Agents in Cells Using Multi-Photon and Magnetic Resonance Imaging
Authors Reynders H, Van Zundert I, Silva R, Carlier B, Deschaume O, Bartic C, Rocha S, Basov S, Van Bael MJ, Himmelreich U ![]() , Verbiest T, Zamora A
, Verbiest T, Zamora A
Received 2 September 2021
Accepted for publication 29 October 2021
Published 30 December 2021 Volume 2021:16 Pages 8375—8389
DOI https://doi.org/10.2147/IJN.S334482
Checked for plagiarism Yes
Review by Single anonymous peer review
Peer reviewer comments 2
Editor who approved publication: Prof. Dr. Anderson Oliveira Lobo
Hendrik Reynders,1 Indra Van Zundert,1 Rui Silva,1– 3 Bram Carlier,3 Olivier Deschaume,4 Carmen Bartic,4 Susana Rocha,1 Sergey Basov,5 Margriet J Van Bael,5 Uwe Himmelreich,3 Thierry Verbiest,1 Ana Zamora1,3
1Molecular Imaging and Photonics, KU Leuven, Leuven, Belgium; 2Engineering Department, Oporto University, Porto, Portugal; 3Biomedical MRI, Department of Imaging and Pathology, KU Leuven, Leuven, Belgium; 4Laboratory for Soft Matter and Biophysics, KU Leuven, Leuven, Belgium; 5Quantum Solid State Physics, KU Leuven, Leuven, Belgium
Correspondence: Ana Zamora Email [email protected]
Introduction: The inherent fluorescence properties of iron oxide nanoparticles (IONPs) were characterized, and their applicability for multiphoton imaging in cells was tested in combination with their magnetic resonance imaging (MRI) capabilities.
Methods: Superparamagnetic iron oxide nanoparticles were synthesized and subsequently coated with polyethylene glycol to make them water-dispersible. Further characterization of the particles was performed using Fourier transform infrared spectroscopy (FT-IR), X-ray diffraction (XRD), dynamic light scattering (DLS), superconducting quantum interference device (SQUID) and magnetic resonance relaxivity measurements. MRI and fluorescence properties of bare IONPs were first studied in solution and subsequently in A549-labeled cells.
Results: The particles, with a core size of 11.3 ± 4.5 nm, showed a good negative MRI contrast in tissue-mimicking phantoms. In vitro studies in mammalian A549 cells demonstrate that these IONPs are biocompatible and can also produce significant T2/T2* contrast enhancement in IONPs-labeled cells. Furthermore, excitation-wavelength dependent photoluminescence was observed under one- and two-photon excitation.
Discussion: The obtained results indicated that IONPs could be used for fluorescence label-free bioimaging at multiple wavelengths, which was proven by multiphoton imaging of IONPs internalization in A549 cancer cells.
Keywords: iron oxide nanoparticles, photoluminescence, biomedical imaging, MRI, cancer cells, multimodal imaging
Introduction
Multimodal imaging combines the advantages of two or more imaging modalities with the aim of overcoming limitations of individual methods in terms of specificity, resolution and sensitivity to enable early and accurate diagnosis of diseases, like cancer. Nanoparticles have shown a remarkable potential to enhance diagnosis thanks to their high surface-area-to-volume ratios and finely tunable size and shape.1,37 Recent examples of nano-based multimodal imaging include surface-enhanced Raman scattering (SERS) based imaging using branched gold nanoparticles (NPs),2 combined photoacoustic and CT imaging using gold nanostars,38 simultaneous computed tomography (CT) and magnetic resonance imaging (MRI) using gold and iron oxide nanocages3 and triple mode optical, MRI and photoacoustic imaging (PAI) using [GdO]+[ICG]− NPs.4 Furthermore, quantum dots,5 up-converting nanoparticles,6 gold7 and carbon-based8 materials have intrinsic near-infrared (NIR) optical absorbance, which is an advantage for deep tissue imaging. However, a major concern regarding the use of nanomaterials in patients is the potential toxic effects associated with their long-term biodistribution and clearance from the body.9,39,40
Iron oxide nanoparticles, in contrast, are highly biocompatible. IONPs are generally metabolized in the liver and eventually integrated into the body’s iron reservoir.10,41 This has made them very attractive for biomedical applications ranging from imaging to therapeutics and drug delivery.11,42,43 Some examples are the use of iron oxide or iron oxide-gold core-shell nanoparticles for photothermal or magnetothermal therapy and targeted thermo-chemotherapy.12,13,44–48 Moreover, the versatility of IONPs has already been demonstrated in clinically approved formulations used as T2/T2* contrast agents for MRI (Feridex®, Resovist®, Feraheme®)14 or as therapeutic agents for magnetic hyperthermia treatment of brain tumors (NanoTherm®).15 The MR imaging properties of IONPs arise from their magnetic properties. IONPs composed of magnetite (Fe3O4) with diameters of <20 nm exhibit a superparamagnetic behavior, ie each nanocrystal acts as a single magnetic domain, which influences the T2/T2* MRI relaxation time of the surrounding tissue, providing a negative contrast enhancement by decreasing or completely quenching the MR signal in the respective pixels.16
MRI is a useful imaging technique that provides both anatomical and functional information with high spatial resolution and excellent soft tissue contrast. However, its relatively low sensitivity is promoting the combination of MRI and more sensitive probes like positron emission tomography (PET) tracers or optical probes. In this way, static and quantitative MRI data are simultaneously combined with real-time dynamic information from optical fluorescence imaging or PET.17,49,50 Fluorescently labeled IONPs have been used for the in vivo detection and treatment of target-specific tumors.18 However, only two near-infrared fluorophores, indocyanine-green and methylene blue, have been approved for in vivo optical imaging by the US Food and Drug Administration (FDA).19 Moreover, nanoparticle-dye conjugates are not always easy to synthesize as some dyes can greatly compromise the stability of the nanoparticles in solution and their interaction with the biological environment is hard to predict.20,51,52 Another well-recognized disadvantage of conventional fluorescent proteins or organic dyes is photobleaching, which results from their structural instability and subsequent degradation.21 Due to these drawbacks, alternatives avoiding additional fluorescent labeling are usually preferred.
Even though the photoluminescence of colloidal Fe3O4 has recently been linked to their photothermal properties over a wide range of particle sizes (10 nm-5 µm), the literature in this respect is still scarce.22,53,54 Moreover, the two-photon emission properties of IONPs, which would allow deeper imaging of the material without harming the biological samples, remain unexplored. In addition, thanks to their compact crystal structure and strong Fe-O bonds, IONPs are very robust compounds, making them much less susceptible to irreversible decomposition, and hence, to photobleaching.
As a proof-of-concept, we explore the potential of label-free IONPs as MRI and optical dual-modality contrast agents. Biocompatible polyethylene glycol-coated iron oxide nanoparticles (PEG-coated IONPs) of ~11 nm have been synthesized, fully characterized and proved to exhibit good T2/T2* shortening effects in tissue-mimicking phantoms. The emission properties of PEG-coated IONPs have been studied under one- and two-photon imaging conditions. Furthermore, label-free PEG-coated IONPs were successfully imaged by multiphoton microscopy in human alveolar adenocarcinoma A549 cells.
Materials and Methods
Materials and Instrumentation
Sodium oleate, iron(III) chloride hexahydrate (97%), 2.2-dimethoxy-2-phenylacetophenone (DMPAP, 99%), and mercaptopropyl trimethoxysilane (95%), paraformaldehyde (PFA), eosin Y solution, agar, nitric acid (HNO3) potassium ferrocyanide, Triton X-100 and Hoechst 33342 were obtained from Sigma Aldrich; ethanol and oleic acid from VWR; heptane and toluene from Fisher Scientific; acetone from Chem Lab; 1-octadecene (90%) hydrochloric acid (HCl) 37% from Acros; triethylamine (TEA) from Janssen Chimica; and hydroxypolyethoxy (10) allyl ether from Polysciences, Inc; phalloidin-CruzFluorTM647 from SantaCruz Biotechnology, Dulbecco’s Modified Eagle Medium (DMEM) + Glutamax, McCoy’s Medium, Phosphate-Buffered Saline (PBS), Fetal Bovine Serum (FBS) and Penicillin/Streptomycin (Pen-Strep) from Gibco Invitrogen; Trypan Blue solution 0.4% from Roth and cell proliferation kit (XTT) from Sigma Aldrich.
Transmission electron microscope (TEM) images were acquired on a Zeiss EM-900 with an acceleration voltage of 80 kV. Samples were prepared by drying the IONPs on 300 mesh Formvar coated copper grids from Ted Pella. The TEM images were analyzed and size distributions calculated using ImageJ software.23 Fourier transform infrared (FT-IR) spectra were measured using a Bruker Alpha FT-IR spectrometer (Bruker, Ettlingen, Germany) equipped with a Platinum ATR module. The characterization of the crystalline phases of the materials was performed by X-ray diffraction (XRD) on powder samples with a Huber G670 imaging-plate Guinier powder diffraction camera. Mo-Kα1 radiation was used to analyze the nanoparticles within the 5°–70° 2Θ range. Dynamic light scattering (DLS) and zeta potential measurements were performed on a Malvern Nano ZS in a 175° backscatter geometry. Magnetic measurements were performed on a superconducting quantum interference device (SQUID) magnetometer (Quantum Design SQUID-VSM MPMS3). Hysteresis loops were measured on dried samples at several temperatures with a maximum magnetic field of ±70 kOe. A calibration measurement with a Pd reference sample was performed to quantify the trapped flux from the superconducting magnet of the magnetometer. This allowed correcting the field values in the hysteresis loops for the trapped flux. Magnetic resonance imaging (MRI) measurements were performed with a 9.4 T MR scanner (Bruker Biospec 94/20), equipped with actively shielded gradients (600 mT m−1) and using a 7 cm quadrature transmit-receive radio-frequency (rf) volume coil. For the characterization of MR relaxivities, a similar approach was followed as described in.24 UV/Vis absorption spectra were recorded on a Jasco V-730 spectrometer. Fluorescence emission spectra were recorded with an Edinburgh Instruments FS920 steady-state spectrofluorometer. Multi-photon emission spectra were recorded on a home-made nonlinear optical scattering setup25 consisting of a SpectraPhysics Insight DeepSee femtosecond pulsed laser, a Bruker SureSpectrum 500is spectrometer and an Andor iXon 897 EMCCD camera. The IONPs, dispersed in water, were measured in a 10 mm pathlength cuvette. The cells were imaged with a Leica SP8 DIVE multiphoton microscope, equipped with a 25x air objective, using excitation wavelengths of 770 nm for Hoechst 33342 (λex/one-photon = 350 nm) and 1294 nm for phalloidin-CruzFluorTM647 (λex/one-photon = 647 nm). Cells-labeled with bare PEG-coated IONPs were imaged using multiple excitation wavelengths (λex/one-photon = 325–500 nm or λex/two-photon = 790–1000 nm). ICP-MS measurements were performed on a Nexion 5000 system.
Synthesis of Oleic Acid Coated Iron Oxide Nanoparticles
Superparamagnetic iron oxide nanoparticles were synthesized following the procedure of Chen et al,26 with some adjustments. The procedure consisted in preparing an iron-oleate precursor, followed by its thermal decomposition as shown in Scheme 1A. For the precursor, sodium oleate (27.375 g, 90 mmol, 3 eq.) and iron (III) chloride hexahydrate (8.1 g, 30 mmol, 1 eq.) were added to a round-bottom flask containing a mixture of 60 mL ethanol, 45 mL MilliQ water, and 105 mL heptane. The resulting solution was heated to reflux at 74°C for 4 h and then extracted three times with MilliQ water. The heptane layer was collected and evaporated under reduced pressure. For the thermal decomposition step, the iron-oleate precursor (5.4 g) was added to a three-neck flask and mixed with oleic acid (5.681 mL) and octadecene (18 mL). The solution was heated to 320°C using a heating mantle and thermoregulator, at a rate of 600°C/h. The solution was kept at this temperature for 2.5 h. Nanocrystals of different diameters were prepared similarly. Smaller IONPs of 7 nm required a slower heating rate of 200°C/h and 30 min of thermal decomposition at 320°C, while 1200°C/h and a heating time of 5 h at 320°C were used to prepare nanoparticles of 15 nm. After cooling down, the solution was extracted multiple times with ethanol and dried in a vacuum oven. The oleic acid-coated nanoparticles (OA-IONPs) were dispersed in heptane to a final concentration of 100 mg/mL.
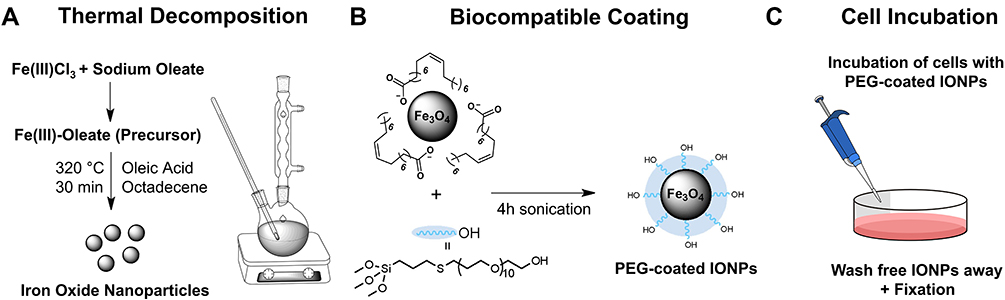 |
Scheme 1 A schematic diagram of the experimental process with (A) the nanoparticle synthesis using a thermal decomposition method, (B) the nanoparticle coating with PEG polymers to make them biocompatible and (C) the uptake of the nanoparticles in the cells after incubation and washing. The diagram was made using Chemdraw software. |
Functionalization of Iron Oxide Nanoparticles with PEG Chains
The procedure for nanoparticles coating with polyethylene glycol was based on a method by Bloemen et al.27 In a glass tube, hydroxypolyethoxy (10) allyl ether (498 mg, 1 mmol, 1 eq.) was added together with (3-mercaptopropyl) trimethoxysilane (1 eq, 1 mmol, 186 μL), 2,2-dimethoxy-2-phenyl-acetophenone (0.05 eq, 0.05 mmol, 12.8 mg) and chloroform (500 μL). This mixture was stirred inside a UV-reactor equipped with three LEDs (365 nm, output power 200 mA) for 1 h. After the thiol-ene click reaction, the crude product was added to the OA-IONPs in heptane (1 mL, 100 mg) together with toluene (50 mL), triethylamine (2.5 mL), and MilliQ water (0.05 mL). The mixture was then sonicated for 4 h. Next, heptane (50 mL) was added to precipitate the nanoparticles, which were collected magnetically and washed three times with acetone. The obtained aggregates were then redispersed in MilliQ water. The Fe concentration was measured spectrophotometrically at 480 nm.28 For all in vitro tests, PEG-coated IONPs were diluted in cell medium at different concentrations. The functionalization reaction is visualized in Scheme 1B.
PEG-Coated IONPs Relaxivity in Solution
To analyze relaxivity, nanoparticles were dispersed at different concentrations in 2% agarose gel in 300 μL tubes as previously described.10 Nine 1-mL Eppendorf tubes containing the diluted solutions were arranged in a circular pattern around a blank vial containing distilled water for the IONP formulation. The tubes were scanned in a 9.4 T Bruker Biospec small animal MRI system at room temperature. For T1 measurements and calculations of r1, an inversion recovery sequence (FAIR) was used. Acquisition parameters were echo time (TE) 7.5 ms, repetition time (TR) 10 s, first inversion time (TI) 50 ms with 12 increments of 500 ms. For T2 measurements and r2 calculations, a multi-slice multi-echo (MSME) spin-echo sequence was used. Acquisition parameters were TE 10.5 ms with 16 increments of 10.5 ms and TR 5 s. For the measurement of T2* values, a gradient echo sequence was used. Acquisition parameters were TE 2.5 ms with 16 increments of 4 ms, TR 7 s and a flip angle of 30°. The geometry was identical for all acquisitions: 1 mm slice thickness, 50 × 50 mm2 field of view, 256 × 256 matrix, resulting in an in-plane resolution of 0.195 mm. The ParaVison 6 software (Bruker Biospin) was used to calculate parametric relaxation time maps of regions of interest (ROIs) corresponding to the respective sample tubes. Decay curves were fit with a mono-exponential decay equation to calculate T2 (or T2*), 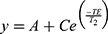 and a mono-exponential growth saturation recovery equation to calculate T1,
 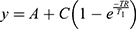 , where A is the absolute bias and C is the signal intensity T2 of the samples.
Cell Lines and Culture Conditions
Human alveolar adenocarcinoma A549 cells, human non-tumorigenic lung epithelial BEAS-2B cells and murine hepatic stellate GRX cells were cultured in Dulbecco’s modified Eagle’s medium (DMEM), supplemented with 10% fetal bovine serum, 1 mM sodium pyruvate, 2 mM glutamine and 1% pen-strep. Cells were maintained at 37°C in a humidified atmosphere containing 5% CO2. Cells were split upon reaching 80–100% confluency. The GRX cell line was kindly provided by Prof. Leo van Grunsven, LiVR, ULB, Brussels, Belgium (originally acquired from Cell Biologics, Catalog No. C57-6242) and A549 cell line by Prof. Stefaan Soenen, KU Leuven, Leuven, Belgium (originally acquired from ATCC, reference code ATCC® CCL-185). Human epithelial cell-line BEAS2B was also acquired from ATCC (reference code ATCC® CRL-9609™). The nanoparticle uptake in the cells is depicted in Scheme 1C.
Visualization of Cellular Uptake of PEG-Coated IONPs by Prussian Blue Staining
A549, BEAS-2B and GRX cells were seeded on a 96-well-plate at a density of 3500 cells/well for the 24 h treatment and 1500 cells/well for the 72 h-treatment and left to adhere overnight. Afterwards, the medium was replaced by PEG-coated IONP containing cell culture medium at concentrations of 0, 10, 20, 50, 100 and 250 µg Fe per mL, and cells were incubated for 24 h and 72 h, respectively. After treatment, the cells were washed with HBSS to remove any free IONPs, and subsequently fixed with 100 μL of 4% PFA for 15 min at room temperature. Afterwards, the fixative was removed, and cells were incubated at room temperature for 30 min with 100 μL of a 1:1 mixture of 2% aqueous HCl solution and 2% aqueous potassium ferrocyanide solution. The cells were then rinsed with PBS and stained with 100 μL of a 0.25% aqueous solution of Eosin. Finally, cells were washed to remove the excess of reagents and left in 100 μL of PBS. Images were obtained with a Xiaomi MI 9T cell phone through the lens of an Olympus CKX41 microscope at 20x and 40x magnification.
Assessment of Potential Toxic Effects
XTT Colorimetric Assay
In order to assess the effects of nanoparticle exposure on cell metabolism, cells were seeded on 96-well plates at different cell densities (5×10³, 3.5×10,3 and 2 × 10³ cells/well) depending on the exposure duration (24 h, 48 h and 72 h) and left to adhere overnight. Afterwards, cells were washed with HBSS and the nanoparticles, dispersed in the cell medium, were added at various concentrations ranging from 0 to 250 μg Fe per mL. Cells were then incubated with the NPs for 24 h, 48 h and 72 h. At the different timepoints, cells were washed 3x with HBSS, to remove cell debris and NP excess, and further incubated with 100 μL of a 0.5 mg/mL solution of XTT + 1% PMS in cell medium for 4 h. XTT absorbance was measured at 450 and 690 nm after 4 h incubation using a Multiskan FC photometer (Thermo Fisher). A background read-out was performed by measuring the absorbance of XTT incubated for 4 h in eight empty wells (containing no cells). Finally, the results were obtained by calculating the difference between the absorbance at 450 nm and 690 nm and subtracting the average background (also determined as the absorbance difference at both wavelengths).
Trypan Blue Exclusion Assay
In order to assess the number of viable cells after nanoparticle incubation, A549 cells were seeded on 24-well plates at different cell densities (6×10⁴, 4 × 10⁴ and 2.5 × 10⁴ cells/well) depending on the exposure duration (24 h, 48 h and 72 h) and left to adhere overnight. Similarly, BEAS-2B and GRX cells were seeded at cell densities of 5×10⁴, 2.5×10,4 and 1.5x10⁴cells/well. Afterwards, cells were washed with HBSS and the nanoparticles, dispersed in cell medium, were added at various concentrations ranging from 0 to 250 μg Fe per mL. Cells were then incubated with the NPs for 24 h, 48 h and 72 h. At the different time points, cells were detached with Trypsin 1x for 10 min, which was further diluted in 2x the volume of cell medium to stop the reaction. 80 μL of cell suspension was mixed with 20 μL of Trypan Blue 0.4% for the A549 cells. For the BEAS-2B and GRX cells, cell suspensions were first transferred to an Eppendorf tube and centrifuged for 5 min at 200 g to concentrate the cells, and 20 µL of the final suspension was mixed with 80 µL of Trypan Blue. In all cases, 10 μL of the stained solution was placed on the hemocytometer to count the cells manually under the microscope.
MR Image Acquisition of A549 Cells Labeled with PEG-Coated IONPs
Cells were seeded and treated with the NPs as described by the Trypan Blue Exclusion Method. The NPs concentrations used were 0, 50, 100 and 250 μg Fe per mL. For phantom experiments, 500 μL Eppendorf tubes were filled with a bottom layer of 100 μL of 2% agar gel. After solidifying, 150 μL of cell suspensions with different cell densities (50, 100, 250 and 400 cells/μL) was mixed homogenously with 150 μL of 2% agar gel. This mixture was added on top of the bottom layer of agar and left still until solidifying. Finally, a top layer of 2% agar gel was added to trap the cell layer. To prepare the phantom background, 50 mL of 2% agar gel was poured into a cylindrical in-house made Teflon holder. While the agar was still liquid, the previously prepared Eppendorf tubes were placed on it and left there until the solution solidified. The phantom was placed in the quadrature rf coil of the Bruker Biospec 9.4 T small animal MR scanner. MR images for the calculation of T1, T2 and T2* relaxation times were acquired according to.24
Assessment and Visualization of the Cellular Uptake of PEG-Coated IONPs by Multi-Photon Microscopy
A549 cells were seeded in 29 mm glass bottom dishes (#1 cover glass) and grown overnight in DMEM supplemented with 10% FBS. The next day, 100 µg/mL PEG-coated IONPs were administered to the cells. After 72 h of incubation with PEG-coated IONPs, the dishes were washed three times with 1x PBS and fixed with 4% formaldehyde. Afterwards, cells were permeabilized using 0.1% Triton X-100 for 10 min at room temperature. The cells were stained at room temperature for 1 h with 1:1000 phalloidin-CruzFluorTM647 and for 1 h with 1:1000 Hoechst 33342 dye. Identical microscope settings (laser power, detector gain, and pixel size) were used to image the A549 samples with and without PEG-coated IONPs. The images were analyzed using ImageJ.
Quantification of the Iron Uptake in A549 Cells Using ICP-MS
The A549 cells were seeded in 24-well plates, and IONPs were added at the respective concentrations and incubated for 24 h. The excess IONPs were removed and the samples washed 3 times with Hanks’ Balanced Salt Solution (HBSS). Next, the cells were detached using trypsin and redispersed in cell medium. After transfer to Eppendorf tubes and centrifugation for concentration, the cells were counted. Samples with 20,000 and 50,000 cells were digested using 65% HNO3 and diluted with water. The iron content of the digested nanoparticles inside the cells was measured using ICP-MS.
Statistical Analysis
Values are presented as mean ± standard error of the mean (SEM) of 3 independent experiments. Statistical analysis was performed with the GraphPad Prism 8.0 Software (www.graphpad.com). To test interactions between two factors and their main effects, we used Two-Way ANOVA with the Bonferroni post-hoc test for multiple comparisons. To compare two or more groups with the control we used a One Way ANOVA with Dunnet’s post-hoc test. Statistical difference was considered for P<0.05.
Results and Discussion
Synthesis, Morphology and Size Distribution of Oleate-Capped IONPs
Oleate-capped nanoparticles were synthesized by the thermal decomposition of Fe3+-oleate precursors at a temperature of 320°C, as previously reported.26 The morphology of oleic acid-coated IONPs (OA-IONPs) was observed by transmission electron microscopy (TEM), and the mean size of the NPs was extracted using ImageJ. As shown in Figure 1, the prepared IONPs exhibited a spherical morphology with an average diameter of 11.3 ± 4.5 nm. This nanoparticle size was chosen as a compromise between good magnetic properties and optimal cellular uptake. The polydispersity index (PDI) of 0.158, calculated as the square of the standard deviation divided by the mean particle diameter, indicates a polydisperse size distribution of the nanoparticles.
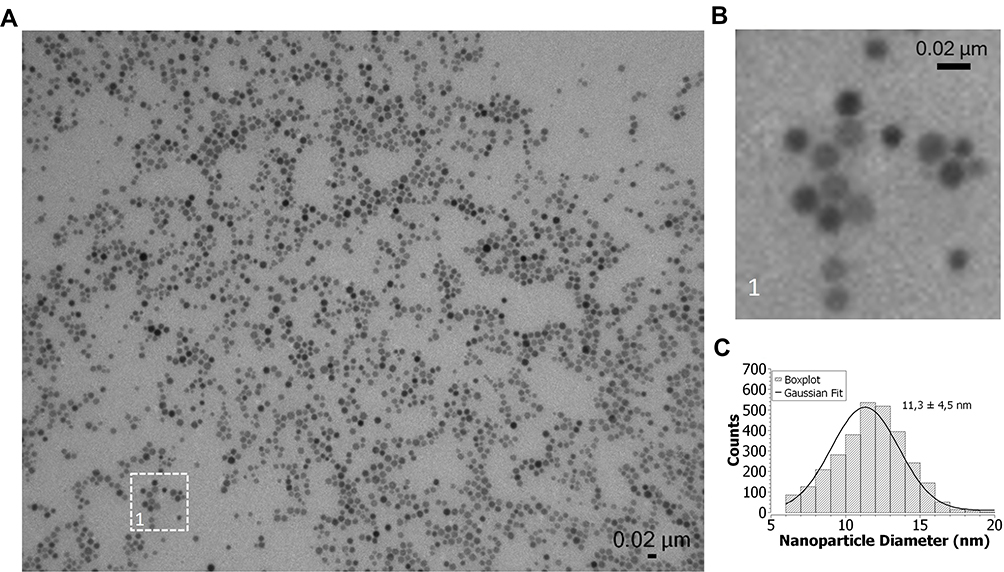 |
Figure 1 (A) TEM images of OA-IONPs in heptane. (B) Magnified area of the TEM image showing the OA-IONPs. (C) Size distribution of 11.3 ± 4.5 nm obtained by analyzing around 3000 particles with ImageJ. |
Synthesis and Characterization of PEG-Coated IONPs
IONPs capped with oleic acid ligands are hydrophobic and therefore not suitable for biomedical applications. To make them water-dispersible and biocompatible, the oleate groups were replaced by hydrophilic polyethylene glycol (PEG) chains following a protocol designed in our lab (Scheme 1B).27 This approach relies on the formation of Fe–O–Si covalent bonds between silanol groups and the reactive hydroxyls present on the surface of the iron oxide nanoparticles. The successful phase transfer of the nanoparticles from heptane to water and their good water dispersibility after the PEG exchange reaction demonstrated a successful PEG capping. Fourier transform infrared spectroscopy (FT-IR) was used to further confirm the presence of PEG chains on the iron oxide nanoparticles surface. Figure 2A shows a comparison between the infrared spectra of IONPs before and after PEGylation. Two new peaks clearly appeared at 3500 and 1100 cm,−1 while the carbonyl (C=O) peak from the oleate end group at 1700 cm−1 disappeared after PEGylation. The high-intensity vibration band of Si–O group at 1100 cm−1 confirmed that the PEG molecules were anchored on the surface of the magnetic nanoparticles through the silane end group. Likewise, the characteristic broad band at 3500 cm−1 is attributed to the stretching of the terminal hydroxyl groups of the PEG chains. Other absorption peaks assigned to the scissoring, asymmetric and symmetric stretching of CH2 can be observed at 2900, 2850 and 1500–1250 cm−1. Additionally, a Fe-O peak at around 550 cm−1 further verified that the core of the NPs was still Fe3O4. The differences between the two FT-IR spectra therefore confirmed that Fe3O4 NPs were successfully functionalized with PEG.
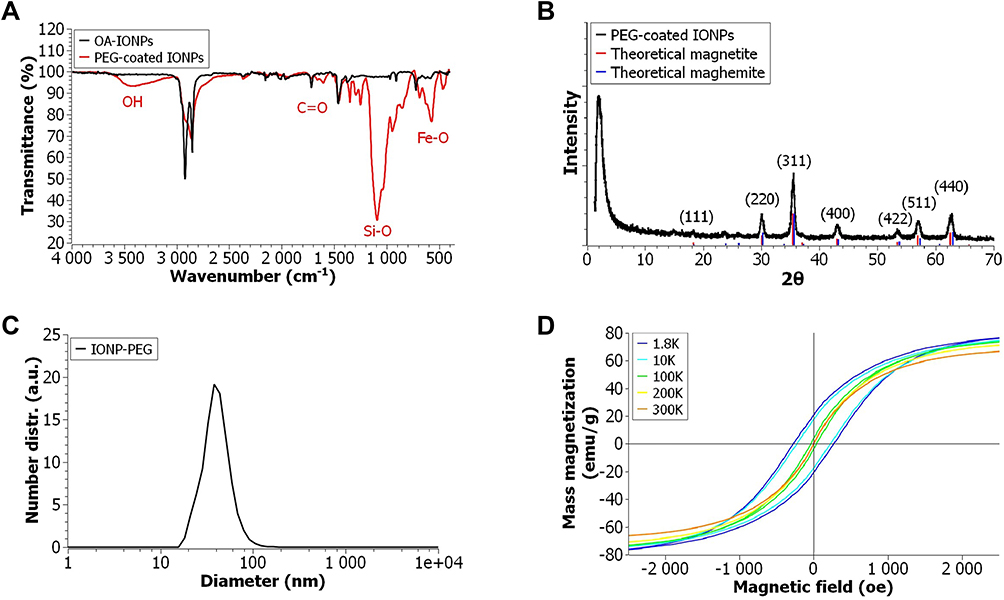 |
Figure 2 (A) FT-IR spectra of OA-IONPs and PEG-coated IONPs, (B) Powder XRD profiles for PEG-coated IONPs and the theoretical values for magnetite (JCPDS file no. 19–0629) and maghemite (JCPDS file no. 39–1346), (C) DLS measurement of PEG-coated IONPs, (D) M–H curve of PEG-coated IONPs at different temperatures. |
PEG-coated IONPs were fully characterized using a variety of techniques, such as dynamic light scattering (DLS), zeta potential, X-ray diffraction (XRD) and SQUID measurements (Figure 2). DLS studies showed that the hydrodynamic diameter of the IONPs from cumulants analysis was 42.1 ± 7.9 nm, ensuring a long circulation time and an easy clearance from the body.29 Their zeta potential in deionized water was found to be slightly negative, ζ = −5.21 ± 0.73 mV. PEG-coated IONPs of 9.3 nm with a negative surface charge have previously shown remarkable stability in serum and plasma, which is of major importance for their use in biomedical applications.27 Powder XRD patterns in a wider-angle range of the PEG-coated IONPs are presented in Figure 2B. The position and relative intensities of the main peaks closely match those of magnetite (JCPDS card No. 19-0629) and maghemite (JCPDS card No. 39-1346) with an inverse spinel structure, indicating that the iron oxide phase present in the core of the particles may contain either one or both of these iron oxide phases. The average lattice distance of the nanoparticles, calculated from the XRD data, was found to be 8.39 Å. This value is in agreement with the theoretical value of 8.4 Å for Fe3O4. Finally, the magnetic properties of the PEG-coated IONPs were evaluated by measuring the magnetization of a dried sample at different temperatures in a SQUID-based magnetometer. The hysteresis loops were recorded at 300, 200, 100, 10 and 1.8 K with a field varying from −70 to +70 kOe. Magnetization data were normalized to the sample mass assuming that all iron present exists as Fe3O4. It can be observed that the PEG-coated IONPs show a superparamagnetic behavior at room temperature with negligible room temperature coercive fields (Hc =- 0.4 Oe) and remanence (MR = 0.05 emu/g Fe3O4). The mass magnetization (Ms) of 74.9 emu/g obtained for the sample at 70 kOe and 300 K is below that reported for bulk magnetite (Ms = 92 emu/g) and comparable to previously reported values for iron oxide nanoparticles, which can be understood because of contributions from the surface layer with reduced magnetization, other possible background signal, as well as the contribution of the organic capping layer to the total mass.30,55 In contrast, after a broad transition region around 100–200 K a dominant ferrimagnetic hysteretic behavior is observed at lower temperatures, eg 10 and 1.8 K. However, the magnetization value acquired at 70 kOe, showed a progressive decrease with increasing temperature, indicating that the moment is not fully saturated at a maximum field of 70 kOe. The discrepancy between the acquired and theoretical saturation values can be attributed to the distribution of particle size and surface effects. Local characterization techniques, such as Mössbauer spectroscopy, would be required for a better understanding.
MRI Contrast of PEG-Coated IONPs
To determine the relaxivity values of the PEG-coated IONP dispersion under biologically relevant conditions, longitudinal (T1) and transverse proton relaxation times (T2 and T2*) of tissue-mimicking phantoms were measured as a function of iron concentration at 9.4 T, room temperature. The thin PEG coating of the IONPs is expected to have a minimal influence on their relaxivity.31 Agar phantoms are well known to display proton density and diffusion properties similar to those observed in biological tissues32 so that the obtained relaxation times are comparable to those of human tissue. Thus, PEG-coated IONPs were diluted with deionized water at different Fe concentrations and later embedded in 2% agar. As shown in Figure 3, the observed relaxation rates (R) are linearly dependent on the concentration of Fe. The slope of the dependence is the relaxivity (r), and the y-intercept is the native relaxation rate of the solution prior to nanoparticles addition. The PEG-coated IONPs exhibit r1, r2 and r2* values of 1.84, 82.5 and 132.7 mM−1 s−1, respectively. Thus, the r2/r1 and r2*/r1 ratios, which are 44.9 and 72.2, confirm that the PEG-coated nanoparticles have potential as T2 MRI contrast agent. The increased contrast is manifested by a “darkening effect” in T2-weighted MR images (top row of Figure 3B) and can be quantified by the respective T1, T2 and T2* maps (Figure 3B, row 2 to 4) with a dose-dependent decrease in the mean values of T1, T2 and T2* as a function of the iron concentration. The linearity range goes up to 20 µg/mL in the case of R2 and in all cases, the maximum detection limit of the device was reached for concentrations higher than 80 µg/mL.
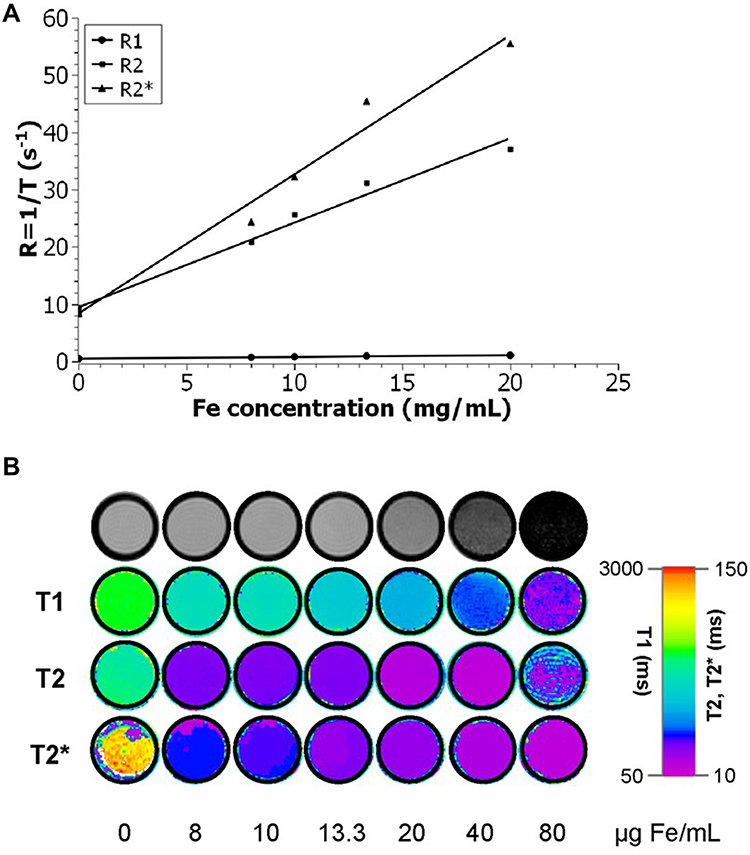 |
Figure 3 (A) Relaxation rate Ri (Ri = 1/Ti) over Fe concentration of the PEG-coated IONPs in solution. The slope indicates the specific relaxivity (ri), which values have been converted to mM−1 s−1 using the molar mass of iron (M = 55.845 g/mol). (B) Top row: T2-weighted MR images of increasing PEG-coated IONP concentrations, and row 2 to 4: color-coded T1, T2 and T2* relaxation times with increasing PEG-coated IONP concentrations. |
Emission Properties of PEG-Coated IONPs
The UV-visible spectrum of PEG-coated IONPs (0.01 mg/mL) dispersed in deionized water shows an absorption band in the region of 330–450 nm, which originates primarily from the absorption and scattering of UV radiation (Figure S1). The emission spectrum of PEG-coated IONPs (0.01 mg/mL) dispersed in deionized water was measured at different excitation wavelengths, ranging from 350 nm to 500 nm. Figure 4A shows that the photoluminescence of PEG-coated IONPs varies from blue to orange (450–575 nm), meaning that the nanoparticles exhibit an excitation wavelength-dependent emission. The initial OA-IONPs present very similar spectra (Figures S2 and S3) to that of the PEG-coated IONPs.
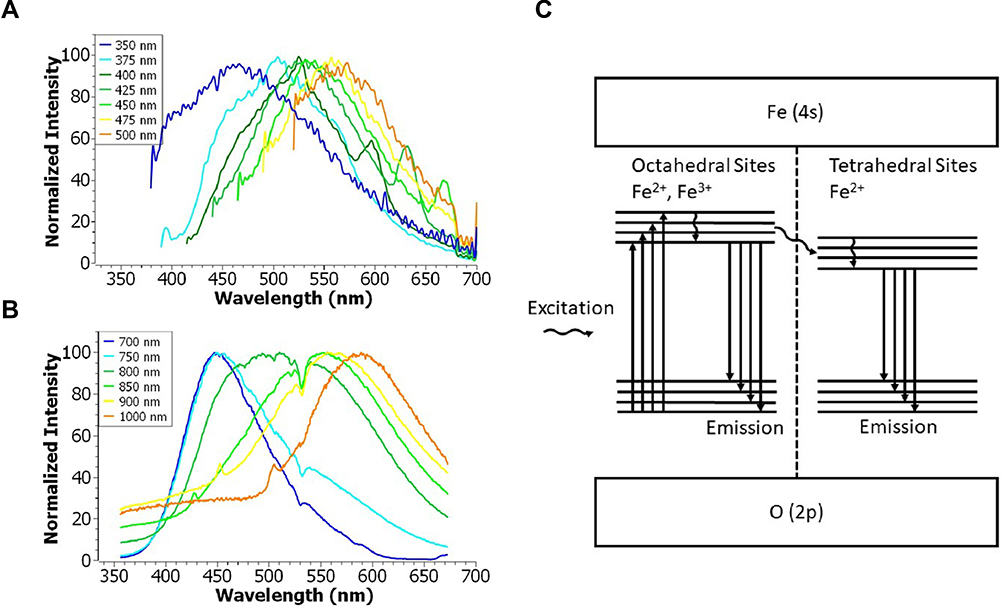 |
Figure 4 (A) One-photon and (B) two-photon emission spectra of PEG-coated IONPs (0.01 mg/mL) dispersed in water at different excitation wavelengths. (C) Proposed Jablonski diagram for the PEG-coated IONP emission properties. |
Despite various in-depth studies on multicolor photoluminescence,33,34 the origin of this phenomenon is still debatable. Up to now, no individual model can explain all aspects related to excitation-dependent emission. In order to gain more insight on the excitation-dependent emission of IONPs, the emission maps of OA-coated IONPs of different sizes (7, 11.3 and 15 nm) and at different concentrations (data not shown for 7 and 15 nm IONPs) were measured. Figure S2 shows the emission of IONPs of different sizes at a fixed concentration of 0.1 mg Fe/mL. In all cases, the wavelength-dependent emission remains the same, which proves that the multicolor photoluminescence of IONPs is not size-related. Interestingly, a red shift of the excitation maximum is observed when increasing IONPs concentration (Figure S3). This is in agreement with the work of Lai et al,35 who investigated the mechanism behind graphene quantum dots and attributed the concentration effects to aggregation. More recently, Zanin et al described the intrinsic photoluminescence of bare superparamagnetic IONPs upon 495 nm light excitation.36 Here, we further validate the intrinsic photoluminescence property of bare IONPs, and demonstrate that multiple excitation wavelengths can be used for multicolor emission.
Note that for excitation wavelengths of 400, 425 and 450 nm, a secondary emission peak is observed at 595, 630 and 670 nm, respectively. This secondary emission can be attributed to the nature of the iron oxide crystal. The Jablonski diagram (Figure 4C), constructed based on a previous study,22,53,54 illustrates the photoluminescence of IONPs. The spinel structure in bulk magnetite (Fe3O4) has a face-centered-cubic lattice of oxygen ions, with iron atoms in the octahedral (Fe2+ and Fe3+) and tetrahedral sites (Fe2+). Both experiments and theoretical calculations have previously demonstrated a difference in the energy gap between the octahedral and tetrahedral sites.22,53,54 IONPs can be irradiated at different wavelengths to reach different excited states. The photoluminescence peaks with the highest intensities come from the radiative recombination of mobile electrons from excited to ground state at the octahedral sites. The much weaker, secondary photoluminescence peaks originate from the emission produced by the tetrahedral sites after non-radiative intersystem crossing from the octahedral sites.
Interestingly, the photoluminescence of the PEG-coated IONPs was also observed under two-photon excitation (Figure 4B). The excitation wavelength-dependent emission remained the same, but the tetrahedral sites emission was not visible probably due to high intensity originating from the octahedral sites after laser irradiation. The quadratic dependence of the intensity confirms that the emission is a two-photon process (Figure S4).
Uptake and Cytotoxicity of PEG-Coated IONPs
Uptake of IONPs was studied by Prussian Blue staining and by ICP-MS measurements. First, it was optically confirmed that the PEG-coated IONPs were taken up by the A549 cells without causing any remarkable morphological change (Figure 5). The images clearly show a higher accumulation of PEG-coated IONPs after 72 h of incubation compared to 24 h, indicating a continuous cellular uptake over time. Besides, PEG-coated IONPs could be observed embedded in small vesicles (endosomes/lysosomes) either near the cell membrane or around the nucleus, suggesting that the uptake occurs through an endocytic pathway.10 Additionally, the uptake of PEG-coated IONPs in A549 cells was quantified with ICP-MS (Figure S5).
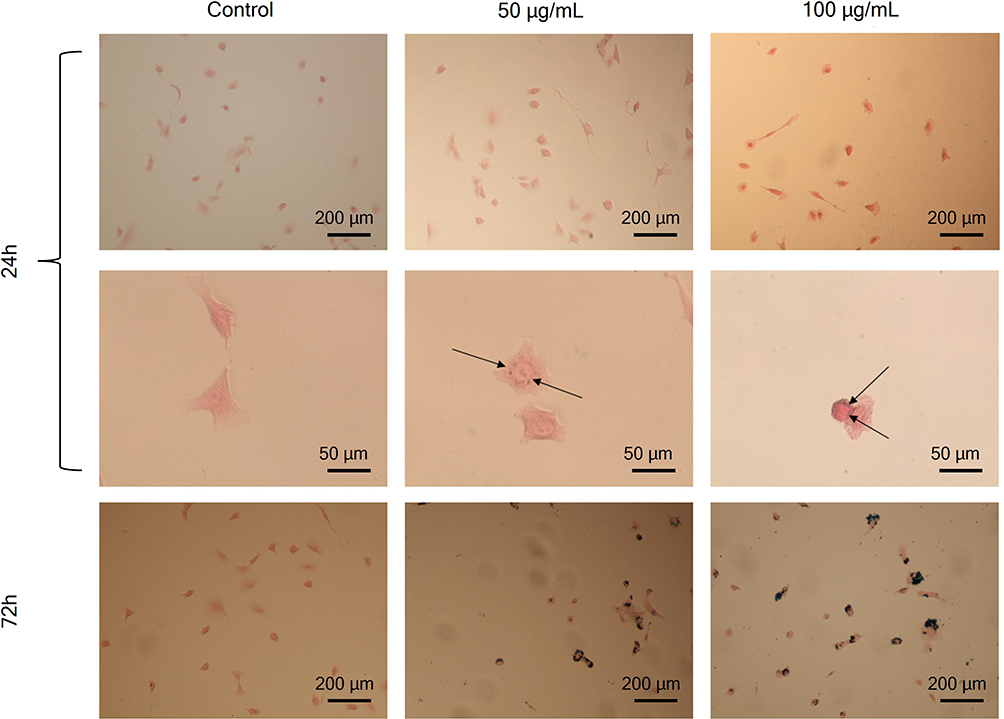 |
Figure 5 Prussian Blue staining of labeled A549 cells with 50 and 100 µg/mL at 24 and 72 h of incubation. The black arrows point to NPs inside the cells. The black arrows point to PEG-IONPs embedded in vesicles inside the cells. Images at 72 h of incubation with PEG-IONP showed a clear increase of the nanoparticles cellular uptake. |
In order for the PEG-coated IONPs to be considered as suitable MRI/optical contrast agents in vitro and in vivo, their cytotoxicity was tested using two conventional colorimetric assays, the trypan blue exclusion test and XTT assay. The two independent cytotoxicity assays, which are based on the cell membrane integrity and the metabolic activity of cells, respectively, were conducted to avoid false positive or false-negative results as the PEG-coated IONPs could interfere with their detection mechanism. The assays were conducted for three different exposure times: 24 h, 48 h and 72 h, with PEG-coated IONP concentrations ranging between 0 and 250 µg Fe/mL. To fully validate the biocompatibility, three different cell lines were tested: A549, BEAS-2B and GRX. In terms of cytotoxicity, the results obtained from both tests show that the nanoparticles do not seem to affect the cells. However, the decreased cell number ratio over the control combined with the decreasing metabolic rates would indicate that they do have a cytostatic effect at increasing Fe concentrations (Figures 6 and S6). In general, a gradual decrease in cell proliferation (cell numbers relative to unlabeled controls) was observed with increasing nanoparticle concentration for as long as the cells were exposed to them (Figure S7). However, all viability data remained within non-toxic range, with low standard deviation values, indicating that the PEG-coated IONPs display a low cytotoxicity and are, therefore, biocompatible.
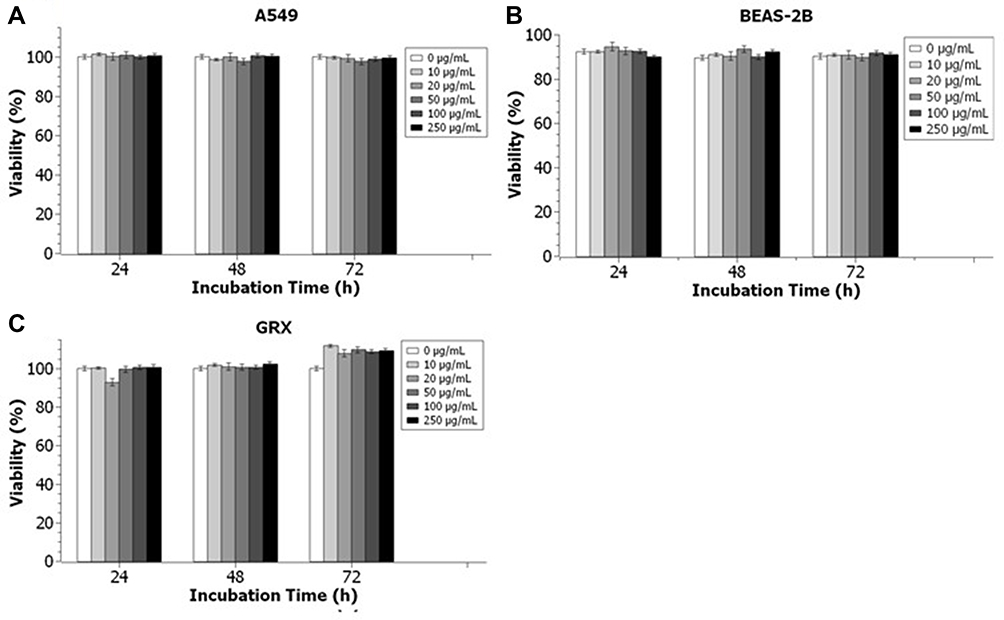 |
Figure 6 Trypan blue exclusion cytotoxicity assay of (A) A549 cells, (B) BEAS-2B cells and (C) GRX cells incubated with PEG-coated IONPs at different concentrations for different exposure times (24h, 48h and 72h). Data was collected from two independent experiments with three replicates per sample and analyzed with Two-Way ANOVA with Bonferroni post-Hoc test. Concentration effect (P>0.05); Day effect (P>0.05); Interaction (P>0.05). |
Relaxivity of PEG-Coated IONPs in Mammalian Cells
To determine the suitability of the PEG-coated IONPs as MRI contrast agents for cell imaging, the relaxation times in mammalian cells were evaluated. T2 weighting parametric maps were used to determine the contrast generated for A549 cells labeled with the PEG-coated IONPs. An overall dose-dependent decrease in the relative T2 weighted intensity was observed with the increase of both the NPs concentration and the cell number (Figures 7 and S8). The higher contrast observed for the different NP concentrations at a fixed cell number as well as for the same NP concentration at higher cell number might just be a result of a higher cellular uptake. This effect has been observed in several types of nanoparticles and has been attributed to their endosomal internalization in cells, which causes a clustering and hence an increase in relaxivity.10 However, a significant difference in the signal intensity was only achieved at 400 cells/μL and a concentration as low as 50 μg/mL of nanoparticle treatment. Thus, the contrast properties of the labeled cells could be improved by modifying the incubation conditions (ie using either a higher NP concentration or longer period of NP treatment), or alternatively by modifying the surface ligands on the IONPs to increase the uptake.
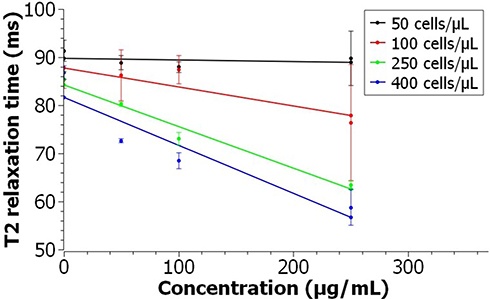 |
Figure 7 T2 relaxation time of A549 cells labeled with PEG-coated IONPs as a function of the Fe concentration. Error bars indicate standard deviations of experiments repeated in triplicates. |
Fluorescence Imaging of PEG-Coated IONPs in Mammalian Cells
In order to prove the in vitro applicability of label-free PEG-coated IONPs for multimodal MRI and optical imaging, internalization of the nanoparticles into A549 cancer cells was imaged using multi-photon microscopy. Taking advantage of the multiple excitation wavelengths that can be used to excite the PEG-coated IONPs, we opted for a two-photon excitation wavelength of 920 nm (λex/one-photon ̴ 460 nm). Using this excitation wavelength, the maximum emission wavelength is around 560 nm (Figure 4B). In this way, two additional dyes: Hoechst 33342 (λex/one-photon = 350 nm, λex/two-photon = 770 nm) and phalloidin-CruzFluorTM647, (λex/one-photon = 647 nm, two-photon excitation, 1294 nm) could be simultaneously used for the specific staining of the nucleus and the cytoskeleton, respectively. A549 cells were incubated with the PEG-coated IONPs (100 μg/mL) for 72 h, followed by fixation and staining. This prolonged incubation time was chosen based on the Prussian Blue staining results in A549 cells, in which an increased internalization of the PEG-coated IONPs was observed at this time point (Figure 5). Z-stacks of cells incubated for 72 h with or without IONPs (Figure 8A and E) show the cellular uptake of PEG-coated IONPs. The additional phalloidin-CruzFluorTM647 staining proves that the PEG-coated IONPs are located inside the cells (orthogonal views in Figure 8A and E). Figure 8F–H depict the PEG-coated IONP detection channels only, showing the photoluminescence signal of our PEG-coated IONPs (not detected in the absence of particles, Figure 8B–D). Although there is a bleed-through of the fluorescence signal of the Hoechst dye in the IONP detection channel due to Hoechst’ broad emission band, this bleed through is also present in the control (no PEG-coated IONPs added). Taken together, these results indicate that these label-free PEG-coated IONPs generate sufficient photoluminescence signal to be used for fluorescence imaging purposes in mammalian cells. This has the advantage of avoiding possible cytotoxicity of fluorescence dyes that otherwise need to be added to the nanoparticles. Additionally, since IONPs can be visualized directly, they avoid misleading interpretations due to possible detachment of the fluorescence probes.
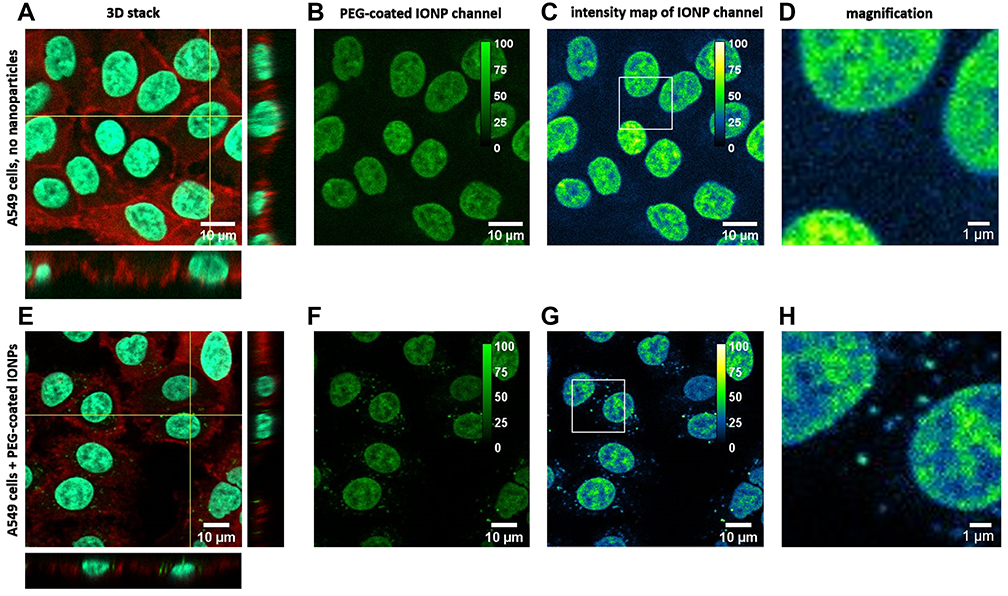 |
Figure 8 Two-photon fluorescence images of A549 cells incubated for 72 h without IONPs as a control (A–D). (A) Channel overlay, (B) IONP channel and (C) intensity range map of the IONP channel, with magnified area (D). A549 cells after 72 h incubation with PEG-coated IONPs (E–H). (E) Overlay of the 3 channels with the IONPs in green, the nucleus in cyan and the cytoskeleton in red. (F) IONP detection channel only and (G) Intensity range map from the IONP channel together with (H) a magnified area, indicating the presence of IONPs (calibration bar in the top right). |
Conclusions
We have investigated the suitability of label-free IONPs as potential multimodal MRI and optical contrast agents. Fe3O4 nanoparticles were coated with PEG to make them water-dispersible and biocompatible. Multiple techniques (TEM, XRD, SQUID) proved the composition of the magnetic core and the successful coating of the nanoparticles’ surface was proven by FT-IR measurements. In tissue-mimicking phantoms at 9.4 T, the PEG-coated IONPs presented r2/r1 and r2*/r1 ratios of 44.9 and 72.2, confirming their potential as T2-weighted MRI contrast agents. Furthermore, excitation-wavelength dependent photoluminescence was observed for the nanoparticles under one- and two-photon irradiation. The PEG-coated IONPs showed a continuous accumulation in A549 cells by Prussian blue staining while presenting low cytotoxicity (cell viability remained above 80%) as evidenced by two independent colorimetric assays. Finally, we demonstrate that the nanoparticles provide sufficient T2 contrast and photoluminescence under the microscope in mammalian cells. Thus, this study provides new insights into the use of PEG-coated IONPs without any additional fluorophore as dual MRI and optical contrast agents. The optical properties of the nanoparticles, which could be optimized by fine-tuning their size and surface coating, could also be combined with other properties of IONPs to study transport and drug release. To the best of our knowledge, this is the first report stating that photoluminescence of IONPs can be used for in vitro fluorescence imaging. Up to now, only a limited number of studies have discussed the emission properties of IONPs, and our results suggest that these are not trivial and bear appealing potential for in vitro and possibly in vivo applications.
Acknowledgments
We thank Dr. Michèle Moris for her technical support with the nonlinear optical scattering setup. This work was supported by the Research Foundation – Flanders (FWO) and by the KU Leuven C1 program (Grant No. C14/18/074). The authors acknowledge Hercules Stichting (Project No. AKUL/13/25). I. Van Zundert acknowledges support from FWO (grant 11F5419N), A. Zamora from Fundación Séneca (20236/PD/17), O. Deschaume from KU Leuven (research grant C14/16/063), C. Bartic from Flanders Research Foundation (FWO grant G0947.17N) and KU Leuven (research grant C14/18/061). UH and TV acknowledge support for the IWT SBO NanoCoMIT (research grant 140061). UH acknowledges support from the European Commission under the ‘PANA’ project (call H2020-NMP-2015-two-stage, grant 686009).
Disclosure
The authors report no conflicts of interest in this work.
References
1. Kobayashi H, Longmire MR, Ogawa M, Choyke PL, Kawamoto S. Rational chemical design of the next generation of molecular imaging probes based on physics and biology: mixing modalities, colors and signals. Chem Soc Rev. 2010;40(9):4626–4648. doi:10.1039/c1cs15077d
2. D’Hollander A, Mathieu E, Jans H, Vande Velde G. Development of nanostars as a biocompatible tumor contrast agent: toward in vivo SERS imaging. Int J Nanomed. 2016;11:3703–3714. doi:10.2147/IJN.S91340
3. Wang G, Gao W, Zhang X, Mei X. Au Nanocage Functionalized with Ultra-small Fe3O4 Nanoparticles for Targeting T1–T2 Dual MRI and CT Imaging of Tumor. Sci Rep. 2016;6:28258. doi:10.1038/srep28258
4. Poß M, Tower RJ, Napp J, et al. Multimodal [GdO]+[ICG]− nanoparticles for optical, photoacoustic, and magnetic resonance imaging. Chem Mater. 2017;29(8):3547–3554. doi:10.1021/acs.chemmater.6b05406
5. Chinnathambi S, Shirahata N. Recent advances on fluorescent biomarkers of near-infrared quantum dots for in vitro and in vivo imaging. Sci Technol Adv. 2019;20(1):337–355. doi:10.1080/14686996.2019.1590731
6. Chu H, Zhao J, Mi Y, Di Z, Lele L. NIR-light-mediated spatially selective triggering of anti-tumor immunity via upconversion nanoparticle-based immunodevices. Nat Commun. 2019;10:2839. doi:10.1038/s41467-019-10847-0
7. Olesiak-Banska J, Waszkielewicz M, Obstarczyka P, Samoc M. Two-photon absorption and photoluminescence of colloidal gold nanoparticles and nanoclusters. Chem Soc Rev. 2019;48:4087–4117. doi:10.1039/C8CS00849C
8. Bao X, Yuan Y, Chen J, et al. In vivo theranostics with near-infrared-emitting carbon dots—highly efficient photothermal therapy based on passive targeting after intravenous administration. Light Sci Appl. 2018;7:91. doi:10.1038/s41377-018-0090-1
9. Soenen SJ, Manshian BB, Aubert T, et al. Cytotoxicity of cadmium-free quantum dots and their use in cell bioimaging. Chem Res Toxicol. 2014;27:1050–1059. doi:10.1021/tx5000975
10. Hachani R, Birchall MA, M. Lowdell MW, et al. Assessing cell-nanoparticle interactions by high content imaging of biocompatible iron oxide nanoparticles as potential contrast agents for magnetic resonance imaging. Sci Rep. 2017;7:7850. doi:10.1038/s41598-017-08092-w
11. Siddique S, Chow JCL. Application of nanomaterials in biomedical imaging and cancer therapy. Nanomaterials. 2020;10:1700. doi:10.3390/nano10091700
12. Siddique S, Chow JCL. Gold nanoparticles for drug delivery and cancer therapy. App Sci. 2020;10:3824. doi:10.3390/app10113824
13. Abed A, Beik J, Laurent S, et al. Iron oxide–gold core–shell nano-theranostic for magnetically targeted photothermal therapy under magnetic resonance imaging guidance. J Cancer Res Clin Oncol. 2019;145:1213–1219. doi:10.1007/s00432-019-02870-x
14. Wang YX. Current status of superparamagnetic iron oxide contrast agents for liver magnetic resonance imaging. World J Gastroenterol. 2015;21(47):13400–13402. doi:10.3748/wjg.v21.i47.13400
15. Mahmoudi K, Bouras A, Bozec D, Ivkov R, Hadjipanayis C. Magnetic hyperthermia therapy for the treatment of glioblastoma: a review of the therapy’s history, efficacy and application in humans. Int J Hyperthermia. 2018;34(8):1316–1328. doi:10.1080/02656736.2018.1430867
16. Wang YX, Hussain SM, Krestin GP. Superparamagnetic iron oxide contrast agents: physicochemical characteristics and applications in MR imaging. Eur Radiol. 2001;11:2319–2331. doi:10.1007/s003300100908
17. Kobayashi H, Koyama Y, Barrett T, et al. Multimodal nanoprobes for radionuclide and five-color near infrared optical lymphatic imaging. ACS Nano. 2007;1:258–264. doi:10.1021/nn700062z
18. Santra S, Kaittanis C, Grimm J, Manuel Perez J. Drug/dye-loaded, multifunctional iron oxide nanoparticles for combined targeted cancer therapy and dual optical/magnetic resonance imaging. Small. 2009;5(16):1862–1868. doi:10.1002/smll.200900389
19. Danbi J, Hyun H. Structure-inherent targeting of near-infrared fluorophores for image-guided surgery. Chonnam Med J. 2017;53(2):95–102. doi:10.4068/cmj.2017.53.2.95
20. Zhang F, Lees E, Amin F, et al. Polymer-coated nanoparticles: a universal tool for biolabelling experiments. Small. 2011;7(22):3113–3127. doi:10.1002/smll.201100608
21. Jensen EC. Use of fluorescent probes: their effect on cell biology and limitations. Anat Rec. 2012;295:2031–2036. doi:10.1002/ar.22602
22. Sadat ME, Baghbador MK, Dunn AW, et al. Photo-fluorescent and magnetic properties of iron oxide nanoparticles for biomedical applications. Appl Phys Lett. 2014;105:091903. doi:10.1063/1.4895133
23. Schneider CA, Rasband WS, Eliceiri KW. NIH Image to ImageJ: 25 years of image analysis. Nat Methods. 2012;9:671–675. doi:10.1038/nmeth.2089
24. Trekker J, Leten C, Struys T, et al. Sensitive in vivo cell detection using size-optimized superparamagnetic nanoparticles. Biomaterials. 2014;35(5):1627–1635. doi:10.1016/j.biomaterials.2013.11.006
25. Van Steerteghem N, Clays K, Verbiest T, Van Cleuvenbergen S. Third-harmonic scattering for fast and sensitive screening of the second hyperpolarizability in solution. Anal Chem. 2017;89(5):2964–2971. doi:10.1021/acs.analchem.6b04429
26. Chen CJ, Lai HY, Lin CC, Wang JS, Chiang RK. Preparation of monodisperse iron oxide nanoparticles via the synthesis and decomposition of iron fatty acid complexes. Nanoscale Res Lett. 2009;4:1343–1350. doi:10.1007/s11671-009-9403-x
27. Bloemen M, Brullot W, Luong TT, Geukens N, Gils A, Verbiest T. Improved functionalization of oleic acid-coated iron oxide nanoparticles for biomedical applications. J Nanopart Res. 2012;14:1100. doi:10.1007/s11051-012-1100-5
28. De Cuyper M, Soenen SJ. Cationic magnetoliposomes. Methods Mol Biol. 2010;605:97–111.
29. Ho D, Sun X, Sun S. Monodisperse magnetic nanoparticles for theranostic applications. Acc Chem Res. 2011;44:875–882. doi:10.1021/ar200090c
30. Laurent S, Forge D, Port M, et al. Magnetic iron oxide nanoparticles: synthesis, stabilization, vectorization, physicochemical characterizations, and biological applications. Chem Rev. 2008;108:2064–2110. doi:10.1021/cr068445e
31. Hajesmaeelzadeh F, Shanehsazzadeh S, Grüttner C, et al. Effect of coating thickness of iron oxide nanoparticles on their relaxivity in the MRI. Iran J Basic Med Sci. 2016;19(2):166–171.
32. Portakal ZG, Shermer S, Jenkins C, et al. Design and characterization of tissue-mimicking gel phantoms for diffusion kurtosis imaging. Med Phys. 2018;45:2476–2485. doi:10.1002/mp.12907
33. Lin Y, Dong C, Cao F, Xiong L, Gu H, Xu H. Size-dependent optical properties of conjugated polymer nanoparticles. RSC Adv. 2017;7:55957. doi:10.1039/C7RA12164D
34. Santos CIL, Carvalho MS, Raphael E, et al. Synthesis, optical characterization, and size distribution determination by curve resolution methods of water-soluble CdSe quantum dots. Mat Res. 2016;19:6. doi:10.1590/1980-5373-mr-2016-0121
35. Lai S, Jin Y, Shi L, Zhou R, Zhou Y, An D. Mechanisms behind excitation- and concentration-dependent multicolor photoluminescence in graphene quantum dots. Nanoscale. 2020;12:591. doi:10.1039/C9NR08461D
36. Zanin S, Molinari S, Cozza G, et al. Intracellular protein kinase CK2 inhibition by ferulic acid-based trimodal nanodevice. Int J Biol Macromol. 2020;165:701–712. doi:10.1016/j.ijbiomac.2020.09.207
37. Heinzmann K, Carter LM, Lewis JS, Aboagye EO. Multiplexed imaging for diagnosis and therapy. Nat Biomed Eng. 2017;1:697–713. doi:10.1038/s41551-017-0131-8
38. D’Hollander A, Vande Velde G, Jans H, et al. Assessment of the theranostic potential of gold nanostars—a multimodal imaging and photothermal treatment study. Nanomaterials. 2020;10(11):2112. doi:10.3390/nano10112112
39. Manshian BB, Pfeiffer C, Pelaz B, et al. High-content imaging and gene expression approaches to unravel the effect of surface functionality on cellular interactions of silver nanoparticles. ACS Nano. 2015;9:10431–10444. doi:10.1021/acsnano.5b04661
40. Manshian BB, Abdelmonem AM, Pelaz B, et al. Evaluation of quantum dot cytotoxicity: interpretation of nanoparticle concentrations versus intracellular nanoparticle numbers. Nanotoxicology. 2016;10:1318–1328. doi:10.1080/17435390.2016.1210691
41. Wei Y, Liao R, Haijuan L, Huan L, Haibo X, Qibing Z. Biocompatible low-retention superparamagnetic iron oxide nanoclusters as contrast agents for magnetic resonance imaging of liver tumor. J Biomed Nanotechnol. 2015;11:854–864. doi:10.1166/jbn.2015.2042
42. Chow JCL. Evaluation of the risk and benefit of using functionalized nanomaterials as contrast agents in image-guided radiotherapy: a Monte Carlo study on the imaging dose and contrast enhancement. In: Micro and Nano Technologies. Elsevier; 2021:281–308.
43. Chow JCL. Synthesis and applications of functionalized nanoparticles in biomedicine and radiotherapy. In: Micro and Nano Technologies. Elsevier; 2021:193–218.
44. Moore JA, Chow JCL. Recent progress and applications of gold nanotechnology in medical biophysics using artificial intelligence and mathematical modeling. Nano Ex. 2021;2:022001. doi:10.1088/2632-959X/abddd3
45. Beik J, Asadi M, Khoei S, et al. Simulation-guided photothermal therapy using MRI-traceable iron oxide-gold nanoparticle. J Photochem Photobiol B. 2019;199:111599. doi:10.1016/j.jphotobiol.2019.111599
46. Montazerabadi A, Beik J, Irajirad R, et al. Folate-modified and curcumin-loaded dendritic magnetite nanocarriers for the targeted thermo-chemotherapy of cancer cells. Artif Cells Nanomed Biotechnol. 2019;47:330–340. doi:10.1080/21691401.2018.1557670
47. Hosseini V, Mirrahimi M, Shakeri-Zadeh A, et al. Multimodal cancer cell therapy using Au@Fe2O3 core–shell nanoparticles in combination with photo-thermo-radiotherapy. Photodiagnosis Photodyn Ther. 2018;24:129–135. doi:10.1016/j.pdpdt.2018.08.003
48. Shirvalilou S, Khoei S, Khoee S, Raoufi NJ, Karimi MR, Shakeri-Zadeh A. Development of a magnetic nano-graphene oxide carrier for improved glioma-targeted drug delivery and imaging: in vitro and in vivo evaluations. Chem Biol Interact. 2018;295:97–108. doi:10.1016/j.cbi.2018.08.027
49. Ogawa M, Regino CA, Seidel J, et al. Dual-modality molecular imaging using antibodies labeled with activatable fluorescence and a radionuclide for specific and quantitative targeted cancer detection. Bioconjugate Chem. 2009;20:2177–2184. doi:10.1021/bc900362k
50. González Gómez MA, Belderbos S, Yáñez Vilar S, et al. Development of superparamagnetic nanoparticles coated with polyacrylic acid and aluminum hydroxide as an efficient contrast agent for multimode imaging. Nanomaterials. 2019;9:1626. doi:10.3390/nano9111626
51. Moore L, Rodriguez-Lorenzo L, Hirsch V, et al. Nanoparticle colloidal stability in cell culture media and impact on cellular interactions. Chem Soc Rev. 2015;44:6287. doi:10.1039/C4CS00487F
52. Feliu N, Docter D, Heine M, et al. In vivo degeneration and the fate of inorganic nanoparticles. Chem Soc Rev. 2016;45:2440–2457. doi:10.1039/C5CS00699F
53. Boxall C, Kelsall G, Zhang Z. Photoelectrophoresis of colloidal iron oxides. J Chem Soc Faraday Trans. 1996;92:791. doi:10.1039/FT9969200791
54. Balberg I, Pinch HL. The optical absorption of iron oxides. J Magn Magn Mater. 1978;7:12. doi:10.1016/0304-8853(78)90138-5
55. Woo K, Hong J, Choi S, et al. Easy synthesis and magnetic properties of iron oxide nanoparticles. Chem Mater. 2004;16:2814–2818. doi:10.1021/cm049552x
 © 2021 The Author(s). This work is published and licensed by Dove Medical Press Limited. The
full terms of this license are available at https://www.dovepress.com/terms
and incorporate the Creative Commons Attribution
- Non Commercial (unported, 3.0) License.
By accessing the work you hereby accept the Terms. Non-commercial uses of the work are permitted
without any further permission from Dove Medical Press Limited, provided the work is properly
attributed. For permission for commercial use of this work, please see paragraphs 4.2 and 5 of our Terms.
© 2021 The Author(s). This work is published and licensed by Dove Medical Press Limited. The
full terms of this license are available at https://www.dovepress.com/terms
and incorporate the Creative Commons Attribution
- Non Commercial (unported, 3.0) License.
By accessing the work you hereby accept the Terms. Non-commercial uses of the work are permitted
without any further permission from Dove Medical Press Limited, provided the work is properly
attributed. For permission for commercial use of this work, please see paragraphs 4.2 and 5 of our Terms.