")
Back to Journals » International Journal of General Medicine » Volume 16
KRT19 is a Promising Prognostic Biomarker and Associates with Immune Infiltrates in Serous Ovarian Cystadenocarcinoma
Authors Sun Z, Zhou R, Dai J, Chen J, Liu Y, Wang M, Zhou R, Liu F, Zhang Q, Xu Y , Zhang T
Received 26 July 2023
Accepted for publication 21 September 2023
Published 26 October 2023 Volume 2023:16 Pages 4849—4862
DOI https://doi.org/10.2147/IJGM.S419235
Checked for plagiarism Yes
Review by Single anonymous peer review
Peer reviewer comments 2
Editor who approved publication: Dr Scott Fraser
Zhe Sun,1,* Ruijie Zhou,2,* Jinjin Dai,2,* Jihua Chen,2 Yu Liu,2 Mengyi Wang,2 Runlong Zhou,2 Fengchen Liu,2 Qinxing Zhang,3 Yao Xu,2 Tongcun Zhang1,2
1College of Biotechnology, Tianjin University of Science and Technology, Tianjin, People’s Republic of China; 2Institute of Biology and Medicine, College of Life Sciences and Health, Wuhan University of Science and Technology, Wuhan, Hubei, People’s Republic of China; 3Wuhan Bio-Raid Biotechnology Co., Ltd, Wuhan, Hubei, People’s Republic of China
*These authors contributed equally to this work
Correspondence: Yao Xu; Tongcun Zhang, Institute of Biology and Medicine, College of Life Science and Health, Wuhan University of Science and Technology, No. 2 Huangjiahu West Road, Wuhan, Hubei, 430081, People’s Republic of China, Tel +86-027-68897343, Fax +86-027-68893590, Email [email protected]; [email protected]
Background: Ovarian cancer (OV) is the highest prevalent gynecologic tumor with complicated pathogenesis; high-grade serous ovarian cystadenocarcinoma (HGSOC) is the most epidemiological and malignant subtype of OV. Keratin type I cytoskeleton 19 (KRT19) is an intermediate filament protein which plays essential roles in the maintenance of epithelial cells. However, its role in OV remains largely unknown.
Methods: Bioinformatic analysis with various databases was conducted in this study. In details, KRT19 expression was assessed using databases including The Cancer Genome Atlas (TCGA), Genotype-Tissue Expression (GTEx), Gene Expression Omnibus (GEO) and Human Protein Atlas (HPA). GO-KEGG and GSEA analysis were performed by R packages. The biological function of KRT19 was analyzed based on the single-cell sequencing information from CancerSEA database. The association of KRT19 expression with immunomodulator and chemokine was predicted via the TISIDB database.
Results: The expression of KRT19 was significantly upregulated in ovarian samples compared with normal controls. KRT19 expression was negatively associated with prognosis in OV, and further analysis revealed that KRT19 had promising diagnostic significance in distinguishing OV cancer from normal samples. GO-KEGG and GSEA analysis indicated that KRT19 was associated with multiple biological functions and pathways including epidermis development, apical junction, inflammatory response, and epithelial mesenchymal transition. By using different GEO series, we found that KRT19 was differentially expressed in OV-associated tissues. Furthermore, the increased KRT19 expression was positively correlated with the immune infiltration levels of the most immune cells in OV.
Conclusion: This study demonstrated that KRT19 is a promising prognosis and diagnosis biomarker that determines cancer progression and is correlated with tumor immune cells infiltration in OV, suggesting being a molecular target for immunotherapies.
Keywords: KRT19, OV cancer, prognosis, biomarker, immune infiltration
Introduction
Ovarian cancer is one of the most lethal malignancies in women worldwide, and in which 90% are of an epithelial cell type and comprise multiple histologic types, and the remaining 10% are non-epithelial ovarian cancers, which include mainly germ cell tumors, sex cord-stromal tumors, as well as small cell carcinomas.1 High-grade serous ovarian carcinoma (HGSOC) is the most common epithelial subtype with a staggeringly low five-year survival rate of 30% to 40% and is responsible for 70% to 80% of ovarian cancer-related deaths.2,3 Even with bulk surgery and adjuvant chemotherapy, as BRCA1/2 carriers with epithelial ovarian cancer respond better than non-carriers to platinum-based chemotherapies,4 however, the mortality rate for late stage patients still reaches a high level.5 As the development of biotechnologies, such as transcriptomics, proteomics and genomics,6,7 these new perspectives can uncover promising therapeutic choices, and contribute to explore prognostic biomarkers and therapeutic targets for serous ovarian cystadenocarcinoma.
Keratin type I cytoskeleton 19 (KRT19) is an intermediate filament protein of 40 kDa which plays an essential role in the maintenance of epithelial cells, and it was believed to be a possible specific marker for epidermal stem cells.8 Upregulation of KRT19 has been reported in various tumor tissues, and KRT19 is associated with tumor proliferation and metastasis, such as lung adenocarcinoma (LUAD), breast cancer (BRCA), hypopharyngeal squamous cell cancer and thyroid cancer (THCA).9–11 However, the expression patterns of KRT19 and its clinical significance in OV remain unclear.
The tumor microenvironment plays a crucial role in cancer progression; different signals from the microenvironment contribute to promote or suppress tumors.12 For instance, immune infiltrates of solid tumors may be a hallmark of disease progression while the tumor microenvironment may reprogram tumor-infiltrating immune cells to acquire tumor-promoting functions.13 Revythis et al14 also reported that PARP and immuno-checkpoint inhibitors can enhance ovarian cell apoptosis by suppressing T cell activation. Due to the heterogeneity of the microenvironment in OV cancer, clinical treatment for these patients remains challenging.15 Therefore, exploring promising prognostic markers to explain tumor immune microenvironment heterogeneity can provide significant ways for ovarian cancer therapy.
In this study, TCGA database, GTEx database and GEO database were used to evaluate the correlation between KRT19 expression and prognosis of OV patients. The function of KRT19 was explored by single cell analysis of cancerSEA, and the expression of KRT19 in different tissues was analyzed by using GEO database for further analysis. In addition, our study demonstrated the relationship between KRT19 mRNA levels and tumor-infiltrating immune cells, suggesting that KRT19 may accelerate tumor processing by regulating immune cell infiltration in OV.
Materials and Methods
Gene Expression and Clinicopathological Character Analysis
We investigated the KRT19 expression level in various types of normal tissues and tumor in the integrated datasets combining TCGA16 (https://portal.gdc.cancer.gov) and the GTEx (Genotype-Tissue Expression) database17 (https://www.gtexportal.org/ home/-index.html). We obtained the profiles of RNA expression (RNA-Seq2 level 3 data; format: TPM; platform: Illumina HiSeq 2000) and clinical sample of OV patients from the TCGA database. TCGA included 379 OV samples, which contain general information, clinicopathological details, and prognostic information; GTEx included 88 normal samples. The gene expression profiling data sets ([GEO: GSE12470], [GEO: GSE6008]) were obtained from the GEO database (https://www.ncbi.nlm.nih.gov/gds). We analyzed the cancer OMICS data by using The University of Alabama Cancer database (UALCAN) (http://ualcan.path.uab.edu/) which provides protein expression analysis data from the Clinical Proteomic Tumor Analysis Consortium.18,19 The Human Protein Atlas20 (https://www.proteinatlas.org/) provides comprehensive data on human protein transcripts derived from unique human samples, which include cells, tissues, and organs. In this study, we obtained KRT19 protein immunohistochemistry results from both ovarian cancer tissues and normal ovarian tissues.
Survival Analysis
The Kaplan–Meier survival analysis was performed using the R package survival (v 3.2–10) and survminer (v 0.4.9). Patients in TCGA OV were separated into two groups based on high and low levels of KRT19 expression. We constructed a prognostic classifier to determine if KRT19 expression level affects clinical outcomes of OV patients and assessed three outcome measures: Overall Survival (OS), Progress Free Interval (PFI), Disease Specific Survival (DSS).
Analyses of Univariate and Multivariate Cox Regression
Univariate and multivariate analyses were conducted with Cox proportional hazards regression models. The survival package (v 3.2–10) implemented in R was used. Using univariate Cox regression analysis, we compared the OS of two cohorts of patients with OV and the level of KRT19 expression. Furthermore, we used multivariate analysis to determine whether KRT19 is an independent prognostic marker for OS of OV patients. There is statistical significance for KRT19 in Cox regression analysis, when p < 0.05.
Gene Set Enrichment Analysis
KRT19 mRNA expression was analyzed by R (v 3.6.3), followed by GSEA analysis using the limma, clusterprofiler and ggplot2 package. Adjusted p < 0.05, |ES|>1, and FDR < 0.25 were considered to be statistically significant.
Co-Expression Network Establishment of KRT19
The co-expression genes of KRT19 were screened by R limma package. Spearman correlation coefficient and Z-test from TCGA database were used to examine the correlation between KRT19 expression level and co-expressed genes (related parameter settings: |Spearman correlation coefficient| >0.2 and p-value <0.001).
Functional Enrichment Analysis
GO–KEGG enrichment analysis was performed by Bioconductor package clusterProfiler to better understand KRT19 carcinogenesis. The ggplot2 package was employed for visualization. Adjusted p < 0.05 is considered to be statistically significant in the enrichment results.
Single-Cell Analysis
CancerSEA (http://biocc.hrbmu.edu.cn/CancerSEA/home.jsp) aims to comprehensively decode the functional states of cancer cells at a single-cell resolution.21 There was 224 cells used to explore the function of KRT19 expression. They were from the dataset “Guillaumet-Adkins A. Genome Biol. 2017 (PDX_OV)”, and the dataset contains a cell group, which denoted patient-derived xenograft Ovarian carcinoma (OV) sample.
KRT19 Biological Function Analysis
We used two microarray data set from the GEO database: GSE69428, GSE40595. GSE69428 contains 10 HGSOC samples, 10 normal oviduct samples, 2 FTSC samples, 2 FTSC_IM samples, 2 FTSC_T samples and three Xenograft_FTSC_T samples. GSE40595 contains 8 microdissected normal ovarian stroma samples, 6 ovarian surface epithelium (HOSE), 31 laser microdissected cancer associated stroma samples, and 32 epithelial tumor samples from HGSOC patients. Boxplots were constructed in R using the packages ggstatsplot (v 0.9.1). Density plots were produced with the function “geom_desity” present in the ggplot2 (v 3.3.6) package of the R statistical environment.
Immunity Analysis
The tumor-infiltrating immune cells were assessed by ssGSEA (single-sample gene set enrichment analysis). R package GSVA and immune datasets were used to determine the infiltration level of immune cells in OV. The TISIDB database (http://cis.hku.hk/TISIDB), an integrated repository tool, were performed to analyze the interaction between tumor and immune system.22 In addition, we will further explore the immune potency of KRT19 in cancer. First, correlations between KRT19 expression and Immunoinhibitors in multiple types of cancer were determined via the “Immunomodulator” module. Second, statistical assessment was performed using a Spearman correlation to screen the appropriate candidates.
Statistical Analysis
We conducted all statistical analyses by R (v 3.6.3). We generated ROC curves using the pROC package. We used the chi-square test to examine the association between KRT19 mRNA expression and clinical characteristics. The prognostic value of KRT19 mRNA expression was analyzed by multivariate Cox analysis and Kaplan–Meier analysis. Statistical significance was represented by p < 0.05 (*), p < 0.01 (**), and p < 0.001 (***).
Results
OV Patients’ Clinical Characteristics
We transformed all transcript data to Transcripts Per Million (TPM) from GTEx and TCGA databases which are available for public to allow for comparisons across TCGA and GTEx. The data set contains 379 tumor samples from TCGA, 88 normal samples from GTEx. We downloaded clinical data including patients’ FIGO stage, Primary therapy outcome, Race and Age (Table 1).
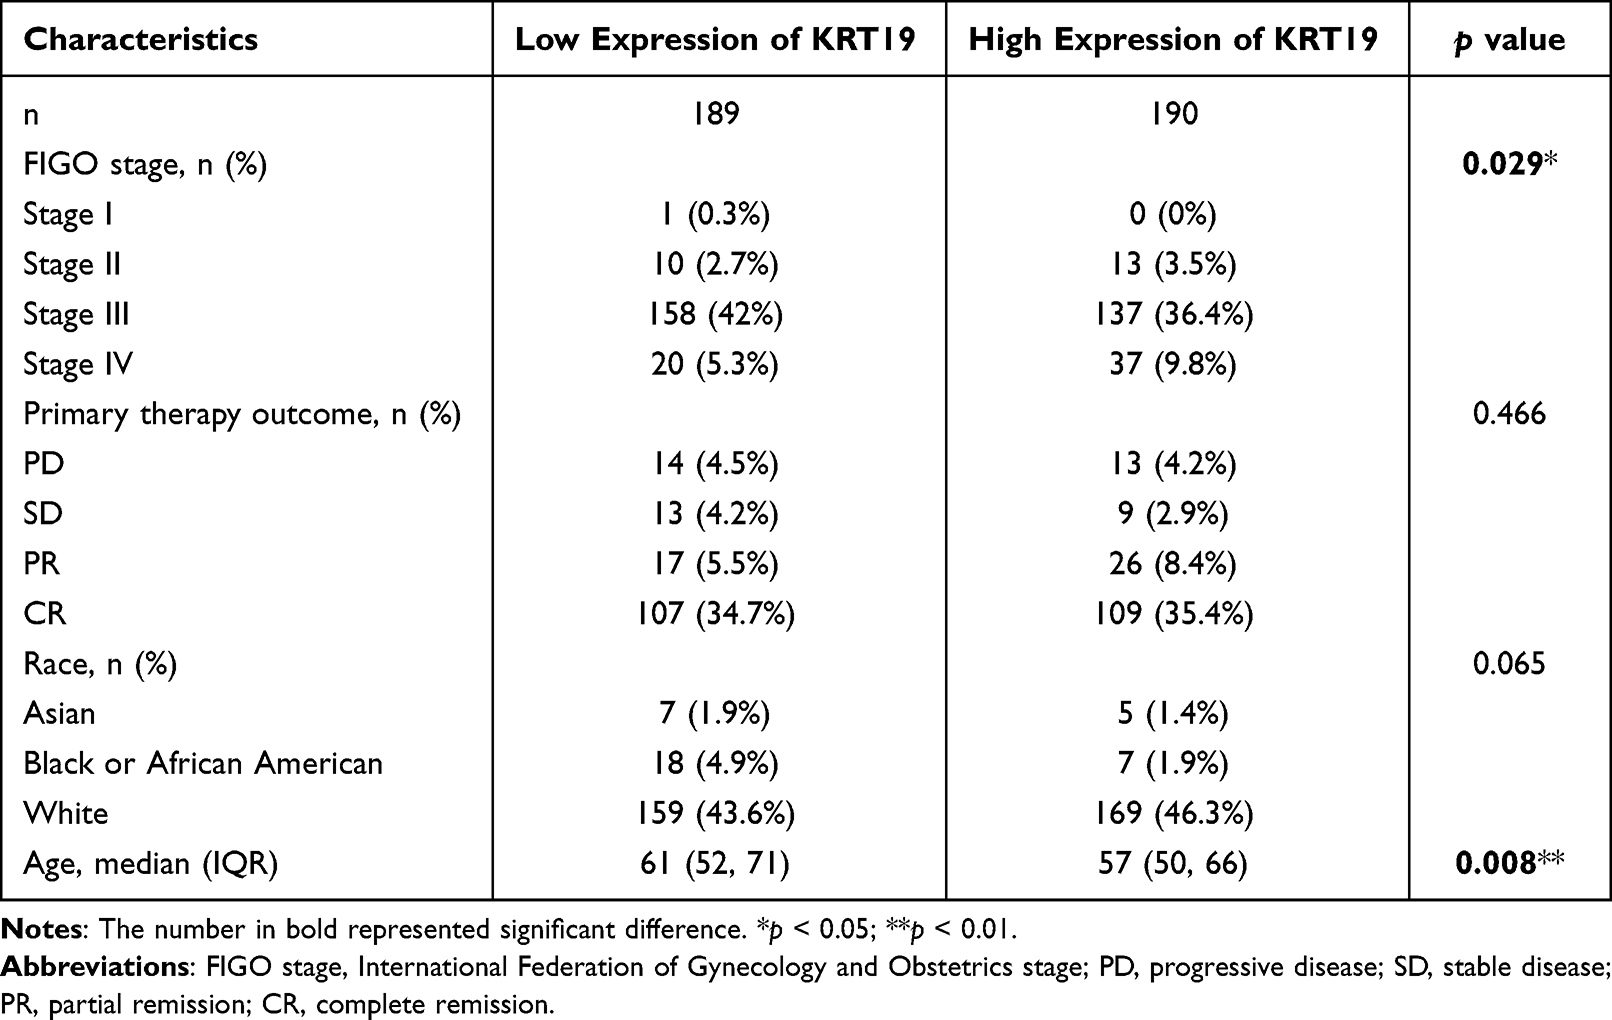 |
Table 1 Clinical Characteristics of OV Patients |
Expression of the KRT19 in Different Tumors of OV Patients
We first analyzed KRT19 mRNA expression in various tumor and normal tissue types using the Cancer Genome Atlas (TCGA) and Genotype-Tissue Expression (GTEx) databases. As shown in Figure 1A, KRT19 was significantly highly expressed in the vast majority of tumors compared to normal tissues, such as CESC, CHOL, COAD, KIRP, LUAD, LUSC, OV, PAAD, PCPG, READ, STAD. In detail, for OV tumor, a significant upregulation of KRT19 mRNA was found in OV tissues (p < 0.001) (Figure 1B). With UALCAN database, we also assessed the protein levels of KRT19, the results showed that KRT19 protein levels were upregulated in OV cancer compared with that in normal ovarian tissues (p< 0.001) (Figure 1C). Moreover, the immunohistochemical stain of KRT19 validated the higher expression in OV (Figure 1D).
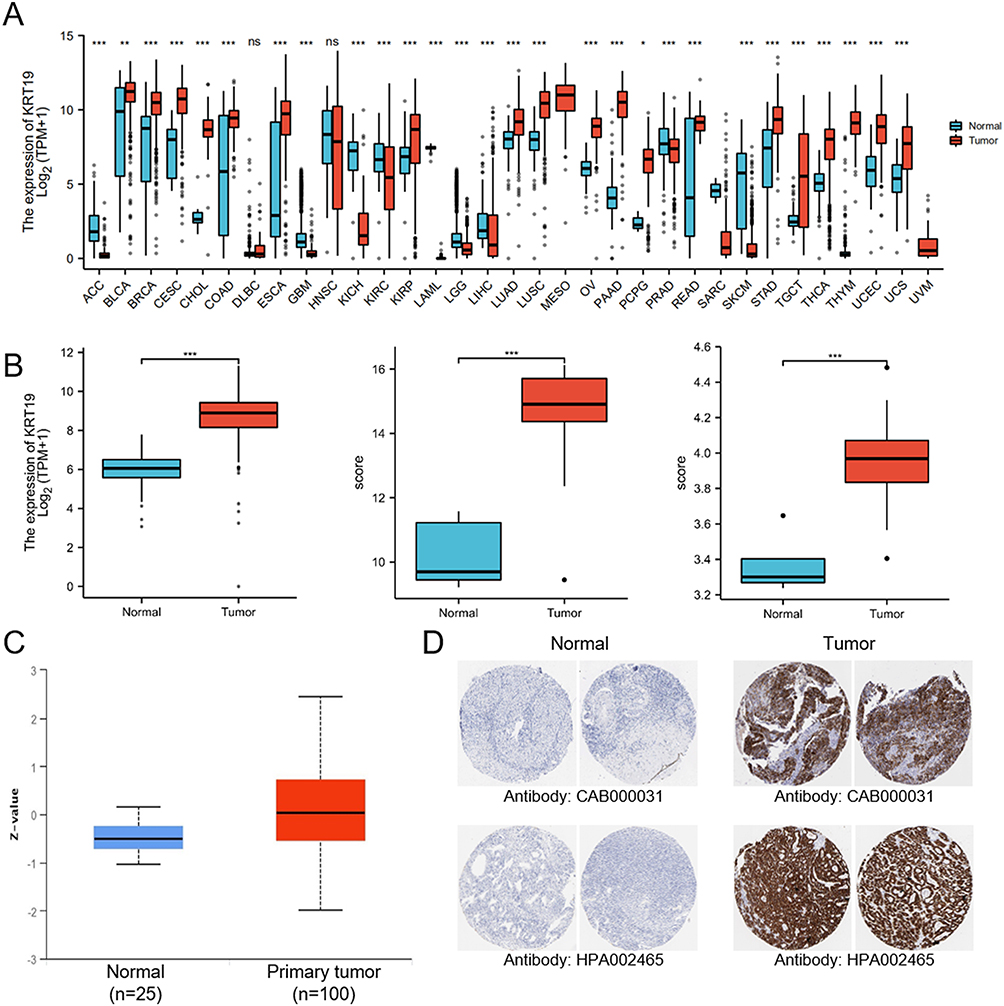 |
Figure 1 Expression patterns of KRT19 in tumors and normal tissues. (A) KRT19 mRNA levels in distinct tumors and normal controls using TCGA and GTEx databases. (B) KRT19 expression in OV and normal ovarian tissues based on TCGA, GTEx and GEO databases. (C) KRT19 protein levels in OV and normal ovarian tissues analyzed by the UALCAN database. (D) Representative results of immunohistochemically stained KRT19 proteins in OV and normal ovarian tissues from Human Protein Atlas. ns, no significant difference; *p < 0.05; **p < 0.01; ***p < 0.001. |
KRT19 Expression is Independently Associated with a Poorer Outcome in OV Patients
The survival curve comparison indicated that the high mRNA level of KRT19 gene was associated with poor OS (p = 0.024), PFI (p = 0.01) and DSS (p = 0.023) (Figure 2A–C). Further subgroup analysis found that KRT19 expression significantly affected the PFI in OV cases of FIGO stages I and II (p = 0.033), FIGO stages III and IV (p = 0.033), PD and SD (p = 0.01), PR and CR (p = 0.001), respectively (Figure 2D–G). The univariate analysis revealed that higher KRT19 mRNA expression in stage IV, SD and CR of OV was correlated with OS (Table 2). Thus, the KRT19 gene may be an independent risk factor for OV cancer (Table 2 and Figure 3).
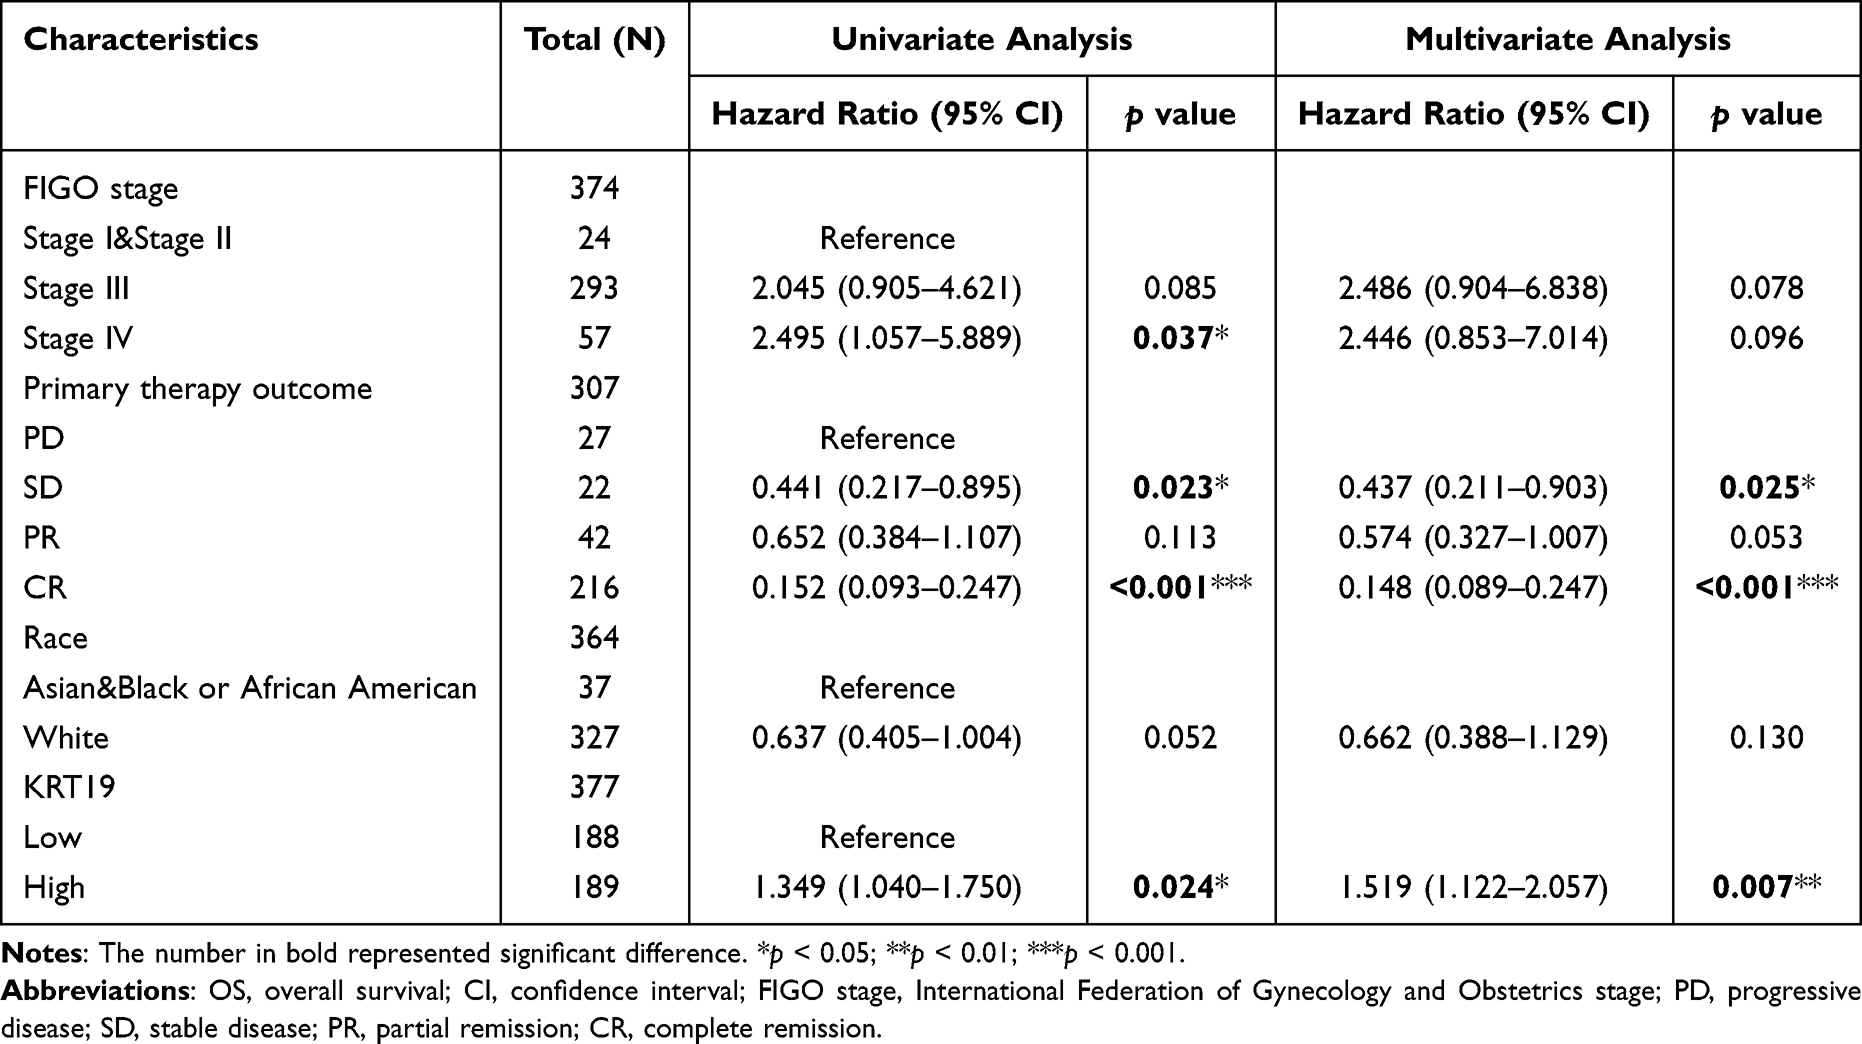 |
Table 2 Correlations Between OS and mRNA Expression of KRT19 Analyzed by Univariate and Multivariate Cox Regression |
 |
Figure 2 Diagnostic and prognostic value of KRT19 in OV. (A–C) Kaplan–Meier curves for OS, PFI and DSS in OV patients. Effects of KRT19 expression on PFI in pathologic stages of OV for FIGO stages I and II (D), FIGO stages III and IV (E), PD and SD (F), PR and CR (G). (H) ROC curve of KRT19 mRNA expression in OV cohort. Abbreviations: OS, overall survival; PFI, progress free interval; DSS, disease-specific survival; FIGO stage, International Federation of Gynecology and Obstetrics stage; PD, progressive disease; SD, stable disease; PR, partial remission; CR, complete remission; HR, hazard ratio. |
 |
Figure 3 Univariate and multivariate regression analysis of KRT19 and clinicopathologic factors with OS in OV patients. Abbreviations: FIGO stage, International Federation of Gynecology and Obstetrics stage; PD, progressive disease; SD, stable disease; PR, partial remission; CR, complete remission; HR, hazard ratio; CI, confidence interval. |
KRT19 Expression and Diagnostic Value in OV
The area under the ROC curve (AUC) (Value data: 0.5–1.0) is usually used to evaluate accuracy of detection method or hypothetical model. The AUC data is closer to 1.0, the higher the authenticity of the analytic system is. Our result indicated that the AUC data of KRT19 was 0.976, suggesting high accuracy of our model’s predictions (Figure 2H).
GSEA Identifies KRT19-Related Signaling Pathways
To identify the critical pathways associated with OV progression, we performed a GSEA analysis, and the results showed that the marked KRT19-related signaling pathways were enriched in Apical junction, Inflammatory response, TNFA signaling via NFKB, and epithelial mesenchymal transition (Figure 4).
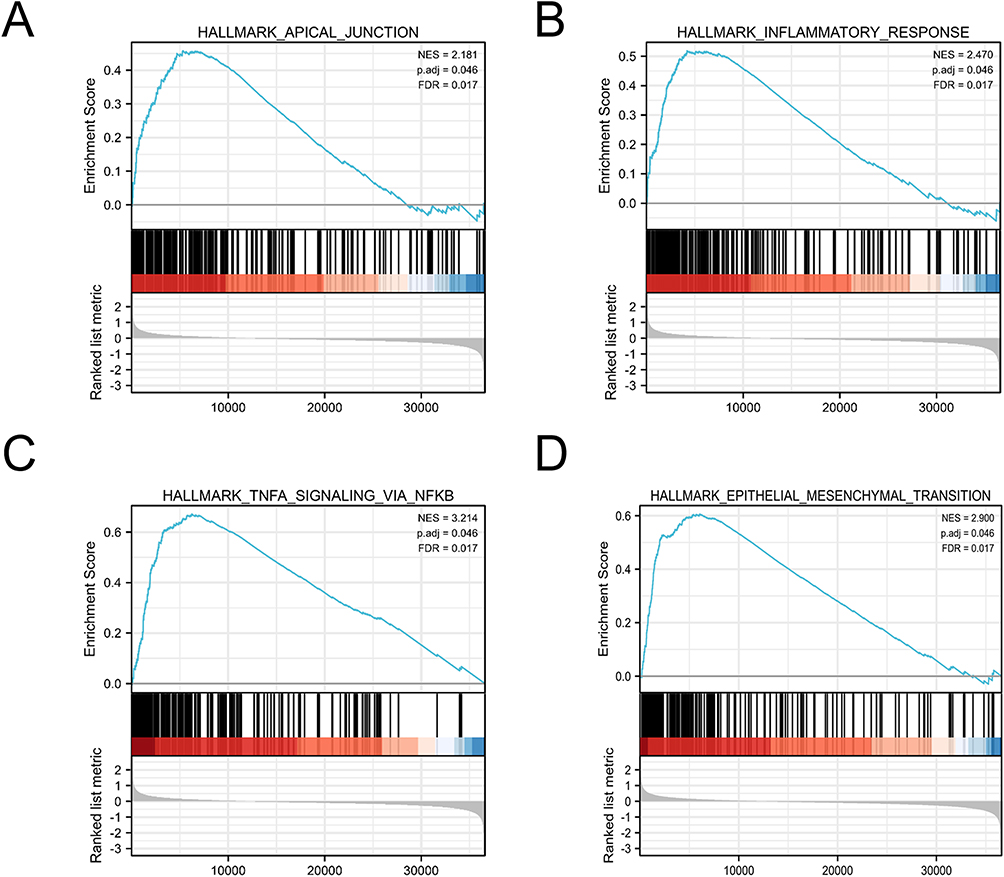 |
Figure 4 Enrichment hallmarks from the gene set enrichment analysis (GSEA). (A) Apical junction. (B) Inflammatory response. (C) TNFA signaling via NFKB. (D) Epithelial mesenchymal transition. Abbreviations: NES, normalize enrichment score; FDR, false discovery rate adjustment. |
Network Establishment for KRT19-Correlated Genes in OV
To further study the gene networks associated with KRT19 in OV, top 10 genes were positively correlated with KRT19, such as KRT19P1, KRT15, KRT7, S100A14, ELF3, PERP (Figure 5A, Figure S1), and top 10 genes were negatively correlated with KRT19, such as LINC01276, AC060809.1, RFX5-AS1, TIGD1, CA14, NRAP in OV cancer (Figure 5B, Figure S2). Next, GO enrichment and KEGG pathway analysis were performed based on these KRT19-correlated gene network. GO–KEGG enrichment analysis showed that the KRT19 associated genes were mainly involved in the epidermis development, skin development, cell–cell junction, intermediate filament cytoskeleton, intermediate filament, cornification and other signaling pathways (Figure 5C).
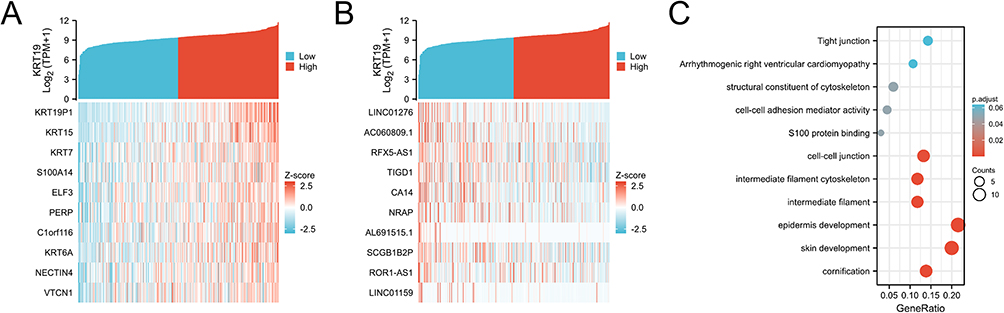 |
Figure 5 Gene expression and enrichment of KRT19 associated genes in OV. (A) Heatmap of the top 50 genes positively correlated with KRT19 in OV. (B) Heatmap of the top 50 genes negatively correlated with KRT19 in OV. (C) Enrichment of biological processes with KRT19 co-expression genes in OV by GO–KEGG analysis. |
Biological Functions of the KRT19 in OV
To investigate the biological functions of KRT19 in OV, single-cell analysis was performed using CancerSEA. The results indicated that KRT19 positively regulated the metastasis of OV cells, while negatively regulated the invasion of OV cells (Figure 6A and B). The high expressions of KRT19 gene in the OV cells was also observed by the t-SNE method (Figure 6C).
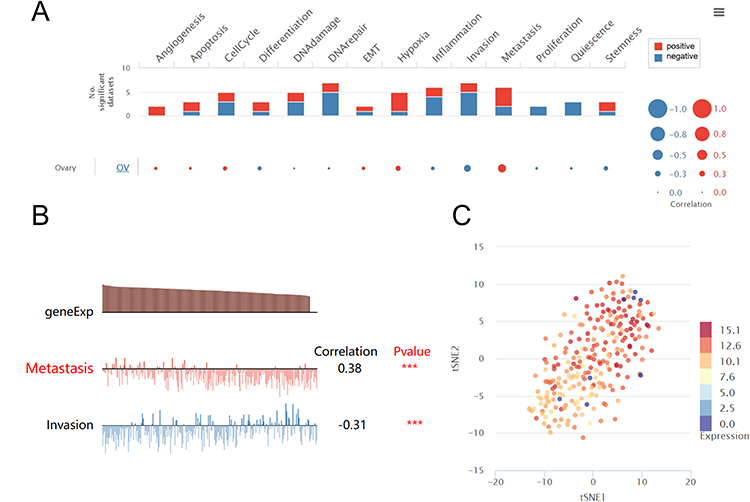 |
Figure 6 Biological processes regulated by the KRT19 gene in OV from CancerSEA. (A) The positive or negative biological function associated with KRT19 in OV by single cell analysis. (B) The association of KRT19 gene with metastasis and invasion of OV cells. (C) Expression distribution with t-SNE plot of KRT19 in OV. ***p < 0.001. |
The serous subtype of ovarian adenocarcinoma has been hypothesized to arise from at least two possible classes of progenitor cells: the ovarian surface epithelia (OSE) and/or an as yet undefined class of progenitor cells residing in the distal end of the fallopian tube.23 In our findings, the expression of KRT19 was very similar in HGSOC, the fallopian tube stem cells (includes FTSC, immortalized FTSC, transformed FTSC, xenografting tumors) and normal oviduct cells calculated by using GSE69428 (Figure 7A). Moreover, for the analysis using another dataset, GSE40595, KRT19 expression was prominent down-regulated in OV cancer stroma and epithelial component of HGSOC when compared with the normal OV surface epithelium (Figure 7C). To examine the gene expression in different tissues, we compared the expression of all genes between the different groups in each GEO Series. The geom density plot for GSE69428 showed that the gene expression of FTSC and HGSOC was similar to each other (Figure 7B), and for GSE40595, the gene expression of human ovarian surface epithelium was approximately close to ovarian cancer stroma (Figure 7D).
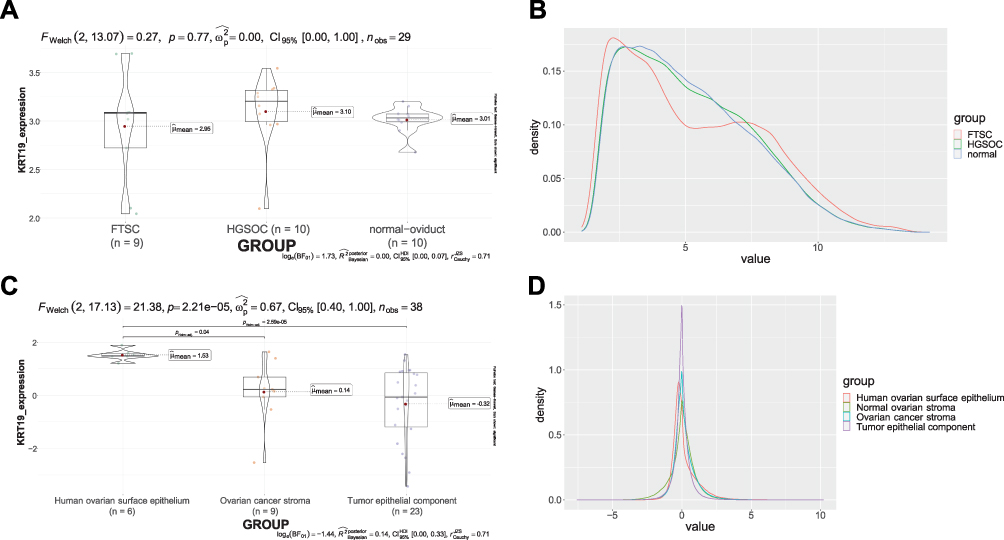 |
Figure 7 KRT19 gene expression in various ovarian cells. (A) KRT19 expression in different groups of GSE69428; (B) Density plot in different groups of GSE69428; (C) KRT19 expression in different groups of GSE40595; (D) Density plot in different groups of GSE40595. |
KRT19 Expression Correlates with Immune Infiltration Levels
To investigate whether KRT19 expression associate with tumor immune microenvironment, we analyzed the relationship between KRT19 expression and immune infiltration of OV cancer cells. The results showed that the immune infiltration levels of the most immune cells were positively correlated with the KRT19 expression in OV (Figure 8A), such as Neutrophils (r = 0.237, p < 0.001), NKCD56dim (r = 0.150, p = 0.003), Mast cells (r = 0.148, p = 0.004), DC (r = 0.142, p = 0.006), Th17 cells (r = 0.137, p = 0.007), iDC (r = 0.132, p = 0.010), Macrophages (r = 0.127, p = 0.014), Th1 cells (r = 0.126, p = 0.014), Tem cells (r = 0.124, p = 0.016) (Figure 8B–J).
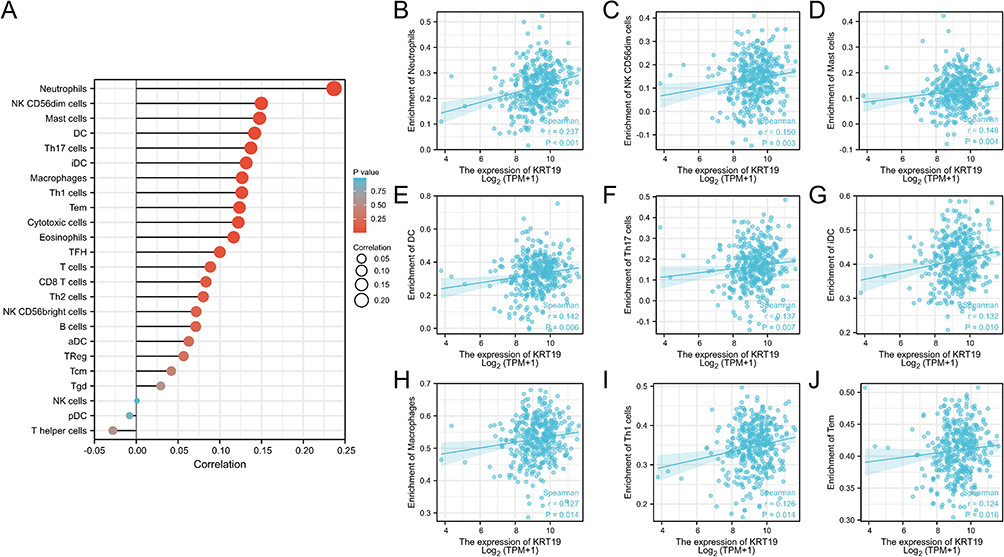 |
Figure 8 Association analysis of KRT19 gene expression with immune infiltration. (A) Correlation between KRT19 expression and 24 tumor-infiltrating lymphocytes. (B–G) Correlations of KRT19 level with immune infiltration level of (B) Neutrophils, (C) NK CD56dim cells, (D) Mast cells, (E) DC cells, (F) Th17 cells, (G) iDC cells, (H) Macrophages, (I) Th1 cells, (J) Tem cells. |
With advances in immunotherapy, Immune checkpoint inhibitors (ICIs) have been used in some novel strategies which have yielded striking effects against various cancers.24 We assessed whether KRT19 expression was associated with immunoinhibitors by the TISIDB database. Each Spearman correlation between KRT19 and a distinct immunoinhibitor in cancer was integrated into the heatmap (Figure 9A). Specifically, in OV, multiple types of immunoinhibitors especially VTCN1 (r = 0.416, p = 1.59e−14), IL10RB, LGALS9, PVRL2, KDR, IL10 were significantly correlated with KRT19 expression (Figure S3). Meanwhile, KRT19 was positively correlated with the expression of several immunostimulators (Figure 9B), such as C10orf54 (r = 0.373, p = 2.04e−11), TNFSF9 (r = 0.297, p = 1.35e−07) (Figure S3). These results suggest that KRT19 may play a role in regulating tumor immunity.
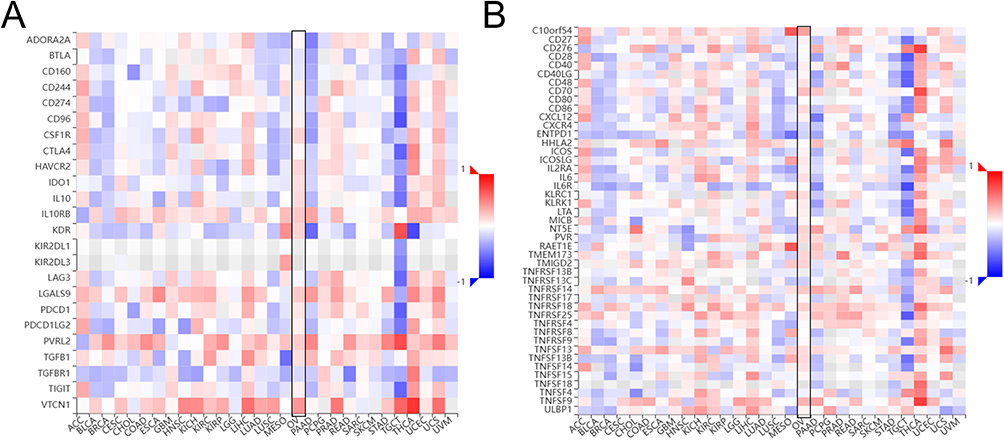 |
Figure 9 Correlation analysis between KRT19 expression and immunoinhibitors and immunostimulators in pan-cancers. (A) Correlation heatmap between KRT19 and immunoinhibitors in tumors. (B) Correlation heatmap between KRT19 and immunostimulators in tumors. |
Chemokines and chemokine receptors mediate the entry of immune cells into the tumor microenvironment.25 We used TISIDB to analyze the correlation between the KRT19 expression and immune cell chemokines and chemokine receptors in OV (Figure 10). The results showed that KRT19 expression was positively correlated with several types of chemokines and receptors especially CXCL17 (r = 0.311, p = 2.95e−08), CX3CL1 (r = 0.266, p = 2.4e−06) and CX3CR1 (r = 0.156, p < 0.00616) (Figure S3).
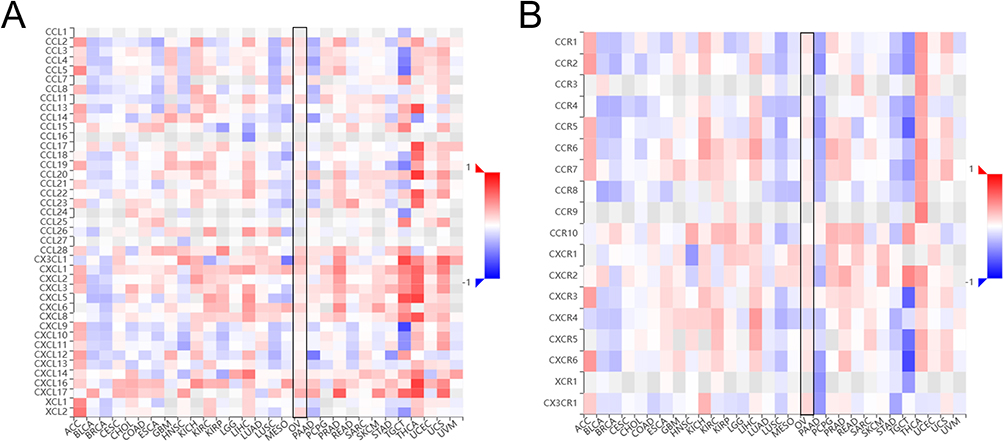 |
Figure 10 Correlation analysis between KRT19 expression and chemokines and receptors in pan-cancers. (A) Correlation heatmap between KRT19 and chemokines in tumors. (B) Correlation heatmap between KRT19 and receptors in tumors. |
Discussion
In this study, we conducted a systematic bioinformation analysis to investigate its potential regulatory mechanisms and biological functions in OV. According to our findings, KRT19 was significantly highly expressed in OV cancer tissues and may play a vital role in OV development. Our results are consistent with previous research regarding the KRT19 role in other cancers. The AUC of the ROC curve indicated that KRT19 expression had certain diagnostic value in OV. The survival analysis revealed that high KRT19 expression had relatively shorter survival times, revealing that KRT19 is associated with the poor prognosis of OV cancer. Our results strongly indicated that KRT19 could be used as a prognostic and diagnostic biomarker for OV.
KRT19, as a type I CK, has been reported to serve as a marker for metastatic tumors.11 Traditionally, the surface epithelium of the ovary (OSE) has long been considered as the origin of HGSOC. Since the late 1990s, oviduct epithelium has emerged as a potential primary source of HGSOC.23 However, some ovarian cancers may arise in the fallopian tube which may detract from compelling evidence that ovarian cancer arised from OSE.26 By GSEA analysis, we revealed that EMT is one of the most significant causality of cancer, and is also considered as a principal biological process affected by gene expression in OV. Decreased expression of keratins during EMT contributed to an initiation of metastasis by loosening cell–cell attachment through disassembly of desmosomes,27 which was consistent with our study that KRT19 was down-regulated in epithelial component of HGSOC patients. Furthermore, we found that KRT19 positively regulates the metastasis of OV cancer cells, and it was similarly expressed both in HGSOC and oviduct epithelium. We speculated that HGSOC may originated from both OSE and oviduct epithelium; the former is related to EMT which occurs due to the low-expression of KRT19 while the latter is related to metastasis which positively regulated by KRT19. In the future, we plan to further validate this model in animal experiment and clinical samples.
Furthermore, KRT19 expression is correlated with diverse immune infiltration levels in OV. According to our findings, KRT19 expression was positively correlated with most immune cells such as Neutrophils, NK CD56dim cells, Mast cells, DC cells, Th17 cells, iDC cells, Macrophages, Th1 cells, Tem cells. Interestingly, even though KRT19 expression is positively correlated with multiple immune cells, OV cancer patients with high KRT19 expression still have a poor prognosis, which aroused an important academic problem needed to be further studied.
We found that KRT19 was positively correlated with several types of immunoinhibitors and immunostimulators, such as VTCN1, C10orf54 and TNFSF9. By reducing immune response, V-set domain containing T cell activation inhibitor 1 (VTCN1) could promote cancer progression indirectly. Meanwhile, a previous study showed that low expression of VTCN1 inhibited the viability and metastasis of OV cancer by reducing the expression of CDK2/4 and CDC25C and phosphorylation of JAK2/STAT.28 V-domain immunoglobulin suppressor of T cell activation (VISTA also named C10orf54) is an immune checkpoint receptor expressed on tumor-infiltrating T lymphocytes (TILs) and myeloid cells.29 Mulati et al reported that C10orf54 expression in tumor cells inhibits T cell proliferation and cytokine production, leading to immune evasion.30 Most cancers evade the immune response by overexpression of inhibitory ligands, which inhibit T cell function and then lead to cancer progression.31 Hence, the inhibition of T cells by VTCN1 and C10orf54 may provide possible mechanisms which explains why KRT19 expression correlates with immune infiltration and poor prognosis.
Otherwise, the immune infiltration is tightly regulated by the various chemokines, which modulate tumor immunity and the biological phenotype.32 Our study shows that KRT19 expression was positively correlated with several types of chemokines and receptors, especially CXCL17, CX3CL1 and CX3CR1. CXCL17 is a potent chemoattractant for monocytes, dendritic cells and macrophages.33 Furthermore, chemokine CX3CL1 could stimulate the production of CXCL17 in keratinocyte and monocyte-derived macrophages.34,35 CX3CR1 is a leukocyte surface protein that is most abundant on monocytes and macrophages in various organs.36 All of the above may explain how KRT19 regulates some of the immune infiltration cells in OV. Overall, we speculated that the negative association of high KRT19 expression with poor prognosis is caused by inhibiting the function of immune cell rather than suppressing the migration of immune cells into the TME.
This study presented significant findings regarding KRT19 in OV, but some limitations still exist. First, despite the utilization of retrospective data from multiple databases, prospective studies are needed to determine the clinical significance of KRT19 in OV. Additionally, in order to fully understand the biological function and the potential molecular mechanisms of KRT19 in OV, further fundamental in vitro and in vivo experiments are required.
In summary, our study found that the expression of KRT19 is significantly upregulated in OV tissues and is closely related to poor prognosis of OV patients. KRT19 expression in different tissues may explain the origin of OV cancer especially HGSOC. Furthermore, given that the biological function and regulatory mechanism in immune cell infiltration, KRT19 could be applied as a novel promising prognosis biomarker for OV cancer therapy.
Data Sharing Statement
The authors declare that the data and materials of this study are available within the article.
Ethics Approval Statement
In this study, the confidentiality of patients information was guaranteed using de-identified and anonymous manner. Moreover, the utilization of public databases involving human data was reviewed and approved by the Ethics Committee of affiliated Tianyou Hospital of Wuhan University of Science and Technology (202303).
Acknowledgments
We sincerely acknowledge the contributions from the TCGA, GSE12470, GSE6008, GSE69428, and GSE40595 projects.
Author Contributions
All listed authors made a significant contribution to this study, whether that is in the general supervision, acquisition of funding, study design, conception, data collection, execution, data analysis and interpretation, writing/revising/formatting/reviewing the manuscript. All authors approve the final version of this paper and agreed on the submitted journal; and they takes responsibility for the authenticity and integrity of the work.
Funding
This study was supported by the Foundation of Hubei Province Supporting Enterprise Technology Innovation Development Project (2021BAB126), Wuhan East Lake High-tech Zone “JieBangGuaShuai” Project (2022KJB113), Foundation of Wuhan University of Science and Technology (2016xz036).
Disclosure
The authors declare that they have no competing interests.
References
1. Cheung A, Shah S, Parker J, et al. Non-epithelial ovarian cancers: how much do we really know? Int J Environ Res Public Health. 2022;19(3):1106. doi:10.3390/ijerph19031106
2. Lisio MA, Fu L, Goyeneche A, Gao ZH, Telleria C. High-grade serous ovarian cancer: basic sciences, clinical and therapeutic standpoints. Int J Mol Sci. 2019;20(4):952. doi:10.3390/ijms20040952
3. Heindl A, Khan AM, Rodrigues DN, et al. Microenvironmental niche divergence shapes BRCA1-dysregulated ovarian cancer morphological plasticity. Nat Commun. 2018;9(1):3917. doi:10.1038/s41467-018-06130-3
4. Shah S, Cheung A, Kutka M, Sheriff M, Boussios S. Epithelial ovarian cancer: providing evidence of predisposition genes. Int J Environ Res Public Health. 2022;19(13):8113. doi:10.3390/ijerph19138113
5. Gorski JW, Ueland FR, Kolesar JM. CCNE1 amplification as a predictive biomarker of chemotherapy resistance in epithelial ovarian cancer. Diagnostics. 2020;10(5):279. doi:10.3390/diagnostics10050279
6. Ghose A, Gullapalli SVN, Boussios S, et al. Applications of proteomics in ovarian cancer: dawn of a new era. Proteomes. 2022;10(2):16. doi:10.3390/proteomes10020016
7. Olalekan S, Xie B, Back R, Eckart H, Basu A. Characterizing the tumor microenvironment of metastatic ovarian cancer by single-cell transcriptomics. Cell Rep. 2021;35(8):109165. doi:10.1016/j.celrep.2021.109165
8. Fu X, Sun X, Li X, Sheng Z. Dedifferentiation of epidermal cells to stem cells in vivo. Lancet. 2001;358(9287):1067–1068. doi:10.1016/S0140-6736(01)06202-X
9. Yuan X, Yi M, Dong B, Chu Q, Wu K. Prognostic significance of KRT19 in lung squamous cancer. J Cancer. 2021;12(4):1240–1248. doi:10.7150/jca.51179
10. Mi L, Liang N, Sun H. A comprehensive analysis of KRT19 combined with immune infiltration to predict breast cancer prognosis. Genes. 2022;13(10):1838. doi:10.3390/genes13101838
11. Wang X, Xu X, Peng C, et al. BRAF (V600E)-induced KRT19 expression in thyroid cancer promotes lymph node metastasis via EMT. Oncol Lett. 2019;18(1):927–935. doi:10.3892/ol.2019.10360
12. Quail DF, Joyce JA. Microenvironmental regulation of tumor progression and metastasis. Nat Med. 2013;19(11):1423–1437. doi:10.1038/nm.3394
13. Kalafati L, Kourtzelis I, Schulte-Schrepping J, et al. Innate immune training of granulopoiesis promotes anti-tumor activity. Cell. 2020;183(3):771–785.e712. doi:10.1016/j.cell.2020.09.058
14. Revythis A, Limbu A, Mikropoulos C, et al. Recent insights into PARP and immuno-checkpoint inhibitors in epithelial ovarian cancer. Int J Environ Res Public Health. 2022;19(14):8577. doi:10.3390/ijerph19148577
15. Baci D, Bosi A, Gallazzi M, et al. The ovarian cancer tumor immune microenvironment (TIME) as target for therapy: a focus on innate immunity cells as therapeutic effectors. Int J Mol Sci. 2020;21(9):3125. doi:10.3390/ijms21093125
16. Blum A, Wang P, Zenklusen JC. SnapShot: TCGA-analyzed tumors. Cell. 2018;173(2):530. doi:10.1016/j.cell.2018.03.059
17. Consortium G, Thomas J, Salvatore M. The Genotype-Tissue Expression (GTEx) project. Nat Genet. 2013;45(6):580–585. doi:10.1038/ng.2653
18. Chandrashekar DS, Bashel B, Balasubramanya SAH, et al. UALCAN: a portal for facilitating tumor subgroup gene expression and survival analyses. Neoplasia. 2017;19(8):649–658. doi:10.1016/j.neo.2017.05.002
19. Chen F, Chandrashekar DS, Varambally S, Creighton CJ. Pan-cancer molecular subtypes revealed by mass-spectrometry-based proteomic characterization of more than 500 human cancers. Nat Commun. 2019;10(1):5679. doi:10.1038/s41467-019-13528-0
20. Uhlén M, Fagerberg L, Hallström BM, et al. Proteomics. Tissue-based map of the human proteome. Science. 2015;347(6220):1260419. doi:10.1126/science.1260419
21. Yuan H, Yan M, Zhang G, et al. CancerSEA: a cancer single-cell state atlas. Nucleic Acids Res. 2019;47(D1):D900–d908. doi:10.1093/nar/gky939
22. Ru B, Wong CN, Tong Y, et al. TISIDB: an integrated repository portal for tumor-immune system interactions. Bioinformatics. 2019;35(20):4200–4202. doi:10.1093/bioinformatics/btz210
23. Bowen NJ, Walker LD, Matyunina LV, et al. Gene expression profiling supports the hypothesis that human ovarian surface epithelia are multipotent and capable of serving as ovarian cancer initiating cells. BMC Med Genomics. 2009;2:71. doi:10.1186/1755-8794-2-71
24. Zhao X, Liu J, Ge S, et al. Saikosaponin A inhibits breast cancer by regulating Th1/Th2 balance. Front Pharmacol. 2019;10:624. doi:10.3389/fphar.2019.00624
25. Nagarsheth N, Wicha MS, Zou W. Chemokines in the cancer microenvironment and their relevance in cancer immunotherapy. Nat Rev Immunol. 2017;17(9):559–572. doi:10.1038/nri.2017.49
26. Bell DA, Scully RE. Early de novo ovarian carcinoma. A study of fourteen cases. Cancer. 1994;73(7):1859–1864. doi:10.1002/1097-0142(19940401)73:7<1859::AID-CNCR2820730714>3.0.CO;2-L
27. Alsharif S, Sharma P, Bursch K, et al. Keratin 19 maintains E-cadherin localization at the cell surface and stabilizes cell-cell adhesion of MCF7 cells. Cell Adh Migr. 2021;15(1):1–17. doi:10.1080/19336918.2020.1868694
28. Gao A, Zhang L, Chen X, et al. Effect of VTCN1 on progression and metastasis of ovarian carcinoma in vitro and vivo. Biomed Pharmacother. 2015;73:129–134. doi:10.1016/j.biopha.2015.05.016
29. Huang X, Zhang X, Li E, et al. Vista: an immune regulatory protein checking tumor and immune cells in cancer immunotherapy. J Hematol Oncol. 2020;13(1):83. doi:10.1186/s13045-020-00917-y
30. Mulati K, Hamanishi J, Matsumura N, et al. Vista expressed in tumour cells regulates T cell function. Br J Cancer. 2019;120(1):115–127. doi:10.1038/s41416-018-0313-5
31. Philips GK, Atkins M. Therapeutic uses of anti-PD-1 and anti-PD-L1 antibodies. Int Immunol. 2015;27(1):39–46. doi:10.1093/intimm/dxu095
32. Vilgelm AE, Richmond A. Chemokines modulate immune surveillance in tumorigenesis, metastasis, and response to immunotherapy. Front Immunol. 2019;10:333. doi:10.3389/fimmu.2019.00333
33. Xiao S, Xie W, Zhou L. Mucosal chemokine CXCL17: what is known and not known. Scand J Immunol. 2021;93(2):e12965. doi:10.1111/sji.12965
34. Oka T, Sugaya M, Takahashi N, et al. CXCL17 attenuates imiquimod-induced psoriasis-like skin inflammation by recruiting myeloid-derived suppressor cells and regulatory T cells. J Immunol. 2017;198(10):3897–3908. doi:10.4049/jimmunol.1601607
35. Tucureanu MM, Butoi E, Gan AM, et al. Amendment of the cytokine profile in macrophages subsequent to their interaction with smooth muscle cells: differential modulation by fractalkine and resistin. Cytokine. 2016;83:250–261. doi:10.1016/j.cyto.2016.04.019
36. Helmke A, Nordlohne J, Balzer MS, et al. CX3CL1-CX3CR1 interaction mediates macrophage-mesothelial cross talk and promotes peritoneal fibrosis. Kidney Int. 2019;95(6):1405–1417. doi:10.1016/j.kint.2018.12.030
 © 2023 The Author(s). This work is published and licensed by Dove Medical Press Limited. The full terms of this license are available at https://www.dovepress.com/terms.php and incorporate the Creative Commons Attribution - Non Commercial (unported, v3.0) License.
By accessing the work you hereby accept the Terms. Non-commercial uses of the work are permitted without any further permission from Dove Medical Press Limited, provided the work is properly attributed. For permission for commercial use of this work, please see paragraphs 4.2 and 5 of our Terms.
© 2023 The Author(s). This work is published and licensed by Dove Medical Press Limited. The full terms of this license are available at https://www.dovepress.com/terms.php and incorporate the Creative Commons Attribution - Non Commercial (unported, v3.0) License.
By accessing the work you hereby accept the Terms. Non-commercial uses of the work are permitted without any further permission from Dove Medical Press Limited, provided the work is properly attributed. For permission for commercial use of this work, please see paragraphs 4.2 and 5 of our Terms.