Back to Journals » Diabetes, Metabolic Syndrome and Obesity » Volume 16
Is Chemerin Associated with Gestational Diabetes Mellitus? A Case-Control Study
Authors Ma Z, Chu L, Zhang Y, Lu F, Zhu Y, Wu F, Zhang Z
Received 18 April 2023
Accepted for publication 20 July 2023
Published 2 August 2023 Volume 2023:16 Pages 2271—2281
DOI https://doi.org/10.2147/DMSO.S417632
Checked for plagiarism Yes
Review by Single anonymous peer review
Peer reviewer comments 2
Editor who approved publication: Dr Konstantinos Tziomalos
Ziwen Ma,1,* Liming Chu,1,* Yan Zhang,1,* Fang Lu,2 Yun Zhu,1 Fei Wu,1 Zhiping Zhang1
1Department of Obstetrics and Gynecology, Shanghai Pudong New Area Healthcare Hospital for Women and Children, Shanghai, People’s Republic of China; 2Department of Obstetrics and Gynecology, Shanghai Forth People’s Hospital, Shanghai, People’s Republic of China
*These authors contributed equally to this work
Correspondence: Zhiping Zhang, Email [email protected]
Purpose: The aim of this study was to investigate the relationship between gestational diabetes mellitus (GDM) and Chemerin by analyzing chemerin levels in peripheral blood and cord blood, and chemerin mRNA and its protein expression in placenta and adipose tissue.
Methods: A case-control study was conducted in 110 women with GDM and 110 controls without GDM who received regular prenatal services and delivered at Shanghai Pudong New Area Healthcare Hospital for Women and Children from June 2019 to December 2020.
Results: The age, pre-pregnancy weight, pre-pregnancy BMI, antepartum BMI, TG/HDL ratio and TG levels in pregnant women with GDM were significantly higher than those in women without GDM, and HDL levels were significantly lower than those in the normal group. Chemerin in the umbilical cord blood of the GDM group was significantly higher than in that of the normal group, but there was no difference in chemerin levels in peripheral blood. In the two groups, the chemerin concentration in peripheral blood was significantly higher than that in umbilical cord blood (P< 0.001). The Chemerin mRNA and protein expression levels in the placenta and adipose tissue of pregnant women in the GDM group were significantly higher than those in the normal group (P < 0.001). In the GDM group, the expression of chemerin protein in adipose tissue was significantly higher than that in placental tissue. Regression analysis showed that the expression level of chemerin protein in placental tissue and adipose tissue was positively correlated with the risk of GDM.
Conclusion: Elevated chemerin is closely related to the risk of GDM, and the placenta may be an important secretion of chemotactic factor sources in addition to adipose tissue and participate in the development of GDM.
Keywords: chemerin, GDM, placenta, adipose
Introduction
In recent years, adipose tissue has received increasing attention as an endocrine organ. It can secrete a variety of bioactive adipocytokines to affect energy metabolisms. Chemerin is a newly discovered adipocytokine related to obesity and metabolic syndrome, also known as tazaro induced gene 2 (TIG2) or retinoic acid receptor responder 2 (RARRES2), which is mainly secreted by white adipose tissue. Chemerin levels correlate with BMI, plasma lipids, blood pressure.
The pathophysiological mechanism of gestational diabetes mellitus (GDM) involves chronic low-grade inflammation, insulin secretion deficiency, and abnormal glucose and lipid metabolism. As a chemokine, chemerin can induce chemotaxis and promote macrophages and dendritic cells to move toward the site of inflammation through the blood vessels, altering the adhesion of endothelial cells involved in the inflammatory response and is regarded as an adipocytokine regulating fat metabolism and energy balance.1,2 Studies3,4 have shown that chemerin is related to the occurrence and development of gestational diabetes mellitus (GDM). A population-based study5 showed that chemokine levels were associated with inflammation and metabolic syndrome even after adjusting for waist circumference factors. Leiherer et al and Bobbert et al shown that chemerin is an independent risk factor for gestational diabetes. However, previous studies did not reach a unified conclusion, and most of them focused on hematology research.6,7 Van Poppel et al8 considered that chemerin was irrelevant to the occurrence and development of GDM. Hare et al9 found that, compared with normal pregnant women, chemerin levels in the maternal venous blood of GDM pregnant women were lower, and the difference was significant. We then ask, as the secretion organ of chemerin—adipose tissue—how is the expression of chemerin in women with and without GDM? The placenta is an important link for maternal-fetal material exchange, what is the difference in the expression of chemerin? How do they correlate with the concentration of chemerin in peripheral blood and umbilical cord blood? There are few studies on this subject and this study will discuss the above questions.
Patients and Methods
Written informed consent was obtained from subjects after a discussion in the Chinese language aided by written information. Ethical approval was granted by the medical ethics committee of the Shanghai Pudong New Area Healthcare Hospital for Women and Children.
Patients
This case-control study was conducted with 220 subjects at Shanghai Pudong New Area Healthcare Hospital for Women and Children from June 2019 to December 2020. According to the results of the oral glucose tolerance test (OGTT) at 24–28 weeks, the subjects were divided into the GDM group (110 cases) and the control group (110 cases).
We utilized the standards studied and recommended by the International Association of Diabetes and Pregnancy Study Group (IADPSG) in 2010 for GDM diagnostic criteria. Women who had other complications during follow-up were excluded. Oral glucose tolerance test (OGTT): The presence of at least one of the following abnormal values was sufficient to diagnose GDM: plasma glucose ≥5.1 mmol/L after an overnight fast; plasma glucose level ≥10.0 mmol/L 1 h after consuming 75 g of glucose; or plasma glucose level ≥8.5 mmol/L 2 h after consuming 75 g of glucose.
The inclusion criteria were as follows: 1) singleton pregnancy, 2) absence of any other health complications, 3) Han nationality, 4) regular prenatal examinations during pregnancy at Shanghai Pudong New Area Healthcare Hospital for Women and Children, and 5) Cesarean section was performed at 37–40 weeks.
The exclusion criteria were as follows: 1) pre-pregnancy acute or chronic diseases, such as pre-pregnancy diabetes, hypertension, and heart disease; 2) multiple pregnancies; 3) not attending regular prenatal examinations during pregnancy; 4) late abortion; and 5) other complications during follow-up; 6) family history of diabetes; 7) history of smoking and alcohol abuse.
All women with GDM were managed in the special clinic of gestational diabetes in our hospital. Each subject signed a written informed consent.
Research Methods
Clinical Characteristics
We collected information including maternal age, height, pre-pregnancy and delivery weight and body mass index (BMI), OGTT results and newborn weight (kg), body length (cm), and BMI.
Collection of Plasma Samples
During the 24–28 week prenatal check-up, 5 mL of maternal venous blood was taken using a disposable sterile syringe and collected in EDTA-K2 tubes. After the fetus was delivered and the umbilical cord was severed, 10 mL of venous umbilical blood was immediately extracted with a disposable sterile syringe and collected in an EDTA-K2 tube. All blood samples were immediately centrifuged at 1000×g for 15 min at 2–8 °C after extraction to obtain plasma. Plasma specimens were stored at −80 °C until further analysis.
Collection of Placenta and Adipose Tissue
After the placenta was delivered, approximately 5 g of subcutaneous fat and placental tissue (1*1 cm, placental tissue including the infant and maternal sides) were collected under aseptic conditions. Partial shipments in 2 mL cryopreserved tubes were stored at −80 °C until further analysis.
Experimental Method
Glucose level was determined by glucose oxidase colorimetry (Huachen, Shanghai, China), and glycated hemoglobin (HbA1c) level was determined by high-performance liquid chromatography (Huachen, Shanghai, China). Triglyceride (TG) was measured by lipase/glycerol kinase colorimetry (Huachen, Shanghai, China). Total cholesterol (TC), high-density lipoprotein (HDL), and low-density lipoprotein (LDL) were determined by enzymatic colorimetry (Huachen, Shanghai, China). Insulin (INS) was detected by a one-step microparticle chemiluminescence assay (μU/mL *6.965= pmol/L) (USA, Abbott). Chemerin in peripheral blood and umbilical cord blood was determined by ELISA (Meilian, Shanghai, China). The intra-assay CV was less than 10%, and the interassay CV was less than 15%. Fluorescence quantitative PCR was used to detect the mRNA level of chemokines in tissues, and the Western blot method was used to detect the protein expression level of chemokines in the placenta and adipose tissue. The main reagents and kits were provided by Weiao, Shanghai, China. The experimental results show that all the values were first analyzed with Δ Ct of the internal reference, and then the relative content =2- Δ Ct was analyzed with the mean value of all samples. Illustration: There are 2 graphs for each indicator. One is the amplification curve, and the other is the fusion curve, which is used to prove the nonspecific amplification in PCR amplification.
RNA Extraction and Quantitative RT-PCR
Total RNA was extracted from tissues using the TriPure Isolation Reagent (Invitrogen, USA) according to manufacturer’s instructions. Total RNA was reverse transcribed using the Transcriptor First Strand cDNA synthesis kit (Invitrogen K1622, USA). Chemerin mRNA levels were quantified by real-time PCR with the Roche480II Real Time PCR System (Roche, Switzerland). Calculation of mRNA expression of chemokine using GAPDH as an internal reference (Weiao, Shanghai, China). The primers were designed by NCBI Primer-blast and synthesized by Jinweiji (Suzhou, China) (Table 1).
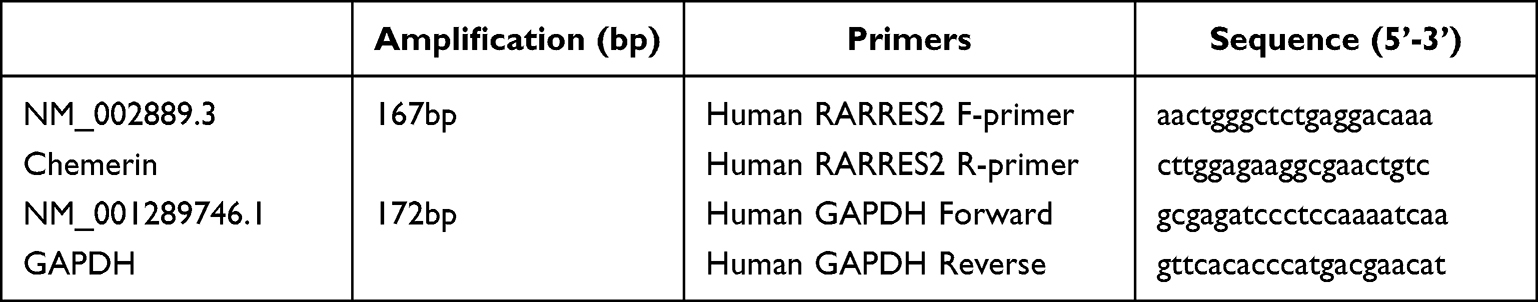 |
Table 1 Hybridization Primers for the Target and Reference Genes Used in the Study |
Western Blot
Proteins were separated by SDS-PAGE electrophoresis and then transferred onto a PVDF membrane. The membrane was washed with TBST (5 min x 3 times), blocked with 5% BSA at room temperature for 2 hours. Chemerin (Abcam, 1:1000) and GAPDH (Weiao, 1:2000) antibodies were added to the blocking solution and incubated overnight at 4°C. The membrane was then washed with TBST (5 min x 3 times). Subsequently, a horseradish peroxidase-conjugated goat anti-rabbit secondary antibody solution was added and incubated at room temperature for 2 hours. The membrane was washed with TBST (15 min x 5 times), followed by development and fixation.
Insulin Resistance (IR) Evaluation Indices
The homeostasis model assessment for insulin resistance (HOMA-IR) was used to evaluate IR.

Statistical Analysis
Data were double-entered by two researchers into the Epi Data database (version 3.1, the Epi Data Association, Odense, Denmark). Statistical analyses were performed using SPSS 22.0. The Shapiro–Wilk test and Q-Q figure were used to evaluate distributions for normality. For quantitative variables with a normal distribution, ANOVA was used for between-group comparisons, and the results are expressed as the means ± standard deviation (SD). Nonnormally distributed data were described by the median (25% quantile, 75% quantile), and the rank sum test was used. Pearson correlations were used to analyze age, BMI, chemerin, and other metabolic parameters. Multiple logistic regression analysis was used to analyze the association of serum chemerin and chemerin mRNA and its protein expression in placenta and adipose tissue with other parameters using the control group as a reference, after adjusting for factors related to gestational diabetes.
Results
General Situation of Pregnant Women
The age, pre-pregnancy weight, antepartum BMI, and gestational weight gain of women with GDM were significantly higher than those of women without GDM. Glucose metabolism parameters: Fasting plasma glucose (FPG), OGTT-1 h and 2 h plasma glucose, and HbA1c and HOMA-IR were all significantly higher for participants in the GDM group than for those in the normal group (P<0.05 for all). The HDL levels in women with GDM (1.51±0.30 mmol/L) was significantly lower than in women without GDM (1.64±0.36 mmol/L), and TG levels and TG/HDL ratios were higher in women with GDM than in women without GDM. There was no difference in TC and LDL between the two groups. In addition, chemerin in the umbilical cord blood of the GDM group was significantly higher than that of the normal group, while there was no difference in chemerin levels in the peripheral blood and neonatal outcome between groups. (Shown Table 2).
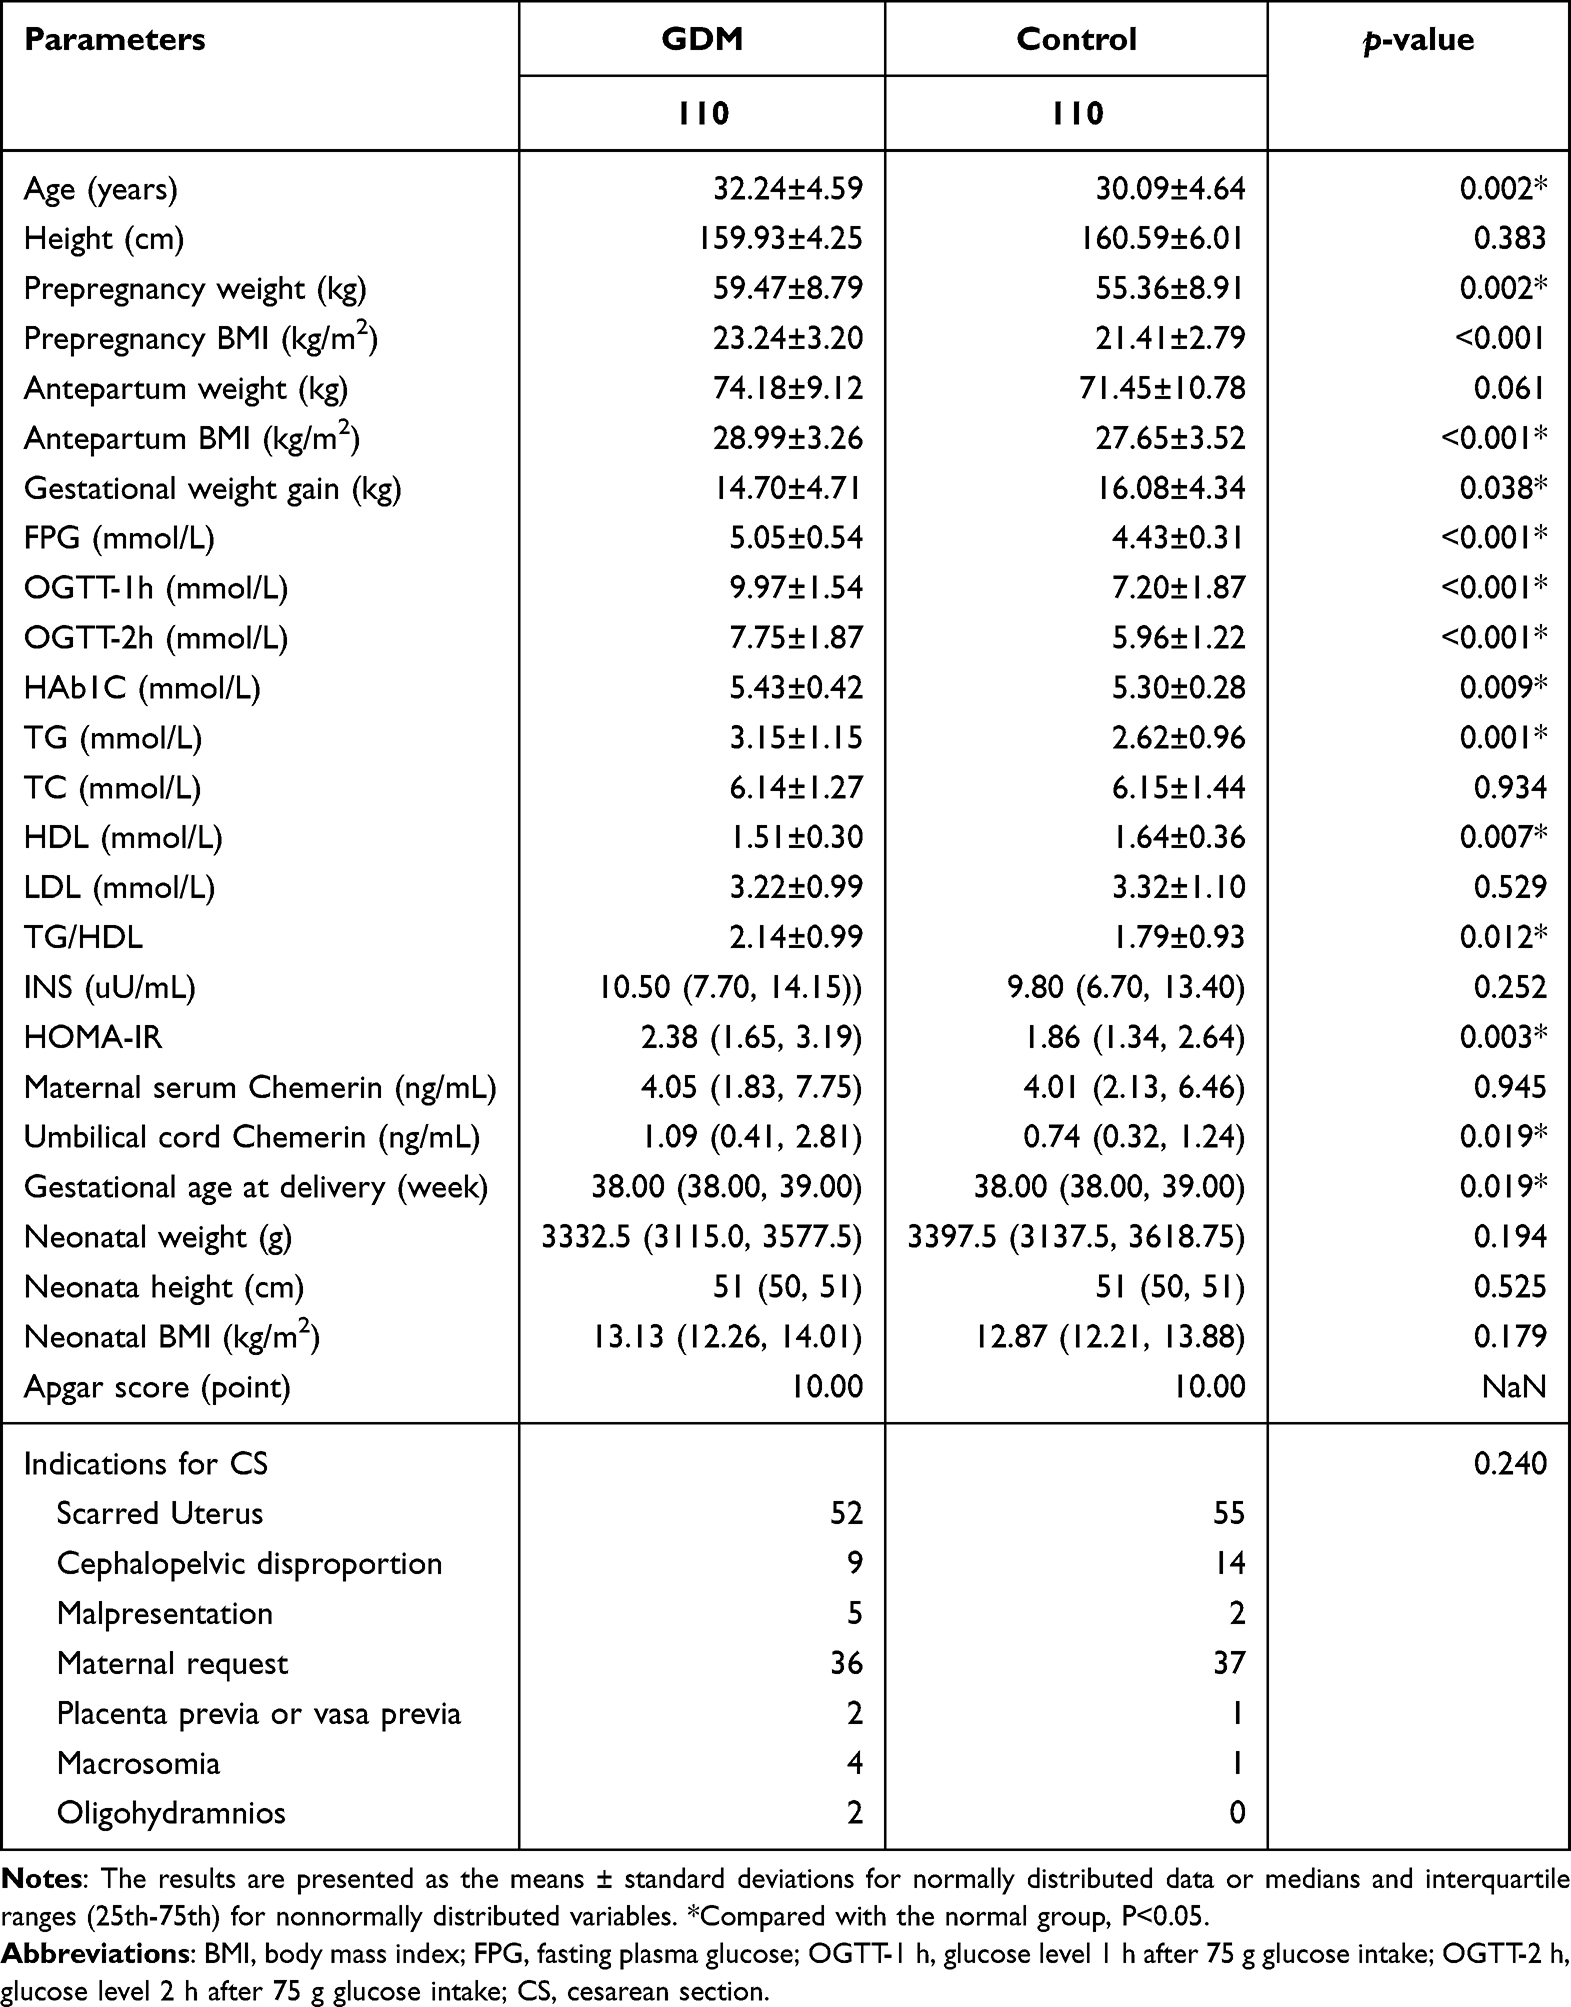 |
Table 2 Clinical and Biochemical Characteristics of Women with and without GDM |
In the GDM group, the chemerin concentration in maternal verum blood was significantly higher than that in umbilical cord blood (P<0.001). This was true in the control group (P<0.001) (Shown Figure 1A–D).
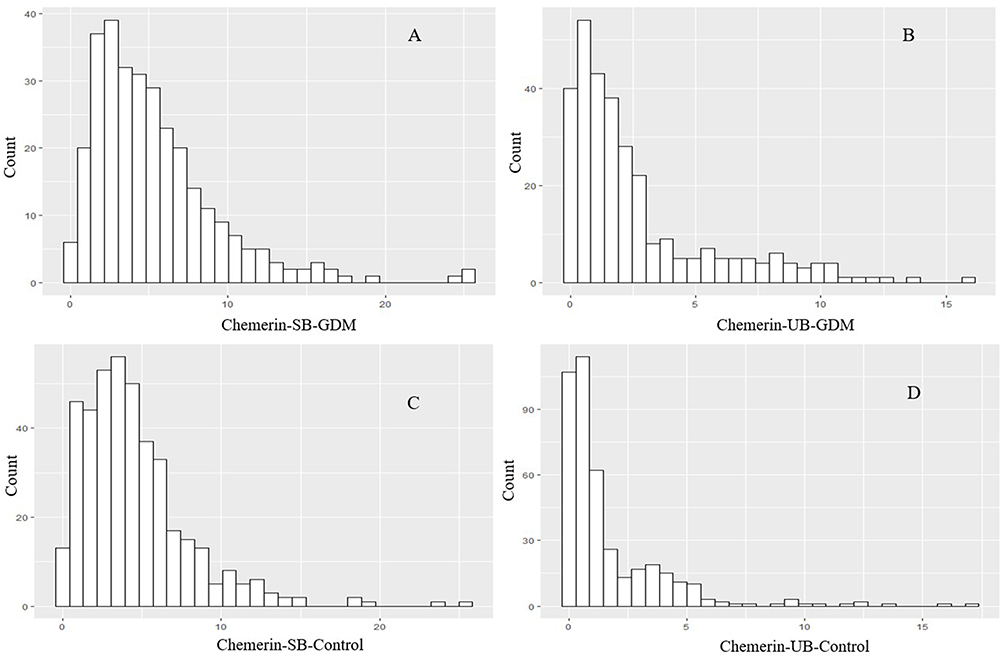 |
Figure 1 Bar charts representing relative Maternal serum (A) and Umbilical cord (B) Chemerin level in women with GDM, and Maternal serum (C) and Umbilical cord (D) Chemerin level in control group. |
Real-Time Quantitative Fluorescence PCR Amplification Curve
The chemerin mRNA and internal reference Actin lines were smooth, the span was the same, and the gene amplification and expression were good. The mRNA expression levels of chemerin in adipose and placental tissue in women with GDM were significantly higher than those in women without GDM (P = 0.038, 0.048, respectively). Chemerin mRNA expression in adipose and placental tissues was not significantly different in the GDM group, nor in the normal group (P=0.438, 0.069, respectively). (Shown Figure 2A–D).
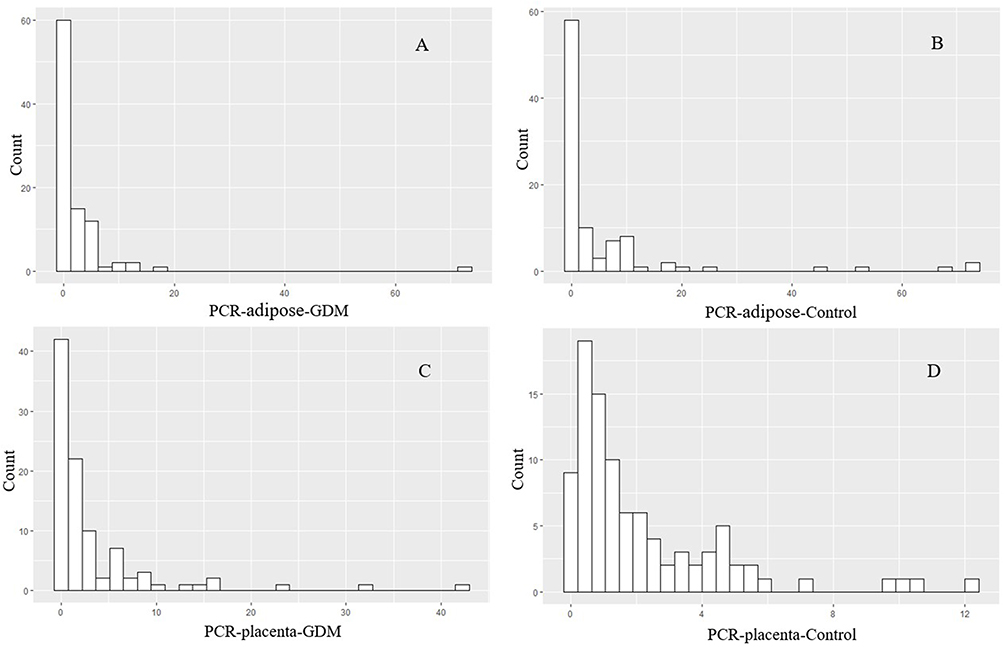 |
Figure 2 Bar charts representing relative Chemerin mRNA expression in the adipose tissue in women with GDM (A) and in control group (B), and in the placental tissue in women with GDM (C) and in control group (D). The median (25% quantile, 75% quantile) are 0.89 (0.49, 2.64), 0.91 (0.41, 5.14) 1.24 (0.34, 4.85), 1.17 (0.45, 3.06), respectively. |
Comparison of the expression of Chemerin protein in the placental and adipose tissue in the two groups: after gray value analysis, the expression level of Chemerin protein in the placental and adipose tissue in women with GDM was higher than that in women without GDM (both P < 0.001). (See Figure 3). In the GDM group, the expression level of chemerin protein in adipose tissue was significantly higher than that in placental tissue (P=0.018). There was no significant difference in the expression of chemerin protein between the adipose tissue and placental tissue in the control group (P=0.287). (See Figure 4A–D).
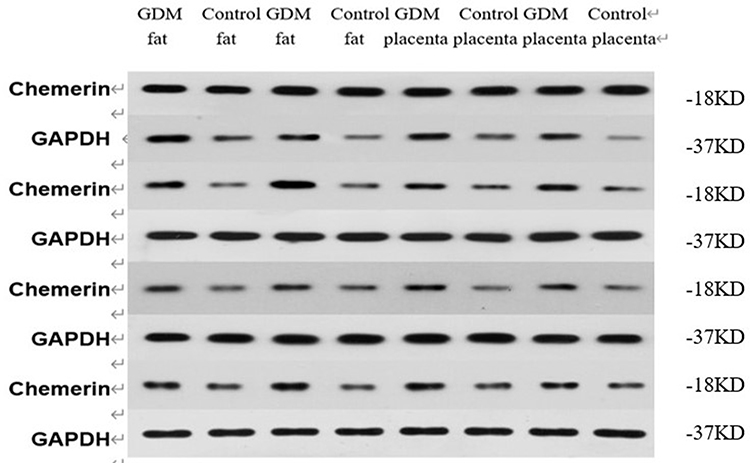 |
Figure 3 The expression of Chemerin protein in the placental and adipose tissue in the two groups. |
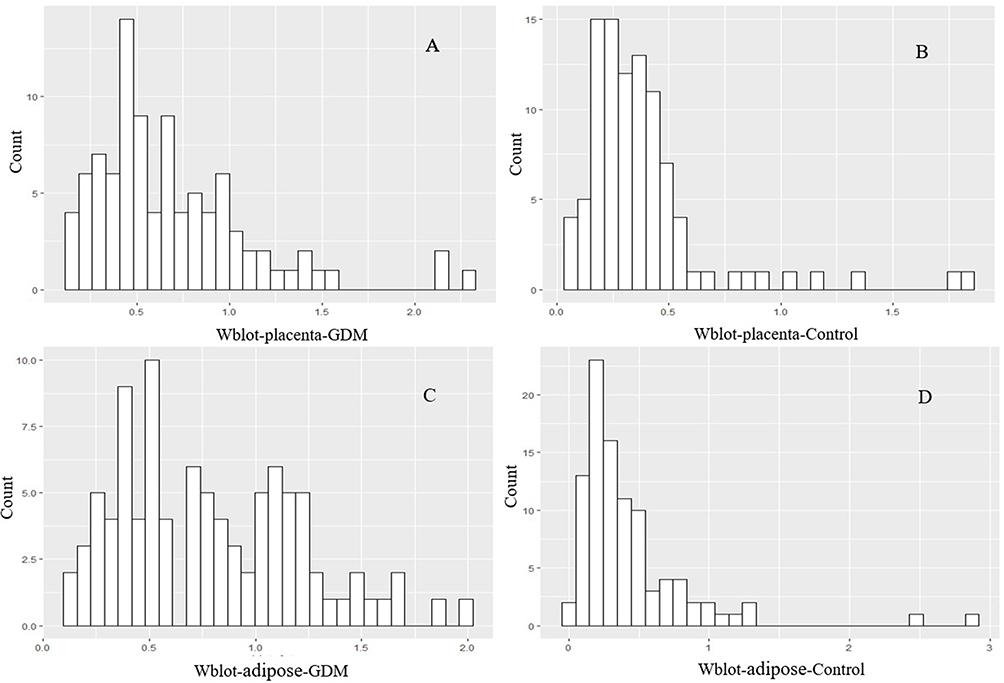 |
Figure 4 Bar charts representing relative Chemerin/GAPDH protein expression in the placental tissue in women with GDM (A) and in control group (B), and in the adipose tissue in women with GDM (C) and in control group (D). The median (25% quantile, 75% quantile) are 0.76 (0.43, 1.12), 0.32 (0.19, 0.53), 0.62 (0.41, 0.93), 0.33 (0.22, 0.46), respectively. |
Logistic Regression Analysis was Conducted on the Factors with Differences
After adjusting for age, height, weight, gravidity, parity and household registration, high chemerin expression in placenta and adipose tissue were independent risk factors affecting GDM (OR=1.35, 1.43, respectively; P<0.001). However, there was no association between the concentrations of chemerin in peripheral blood and umbilical cord blood and the level of chemerin mRNA in the placenta and adipose tissue and GDM. (Shown Figure 5).
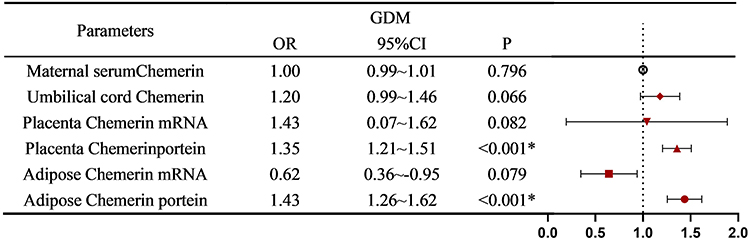 |
Figure 5 Assignment of logistic multivariate regression analysis. *Compared with the normal group, P<0.05. |
Discussion
In the present study, we found that age, pre-pregnancy weight, BMI, and antepartum BMI were higher in the GDM group; This result suggests that gestational diabetes is an age- and weight-related disease, which is consistent with previous research.10–12
It was noteworthy that in the present study, the HDL level in the GDM group was significantly lower than that in the control group, and the TG level in the GDM group were significantly higher than those in the control group. This difference is consistent with the results of most previous studies.13–15 As we all know, GDM is related to the disorder of glucose and lipid metabolism. With the increase of body weight, the number of adipocytes in the body is very limited. When stored in the cell of triacylglycerol content reaches a certain limit, the adipocytes function disorders, the cell reaches apoptosis and further activates the NF, the IcB and the JNK signaling pathway, to promote inflammation factors such as expression of IL - 1 beta, TNF alpha, and IL - 6, inflammation factors interfere with the adipocytes in the phase of insulin signaling pathways, and ultimately lead to insulin resistance.12 With the prolongation of gestational weeks, insulin resistance increases, insulin secretion becomes insufficient, and TG degradation in celiac particles and very low-density lipoprotein is blocked, resulting in an increased serum TG index and decreased HDL levels.16,17 At the same time, lipid metabolism during pregnancy is affected by estrogen levels and insulin resistance. With the continuous aggravation of IR, glucose and lipid metabolism becomes more disordered, and TG levels further significantly increase. However, elevation of lipid concentration is a physiological requirement for maintaining stable energy storage for the fetus, but there is no uniform standard for lipid levels during gestation, and it is difficult to identify which level of lipid elevation is physiological and which is pathological. Barat S18 further believed that TG/HDL is a sensitive indicator of IR resistance and relates to the risk of gestational diabetes, which is more significant than traditional lipid metabolism indicators, and that reducing the TG/HDL ratio is related to reducing IR. In this study, we also discovered TG/HDL ratio in the GDM group were significantly higher than those in the control group.
In 2007, Bozaoglu et al19 first used signal sequence capture technology to find that chemerin mRNA was highly expressed in adipose tissue and regulates adipocyte differentiation. Since then, chemerin has been identified as a new adipocytokine. Chemerin plays a role in adaptive and innate immunity, adipocyte differentiation, and glucose metabolism and increases inflammation.13 Many studies have shown that elevated serum chemokine concentrations are closely related to diabetes mellitus and obesity.4,20–23 However, this opinion has not been unified. Some researchers have demonstrated that maternal peripheral circulating chemerin level in pregnancy is determined by maternal obesity status but is not affected by GDM.8 Bulut et al reported that GDM was unrelated to the serum concentration of chemerin.24 Ruszała et al and Francis et al suggested that chemerin was closely associated with the development of GDM.25,26 In the present study, we found no difference in chemerin content in peripheral blood between the two groups. However, chemerin in the umbilical cord blood of the GDM group was significantly higher than in that of the normal group. To clarify whether chemokines are related to GDM, we detected the protein expression level and mRNA content of chemerin in adipose tissues and placental tissues of subjects in the two groups. We discovered that the protein expression level and mRNA content of chemerin in adipose tissue and placental tissue of pregnant women in the GDM group were significantly higher than those in the normal group. Li et al27 and Xu et al28 reported the same results. In addition, regression analysis showed that the expression level of chemerin protein in placental tissue and adipose tissue was positively correlated with the risk of GDM after excluding factors such as age, height, gravidity and parity, etc. We know that GDM is the first abnormal glucose metabolism detected during pregnancy, and blood glucose gradually returns to normal after delivery. During pregnancy, the placental tissues of pregnant women with GDM secrete abnormally high levels of chemokines, resulting in increased insulin resistance and decreased insulin sensitivity and affecting glucose uptake and utilization. After delivery, the removal of the placenta, an important secretory source, reduces the level of chemokines in the body of pregnant women, and blood sugar gradually returns to normal levels. This is consistent with the characteristics of GDM. We speculated that the placenta might be an important secretory site of chemokines during pregnancy, and the risk of GDM is related to an increase in chemokine secretion in adipose tissue and an abnormal secretion of placental tissue, which may be an independent risk factor for the onset of GDM.
Interestingly, the concentration of chemerin in the peripheral blood of pregnant women in the GDM group and the normal group was significantly higher than that in umbilical cord blood. In addition, the protein expression of chemerin in the adipose tissue of pregnant women in the GDM group was significantly higher than that in placental tissue. As we know, the women with GDM are more likely to deliver macrosomia. We speculate that this may be related to fetal growth and development, the difference in concentration is conducive to forming a blood glucose concentration gradient that meets the nutritional needs of fetal growth and development. However, in this study, there were no evident differences between GDM patients and the control group in the clinical characteristics, including Apgar score, neonatal weight and height, and even the control group gained more during pregnancy than the GDM group, which may be due to diet and weight control in the later period. In addition, this may be related to the fact that chemerin has multiple subtypes, differential expression in different organs, and different activation mechanisms.3 However, there is less coverage of this, and further large-scale investigations are needed to confirm this result.
The mechanism by which chemerin is involved in endocrine and metabolic regulation is highly intricate. Zhou et al29 also discovered that Chemerin level elevated in the placenta of GDM women. By adding different doses of chemerin into the insulin-resistant cell model and incubating for different times, they also found that chemerin first increased the cGAS-STING signal before acting to reduce the levels of cGAS, STING, and IRF3, and this effect was enhanced almost with increasing time gradient. They speculated that chemotactic may alter GDM by mediating cGAS-STING pathway. Increased insulin resistance and promotion of subclinical inflammation also have been suggested as possible pathophysiological mechanisms.1,30
There are several limitations to this study. First, we did not exclude inflammatory factors such as CRP and interleukin. Second, this study is relatively small, and a larger prospective study investigating the effect of chemerin is necessary.
Conclusion
In the present study, our data suggested that elevated chemerin is associated with GDM, and that the placenta may be an important secretion of chemotactic factor sources in addition to adipose tissue and participate in the development of GDM. However, the specific mechanism of chemokine involvement in the pathogenesis of GDM is not clear, and more large-scale prospective studies are needed.
Data Sharing Statement
The datasets analyzed in this study are available from the corresponding author on reasonable request.
Ethics Approval and Consent to Participate
This study was conducted according to the guidelines laid down in the Declaration of Helsinki. Ethical approval was granted by the medical ethics committee of the Shanghai Pudong New Area Healthcare Hospital for Women and Children (No.2022pdw01). 220 pregnant women participated in this study. Written informed consent was obtained from subjects after a discussion in the Chinese language aided by written information.
Acknowledgments
Thanks are due to Dr. Zhiping Zhang for assistance with the experiments and to Dr. Liming Chu and Dr. Zhang Yan for valuable discussion.
Author Contributions
All authors made a significant contribution to the work reported, whether that is in the conception, study design, execution, acquisition of data, analysis and interpretation, or in all these areas; took part in drafting, revising or critically reviewing the article; gave final approval of the version to be published; have agreed on the journal to which the article has been submitted; and agree to be accountable for all aspects of the work.
Funding
Funded by Shanghai Pudong New Area Science and Technology and Economic Committee (PKJ2020-Y72) and Medical discipline Construction Project of Pudong Health Committee of Shanghai (N0. PWYts2021-19).
Disclosure
All authors declare no conflicts of interest in this work.
References
1. Fatima SS, Rehman R, Baig M, et al. New roles of the multidimensional adipokine: chemerin. Peptides. 2014;62:15–20. doi:10.1016/j.peptides.2014.09.019
2. Bondue B, Wittamer V, Parmentie M. Chemerin and its receptors in leukocyte trafficking, inflammation and metabolism. Cytokine Growth Factor Rev. 2011;22(5–6):331–338. doi:10.1016/j.cytogfr.2011.11.004
3. Zhou Z, Chen H, Ju H, et al. Circulating chemerin levels and gestational diabetes mellitus: a systematic review and meta-analysis. Lipids Health Dis. 2018;17(1):169. doi:10.1186/s12944-018-0826-1
4. Liang Z, Zhou M, Xu XK, et al. Is Chemerin associated with gestational diabetes mellitus? An evidence-based clinical research from Chinese women. J Obstet Gynaecol. 2018;38(4):482–487. doi:10.1080/01443615.2017.1385596
5. Zylla S, Pietzner M, Kühn J, et al. Serum chemerin is associated with inflammatory and metabolic parameters-results of a population-based study. Obesity. 2017;25(2):468–475. doi:10.1002/oby.21735
6. Leiherer A, Muendlein A, Kinz E, et al. High plasma chemerin is associated with renal dysfunction and predictive for cardiovascular events — insights from phenotype and genotype characterization. Vasc Pharmacol. 2016;77:60–68. doi:10.1016/j.vph.2015.08.010
7. Bobbert T, Schwarz F, Fischer-Rosinsky A, et al. Chemerin and prediction of Diabetes mellitus type 2. Clin Endocrinol. 2015;82(6):838–843. doi:10.1111/cen.12707
8. van Poppel MNM, Zeck W, Ulrich D, et al. Cord blood chemerin: differential effects of gestational diabetes mellitus and maternal obesity. Clin Endocrinol. 2014;80(1):65–72. doi:10.1111/cen.12140
9. Hare KJ, Bonde L, Svare JA, et al. Decreased plasma chemerin levels in women with gestational diabetes mellitus. Diabet Med. 2014;31(8):936–940. doi:10.1111/dme.12436
10. Wang HK, Zhao YL, Xu XM, et al. Analysis of pre-pregnancy BMI and gestational weight gain of pregnant women with gestational diabetes mellitus in Shanghai. Prog Obstet Gynecol. 2019;28(10):745–748.
11. Yazıcı D, Sezer H. Insulin Resistance, Obesity and Lipotoxicity. Cham: Springer International Publishing; 2017:277–304.
12. Ray I, Mahata SK, De RK. Obesity: an immunometabolic perspective. Front Endocrinol. 2016;7:1–9. doi:10.3389/fendo.2016.00157
13. Wang J, Li Z, Lin L. Maternal lipid profiles in women with and without gestational diabetes mellitus. Medicine. 2019;98(16):e15320. doi:10.1097/MD.0000000000015320
14. Babic N, Valjevac A, Zaciragic A, et al. The triglyceride/HDL ratio and triglyceride glucose index as predictors of glycemic control in patients with diabetes mellitus type 2. Medl Arch. 2019;73(3):163. doi:10.5455/medarh.2019.73.163-168
15. Bao W, Dar S, Zhu Y, et al. Plasma concentrations of lipids during pregnancy and the risk of gestational diabetes mellitus: a longitudinal study. J Diabetes. 2018;10(6):487–495. doi:10.1111/1753-0407.12563
16. de Gennaro G, Palla G, Battini L, et al. The role of adipokines in the pathogenesis of gestational diabetes mellitus. Gynecol Endocrinol. 2019;35(9):737–751. doi:10.1080/09513590.2019.1597346
17. Jin LH, Liu Y, Zhang ZP, et al. Application value of chemerin, FIB and D-Dimer detection in gestational diabetes mellitus. Int J Lab Med. 2019;40(17):2073–2076.
18. Barat S, Ghanbarpour A, Bouzari Z, et al. Triglyceride to HDL cholesterol ratio and risk for gestational diabetes and birth of a large-for-gestational-age newborn. Caspian J Intern Med. 2018;9(4):368–375. doi:10.22088/cjim.9.4.368
19. Bozaoglu K, Bolton K, Mcmillan J, et al. Chemerin is a novel adipokine associated with obesity and metabolic syndrome. Endocrinology. 2007;148(10):4687–4694. doi:10.1210/en.2007-0175
20. Wang X, Liu J, Wang D, et al. Expression and correlation of Chemerin and FABP4 in peripheral blood of gestational diabetes mellitus patients. Exp Ther Med. 2020;19(1):710–716. doi:10.3892/etm.2019.8247
21. Tsiotra PC, Halvatsiotis P, Patsouras K, et al. Circulating adipokines and mRNA expression in adipose tissue and the placenta in women with gestational diabetes mellitus. Peptides. 2018;101:157–166. doi:10.1016/j.peptides.2018.01.005
22. Hasanvand Z, Sadeghi A, Rezvanfar MR, et al. Association between chemerin rs17173608 and rs4721 gene polymorphisms and gestational diabetes mellitus in Iranian pregnant women. Gene. 2018;649:87–92. doi:10.1016/j.gene.2018.01.061
23. Okten SB, Bildacı TB. Salivary Leptin and Chemerin; a novel way of gestational diabetes screening. Gynecol Endocrinol. 2020;36(12):1116–1118. doi:10.1080/09513590.2020.1749999
24. Bulut A, Akca G, Keskin Aktan A, et al. The significance of blood and salivary oxidative stress markers and chemerin in gestational diabetes mellitus. Taiwan J Obstet Gynecol. 2021;60(4):695–699. doi:10.1016/j.tjog.2021.05.019
25. Ruszała M, Niebrzydowska M, Pilszyk A, et al. Novel biomolecules in the pathogenesis of gestational diabetes mellitus. Int J Mol Sci. 2021;22(21):11578. doi:10.3390/ijms222111578
26. Francis EC, Li M, Hinkle SN, et al. Adipokines in early and mid-pregnancy and subsequent risk of gestational diabetes: a longitudinal study in a multiracial cohort. BMJ Open Diabetes Res Care. 2020;8(1):e001333. doi:10.1136/bmjdrc-2020-001333
27. Li X, Ji H, Li C, et al. Chemerin expression in Chinese pregnant women with and without gestational diabetes mellitus. Ann Endocrinol. 2015;76(1):19–24. doi:10.1016/j.ando.2014.10.001
28. Xu XM, L M. Expression of chemerin in peripheral plasma, umbilical vein and placenta of gestational diabetes mellitus. Prog Obstet Gynecol. 2012;21(05):391–394.
29. Zhou X, Zhang H, Jiang Y, et al. The role of chemerin in the regulation of cGAS‐STING pathway in gestational diabetes mellitus placenta. FASEB J. 2023;37(3). doi:10.1096/fj.202201611R
30. Yilmaz Y, Yonal O, Kurt R, et al. Serum levels of omentin, chemerin and adipsin in patients with biopsy-proven nonalcoholic fatty liver disease. Scand J Gastroenterol. 2011;46(1):91–97. doi:10.3109/00365521.2010.516452
 © 2023 The Author(s). This work is published and licensed by Dove Medical Press Limited. The
full terms of this license are available at https://www.dovepress.com/terms
and incorporate the Creative Commons Attribution
- Non Commercial (unported, 3.0) License.
By accessing the work you hereby accept the Terms. Non-commercial uses of the work are permitted
without any further permission from Dove Medical Press Limited, provided the work is properly
attributed. For permission for commercial use of this work, please see paragraphs 4.2 and 5 of our Terms.
© 2023 The Author(s). This work is published and licensed by Dove Medical Press Limited. The
full terms of this license are available at https://www.dovepress.com/terms
and incorporate the Creative Commons Attribution
- Non Commercial (unported, 3.0) License.
By accessing the work you hereby accept the Terms. Non-commercial uses of the work are permitted
without any further permission from Dove Medical Press Limited, provided the work is properly
attributed. For permission for commercial use of this work, please see paragraphs 4.2 and 5 of our Terms.