Back to Journals » Diabetes, Metabolic Syndrome and Obesity » Volume 16
Irisin Ameliorates Renal Tubulointerstitial Fibrosis by Regulating the Smad4/β-Catenin Pathway in Diabetic Mice
Authors Yang Z, Wei J, Wang Y, Du Y, Song S, Li J, Su Z, Shi Y, Wu H
Received 2 March 2023
Accepted for publication 6 May 2023
Published 2 June 2023 Volume 2023:16 Pages 1577—1593
DOI https://doi.org/10.2147/DMSO.S407734
Checked for plagiarism Yes
Review by Single anonymous peer review
Peer reviewer comments 2
Editor who approved publication: Dr Konstantinos Tziomalos
Zhaohua Yang,1,* Jinying Wei,1,* Yashu Wang,1 Yunxia Du,1 Shan Song,1 Jiawei Li,2 Ziyuan Su,2 Yonghong Shi,1 Haijiang Wu1
1Department of Pathology, Hebei Medical University, Shijiazhuang, 050017, People’s Republic of China; 2Basic Medical College, Hebei Medical University, Shijiazhuang, 050017, People’s Republic of China
*These authors contributed equally to this work
Correspondence: Haijiang Wu, Email [email protected]
Background: The primary pathophysiology of diabetic kidney disease (DKD) is tubulointerstitial fibrosis (TIF), and an essential contributing element is excessive extracellular matrix deposition. Irisin is a polypeptide formed by splitting fibronectin type III domain containing 5 (FNDC5), which participates in a number of physiological and pathological processes.
Methods: The purpose of this article is to examine irisin’s function in DKD and analyze both its in vitro and in vivo effects. The Gene Expression Omnibus (GEO) database was used to download GSE30122, GSE104954, and GSE99325. Analysis of renal tubule samples from nondiabetic and diabetic mice identified 94 differentially expressed genes (DEGs). The transforming growth factor beta receptor 2 (TGFBR2), irisin, and TGF-β 1 were utilized as DEGs to examine the impact of irisin on TIF in diabetic kidney tissue, according to the datasets retrieved from the GEO database and Nephroseq database. Additionally, the therapeutic impact of irisin was also examined using Western blot, RT-qPCR, immunofluorescence, immunohistochemistry, and kits for detecting mouse biochemical indices.
Results: In vitro, the findings demonstrated that irisin not only down-regulated the expression of Smad4 and β-catenin but also reduced the expression of proteins linked to fibrosis, the epithelial-mesenchymal transition (EMT), and mitochondrial dysfunction in HK-2 cells maintained in high glucose (HG) environment. In vivo, overexpressed FNDC5 plasmid was injected into diabetic mice to enhance its expression. Our studies found that overexpressed FNDC5 plasmid not only reversed the biochemical parameters and renal morphological characteristics of diabetic mice but also alleviated EMT and TIF by inhibiting Smad4/β-catenin signaling pathway.
Conclusion: The above experimental results revealed that irisin could reduce TIF in diabetic mice via regulating the Smad4/β-catenin pathway.
Keywords: irisin, diabetic kidney disease, tubulointerstitial fibrosis, Smad4, β-catenin
Introduction
Diabetic kidney disease (DKD), also known as diabetic nephropathy, is one of the serious microvascular complications of diabetes and one of the key factors leading to end-stage renal disease (ESRD).1 Due to the global prevalence of DKD, it has brought huge economic burden and serious health damage to human beings. The lesions of DKD mainly involve widening of mesangial matrix, glomerulosclerosis, loss of podocytes, tubular atrophy, apoptosis, renal inflammatory infiltration, and tubulointerstitial fibrosis (TIF). TIF is characterized by extracellular matrix accumulation, and its main components are collagen and fibronectin. Several studies have reported that inflammation, fibroblast activation, microvascular sparseness, hyperglycemia, hypertension, immunity, advanced glycation end products (AGEs) deposition, dyslipidemia, and Epithelial-mesenchymal transition (EMT) are involved in the process of TIF.2–4 Recent researches have demonstrated that the development of TIF is mostly influenced by EMT, which is defined by the loss of epithelial phenotype and the acquisition of interstitial cell features.5–7 Therefore, reversing EMT may further slowdown the process of TIF.
Irisin is a molecule made up of 112 amino acids that was found by Pontus Boström et al in 2012.8 It is created by the cleavage of the transmembrane protein fibronectin type III domain containing 5 (FNDC5). The peroxisome proliferator-activated receptor γ coactivator-1α (PGC-1α) regulates irisin in a mechanistic manner. Skeletal muscular contractions during exercise may activate PGC-1α, which in turn raises the expression of FNDC5, promoting the production and release of irisin.9 Subsequent investigations revealed that in addition to skeletal muscle cells, the heart, adipose tissue, brain, liver, spleen, and testis can also secrete irisin. Studies have illustrated that irisin participates multiple pathological processes, including inhibiting the formation and maturation of adipocytes and bone loss, reducing the area of myocardial infarction, and preventing the Alzheimer’s disease.9–12 In particular, studies showed that irisin could improve islet β-cell activity to reduce insulin resistance and type 2 diabetes.13,14 However, the protective effect and molecular mechanism of irisin in DKD are still unclear.
In this study, three datasets were downloaded from the Gene Expression Omnibus (GEO) database and screened out an important differential gene as TGF-β1. At the same time, according to the Nephroseq database and experimental results, the relationship between Irisin and TGF-β1, transforming growth factor beta receptor 2 (TGFBR2) in DN was found. Previous research has demonstrated that TGF-β1 regulates renal fibrosis in DKD by, among other things, increasing the formation of excessive extracellular matrix and initiating the start of EMT programs.15,16 Subsequently, we demonstrated that irisin inhibited the proceeding of EMT and the production of proteins associated with fibrosis in HK-2 cells induced by high glucose (HG) by inhibiting Smad4/β-catenin signaling. Meanwhile, irisin attenuated diabetes-induced EMT and TIF. The current research may provide a new idea for irisin treatment of DKD.
Material and Methods
Bioinformatic Analysis
Three expressed gene expression profiles, GSE30122, GSE104954, and GSE99325, were detected and downloaded from the GEO database. And the probe IDs of the three datasets correspond to the genetic markers of the platform. Eliminate probe IDs that correspond to one or more genetic markers. If more than one ID corresponds to the same gene, the gene’s highest level of expression will be used. Each data set is normalized and screened using the limma package of the R programming language (4.0.3, https://www.r-project.org/). Select P<0.05 and |log FC|≥1 as the basis for screening differential genes. On this basis, the differential genes overlapped in more than two datasets were defined as differentially expressed genes (DEG) for subsequent analysis. Annotations, visualization, and Integrated Discovery (DAVID v6.8, and https://david.ncifcrf.gov/) were used to conduct Gene Ontology (GO) and Kyoto Encyclopedia of Genes and Genomes (KEGG) enrichment analysis to explore the biological functions and pathways of the stated DEGs. The enrichment analysis data is used to conduct further analysis. A statistical difference that is significant was defined as P<0.05. Using the DEGs’ STRING database (https://www.string-db.org), the protein-protein interaction (PPI) network was created. Cytoscape software (http://www.cytoscape.org) was used to visualize PPI networks. The top 50 hub genes in DEGs were found using the CytoHubba plugin in CytoHubba. The Cytoscape plugin for Molecular Complex Detection (MCODE) was used to screen the important modules.
Reagents
The antibodies of α-SMA (14395-1- AP), transforming growth factor beta receptor 2 (TGFBR2) (66636-1-AP), E-cadherin (20874-1- AP), Smad4 (10231-1 - AP), β-catenin (66379-1-Ig), Fibronectin (15613-1- AP), Snail (13099-1-AP), HRP-conjugated Affinipure Goat Anti-Rabbit IgG (H+L) (SA00001-2) and HRP-conjugated Affinipure Goat Anti-Mouse IgG (H+L) (SA00001-1) were from Proteintech (Chicago, IL). Abcam provided the anti-fibronectin antibody (ab413) (Cambridge, UK). Biochemical assay kits for serum creatinine (Scr) and total cholesterol (TC) were purchased from Nanjing Construction Institute of Bioengineering (Nanjing, China). BCA protein assay kit (Pc0020-50T) was used for determination of 24h urine protein levels (Solarbio, China). Streptozotocin (S8050) was provided from Solarbio (China). Recombinant irisin (SRP8039) obtained from Sigma-Aldrich. Fetal bovine serum (FBS) and medium were purchased from Gibco Corporation (Gaithersburg, MD). GenePharma provided Smad4 siRNA and NC (Negative control) siRNA (Shanghai, China). We purchased TRIzol from Invitrogen Life Technologies (Carlsbad, CA). The transfection agent used was Lipofectamine 2000 (CA, Invitrogen). ChamQ Universal SYBR qPCR Master Mix and HiScript III RT SuperMix (+ gDNA Eraser) are available from Vazyme Biotech (Nanjing, China). From Tiangen Biochemical Technology Co., Ltd., a kit for the EndoFree Maxi Plasmid was purchased (Beijing, China). The plasmid overexpressing FNDC5 gene (NM-153756) was purchased from OriGene Technologies. The Beijing Zoman Biotechnology Co., Ltd. provided an empty plasmid vector and we purchased Masson trichrome staining and Periodic Acid-Schiff (PAS) kits from Baso Biotechnology Co., Ltd.
Cultivation and Treatment of Cells
The purchased HK-2 cells (American Type Culture Collection) were divided into normal glucose concentration group (NG group, 5.6 mmol / L glucose), normal glucose concentration plus mannitol (M group, 24.4 mmol /L glucose), high glucose concentration group (HG group, 30 mmol/L glucose), and HG plus 10 ng/mL of recombinant irisin (HG + Irisin group) and cultured for 48h. The medium was also given 10% FBS, 100 U/mL penicillin, and 100 U/mL streptomycin. The cells were grown in a 37°C, 95% air, 5% CO2 environment. Once the cells grown in HG environment had attained 40–50% confluence, they were transfected using Lipofectamine 2000 in accordance with the instructions with either Smad4 siRNA or NC siRNA. After 6 hours of culture in the substrate with 1% serum free of penicillin and streptomycin, the HK-2 cells were transferred to the original media and continued to grow for another 48 hours.
Animals
When the mice were 6 to 8 weeks old, we bought male C57BL/6JN mice from Beijing Vital River Laboratory Animal Technology Co., Ltd. Free food and water were available at the Hebei Medical University Experimental Animal Center. Animal Experiment Ethics Review Committee of Hebei Medical University (IACUC-Hebmu-2021041) passed the animal experiment plan of this study. Four groups of mice were chosen at random for the experiment: Control (untreated mice, n=8), DM (diabetes mice, n=8), DM + Vector (diabetic mice receiving an injection of an empty plasmid, n=8) and DM + FNDC5 group (diabetic mice with overexpressed FNDC5 plasmid injection group, n=8).
Streptozocin (STZ) (50 mg/kg) was administered intraperitoneally for 5 days straight at the age of 8 weeks to cause diabetes. After the injection was completed, the blood glucose was measured on the third day. Mice with hypoglycemia values greater than 16.7 mmol/L were deemed to be successful diabetic animals. Citric acid buffer was applied to the control group. After the diabetic mouse model was established, FNDC5 overexpression plasmid (25µg, dose 1mg/kg) was injected in the kidney via tail vein to ensure target gene highly expression. In the same manner, empty plasmid was inserted. The mice were kept in the metabolism cage for 24 hours after 24 weeks and the urine was collected to determine the 24h urine protein levels. Afterwards, the mice were sacrificed, their blood was taken, centrifuged, and the serum was kept at −80 °C for the measurement of total cholesterol (TC) and serum creatinine (Scr). In addition, the obtained kidney tissues were used for later detection.
Western Blot Analysis
Using RIPA buffer and protease inhibitors, the proteins in HK-2 cells or tissues could be obtained and utilizing the BCA Protein Concentration Assay Kit to calculate the protein concentration. SDS-PAGE gel electrophoresis was used to transfer proteins of the same quality to PVDF membrane. The membrane was then sealed with 5% skim milk at 37°C for one hour. The protein membrane was incubated with antibodies (α-SMA, E-cadherin, Smad4, β-catenin, Fibronectin, Collagen 1, Snail, β-actin) for 12h at 4°C. Following washing with TBS-T (TBS with Tween-20) buffer, the membrane was then incubated for 1h at 37 °C with the addition of the secondary antibody. The strips were detected using ECL reagents, then scanned with Odyssey Fc after being washed with TBS-T buffer (LI-COR, Lincoln, USA). Image J software was used to measure band intensities (National Institute of Health).
Quantitative RT-qPCR Analysis and RNA Extraction
Following the manufacturer’s instructions, HisScript IRT SuperMix for qPCR (+gDNA) was used to create cDNA from total RNA isolated from cells or tissues using the trizol reagent. Table 1 provides a list of the relevant gene sequences. ChamQ Universal SYBR qPCR Master Mix was used to perform RT-qPCR, and the reactions were processed on the Agilent Mx3000PqPCR Systems (Agilent, CA). Folding changes of gene expression were determined by 2−ΔΔCT.
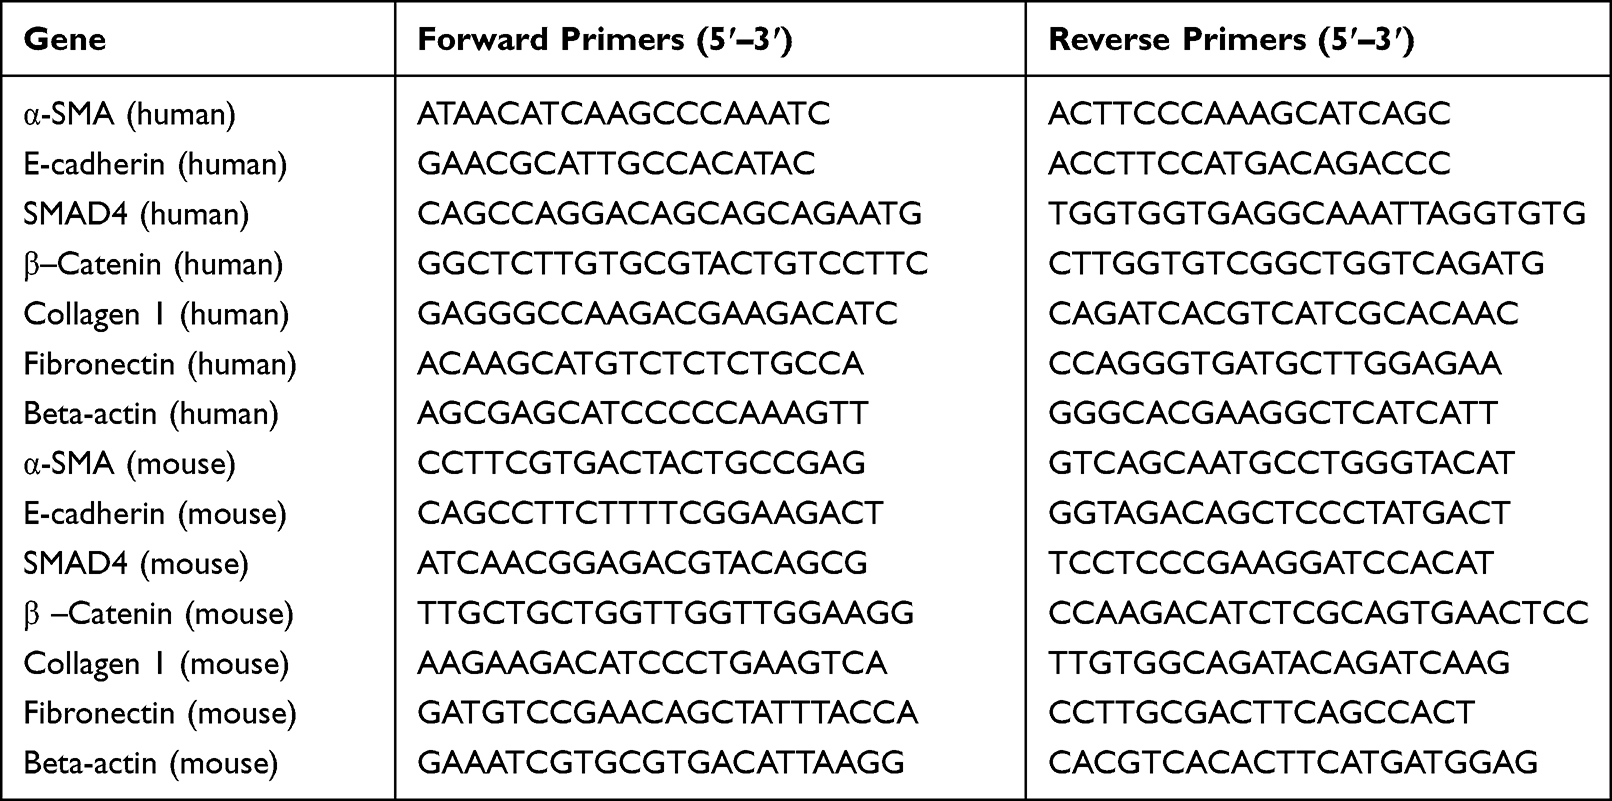 |
Table 1 The Sequences of PCR Primer Pairs Used in This Study |
Immunofluorescence
Briefly, Cells were plated in 6-well plates, fixed for 30 minutes at room temperature with 4% paraformaldehyde, and then stabilized for 10 minutes with TritonX-100. Following a 30-minute blocking step with goat serum, HK-2 cells were incubated overnight at 4°C with an anti-(α-SMA, E-cadherin, and Collagen 1) antibody. After that, at 37 °C, secondary antibodies that were FITC- or TRITC-labeled were employed to attach to the cells. PBS was used to wash the cell slides three times before DAPI staining. Finally, immunofluorescence results were detected with a confocal microscope (Leica, Germany). O.C.T. from Sakura Finetek (Torrance, CA) was used to embed renal tissues, which were then frozen at −80°C. Prepared frozen tissue sections measuring 6 μm were fixed in cold acetone for 20 minutes. Slices of kidney were washed three times with PBS buffer solution before being blocked with goat serum for 30 minutes at 37°C.The next step was a 12-hour incubation at 4°C with antibodies to Collagen 1 and Fibronectin on the tissues. Finally, goat anti-rabbit or anti-mouse secondary antibody was applied to kidney tissue at 37°C for two hours. With an Olympus microscope, all pictures were taken (Olympus, BX71, Tokyo, Japan).
Histology and Immunohistochemistry
The 4% paraformaldehyde-fixed kidney tissues were encased in paraffin. Xylene and ethanol gradients were used to degrease and dehydrate for prepared 3-micron tissue slices. The section was placed in 10 mM citrate buffer at 121°C (pH 6.0) for 5 minutes to extract the antigen. Using 3% hydrogen peroxide in 100% methanol for 20 minutes at 37°C, peroxidase activity was inactivated. To prevent non-specific antigen binding, it was then blocked with 10% normal goat serum for 30 minutes at 37°C. Also, the slice was incubated with anti-E-cadherin, anti-Fibronectin, anti-α-SMA, and anti-Collagen 1 antibodies for an entire night at 4°C. Sections were washed with PBS first, then treated with streptavidin linked to horseradish peroxidase and a biotinylated secondary antibody. Finally, an inverted microscope was used to obtain images (Olympus BX63). Moreover, in accordance with traditional procedures, renal fibrosis and renal mesangial matrix deposition were detected using PAS and Masson’s trichrome staining on 2μm sections. NIH Image J 1.50 software was used to assess the collagen-positive regions of the renal tissues, and Image Pro Plus 6.0 was utilized to compute the area of mesangial matrix deposition in the glomerular.
Mitochondrial Morphology Analysis
The changes of mitochondrial membrane potential were observed by mitochondrial membrane potential detection (JC-1) staining (M8650-100T, Solarbio, Beijing) according to the kit instructions. After being grown in 6-well plates for 48 hours under varied experimental settings, HK-2 cells were washed with sterile saline and then treated with a 25 nM dye solution at 37 °C for 40 min. After once more washing away the dye solution with normal saline, confocal microscopy was used to immediately capture images. Whereas JC-1 aggregates exhibit bright red fluorescence, JC-1 monomers emit green fluorescence. JC-1 showed green fluorescence in mitochondria in apoptotic cells. MitoTracker Red CMXRos (C1035-50ug, Beyotime Biotechnology, Shanghai, China) was applied to observe mitochondrial morphology.
Statistical Analysis
Data are expressed as means ± SD.When comparing differences between two groups, t-tests were used, and when comparing differences between three or more groups, one-way ANOVA analysis of variance was utilized. The data were evaluated using the statistical application SPSS 24.0, and P<0.05 was the threshold for statistical significance.
Results
TGF-β1 is Selected as a Differential Gene Between Renal Tubules of Non-Diabetic and Diabetic Samples
GSE30122, GSE104954, and GSE99325 microarray gene expression profiles were acquired from the GEO database (https://www.ncbi.nlm.nih.gov/geo/). Affymetrix Human Genome Array is the platform for the aforementioned datasets. To perform bioinformatics analysis, 12 non-diabetic renal tubular samples and 10 diabetic renal tubular samples were selected from GSE30122 dataset. 3 control samples and 7 diabetic tubulointerstitial samples were selected from GSE104954. 3 normal samples and 11 DKD samples were selected from GSE99325. In GSE30122, GSE104954, and GSE99325, a total of 656, 199, and 69 distinct differentially expressed genes (DEGs) were discovered according to the criteria of adjusted p value <0.05 and |log FC|≥1.As shown in the Venn diagram, common DEGS in any two datasets were selected for further analysis (Figure 1A). A total of 94 DEGs were visualized in the volcano plot (Figure 1B). Especially, the volcano plot visually showed that TGF-β1, KLF9, FCER1A, CXCL6, MMP7, PLK2, QPCT, MEST, and FLRT3 were significantly different between DKD and controls.
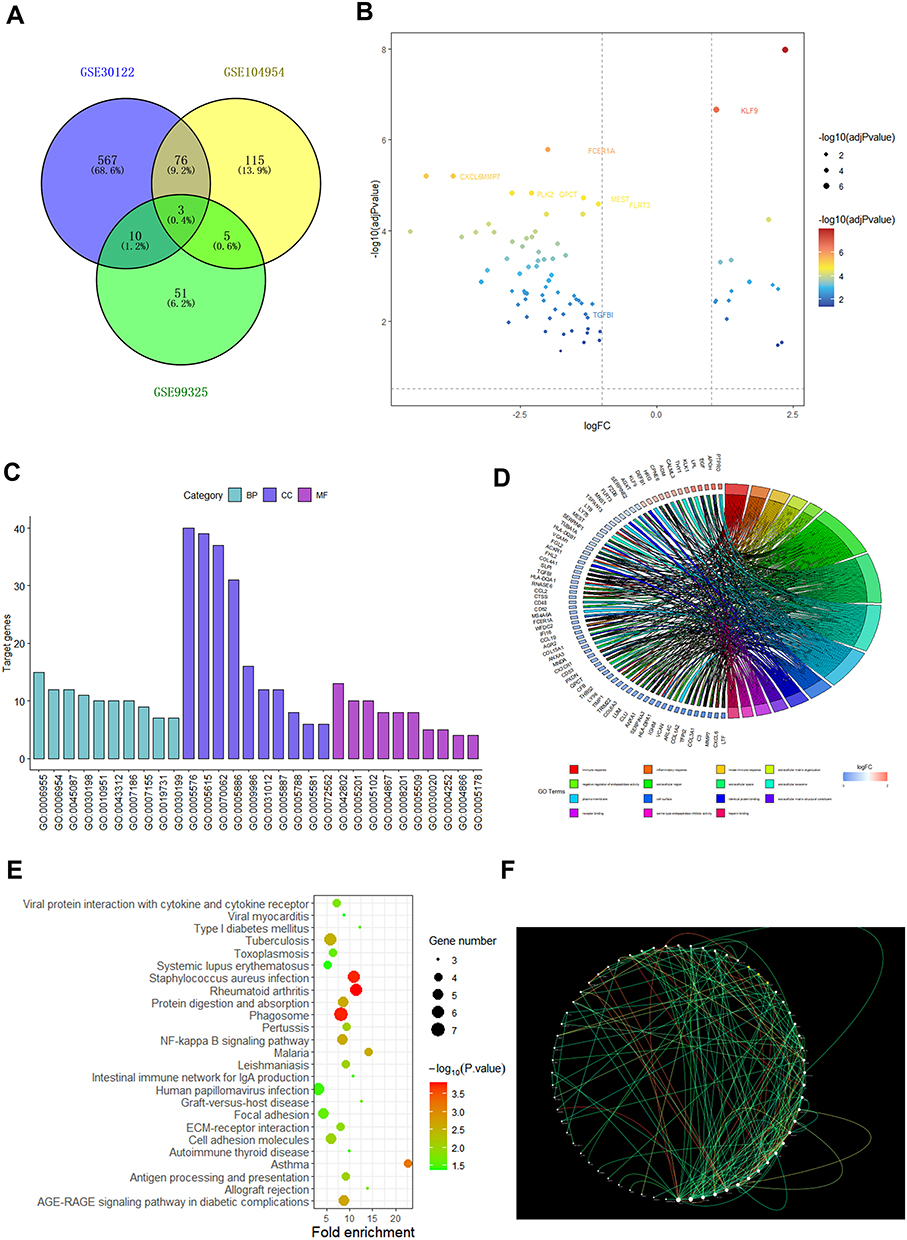 |
Figure 1 Screening as TGF-β1 a differential gene between non-diabetic and diabetic person. (A) Venn diagram of DEGs. The blue part represents the data of GSE30122, the yellow part represents the data of GSE104954, the green part represents GSE99325 and the overlap represents common differential genes. (B) A map of the DEGs’ volcanic distribution. Red denotes the greatest difference, and subsequent colors become less distinct. (C) DEGs’ top 30 enriched GO words. (D) DEGs distribution for various GO enrichment functions. (E) Analysis of KEGG enrichment pathways for DEGs. (F) PPI network of DEGs. The gene’s protein is represented by each node, and the interaction between them is shown by each edge. The inner core of the protein can be identified by its edge color. |
According to biological processes, cellular components and molecular functions, GO functional enrichment analysis was performed on DEGs. Figures 1C–D show the top 10 enriched GO terms. Moreover, Table S1 displays the DEGs’ GO analysis information. Among the 94 DEGs, the most enriched GO terms were associated with extracellular regions, inflammatory responses, and extracellular matrix components, respectively. In particular, the functional enrichment results of GO showed that TGF-β1 was related to the composition of extracellular matrix and inflammatory responses. Significant genes were primarily localized in 25 pathways, according to an enrichment study of KEGG pathways (Figure 1E). Table S2 contains information on the KEGG enrichment analysis of DEGs. Cytoscape software was used to create the PPI network of DEGs, and the findings are displayed in Figure 1F. Moreover, functional modules were identified using Cytoscape’s MCODE plugin, the most important portion of which is depicted in Figure S1. The CytoHubba plugin of Cytoscape was then used to identify the top 50 hub genes from the PPI network based on their degree value, and the findings were displayed in Table S3. Especially the PPI network diagram showed that TGF-β1 is one of the 50 core genes. Therefore, we took the TGF-β1 pathway as a further study.
Irisin is Closely Connected with TGF-β1 and TGFBR2 in Diabetic Conditions
To further explore the relationship between TGF-β1 pathway and DKD, we analyzed the data from a large RNA sequencing study in the Nephroseq database (http://www.nephroseq.org/). In renal tubules from patients with DKD and healthy people, we compared the levels of mRNA expression of the TGF-β1 pathway. We discovered that DKD patients had a considerably higher expression of TGF- β1 and its primary receptor TGFBR2. Surprisingly, we also found that there was a significantly reduced expression of FNDC5, the precursor to irisin (Figure 2A–C). As a result, we wondered if irisin was connected to the TGF-β1 signaling pathway and subsequently investigated the interaction between irisin and TGFBR2 in HK-2 cells. We discovered that, following high glucose and irisin stimulation (2 hours, 10ng/mL), irisin and TGFBR2 were co-localized in HK-2 cells, as shown in Figure 2D. Considering the profibrotic roles of TGF-β1 and TGFBR2 in extracellular matrix remodeling of DKD, and our previous results have demonstrated that the production of TGFB1 in hk-2 cells under the condition of high glucose culture is significantly increased,17 we understood that irisin was connected to DKD and that TGF-β1, TGFBR2, and irisin shared a close interaction.
 |
Figure 2 Irisin may be involved in the progression of DKD through TGFBR2. (A) Expression of FNDC5 gene at mRNA level. (B) Expression of TGF-β1 gene at mRNA level. (C) Expression of TGFBR2 gene at mRNA level. (D) Red fluorescent-labeled TGFBR2 and green fluorescent-labeled irisin co-localized on the cell membrane of HK-2 cells grown in high glucose. Values are expressed as mean ± SD. **p < 0.01 vs healthy group, ***p < 0.001 vs healthy group. |
Irisin Ameliorates HG-Induced EMT and Down-Regulated the Expression of Fibrosis-Related Proteins in HK-2 Cells
In order to investigate how irisin affected EMT and TIF brought on by DKD, HK-2 cells were stimulated for 48 hours with hyperglycemia (30 mmol/L) and irisin (10 ng/mL). Compared with the NG group, the expressions of α-SMA, Fibronectin, Collagen 1 and Snail in the HG group were higher than those in the NG group (5.6 mmol/L). However, these changes were reversed after irisin treatment (Figure 3A–F). Moreover, the outcomes of the real-time qPCR and immunofluorescence labeling matched those of the Western blot (Figure 3G–K).
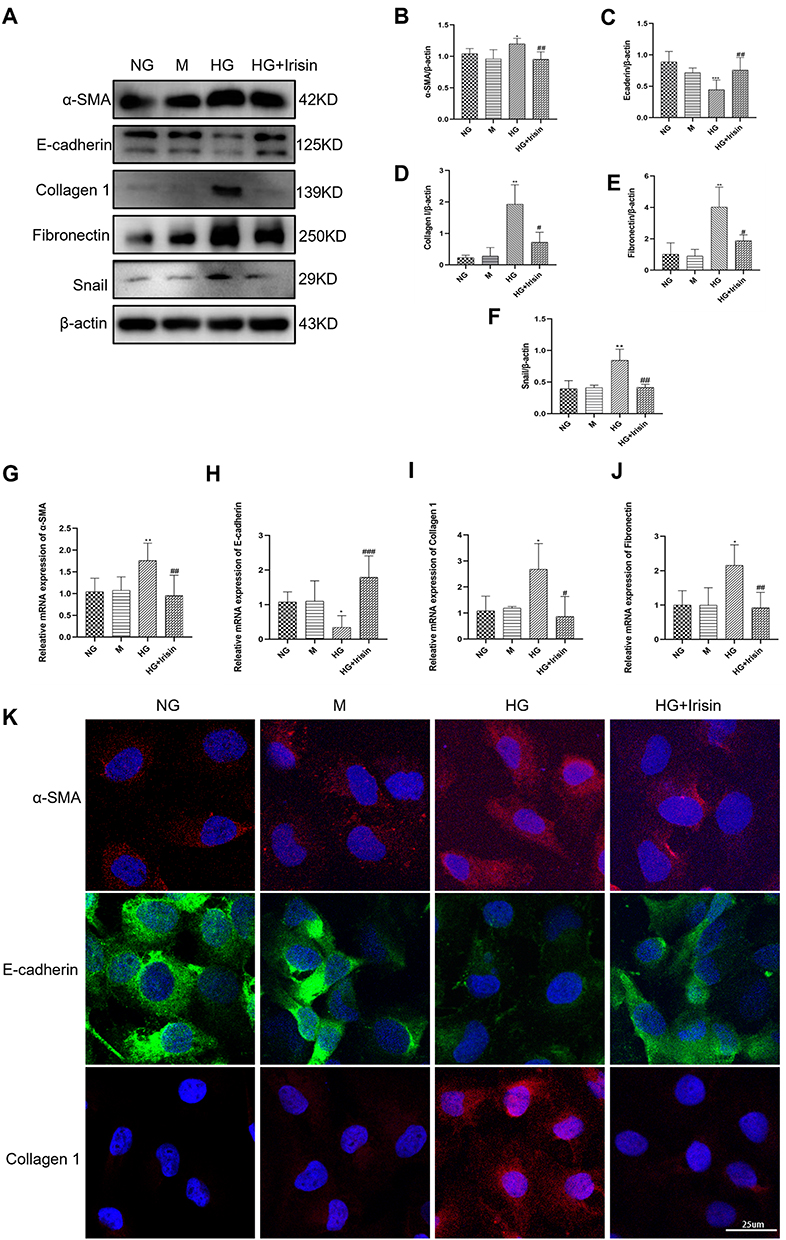 |
Figure 3 Irisin’s role in reducing HG-induced EMT and the production of proteins associated with fibrosis in Hk-2 cells. (A–F) The quantitative findings related to the Western blot detection of α-SMA, E-cadherin, Collagen 1, Fibronectin and Snail expressions in HK-2 cells. (G–J) RT-qPCR was used to ascertain the mRNA levels of α-SMA, E-cadherin, Collagen 1, and Fibronectin. (K) Representative images of α-SMA, E-cadherin and Collagen 1 were obtained by immunofluorescence staining in HK-2 cell. At least three independent runs of each experiment were completed. Values are expressed as mean ± SD. *p < 0.05 vs NG group, **p < 0.01 vs NG group, ***p < 0.001 vs NG group, #p < 0.05 vs HG group, ##p < 0.01 vs HG group, ###p < 0.001 vs HG group. |
Irisin Alleviates HG-Induced EMT, the Expression of Fibrosis-Related Proteins and the Mitochondrial Dysfunction of HK-2 Cells by Inhibiting Smad4/β-Catenin Signaling Pathway
We found that irisin can reduce HG-induced EMT and the expressions of fibrosis-related proteins in HK-2 cells. However, the specific signaling pathway network needs further study. Therefore, we evaluated the study of HG-induced EMT. It can be seen from Figure 4A–E that the HG group’s expressions of Smad4 and β-catenin were much higher higher than those in the NG group. The results showed that the expressions of Smad4 and β-catenin were both inhibited by irisin in high glucose environment.
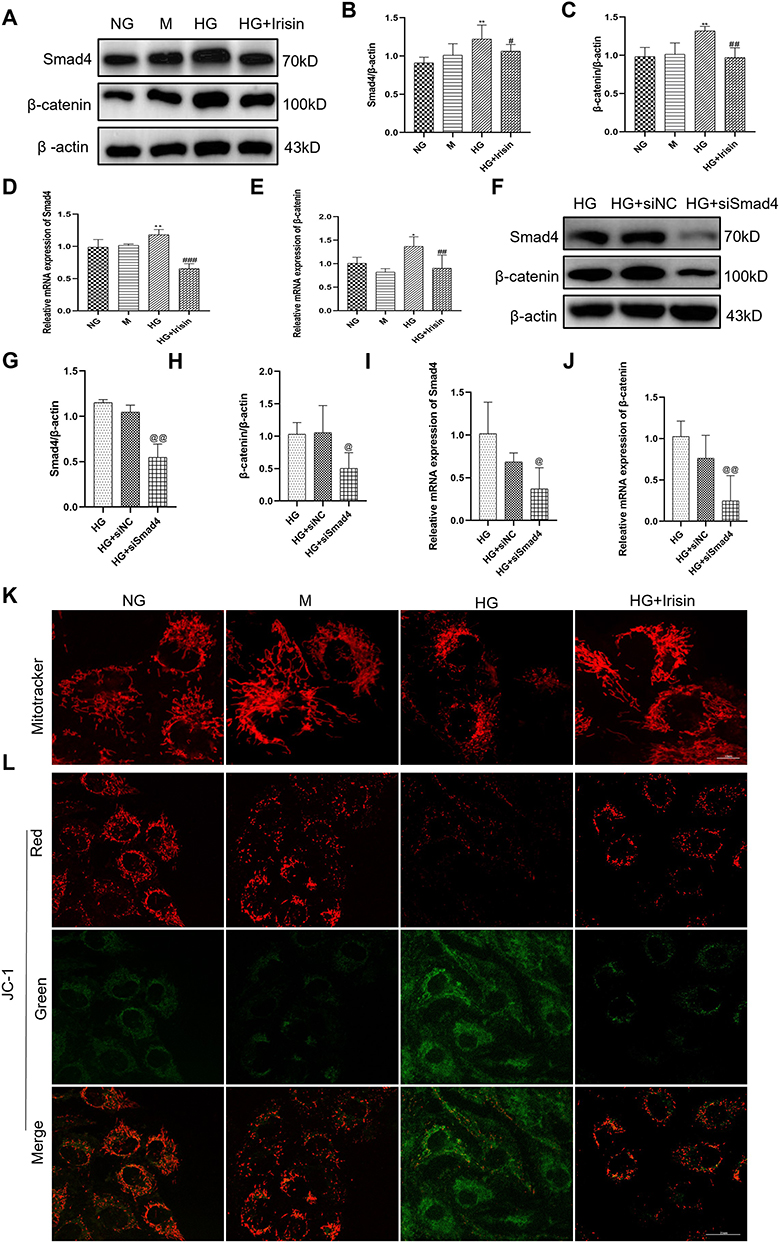 |
Figure 4 Irisin restrained HG-induced EMT, the expressions of fibrosis-related proteins and mitochondrial changes in Hk-2 cells through the stimulation of Smad4/β-catenin signaling pathway. (A–E) Western blot and RT-qPCR were used to analyze the protein and mRNA levels of Smad4 and β-catenin in HK-2 cells (48h). (F–H) After co-treatment with high glucose and siSmad4, the expressions of Smad4 and β-catenin in Hk-2 cells were examined using Western blot (48h). (I and J) The mRNA levels of Smad4 and β-catenin analyzed by RT-qPCR (24h). (K) The mitochondria morphology in the cells was observed by Mitotracker staining. Size: 10 microns (L) JC-1 staining was used to assess changes in mitochondrial membrane potential, which were then seen under a confocal microscope. Size: 25μm. All experiments were performed individually, and at least 3 more replicates were performed. Values are expressed as mean ± SD. *p < 0.05 vs NG group, **p < 0.01 vs NG group, #p < 0.05 vs HG group, ##p < 0.01 vs HG group, ###p < 0.001 vs HG group, @p< 0.05 vs HG+siNC group, @@p < 0.01 vs HG+siNC group. |
Additionally, we created Smad4 knockdown and control cells in high glucose environment using Smad4 siRNA and NC siRNA in order to further explore the relationship between Smad4 and β-catenin. The findings demonstrated that, in comparison to the NC siRNA group, Smad4 siRNA could considerably suppress the expression of Smad4 gene. Moreover, the expressions of Smad4’s protein and RNA were considerably reduced by the effects of Smad4 siRNA (Figure 4F–J). As could be seen, the Smad4/β-catenin signaling pathway allowed irisin to control the kidney function of HG -induced EMT and changes in fibrosis-related proteins in HK-2 cells.
Prior research has proved that long-term hyperglycemia can cause cells to secrete mitochondrial reactive oxygen species, which can harm renal tubules.18 This study intends to examine how irisin protects mitochondria. As shown in Figure 4K, the results showed that HG treatment can cause damage to mitochondria, increase the division of mitochondria, and make it dysfunctional. In contrast, pretreatment with irisin significantly prevented hyperglycemia-induced mitochondrial damage. Figure 4L demonstrates that there was a change in the color of the mitochondrial fluorescence in the HG group from red to green, indicating the reduction in the membrane potential of the mitochondria. In contrast, pretreatment with irisin reduced the effect of this HG-induced trend. In addition, it was also observed that mitochondrial swelling and cristae breakage were relieved after irisin participation via transmission electron microscopy (Figure S2).
Irisin Reverses the Biochemical Parameters and Morphological Characteristics of Diabetic Mice
To elucidate the protective mechanism of irisin in vivo, irisin was overexpressed in the kidneys of STZ-induced diabetic mice using the FNDC5 overexpression plasmid, which was injected into the tail vein. As illustrated in Figure 5A–C, body weights in the DM group were considerably lower than those in the control group. Diabetes-related weight loss in mice treated with FNDC5 overexpression plasmid was reduced. Moreover, the kidney weight and kidney/body ratio were considerably increased in the DM group compared to the control group. Treatment of diabetic mice with FNDC5 overexpression plasmid mitigated the increases in kidney and kidney/body ratios associated with diabetes. 24h urine protein levels, Scr, and TC levels were all noticeably increased in the DM group; however, following treatment with FNDC5 overexpression plasmid, these indicators were fully restored (Figure 5D–F). As a control, the empty plasmid (DM + Vector group) showed no such effect. We also studied the role of FNDC5 gene in the pathological changes of the kidney. The glomerulus was somewhat sclerotic, the mesangial cells were hyperplasia, and the glomerulus was hypertrophic in the DM group, as shown in Figure 5G. The renal mesangium in the DM group was substantially greater than that in the normal control group, according to the findings of PAS staining. And giving diabetic mice FNDC5 overexpression plasmid therapy greatly slowed the pathogenic alterations. Also, the results of Masson’s trichrome staining demonstrated that, in comparison to diabetic mice, the overexpression of the FNDC5 gene can dramatically lower the glomerular collagen deposition. The statistical outcomes of the related staining were shown in Figure S3 and S4.
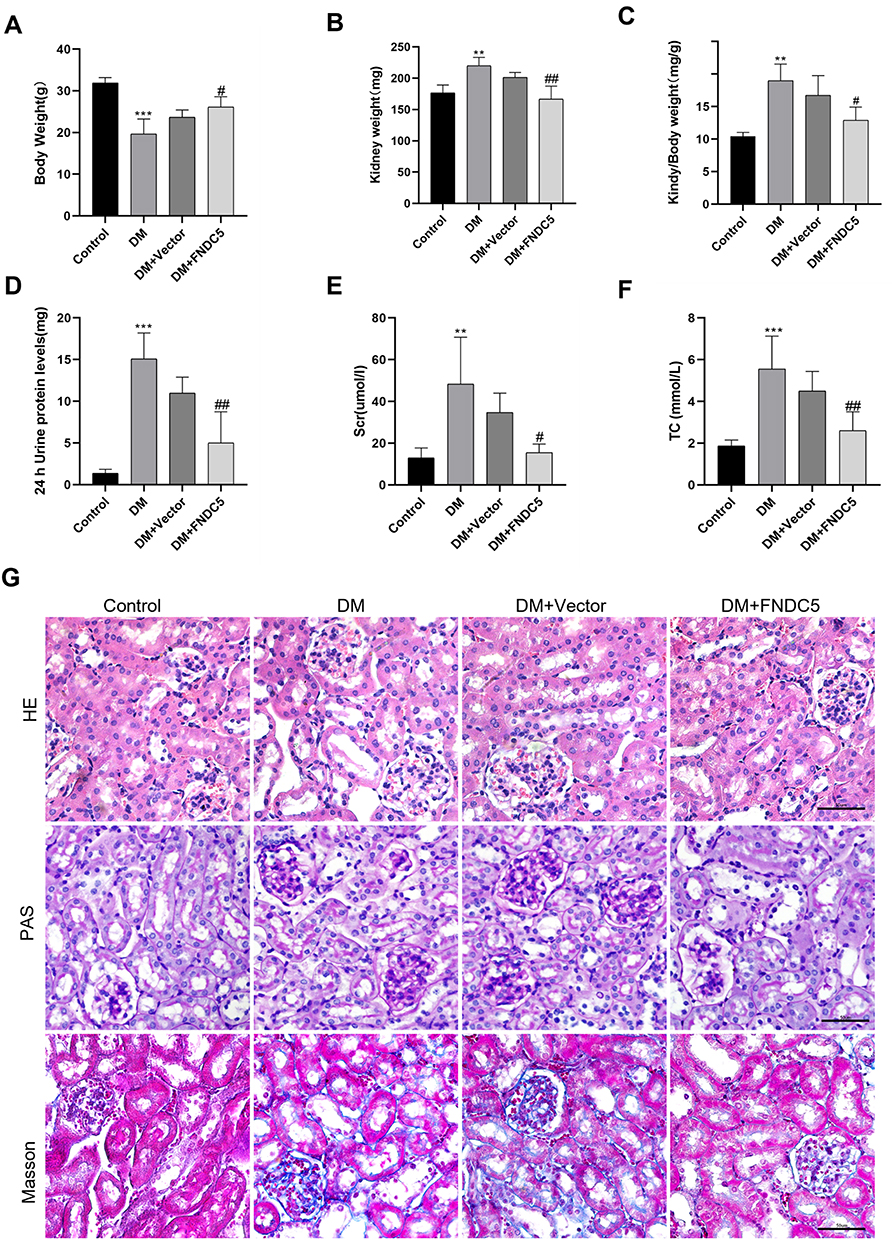 |
Figure 5 Irisin restored changes in biochemical markers and renal function deterioration in diabetic mice. (A–C) After completing the FNDC5 overexpression plasmid therapy, the mice were put to death at 24 weeks and the animals were split up into the control, DM, DM+Vector, and DM+FNDC5 groups. Data on body weight, kidney weight, and the ratio of kidney weight/body weight were gathered. (D–F) 24 h urinary protein levels, Scr and TC were obtained from four different groups. (G) HE, PAS, and Masson trichrome staining in four sets of renal tissue sections are shown in example pathological images. Each experiment was carried out separately and at least three times. Values are expressed as mean ± SD. **p < 0.01 vs Control group, ***p < 0.001 vs Control group, #p< 0.05 vs DM group, ##p < 0.01 vs DM group. |
Irisin Mitigates Renal EMT and TIF of Diabetic Mice
In order to further support the impact of irisin on EMT and TIF in kidney tissue of diabetic mice, the Western blot method was utilized to determine the expression of EMT and interstitial fibrosis-related proteins. Figures 6A–F demonstrate that despite the protein contents of E-cadherin were decreased, the protein levels of α-SMA, Fibronectin, Collagen 1 and Snail were higher in the DM group than in the control group. The aforementioned alterations are clearly inhibited by FNDC5 overexpression plasmid. In contrast to the control group, empty plasmid (DM+ Vector) had no such impact. RT-qPCR and Western blot analysis produced consistent results (Figure 6G–J). Immunohistochemical analysis was used to detect the expression of α-SMA, E-cadherin, Fibronectin, and Collagen 1 in renal tissue. According to the results of immunohistochemistry and quantitative analysis, as shown in Figures 6K and S5–S8, the content of the mesenchymal marker α-SMA increased while the content of the epithelial marker E-cadherin decreased in the DM group. At the same time, we also found that Fibronectin and Collagen 1 were highly expressed in the tubulointerstitium of diabetic mice. Overexpression of the FNDC5 gene significantly altered the above changes. Comparing the immunohistochemical results with immunofluorescence results, both have good consistency (Figure S9).
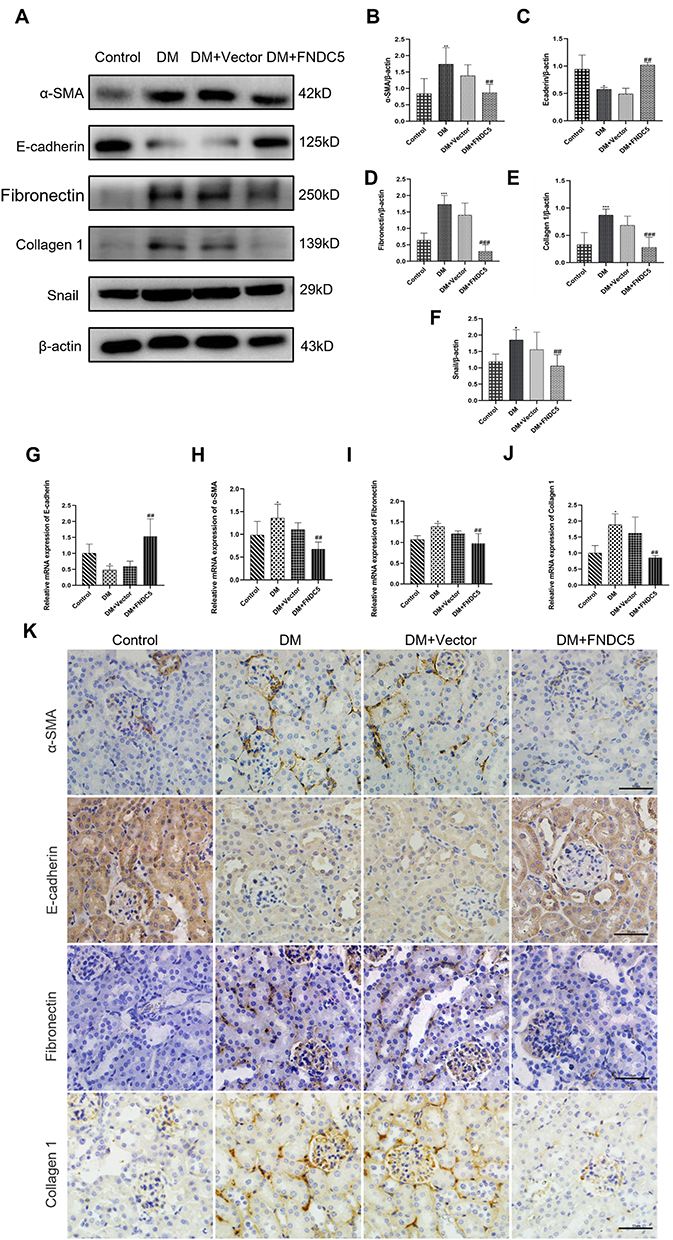 |
Figure 6 Irisin restrained renal tubular EMT and TIF in diabetic mice. (A–F) Expressions and measurements of α-SMA, E-cadherin, Fibronectin, Collagen 1 and Snail, respectively, at the protein and RNA levels.(G–J) RT-qPCR was used to ascertain the mRNA levels of E-cadherin, α-SMA, Fibronectin and Collagen 1. (K) Immunohistochemical staining results of α-SMA, E-cadherin, Fibronectin and Collagen 1 (scale bar, 50 μm) in different groups of renal sections. Each experiment was carried out separately and at least three times. Values are expressed as mean ± SD. *p < 0.05 vs Control group, **p < 0.01 vs Control group, ***p < 0.001 vs Control group, ##p < 0.01 vs DM group, ###p < 0.001 vs DM group. |
Irisin Alleviates Renal EMT and TIF in Diabetic Mice by Inhibiting Smad4/β-Catenin Signaling Pathway
We subsequently examined whether the irisin/Smad4/β-catenin pathway was engaged in renal EMT and TIF in diabetic. Figure 7A–C demonstrates that the protein levels of Smad4 and β-catenin in the DM group were considerably greater than those in the control group. FNDC5 overexpression plasmid significantly reversed these changes. As a control, empty plasmid (DM + Vector group) had no such effect. The outcomes of RT-qPCR and immunohistochemistry matched those of the Western blot (Figure 7D–H).
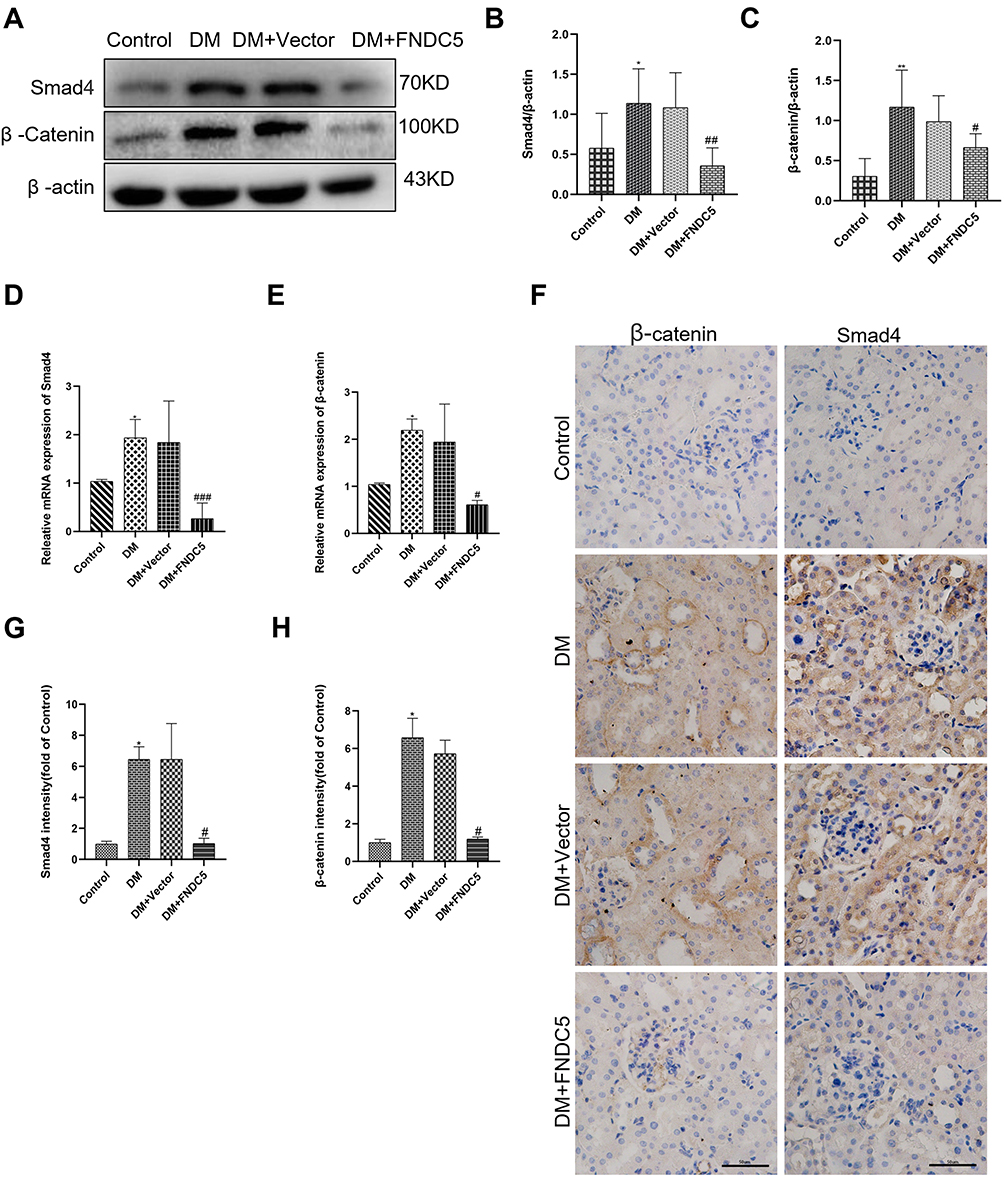 |
Figure 7 Irisin restrained diabetic induced EMT and fibrosis via Smad4/β-catenin pathway. (A–C) Western blot and corresponding quantitative data represent the protein expressions of Smad4 and β-catenin in different renal tissues. (D and E) RT-qPCR was used to determine the expression levels of Smad4 and β-catenin. (F–H) Immunohistochemical results and semi-quantitative analysis of Smad4 and β-catenin in renal tissues. All experiments were performed individually, and at least 3 more replicates were performed. Values are expressed as mean ± SD. *p < 0.05 vs Control group, **p < 0.01 vs Control group, #p < 0.05 vs DM group, ##p < 0.01 vs DM group, ###p < 0.001 vs DM group. |
Discussion
The emergence of DKD is influenced by a variety of intricate factors and pathological changes. TIF is necessary for the onset of renal fibrosis in DKD and appears to be the final common route for DKD to develop ESRD.19,20 Previous studies have shown that EMT is one of the most important mechanisms of TIF.21,22 The function and molecular processes of TIF and EMT on DKD, however, remain unclear.
We first performed bioinformatics analysis to identify the differential genes in renal tubules between non-diabetic and diabetic samples. Bioinformatics methods are of great significance for understanding the molecular mechanisms of nephropathy, lupus, IgA nephropathy, DKD and other nephropathy.23 In this paper, bioinformatics analysis was first performed based on GEO databases. GSE30122, GSE104954, and GSE99325 datasets were used for identification of differential genes between non-diabetic and diabetic mice. Thus, the volcanic map was able to locate 94 DEGs in all. According to GO functional enrichment analysis of DEGs, the extracellular region, inflammatory response, and extracellular matrix structural component were the three primary areas where DEGs were enriched. DEGs were enriched in signaling pathways encompassing type 1 diabetes, according to KEGG pathway enrichment analysis. In addition, PPI network analysis identified the top 50 hub genes. Especially, above analysis showed that TGF-β1 was one of top 50 hub genes and related to extracellular matrix structural components and inflammatory response. TGF-β1 is a crucial component in the TIF of DKD,24–26 according to earlier research. Thus, the TGF-β1 pathway’s downstream signaling elements were chosen for additional research.
We further analyzed the data based on the Nephroseq database to compare the mRNA expression levels of renal tubules in DKD patients and healthy individuals. Nephroseq is an integrated data mining platform for academia and non-profit groups. The findings demonstrated that the expression of FNDC5 was dramatically downregulated whereas TGF-β1 and TGFBR2 genes were significantly upregulated in diabetic renal tubules. This finding unmistakably points to irisin’s significant involvement in TIF in DKD, which is mediated by the TGF-β1 signaling pathway.
We subsequently investigated the interaction between irisin and TGFBR2 in proximal tubular cell line produced from healthy kidney HK-2 cells in order to support this hypothesis. Unsurprisingly, irisin and TGFBR2 were found to be co-expressed in HK-2 cells under high glucose and irisin stimulation. Collectively, our results suggested that irisin was involved in TIF of DKD. Therefore, we focused on exploring the role of irisin and its downstream signaling proteins in the process in TIF in subsequent studies.
The FNDC5 gene’s proteolytic cleavage product, irisin, is thought to be a key regulator of the occurrence of pathogenic disorders.8,27–29 However, the molecular mechanism of irisin in TIF remains to be explored. The experiment was designed to look at how irisin affected TIF and EMT in vitro and in vivo, respectively. In vitro, HG dramatically reduced the protein and mRNA expression of E-cadherin in HK-2 cells while considerably increasing the protein expression levels of α-SMA, Collagen 1, Fibronectin and Snail. In vivo, treatment of irisin not only ameliorated the increase of 24 h urine protein levels, Scr and TC levels but also the increase of kidney weight and kidney/body ratios associated with diabetes. Moreover, partial glomerulosclerosis, mesangial cell proliferation and hypertrophy, and glomerular hypertrophy in diabetic kidney tissues were all reduced by irisin therapy. Furthermore, by lowering the expressions of Fibronectin, Collagen 1, and α-SMA protein and mRNA and raising the levels of E-cadherin protein and mRNA, irisin can also dramatically lessen renal fibrosis. These findings suggest that irisin can lessen diabetes-related TIF and EMT.
We subsequently explored the exact signaling pathway network of irisin on renal protective effect in DKD. As approved above, irisin and TGFBR2 were co-localized in HK-2 cells under HG and irisin stimulation. It is suggested that irisin was involved in TGF-β1/TGFBR2 signaling pathway. TGF-β1 binds to type 2 receptors (TGFBR2), and this causes Smad2 and Smad3 to become activated and phosphorylated, according to earlier research. Together with other nuclear cofactors, phosphorylated Smad2, Smad3 and Smad4 translocate into the nucleus where they assemble into a heterologous complex to regulate the transcription of target genes.30–33 Therefore, we further assessed whether the irisin/ Smad4/β-catenin pathway participated in diabetes-induced TIF and EMT. In vitro, HG dramatically elevated Smad4 and β-catenin protein and mRNA expressions in HK-2 cells. The increased expressions of Smad4 and β-catenin under HG circumstances was eliminated by irisin therapy. Moreover, we further investigated the relationship between Smad4 and β-catenin. Our data demonstrated that Smad4 siRNA treatment not only reduced the expression of Smad4 but also significantly inhibited HG-induced expression of β-catenin at protein and RNA levels. These findings demonstrated the potential of Smad4 as an upstream regulator of β-catenin. In vivo, the expressions of Smad4 and β-catenin were both up-regulated in the DM group. Irisin treatment significantly reversed these changes. Therefore, the renal protective effects of irisin on TIF were mediated by Smad4/β-catenin signaling pathway in diabetic mice.
The pathophysiology of diabetic complications, including DKD, is greatly influenced by mitochondrial dysfunction.34 Altered mitochondrial function in major dysfunctional organs is known to cause obesity and diabetic manifestations in animals and humans.35 For instance, HG or UCP2 overexpression plasmid resulted to mitochondrial fragmentation, indicating enhanced mitochondrial fission and dysfunction, as demonstrated by our prior studies. In contrast, treatment with a UCP2 shRNA plasmid reduced the trend that HG had caused.36 This research sought to determine how irisin affected the HK-2 cells’ mitochondrial function. Our results showed that HG can cause damage to mitochondria, resulting in mitochondrial fission and dysfunction. These changes were reversed by pretreatment with irisin. At the same time, irisin had a certain inhibitory effect on the reduction of mitochondrial potential, mitochondrial swelling, and cristae rupture. These findings suggested that irisin ameliorated EMT and fibrosis of DKD at least in part by modulating mitochondrial function. We would like to carry out a separate and extensive study in the near future, focusing on the exact signal network of this issue. In addition, studies on the role of irisin in vascular function and atherosclerosis have shown that it also has therapeutic potential for cardiovascular diseases and inflammatory diseases.37–39 Moreover, microvascular endothelial cells are thought to be the primary site of hyperglycemic damage in DKD. Intracellular hyperglycemia can harm vascular endothelial cells in the diabetic microvascular system through a number of pathophysiological actions, including inflammation.40 Therefore, by reducing the damage to vascular endothelial cells, irisin may also have protective effects on the kidney. This will also be the focus of our future research.
Conclusion
In summary, we identified TGF-β1 as an important hub gene in renal tubules of non-diabetic and diabetic mice by bioinformatic analysis. Irisin and the key receptor of TGF-β1 were co-localized on HK-2 cell membrane. Irisin, by blocking the Smad4/β-catenin signaling pathway in vitro, reduced HG-induced EMT and decreased the expression of fibrosis-related proteins in HK-2 cells. Furthermore, by blocking Smad4/β-catenin signaling pathway in vivo, irisin ameliorated renal EMT and TIF of diabetic mice in addition to reversing the biochemical parameters and renal morphological characteristics of diabetic mice (Figure 8). As a result, irisin may offer a possible therapeutic target for the management of DKD.
 |
Figure 8 Schematic diagram of mechanism of irisin alleviating renal fibrosis in diabetes mice. |
Abbreviations
ESRD, End-stage renal disease; DKD, Diabetic kidney disease; TIF, tubulointerstitial fibrosis; EMT, epithelial-mesenchymal transition; FNDC5, fibronectin type III domain-containing 5; DEGs, differentially expressed genes; TGF-β1, transforming growth factor beta 1; TGFBR2, transforming growth factor beta receptor 2; HG, high glucose; TC, total cholesterol; GEO, Gene Expression Omnibus; STZ, streptozotocin.
Data Sharing Statement
The GEO database (https://www.ncbi.nlm.nih.gov/geo/) and the Nephroseq database (http://www.nephroseq.org/) were used to generate the data. We value the data platform and the writers who provided the data for upload.
Ethics Approval and Consent to Participate
According to the ARRIVE (Animal Research: Reporting of In Vivo Experiments) guidelines and “Guidelines for Euthanasia of Laboratory Animals GB/T 39760-2021”, the Hebei Medical University Ethics Council for Animal Experiments gave its approval to the experimental animal procedure (no. IACUC-Hebmu-2021041).
Funding
The Natural Science Fund of Hebei Province provided funding for the study under grant number H2020206326.
Disclosure
The authors report no conflicts of interest in this work.
References
1. Zhang Z, Liang W, Luo Q, et al. PFKP activation ameliorates foot process fusion in podocytes in diabetic kidney disease. Front Endocrinol. 2022;12:797025. doi:10.3389/fendo.2021.797025
2. Leung KC, Tonelli M, James MT. Chronic kidney disease following acute kidney injury-risk and outcomes. Nat Rev Nephrol. 2013;9(2):77–85. doi:10.1038/nrneph.2012.280
3. Jain SK, Rains JL. Toll-like receptor-4 and vascular inflammation in diabetes: editorial. Cytokine. 2011;55(3):446–447. doi:10.1016/j.cyto.2011.05.009
4. Vallon V, Thomson SC. Renal function in diabetic disease models: the tubular system in the pathophysiology of the diabetic kidney. Annu Rev Physiol. 2012;74:351–375. doi:10.1146/annurev-physiol-020911-153333
5. Liu Y. New insights into epithelial-mesenchymal transition in kidney fibrosis. J Am Soc Nephrol. 2010;21(2):212–222. doi:10.1681/ASN.2008121226
6. Hills CE, Squires PE. The role of TGF-β and epithelial-to mesenchymal transition in diabetic nephropathy. Cytokine Growth Factor Rev. 2011;22(3):131–139. doi:10.1016/j.cytogfr.2011.06.002
7. Zhao X, He X, Wei W, Huang K. USP22 aggravated diabetic renal tubulointerstitial fibrosis progression through deubiquitinating and stabilizing Snail1. Eur J Pharmacol. 2023;947:175671. doi:10.1016/j.ejphar.2023.175671
8. Boström P, Wu J, Jedrychowski MP, et al. A PGC1-α-dependent myokine that drives brown-fat-like development of white fat and thermogenesis. Nature. 2012;481(7382):463–468. doi:10.1038/nature10777
9. Zhang H, Wu X, Liang J, et al. Irisin, an exercise-induced bioactive peptide beneficial for health promotion during aging process. Ageing Res Rev. 2022;80:101680. doi:10.1016/j.arr.2022.101680
10. Xue Y, Hu S, Chen C, et al. Myokine Irisin promotes osteogenesis by activating BMP/SMAD signaling via αV integrin and regulates bone mass in mice. Int J Biol Sci. 2022;18(2):572–584. doi:10.7150/ijbs.63505
11. Liao Q, Qu S, Tang LX, et al. Irisin exerts a therapeutic effect against myocardial infarction via promoting angiogenesis. Acta Pharmacol Sin. 2019;40(10):1314–1321. doi:10.1038/s41401-019-0230-z
12. Lourenco MV, Frozza RL, de Freitas GB, et al. Exercise-linked FNDC5/irisin rescues synaptic plasticity and memory defects in Alzheimer’s models. Nat Med. 2019;25(1):165–175. doi:10.1038/s41591-018-0275-4
13. Park KH, Zaichenko L, Brinkoetter M, et al. Circulating irisin in relation to insulin resistance and the metabolic syndrome. J Clin Endocrinol Metab. 2013;98(12):4899–4907. doi:10.1210/jc.2013-2373
14. Liu S, Du F, Li X, et al. Effects and underlying mechanisms of irisin on the proliferation and apoptosis of pancreatic β cells. PLoS One. 2017;12(4):e0175498. doi:10.1371/journal.pone.0175498
15. Lamouille S, Xu J, Derynck R. Molecular mechanisms of epithelial-mesenchymal transition. Nat Rev Mol Cell Biol. 2014;15(3):178–196. doi:10.1038/nrm3758
16. Zhao L, Zou Y, Liu F. Transforming growth factor-beta1 in diabetic kidney disease. Front Cell Dev Biol. 2020;8:187. doi:10.3389/fcell.2020.00187
17. Wei J, Shi Y, Hou Y, et al. Knockdown of thioredoxin-interacting protein ameliorates high glucose-induced epithelial to mesenchymal transition in renal tubular epithelial cells. Cell Signal. 2013;25(12):2788–2796. doi:10.1016/j.cellsig.2013.09.009
18. Sun L, Xiao L, Nie J, et al. p66Shc mediates high-glucose and angiotensin II-induced oxidative stress renal tubular injury via mitochondrial-dependent apoptotic pathway. Am J Physiol Renal Physiol. 2010;299(5):F1014–F1025. doi:10.1152/ajprenal.00414.2010
19. Ohnuki K, Umezono T, Abe M, et al. Expression of transcription factor Snai1 and tubulointerstitial fibrosis in progressive nephropathy. J Nephrol. 2012;25(2):233–239. doi:10.5301/JN.2011.8449
20. Xue M, Li Y, Hu F, et al. High glucose up-regulates microRNA-34a-5p to aggravate fibrosis by targeting SIRT1 in HK-2 cells. Biochem Biophys Res Commun. 2018;498(1):38–44. doi:10.1016/j.bbrc.2017.12.048
21. Kang M-K, Park S-H, Choi Y-J, et al. Chrysin inhibits diabetic renal tubulointerstitial fibrosis through blocking epithelial to mesenchymal transition. J Mol Med. 2015;93(7):759–772. doi:10.1007/s00109-015-1301-3
22. Li Z, Ding Q, Ling L-P, et al. Metformin attenuates motility, contraction, and fibrogenic response of hepatic stellate cells in vivo and in vitro by activating AMP-activated protein kinase. World J Gastroenterol. 2018;24(7):819–832. doi:10.3748/wjg.v24.i7.819
23. Tang W, Wang Z, Cao Y, et al. Bioinformatic analysis reveals novel immune-associated hub genes in human membranous nephropathy. Genet Test Mol Biomarkers. 2019;23(1):23–31. doi:10.1089/gtmb.2018.0137
24. Meng XM, Nikolic-Paterson DJ, Lan HY. TGF-β the master regulator of fibrosis. Nat Rev Nephrol. 2016;12(6):325–338. doi:10.1038/nrneph.2016.48
25. Okazaki Y, Yamasaki Y, Uchida HA, et al. Enhanced TGF-beta/Smad signaling in the early stage of diabetic nephropathy is independent of the AT1a receptor. Clin Exp Nephrol. 2007;11(1):77–87. doi:10.1007/s10157-006-0456-1
26. Meng XM, Tang PM, Li J, et al. TGF-β/Smad signaling in renal fibrosis. Front Physiol. 2015;6:82. doi:10.3389/fphys.2015.00082
27. Pignataro P, Dicarlo M, Zerlotin R, et al. FNDC5/irisin system in neuroinflammation and neurodegenerative diseases: update and novel perspective. Int J Mol Sci. 2021;22(4):1605. doi:10.3390/ijms22041605
28. Colaianni G, Cinti S, Colucci S, Grano M. Irisin and musculoskeletal health. Ann NY Acad Sci. 2017;1402(1):5–9. doi:10.1111/nyas.13345
29. Perakakis N, Triantafyllou GA, Fernández-Real JM, et al. Physiology and role of irisin in glucose homeostasis. Nat Rev Endocrinol. 2017;13(6):324–337. doi:10.1038/nrendo.2016.221
30. Pisarev MA, Thomasz L, Juvenal GJ. Role of transforming growth factor beta in the regulation of thyroid function and growth. Thyroid. 2009;19(8):881–892. doi:10.1089/thy.2007.0303
31. Zhang YG, Singhal M, Lin Z, et al. Infection with enteric pathogens Salmonella typhimurium and Citrobacter rodentium modulate TGF-beta/Smad signaling pathways in the intestine. Gut Microbes. 2018;9(4):326–337. doi:10.1080/19490976.2018.1429878
32. Du X, Pan Z, Li Q, Liu H, Li Q. SMAD4 feedback regulates the canonical TGF-β signaling pathway to control granulosa cell apoptosis. Cell Death Dis. 2018;9(2):151. doi:10.1038/s41419-017-0205-2
33. Yang S, Chen X, Yang M, et al. The variant at TGFBRAP1 is significantly associated with type 2 diabetes mellitus and affects diabetes-related miRNA expression. J Cell Mol Med. 2019;23(1):83–92. doi:10.1111/jcmm.13885
34. Mussi N, Stuard WL, Sanches JM, et al. Chronic hyperglycemia compromises mitochondrial function in corneal epithelial cells: implications for the diabetic cornea. Cells. 2022;11(16):2567. doi:10.3390/cells11162567
35. Avram VF, Merce AP, Hâncu IM, et al. Impairment of mitochondrial respiration in metabolic diseases: an overview. Int J Mol Sci. 2022;23(16):8852. doi:10.3390/ijms23168852
36. Wei J, Deng X, Li Y, et al. PP2 ameliorates renal fibrosis by regulating the NF-κB/COX-2 and PPARγ/UCP2 pathway in diabetic mice. Oxid Med Cell Longev. 2021;2021:7394344. doi:10.1155/2021/7394344
37. Bi J, Zhang J, Ren Y, et al. Exercise hormone irisin mitigates endothelial barrier dysfunction and microvascular leakage-related diseases. JCI Insight. 2020;5(13):e136277. doi:10.1172/jci.insight.136277
38. Zhang Y, Song H, Zhang Y, et al. Irisin inhibits atherosclerosis by promoting endothelial proliferation through microRNA126-5p. J Am Heart Assoc. 2016;5(9):e004031. doi:10.1161/JAHA.116.004031
39. Lee MJ, Lee SA, Nam BY, et al. Irisin, a novel myokine is an independent predictor for sarcopenia and carotid atherosclerosis in dialysis patients. Atherosclerosis. 2015;242(2):476–482. doi:10.1016/j.atherosclerosis.2015.08.002
40. Yang J, Liu Z. Mechanistic pathogenesis of endothelial dysfunction in diabetic nephropathy and retinopathy. Front Endocrinol. 2022;13:816400. doi:10.3389/fendo.2022.816400
 © 2023 The Author(s). This work is published and licensed by Dove Medical Press Limited. The
full terms of this license are available at https://www.dovepress.com/terms
and incorporate the Creative Commons Attribution
- Non Commercial (unported, 3.0) License.
By accessing the work you hereby accept the Terms. Non-commercial uses of the work are permitted
without any further permission from Dove Medical Press Limited, provided the work is properly
attributed. For permission for commercial use of this work, please see paragraphs 4.2 and 5 of our Terms.
© 2023 The Author(s). This work is published and licensed by Dove Medical Press Limited. The
full terms of this license are available at https://www.dovepress.com/terms
and incorporate the Creative Commons Attribution
- Non Commercial (unported, 3.0) License.
By accessing the work you hereby accept the Terms. Non-commercial uses of the work are permitted
without any further permission from Dove Medical Press Limited, provided the work is properly
attributed. For permission for commercial use of this work, please see paragraphs 4.2 and 5 of our Terms.