Back to Journals » OncoTargets and Therapy » Volume 16
Investigating the Diagnostic and Therapeutic Potential of SREBF2-Related Lipid Metabolism Genes in Colon Cancer
Authors Ma Y, Wang Z, Sun J, Tang J, Zhou J ![]() , Dong M
, Dong M ![]()
Received 29 June 2023
Accepted for publication 8 November 2023
Published 11 December 2023 Volume 2023:16 Pages 1027—1042
DOI https://doi.org/10.2147/OTT.S428150
Checked for plagiarism Yes
Review by Single anonymous peer review
Peer reviewer comments 2
Editor who approved publication: Dr John Maher
Yuteng Ma,1 Zhe Wang,2 Jian Sun,1 Jingtong Tang,1 Jianping Zhou,1 Ming Dong1
1Department of Gastrointestinal Surgery, First Hospital of China Medical University, Shenyang, 110001, People’s Republic of China; 2Department of Pathology, Shengjing Hospital of China Medical University, Shenyang, 110001, People’s Republic of China
Correspondence: Ming Dong, Email [email protected]
Purpose: Colon cancer is one of the leading causes of death worldwide, and screening of effective molecular markers for the diagnosis is prioritised for prevention and treatment. This study aimed to investigate the diagnostic and predictive potential of genes related to the lipid metabolism pathway, regulated by a protein called sterol-regulatory element-binding transcription Factor 2 (SREBF2), for colon cancer and patient outcomes.
Methods: We used machine-learning algorithms to identify key genes associated with SREBF2 in colon cancer based on a public database. A nomogram was created to assess the diagnostic value of these genes and validated in the Cancer Genome Atlas. We also analysed the relationship between these genes and the immune microenvironment of colon tumours, as well as the correlation between gene expression and clinicopathological characteristics and prognosis in the China Medical University (CMU) clinical cohort.
Results: Three genes, 7-dehydrocholesterol reductase (DHCR7), hydroxysteroid 11-beta dehydrogenase 2 (HSD11B2), and Ral guanine nucleotide dissociation stimulator-like 1 (RGL1), were identified as hub genes related to SREBF2 and colon cancer. Using the TCGA dataset, receiver operating characteristic curve analysis showed the area under the curve values of 0.943, 0.976, and 0.868 for DHCR7, HSD11B2, and RGL1, respectively. In the CMU cohort, SREBF2 and DHCR7 expression levels were correlated with TNM stage and tumour invasion depth (P < 0.05), and high DHCR7 expression was related to poor prognosis of colon cancer (P < 0.05). Furthermore, DHCR7 gene expression was positively correlated with the abundance of M0 and M1 macrophages and inversely correlated with the abundance of M2 macrophages, suggesting that the immune microenvironment may play a role in colon cancer surveillance. There was a correlation between SREBF2 and DHCR7 expression across cancers in the TCGA database.
Conclusion: This study highlights the potential of DHCR7 as a diagnostic marker and therapeutic target for colon cancer.
Keywords: colon cancer, sterol-regulatory element-binding transcription Factor 2, SREBF2, 7-dehydrocholesterol reductase, DHCR7, diagnosis, machine learning
Introduction
Colon cancer is a common malignant tumour of the digestive tract. The incidence of colon cancer is increasing annually,1 with 2.5 million cases estimated to occur worldwide by 2035.2 Most cases start as abnormal polyps, which gradually progress to colon cancer after a long development period.3 Genetic and epigenetic changes have been shown to cause oncogene activation, eventually leading to the formation of colon cancer stem cells.4,5
Lipids are important components of the cell membrane and act as signalling molecules, with an important role in maintaining cell homeostasis.6 Lipid metabolism disorders, such as disorders of fatty acid and cholesterol metabolism, are among the most prominent metabolic changes in cancer.7 Cancer cells in the tumour microenvironment can utilize lipid metabolism and the products of lipid decomposition to produce the energy and signalling molecules needed for their own proliferation, invasion, and metastasis.8–10 For example, acetyl coenzyme A carboxylase 1 (ACC1) is a rate-limiting enzyme for fatty acid synthesis that is highly expressed in many human cancers. ACC1 depletion reduces fatty acid synthesis and further induces the apoptosis of tumour cells.11 Lipid synthesis is regulated by sterol-regulatory element binding proteins (SREBPs), of which there are three forms in mammals: SREBP-1a, SREBP-1c, and SREBP-2.12 Increasing evidence has shown that SREBP-2 (also known as SREBF2) can integrate multiple cell signalling pathways and participate in cancer progression by controlling lipid synthesis.13,14 Notably, SREBF2 and its regulated mevalonate pathway have become important targets in the treatment of various cancers, including prostate cancer,15 breast cancer,16 and hepatocellular carcinoma.17 However, the mechanisms and downstream pathways regulated by SREBF2 in colon cancer remain unclear.
7-dehydrocholesterol reductase (DHCR7) is a critical enzyme that plays a key role in cholesterol metabolism and the synthesis of vitamin D.18 It is associated with fetal development and growth,19 as well as tumor cell differentiation and apoptosis.20 Homozygous or compound heterozygous mutations in DHCR7 can lead to developmental disorders such as Smith-Lemli-Opitz syndrome21 and fetal death, highlighting the importance of this enzyme in human development and survival. Furthermore, previous studies have shown that mutations in the DHCR7 gene are associated with an increased risk of various cancers, including ovarian cancer,22 skin cancer,23 and gastric cancer.24 Li et al discovered that DHCR7 could promote the occurrence of bladder cancer through the PI3K/AKT/mTOR signaling pathway.25 However, the biological functions of DHCR7 in colorectal cancer remain incompletely understood. The early symptoms of colon cancer are not prominent; thus, most patients do not visit a doctor and are not diagnosed until they have late-stage disease. Despite numerous individualized treatment schemes for patients with colon cancer, the prognosis of patients with advanced colon cancer is still very poor.26 The early diagnosis of colon cancer thus remains an important focus of attention. The recent application of machine learning has shown great potential in various aspects of cancer research, such as cancer classification and prediction, drug response, and treatment strategies.27 Machine learning can help to identify and classify patterns in complex and large datasets.28 This feature is especially suitable in the study of high-dimensional data, such as genomic and proteomic data. The current study thus aimed to screen SREBF2-related lipid metabolism genes as potential biomarkers for the diagnosis of colon cancer using machine learning algorithms and bioinformatics analysis and to further explore their prognostic potential.
Materials and Methods
Data Collection and Processing
This study included three colon cancer cohorts from the Gene Expression Omnibus (GEO) and The Cancer Genome Atlas (TCGA) databases and a local dataset. The GEO cohort (http://www.ncbi.nlm.nih.gov/geo/) included seven datasets: GSE10950,29 GSE17536,30 GSE21510,31 GSE41328,32 GSE44861,33 GSE74602, and GSE110224.34 Information on the above datasets is provided in Supplementary Table 1. The seven datasets were processed using the R packages “sva”35 and “limma”,36 and the processing included background correction, batch effect removal, log transformation, quantile normalization, and finally merging. The TCGA dataset was derived from transcriptome sequencing data (https://portal.gdc.cancer.gov/), and the local dataset was obtained from colon cancer samples from the First Hospital of China Medical University (CMU cohort). The sample sizes of three cohorts are shown in Table 1. The lipid metabolism pathway gene set was obtained from the Molecular Signature Database (https://www.gsea-msigdb.org/gsea/msigdb/index.jsp) (Supplementary Table 2).
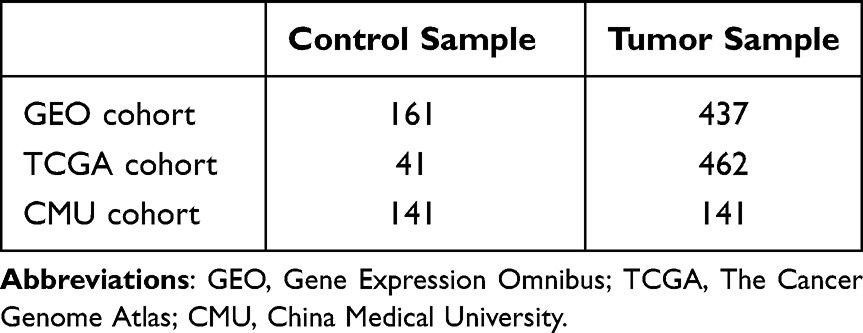 |
Table 1 Sample Sizes of GEO, TCGA, and CMU Cohorts |
Screening Hub Genes by Machine Learning Algorithms
Machine learning algorithms have been shown to be powerful tools for identifying important genes and pathways involved in cancer development and progression. Support vector machine (SVM) is a binary classification model that performs nonlinear classification by mapping data into high-dimensional space. Random forest (RF) is an ensemble learning algorithm that consists of multiple decision trees and performs classification or regression by voting. Generalized linear regression (GLM) is a widely used regression method that fits a linear model by minimizing the sum of squared residuals. Extreme gradient boosting (XGB) is an ensemble learning algorithm that improves prediction accuracy by iteratively training multiple decision trees. We used four algorithms, SVM, RF, GLM, and XGB models, with four R packages, “kernlab”, “randomForest”, “caret”, and “xgboost”, to screen SREBF2-related lipid metabolism genes in colon cancer in the GEO cohort for diagnosis. We used colon cancer as the response variable and the related lipid metabolism genes as the explanatory variables. By setting random seeds, the dataset was divided randomly into a training set and a test set at a ratio of 7:3. The training set included 419 samples (306 colon cancer samples and 113 normal samples), and the test set included 179 samples (131 colon cancer samples and 48 normal samples). We used the R package “DALEX” to explain and analyse the above four models and to draw reverse cumulative distribution plots of residuals and residual boxplots. The optimal model was selected by comparing the residual values, the areas under the receiver operating characteristic (AUC, ROC) curves, and the root mean square errors of the four models. Finally, three of the most important explanatory variables, hub lipid metabolism genes, were selected for subsequent analysis based on the model gene importance score.
Evaluation and Exploration of Hub Genes
Based on the hub genes screened above, we generated a nomogram for the diagnosis of colon cancer using the R package “rms”. We then drew calibration and decision curves using the R package “rmda” to evaluate the predictive performance of the nomogram. Additionally, we used the TCGA cohort as an external validation set and evaluated the diagnostic performance of the identified hub genes using ROC curves. Subsequently, we selected the gene with the highest gene importance score and explored its potential regulatory relationship with SREBF2 by using an online genetic perturbation similarity analysis database (GPSAdb; http://guotosky.vip:13838/GPSA/). Subsequently, based on the median expression levels of the core genes, colon cancer samples in the TCGA dataset were divided into high and low expression groups, and GSEA was performed.
Immune Landscape of Colon Cancer
We evaluated the abundance of 22 immune infiltrating cells in the GEO and TCGA cohort samples using the CIBERSORT algorithm and compared immune infiltration profiles between normal and tumour samples. We also examined the correlation between the expression of 7-dehydrocholesterol reductase (DHCR7), the most important core gene identified by scoring, and immune cell levels.
Correlation Between DHCR7 Expression and the Prognosis of Colon Adenocarcinoma Patients After Surgery
A total of 141 patients with colon adenocarcinoma who underwent surgery between January 2019 and June 2022 at the First Affiliated Hospital of China Medical University were included in this study. All patients provided informed consent before surgery. Clinicopathological data, including age, sex, tumour location, tumour differentiation status, tumour invasion depth, T stage, lymph node metastasis, and TNM stage, were recorded. All the specimens were used for pathological confirmation by two pathologists, with the pathological classification of the primary tumour and the degree of lymph node metastasis confirmed according to the eighth TNM stage. The patients were followed up in the outpatient department and then annually, with the last follow-up on October 30, 2022. The follow-up included documentation of the patients’ medical history and physical examinations. Tissue samples were prepared and preserved by paraffin embedding. Serial 4-μm-thick sections were cut and transferred to adhesive slides. Immunohistochemical staining was performed using an anti-SREBP2 polyclonal antibody (1:1000, R&D Systems, MAB7119) or an anti-DHCR7 antibody (1:1200, Abmart, PHY2844) at 4 °C overnight, followed by incubation with polyclonal peroxidase-conjugated anti-rabbit IgG (Zhongshanjinqiao, Beijing, China) at room temperature for 20 min, according to the manufacturer’s instructions. Each tissue sample was scored independently based on the percentage of stained tumour cells and the staining intensity (range 0–3) by two experienced pathologists who were blinded to the clinical data. The scoring distribution was defined as 0–1 for negative staining and 2–3 for positive staining. The correlation was obtained by combining the staining results with the clinicopathological information. We further explored the relationship between DHCR7 gene expression and patient prognosis by univariable and multivariable Cox proportional hazard regression analyses and survival curves in the CMU cohort.
Statistical Analysis
All statistical analyses were carried out using R software (version 4.1.3, https://www.r-project.org/). Genetic associations were analysed using Spearman correlation analysis. Boxplots of differences in gene expression between normal and tumour samples were created using Wilcoxon’s test. Differences in the abundances of immune cells between normal and tumour samples were analysed using the Kruskal‒Wallis test. Correlations between gene expression and clinicopathological features were analysed by χ2 tests. When the expected lattice count was < 5, differences between categorical factors were analysed using Pearson’s or Yates’ χ2 test. Univariable and multivariable analyses were carried out using a Cox risk regression model. Kaplan‒Meier curves were drawn, and the corresponding P values were obtained by the Log rank test. Results with P < 0.05 were considered to be statistically significant.
Results
Identification of SREBF2-Related Lipid Metabolism Genes
SREBF2-related lipid metabolism genes were identified in the GEO cohort using Spearman correlation analysis, using an absolute correlation coefficient value > 0.3 and P < 0.001 as filter conditions. Finally, we identified 50 upregulated and downregulated lipid metabolism genes (Figure 1).
 |
Figure 1 Correlation plot of the expression of SREBF2-related lipid metabolism genes. The colour of each cell represents the correlation between the expression levels of two genes, with red indicating a positive correlation and black indicating a negative correlation. An “X” in a cell indicates a p value greater than 0.001. |
Screening of Hub Genes Using Diagnostic Models
We further screened the hub genes by generating four diagnostic models: SVM, RF, GLM, and XGB in the training dataset of the GEO cohort. The hub gene importance scores of the four diagnostic models are shown in Figure 2A. Residual boxplots and reverse cumulative distribution plots of residuals showed that the residual values were lower for the SVM and XGB models than for the RF and GLMs, indicating that the former had better diagnostic efficiency (Figure 2B and C). In addition, ROC curve analysis showed that the SVM diagnostic model had the best diagnostic efficiency in the testing dataset of the GEO cohort (AUC = 0.944) (Figure 2D). The top three genes in terms of importance score were therefore selected as hub genes for subsequent analysis based on the results of the SVM diagnostic model.
 |
Figure 2 Generation and assessment of RF, GLM, XGB, and SVM models (A) Importance scores for genes in the four models. (B) Boxplots of residuals for the four models. Red dots represent the root mean square of the residuals. (C) Line plots of the reverse cumulative distribution of residuals. (D) ROC curves for the four models. |
Generation and Evaluation of a Nomogram for Colon Cancer Diagnosis Using Hub Genes
Based on the three hub genes 7-dehydrocholesterol reductase (DHCR7), hydroxysteroid 11-beta dehydrogenase 2 (HSD11B2), and Ral Guanine Nucleotide Dissociation Stimulator Like 1 (RGL1), which were screened by the SVM diagnostic model, we generated a nomogram for the diagnosis of colon cancer in the GEO cohort (Figure 3A). We also used calibration and decision curves to evaluate the accuracy of the nomogram for colon cancer diagnosis (Figure 3B and C). The correction curve showed that the error between the real and predicted values was very small, indicating that the model had high accuracy. The decision curve showed that the “nomogram” curve was above the grey intervention line, indicating that patients might benefit from the model within the threshold range of 0–1. We further verified the screened hub genes in the TCGA cohort. The AUCs of the ROC curves for the analysis of DHCR7, HSD11B2, and RGL1 expression were 0.943, 0.976, and 0.868, respectively (Figure 3D–F), further indicating the accuracy of the model. In the TCGA cohort, DHCR7 gene expression levels were significantly higher, while HSD11B2 and RGL1 expression levels were significantly lower in tumour samples than in normal samples (P < 0.001) (Figure 3G–I). These results suggest that DHCR7 may be a risk factor, while HSD11B2 and RGL1 might be protective factors for colon cancer.
 |
Figure 3 Generation and validation of the nomogram for colon cancer diagnosis (A) Nomogram to predict the occurrence of colon cancer. (B) Calibration curve for evaluating the diagnostic performance and (C) decision curve for evaluating the clinical value of the nomogram. (D–F) ROC curves for DHCR7, HSD11B2, and RGL1. (G–I) Difference boxplots for DHCR7, HSD11B2, and RGL1 expression between normal and tumour samples. |
Identification of DHCR7 as a Downstream Target Gene of SREBF2 in Colon Cancer
The DHCR7 gene had the highest importance score among the hub genes screened by the four diagnostic models and was therefore investigated further. We used the Gene Transcription Regulation Database (GTRD; http://gtrd.biouml.org) and the Human Transcription Factor Target database (hTFtarget; http://bioinfo.life.hust.edu.cn/hTFtarget) to predict the possible target genes of SREBF2. DHCR7 was predicted as a target gene by both databases, and we therefore speculated that DHCR7 might be a target gene of SREBF2. We subsequently explored the RNA-seq dataset (GSE73942) using the online Genetic Perturbation Similarity Analysis Database (GPSAdb; http://guotosky.vip:13838/GPSA/).37 The results of MA and volcano plots showed that the DHCR7 gene was significantly downregulated after knockdown of SREBF2 (Figure 4A and B). We therefore speculated the existence of a positive regulatory relationship between SREBF2 and DHCR7. There was a significant positive correlation between SREBF2 and DHCR7 expression in the TCGA cohort (R = 0.588, P < 0.001) (Figure 4C). Correlation analysis of 33 pancancer samples in the TCGA database also showed a positive correlation (Figure 4D), thus confirming our hypothesis. Subsequently, we divided the colon cancer samples in the TCGA dataset into high and low expression groups based on the median expression levels of DHCR7. The results of GSEA showed that the HALLMARK MYC TARGETS V2 pathway was significantly activated in the high expression group of DHCR7 (Figure 4E and F), indicating a potential role of DHCR7 in the regulation of this pathway.
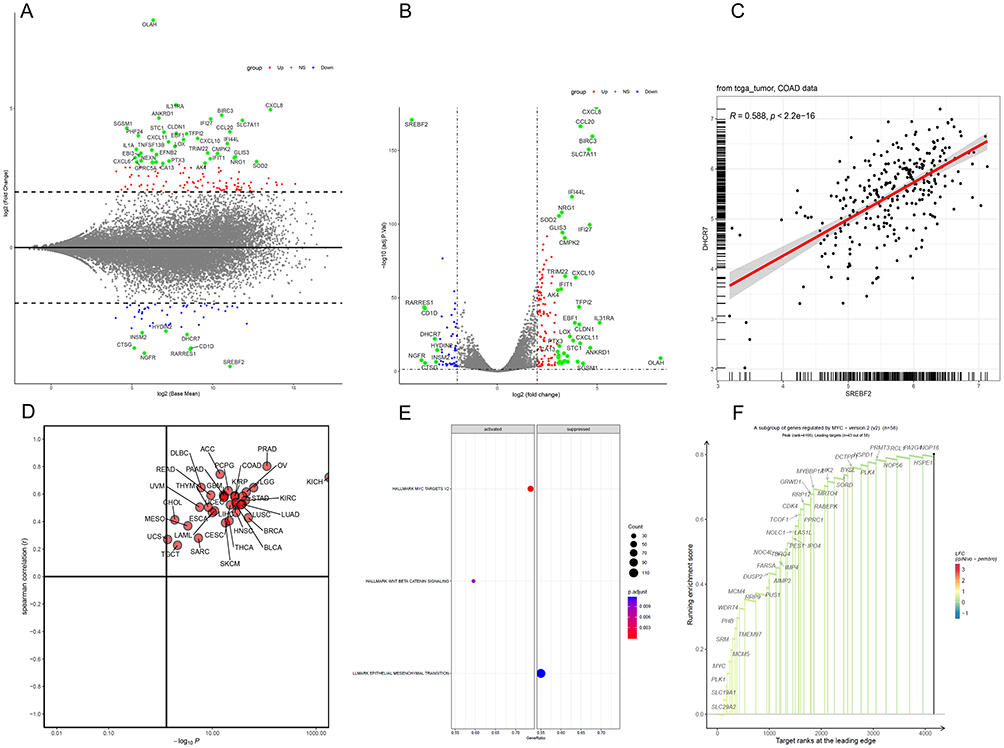 |
Figure 4 Association between SREBF2 and DHCR7 expression (A and B) MA plot and volcano plot generated after knockdown of SREBF2. (C) Correlation analysis between SREBF2 and DHCR7 expression in the TCGA cohort. (D) Correlation analysis between SREBF2 and DHCR7 expression across cancers in the TCGA database. (E and F) GSEA enrichment analysis pathway diagram of the DHCR7 high and low expression groups. The dominant genes upregulated in the HALLMARK MYC TARGETS V2 pathway. |
Immune Microenvironment Landscape in the GEO and TCGA Cohorts
To further understand the characteristics of the colon cancer immune microenvironment, we calculated the abundances of 22 types of immune cells in the GEO and TCGA cohorts (Figure 5A and B). In the GEO cohort, M2 macrophages, resting CD4 T cells, plasma cells, resting mast cells, and γδ T cells were more prevalent in normal samples than in tumour samples, while M0 and M1 macrophages, activated mast cells, activated dendritic cells, and neutrophils accounted for higher proportions in tumour samples (Figure 5C). M0 and M1 macrophages were also more abundant in tumour samples than in normal samples in the TCGA cohort, while M2 macrophages, plasma cells, resting mast cells, and CD8 T cells were more abundant in normal samples (Figure 5D). Considering the proportions of different immune cells, the immune microenvironments of the two cohorts were similar: M0 and M1 macrophages were more abundant in tumour samples, while M2 macrophages were less abundant, suggesting that tumour-associated macrophages may play an important role in regulating the tumour immune microenvironment. We further explored the correlation between DHCR7 gene expression and immune cell abundance in the two cohorts. We found a significant positive correlation between DHCR7 gene expression and M0 and M1 macrophages (P < 0.05) and a significant negative correlation with M2 macrophages (P < 0.001) in the GEO cohort (Figure 5E) and similar results in the TCGA cohort (P < 0.001) (Figure 5F). These results suggest that the DHCR7 gene might be involved in regulation of the immune microenvironment by mediating the polarization of macrophages.
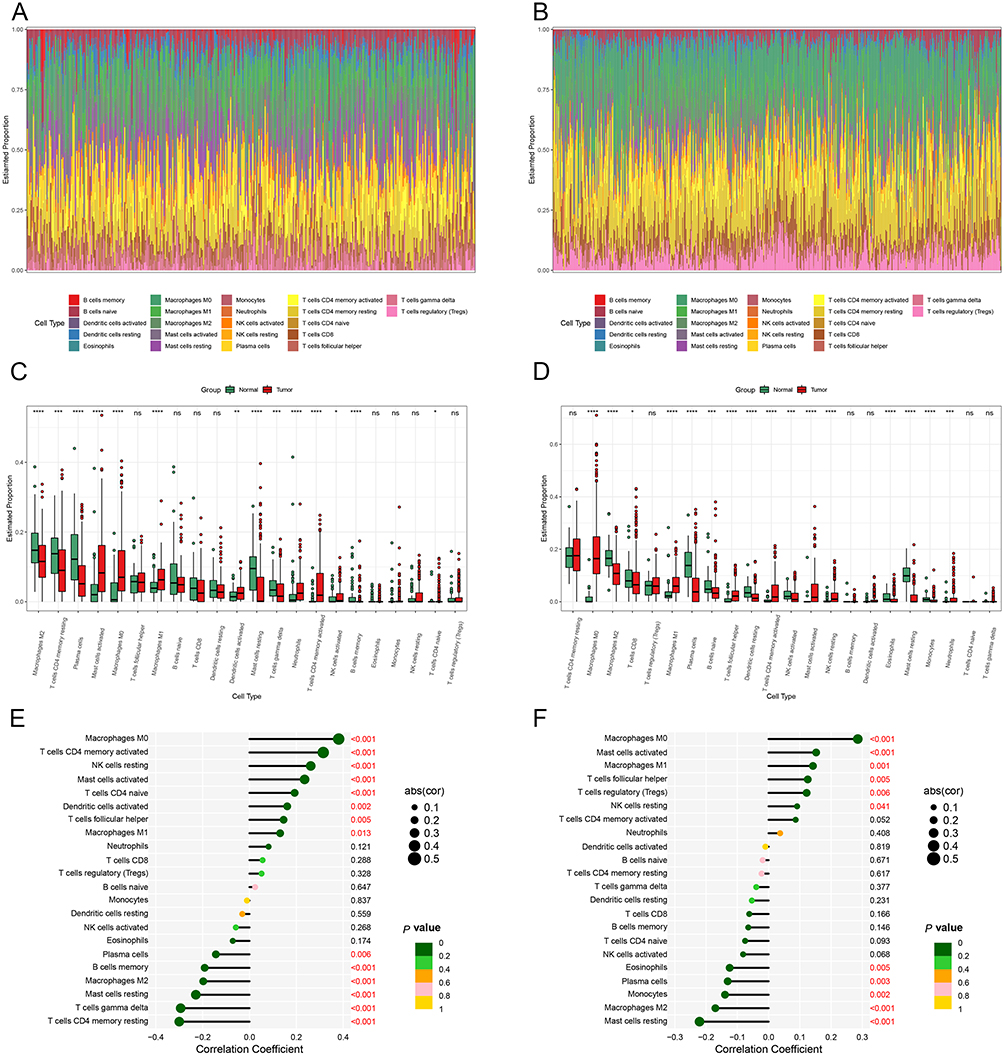 |
Figure 5 Immune microenvironment in GEO and TCGA cohorts (A and B) Bar plots of immune cell abundance in the GEO and TCGA cohorts. (C and D) Boxplots of differences in immune cells between normal and tumour samples in the GEO and TCGA cohorts. (*p < 0.05, **p < 0.01, ***p < 0.001,****p < 0.0001). (E and F) Correlation analysis of DHCR7 and immune cells in the GEO and TCGA cohorts. |
Correlation Between DHCR7-SREBF2 Expression and Clinicopathological Parameters in the CMU Cohort
We detected the expression levels of DHCR7 and SREBF2 proteins by immunohistochemical staining of colon cancer and adjacent normal samples in the CMU cohort (Figure 6). The results showed that DHCR7 and SREBF2 were obviously highly expressed in colon cancer tissues. Furthermore, SREBF2 and DHCR7 expression levels were significantly correlated with TNM stage and tumour invasion depth (P < 0.05) (Table 2).
 |
Table 2 Clinical and Demographic Characteristics of Patients with Colorectal Carcinoma in the CMU |
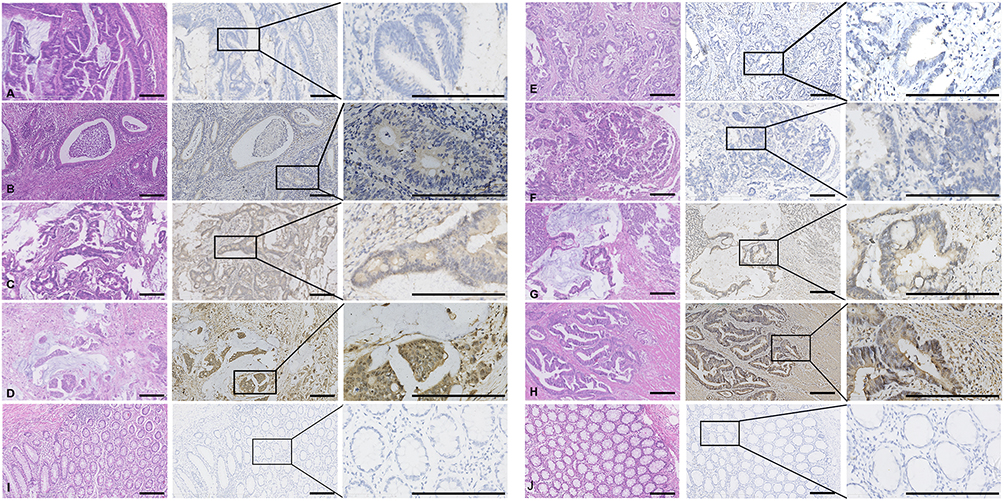 |
Figure 6 Representative immunohistochemical staining of colon cancer sections Representative photomicrographs of colon cancer sections with (A) SREBF2 score = 0, (B) SREBF2 score = 1, (C) SREBF2 score = 2, and (D) SREBF2 score = 3. Representative photomicrographs of colon cancer sections with (E) DHCR7 score = 0, (F) DHCR7 score = 1, (G) DHCR7 score = 2, and (H) DHCR7 score = 3. Immunohistochemical staining of (I) SREBF2 and (J) DHCR7 in normal tissues. Scale bar, 200 μm. |
Survival Analysis in Relation to DHCR7 Expression in the CMU Cohort
We further explored the influence of DHCR7 expression level, detected by immunohistochemistry, on patient prognosis in our cohort using Cox risk ratio regression and Kaplan‒Meier curve analysis. Kaplan‒Meier curves showed that high DHCR7 expression was associated with a poorer prognosis than low DHCR7 expression (Figure 7A). Univariable Cox risk regression analysis identified a significant correlation between DHCR7 expression and overall survival (hazard ratio [HR] = 5.580, P < 0.001), which was confirmed by multivariable Cox risk regression analysis (HR = 4.639, P < 0.001) (Figure 7B). This result confirmed our hypothesis that DHCR7 is a risk factor for colon cancer.
 |
Figure 7 Survival analysis in relation to high and low expression of DHCR7 determined by immunohistochemistry in the CMU cohort (A) Kaplan‒Meier survival curves for DHCR7. (B) Univariable and multivariable analyses of factors associated with overall survival. |
Discussion
The role of lipids in tumour occurrence and development has recently been the focus of increased attention. Lipids act as important carriers for energy storage and metabolism, and in addition to glycolysis, tumour cells use energy provided by lipid metabolism to maintain their malignant proliferation. Lipids are also important components of the cell membrane structure and biological signalling molecules, and tumour cells can promote their escape and dissemination by regulating lipid metabolism.38 Some studies found that cancer cell growth was inhibited by the inhibition of fatty acid synthase activity.39 These results suggest that interventions targeting lipid metabolism may provide new opportunities for tumour treatment. Fatty acid synthesis is mainly regulated by SREBPs, including SREBP1a, SREBP1c, and SREBP2. SREBP1a and SREBP1c mainly regulate the expression of enzymes related to fatty acid, triglyceride, and glucose metabolism, while SREBP2 mainly regulates cholesterol metabolism. SREBPs are also involved in endoplasmic reticulum stress, inflammation, autophagy, and apoptosis, which are closely related to obesity, dyslipidaemia, and cancer.40 SREBP-mediated lipogenesis was shown to affect the growth and metastasis of colon cancer,41 and inhibiting the activation of SREBP2-dependent cholesterol biosynthesis reduced the metastasis of colorectal cancer.42 However, although numerous studies have investigated the SREBP transcription factor family, its mechanism in human colon cancer remains unclear because of its numerous regulatory pathways. We therefore used machine learning and bioinformatics methods to screen for SREBF2-related lipid metabolism hub genes and to explore the role of these genes in the diagnosis and prognosis of colon cancer.
We identified lipid metabolism genes related to SREBF2 from the lipid metabolism pathway gene set and screened for hub genes using four machine learning algorithms. The SVM model was identified as the best screening model, and three hub genes, DHCR7, HSD11B2, and RGL1, were identified according to their gene importance scores. We then generated a nomogram for the diagnosis of colon cancer based on these three hub genes. Correction and decision curve analyses showed excellent diagnostic performance of the model in the GEO cohort, and this was validated in the TCGA cohort, indicating the reliability of the model. Comparing the expression levels of DHCR7, HSD11B2, and RGL1 showed that DHCR7 was significantly upregulated, while HSD11B2 and RGL1 were significantly downregulated in tumour samples compared with normal tissue samples, suggesting that DHCR7 might be a risk factor for colon cancer. Because the DHCR7 gene ranked first in the four algorithms, we further explored and verified its role in colon cancer. The relationship between DHCR7 and SREBF2 is still unclear. We predicted the target gene of SREBF2 using the GTRD and hTFtarget gene databases, which predicted DHCR7 as a downstream target gene of SREBF2. In addition, analysis of cell lines with SREBF2 gene knockdown in the GPSAdb website showed that DHCR7 was significantly downregulated after SREBF2 knockdown.43 We also found significant positive correlations between SREBF2 and DHCR7 expression in 33 TCGA pancancer samples, indicating an obvious regulatory relationship between SREBF2 and DHCR7. Cholesterol synthesis is regulated by the key transcription factor SREBF2 and the downstream genes 3-hydroxy-3-methylglutaryl coenzyme A reductase, 3-hydroxy-3-methylglutaryl coenzyme A synthase 1, and squalene synthase.44 DHCR7 plays an important role in the maintenance and turnover of physiological cholesterol during the final step in cholesterol biosynthesis. In addition, SREBP1 and SREBP2 binding sites have been identified in the promoter region of DHCR7.45,46 We therefore speculated that DHCR7 might be the downstream target gene of SREBF2.
In addition to changes in lipid metabolism in tumour cells, changes in lipid metabolism in the tumour microenvironment may affect the distribution of infiltrating immune cells. We evaluated the abundances of infiltrating immune cells in the GEO and TCGA cohorts using CIBERSORT and revealed the association between DHCR7 expression and immune cell infiltration in colon cancer by Spearman correlation analysis. The results showed that the levels of both M0 and M1 macrophages were significantly increased, while the levels of M2 macrophages were decreased in colon cancer. Correlation analysis also showed that DHCR7 expression was positively correlated with the abundance of M0 and M1 macrophages and inversely correlated with the abundance of M2 macrophages. Interestingly, Gerrick et al found that DHCR7 was an important regulatory factor of M2 macrophages: knockdown of DHCR7 did not affect the expression of M2 cell surface markers but significantly reduced the secretion of interleukin (IL)-10 and T-cell receptor alpha constant, which are the main cytokines involved in M2 function.47 Goossens et al demonstrated that increased cholesterol efflux in tumour-associated macrophages could enhance tumour-related functions, which was in turn related to the increase in IL-4 levels and inhibition of interferon-γ.48,49 Based on this abnormal phenomenon, we speculated that the excessive deposition of lipids in the tumour microenvironment might counteract the effect of DHCR7 and promote the polarization of macrophages to the M1 phenotype.50 Apoptosis of adipocytes in the tumour microenvironment initiates the infiltration of macrophages, while living adipocytes maintain a proinflammatory response, thereby promoting the polarization of macrophages from an M2 to an M1 phenotype.51 In addition, the early-stage tumour microenvironment is characterized by M1 macrophage infiltration, and metabolic reprogramming of tumour cells results in changes in the tumour microenvironment, thus affecting the composition and function of immune cells.52,53 Finally, validation in the CMU cohort showed that DHCR7 was highly expressed in tumour tissues, and high expression levels were significantly correlated with tumour TNM stage. Kaplan‒Meier survival curves and univariable and multivariable analyses also showed that patients with high expression of DHCR7 had a poorer prognosis than those with lower expression levels. In addition, Zou et al showed that high expression of DHCR7 in cervical cancer may indicate a poor prognosis.54 The current results thus suggest that DHCR7 may be a downstream target gene of SREBF2 and may affect the development and progression of colon cancer by regulating cholesterol metabolism and participating in immune-related pathways. AY 9944 and tamoxifen are two drugs that may be related to SREBF2-mediated regulation of cholesterol metabolism. AY 9944 is a specific inhibitor of cholesterol biosynthesis that inhibits the activity of the DHCR7 enzyme, causing cholesterol deficiency and accumulation of 7DHC. Additionally, at high doses, AY 9944 can inhibit the activity of sterol Δ7-Δ8 isomerase, leading to the accumulation of cholesterol 8-en-3β-ol.55 Tamoxifen is a selective oestrogen receptor modulator that blocks the action of oestrogen in breast cancer cells and activates oestrogen activity in other cells. Tamoxifen can also serve as an effective Hsp90 activator, enhancing the activity of the Hsp90 molecular chaperone ATPase. Moreover, tamoxifen can bind with high affinity to the antiestrogen binding site AEBS (a heterooligomeric complex consisting of D8D7I and DHCR7). Therefore, researchers can further explore the potential roles of these drugs in SREBF2-regulated cholesterol metabolism and colon cancer therapy.
The current study had some limitations. Although we speculated that DHCR7 may be a downstream target gene of SREBF2, further studies are needed to verify this hypothesis. In addition, we did not stratify patients according to TNM stage and were unable to determine differences in DHCR7 expression between early-, middle-, and late-stage colon cancer.
Conclusion
In summary, we analysed the expression of DHCR7, a lipid metabolism gene related to SREBF2, by machine learning. DHCR7 may be a useful diagnostic biomarker for colon cancer, and high expression of DHCR7 may indicate a poor prognosis in patients with colon cancer.
Data Sharing Statement
The GEO and TCGA datasets used in this study can be found at http://www.ncbi.nlm.nih.gov/geo/ and https://portal.gdc.cancer.gov/.
Ethics Approval and Informed Consent
The study received ethics approval from the Medical Ethics Committee of the First Hospital of China Medical University (Reference No. 2022157). All procedures involving human individuals in our study were performed in accordance with the Declaration of Helsinki. Informed consent was sought and acquired from all patients before the colon cancer specimens were obtained.
Acknowledgments
The authors thank Dr. Shipeng Guo (M.D.) and the team for providing the web resource GPSAdb (http://guotosky.vip:13838/GPSA/).
Funding
This work was supported by the Social Development Program from Shenyang Science and Technology Bureau, China (No. F20-205-4-033).
Disclosure
The authors report no conflicts of interest in this work.
References
1. Bray F, Ferlay J, Soerjomataram I, Siegel RL, Torre LA, Jemal A. Global cancer statistics 2018: GLOBOCAN estimates of incidence and mortality worldwide for 36 cancers in 185 countries. CA Cancer J Clin. 2018;68(6):394–424. doi:10.3322/caac.21492
2. Arnold M, Sierra MS, Laversanne M, Soerjomataram I, Jemal A, Bray F. Global patterns and trends in colorectal cancer incidence and mortality. Gut. 2017;66(4):683–691. doi:10.1136/gutjnl-2015-310912
3. Dekker E, Tanis PJ, Vleugels JLA, Kasi PM, Wallace MB. Colorectal cancer. Lancet. 2019;394(10207):1467–1480. doi:10.1016/S0140-6736(19)32319-0
4. Medema JP. Cancer stem cells: the challenges ahead. Nat Cell Biol. 2013;15(4):338–344. doi:10.1038/ncb2717
5. Nassar D, Blanpain C. Cancer Stem Cells: basic Concepts and Therapeutic Implications. Annu Rev Pathol. 2016;11(1):47–76. doi:10.1146/annurev-pathol-012615-044438
6. Röhrig F, Schulze A. The multifaceted roles of fatty acid synthesis in cancer. Nat Rev Canc. 2016;16(11): 732–749 doi:10.1038/nrc.2016.89.
7. Bian X, Liu R, Meng Y, Xing D, Xu D, Lu Z. Lipid metabolism and cancer. J Exp Med. 2021;218(1): 2610–23 doi:10.1084/jem.20201606.
8. Pascual G, Avgustinova A, Mejetta S, et al. Targeting metastasis-initiating cells through the fatty acid receptor CD36. Nature. 2017;541(7635):41–45. doi:10.1038/nature20791
9. Yang P, Su C, Luo X, et al. Dietary oleic acid-induced CD36 promotes cervical cancer cell growth and metastasis via up-regulation Src/ERK pathway. Cancer Lett. 2018;438:76–85 doi:10.1016/j.canlet.2018.09.006.
10. Jiang M, Wu N, Xu B, et al. Fatty acid-induced CD36 expression via O-GlcNAcylation drives gastric cancer metastasis. Theranostics. 2019;9(18):5359–5373. doi:10.7150/thno.34024
11. Chin K, DeVries S, Fridlyand J, et al. Genomic and transcriptional aberrations linked to breast cancer pathophysiologies. Canc Cell. 2006;10(6):529–541. doi:10.1016/j.ccr.2006.10.009
12. Brown MS, Goldstein JL. The SREBP pathway: regulation of cholesterol metabolism by proteolysis of a membrane-bound transcription factor. Cell. 1997;89(3):331–340. doi:10.1016/S0092-8674(00)80213-5
13. Griffiths B, Lewis CA, Bensaad K, et al. Sterol regulatory element binding protein-dependent regulation of lipid synthesis supports cell survival and tumor growth. Canc Metab. 2013;1(1):3. doi:10.1186/2049-3002-1-3
14. Xue L, Qi H, Zhang H, et al. Targeting SREBP-2-regulated mevalonate metabolism for cancer therapy. Front Oncol. 2020;10:1510. doi:10.3389/fonc.2020.01510
15. Li X, Wu JB, Li Q, Shigemura K, Chung LWK, Huang W-C. SREBP-2 promotes stem cell-like properties and metastasis by transcriptional activation of c-Myc in prostate cancer. Oncotarget. 2016;7(11):12869 doi:10.18632/oncotarget.7331.
16. Jie Z, Xie Z, Xu W, et al. SREBP-2 aggravates breast cancer associated osteolysis by promoting osteoclastogenesis and breast cancer metastasis. Biochim Biophys Acta Mol Basis Dis. 2019;1865(1):115–125. doi:10.1016/j.bbadis.2018.10.026
17. Armengol S, Arretxe E, Enzunza L, et al. SREBP-2-driven transcriptional activation of human SND1 oncogene. Oncotarget. 2017;8(64):108181–108194. doi:10.18632/oncotarget.22569
18. Prabhu AV, Luu W, Li D, Sharpe LJ, Brown AJ. DHCR7: a vital enzyme switch between cholesterol and vitamin D production. Prog Lipid Res. 2016;64:138–151. doi:10.1016/j.plipres.2016.09.003
19. Korade Z, Heffer M, Mirnics K. Medication effects on developmental sterol biosynthesis. Mol Psychiatry. 2022;27(1):490–501. doi:10.1038/s41380-021-01074-5
20. Silvente-Poirot S, Poirot M. Cholesterol epoxide hydrolase and cancer. Curr Opin Pharmacol. 2012;12(6):696–703. doi:10.1016/j.coph.2012.07.007
21. DeBarber AE, Eroglu Y, Merkens LS, Pappu AS, Steiner RD. Smith-Lemli-Opitz syndrome. Expert Rev Mol Med. 2011;13:e24. doi:10.1017/S146239941100189X
22. Ong J-S, Cuellar-Partida G, Lu Y, et al. Association of vitamin D levels and risk of ovarian cancer: a Mendelian randomization study. Int J Epidemiol. 2016;45(5):1619–1630. doi:10.1093/ije/dyw207
23. Winsløw UC, Nordestgaard BG, Afzal S. High plasma 25-hydroxyvitamin D and high risk of nonmelanoma skin cancer: a Mendelian randomization study of 97 849 individuals. Br J Dermatol. 2018;178(6):1388–1395. doi:10.1111/bjd.16127
24. Chen Y, Yan W, Yang K, et al. Integrated multi-dimensional analysis highlights DHCR7 mutations involving in cholesterol biosynthesis and contributing therapy of gastric cancer. J Exp Clin Cancer Res. 2023;42(1):36. doi:10.1186/s13046-023-02611-6
25. Li Y, Zhou Y, Huang M, et al. DHCR7 promotes tumorigenesis via activating PI3K/AKT/mTOR signalling pathway in bladder cancer. Cell Signal. 2023;102:110553. doi:10.1016/j.cellsig.2022.110553
26. Weitz J, Koch M, Debus J, Höhler T, Galle PR, Büchler MW. Colorectal cancer. Lancet. 2005;365(9454):153–165. doi:10.1016/S0140-6736(05)17706-X
27. Shehab M, Abualigah L, Shambour Q, et al. Machine learning in medical applications: a review of state-of-The-art methods. Comput Biol Med. 2022;145(145):105458. doi:10.1016/j.compbiomed.2022.105458
28. Su Y, Tian X, Gao R, et al. Colon cancer diagnosis and staging classification based on machine learning and bioinformatics analysis. Comput Biol Med. 2022;145:105409. doi:10.1016/j.compbiomed.2022.105409
29. Jiang X, Tan J, Li J, et al. DACT3 is an epigenetic regulator of Wnt/beta-catenin signaling in colorectal cancer and is a therapeutic target of histone modifications. Canc Cell. 2008;13(6):529–541. doi:10.1016/j.ccr.2008.04.019
30. Chen M-S, Y-H L, Chen X, et al. growth factor-independent 1 is a tumor suppressor gene in colorectal cancer. Mol Cancer Res. 2019;17(3):697–708. doi:10.1158/1541-7786.MCR-18-0666
31. Tsukamoto S, Ishikawa T, Iida S, et al. Clinical significance of osteoprotegerin expression in human colorectal cancer. Clin Cancer Res. 2011;17(8):2444–2450. doi:10.1158/1078-0432.CCR-10-2884
32. Lin G, He X, Ji H, Shi L, Davis RW, Zhong S. Reproducibility Probability Score--incorporating measurement variability across laboratories for gene selection. Nat Biotechnol. 2006;24(12):1476–1477. doi:10.1038/nbt1206-1476
33. Ryan BM, Zanetti KA, Robles AI, et al. Germline variation in NCF4, an innate immunity gene, is associated with an increased risk of colorectal cancer. Int, J, Cancer. 2014;134(6):1399–1407. doi:10.1002/ijc.28457
34. Vlachavas E-I, Pilalis E, Papadodima O, et al. radiogenomic analysis of f-18-fluorodeoxyglucose positron emission tomography and gene expression data elucidates the epidemiological complexity of colorectal cancer landscape. Comput Struct Biotechnol J. 2019;17:177–185. doi:10.1016/j.csbj.2019.01.007
35. Leek JT. svaseq: removing batch effects and other unwanted noise from sequencing data. Nucleic Acids Res. 2014;42(21):e161–e161. doi:10.1093/nar/gku864
36. Ritchie ME, Phipson B, Wu D, et al. limma powers differential expression analyses for RNA-sequencing and microarray studies. Nucleic Acids Res. 2015;43(7):e47–e47. doi:10.1093/nar/gkv007
37. Guo S, Xu Z, Dong X, et al. GPSAdb: a comprehensive web resource for interactive exploration of genetic perturbation RNA-seq datasets. Nucleic Acids Res. 2023;51(D1):D964–D968. doi:10.1093/nar/gkac1066
38. Martin-Perez M, Urdiroz-Urricelqui U, Bigas C, Benitah SA. The role of lipids in cancer progression and metastasis. Cell Metab. 2022;34(11):1675–1699. doi:10.1016/j.cmet.2022.09.023
39. Currie E, Schulze A, Zechner R, Walther TC, Farese RV. Cellular fatty acid metabolism and cancer. Cell Metab. 2013;18(2):153–161. doi:10.1016/j.cmet.2013.05.017
40. Shimano H, Sato R. SREBP-regulated lipid metabolism: convergent physiology - divergent pathophysiology. Nat Rev Endocrinol. 2017;13(12):710–730. doi:10.1038/nrendo.2017.91
41. Bengoechea-Alonso MT, Ericsson J. SREBP in signal transduction: cholesterol metabolism and beyond. Curr Opin Cell Biol. 2007;19(2):215–222. doi:10.1016/j.ceb.2007.02.004
42. Zhang K-L, Zhu -W-W, Wang S-H, et al. Organ-specific cholesterol metabolic aberration fuels liver metastasis of colorectal cancer. Theranostics. 2021;11(13):6560–6572. doi:10.7150/thno.55609
43. York AG, Williams KJ, Argus JP, et al. limiting cholesterol biosynthetic flux spontaneously engages type i ifn signaling. Cell. 2015;163(7):1716–1729. doi:10.1016/j.cell.2015.11.045
44. Li X, Roberti R, Blobel G. Structure of an integral membrane sterol reductase from Methylomicrobium alcaliphilum. Nature. 2015;517(7532):104–107. doi:10.1038/nature13797
45. Kim JH, Lee JN, Paik YK. Cholesterol biosynthesis from lanosterol. A concerted role for Sp1 and NF-Y-binding sites for sterol-mediated regulation of rat 7-dehydrocholesterol reductase gene expression. J Biol Chem. 2001;276(21):18153–18160. doi:10.1074/jbc.M101661200
46. Prabhu AV, Sharpe LJ, Brown AJ. The sterol-based transcriptional control of human 7-dehydrocholesterol reductase (DHCR7): evidence of a cooperative regulatory program in cholesterol synthesis. Biochim Biophys Acta. 2014;1842(10):1431–1439. doi:10.1016/j.bbalip.2014.07.006
47. Gerrick KY, Gerrick ER, Gupta A, Wheelan SJ, Yegnasubramanian S, Jaffee EM. Transcriptional profiling identifies novel regulators of macrophage polarization. PLoS One. 2018;13(12):e0208602. doi:10.1371/journal.pone.0208602
48. Goossens P, Rodriguez-Vita J, Etzerodt A, et al. Membrane cholesterol efflux drives tumor-associated macrophage reprogramming and tumor progression. Cell Metab. 2019;29(6):1376–1389.e4. doi:10.1016/j.cmet.2019.02.016
49. Ma K, Zhang L. Overview: lipid metabolism in the tumor microenvironment. Adv Exp Med Biol. 2021;1316:41–47 doi:10.1084/jem.20201606.
50. Prieur X, Mok CYL, Velagapudi VR, et al. Differential lipid partitioning between adipocytes and tissue macrophages modulates macrophage lipotoxicity and M2/M1 polarization in obese mice. Diabetes. 2011;60(3):797–809. doi:10.2337/db10-0705
51. Fischer-Posovszky P, Wang QA, Asterholm IW, Rutkowski JM, Scherer PE. Targeted deletion of adipocytes by apoptosis leads to adipose tissue recruitment of alternatively activated M2 macrophages. Endocrinology. 2011;152(8):3074–3081. doi:10.1210/en.2011-1031
52. Mantovani A, Allavena P, Marchesi F, Garlanda C. Macrophages as tools and targets in cancer therapy. Nat Rev Drug Discov. 2022;21(11):799–820. doi:10.1038/s41573-022-00520-5
53. Peña-Romero AC, Orenes-Piñero E. dual effect of immune cells within tumour microenvironment: pro- and anti-tumour effects and their triggers. Cancers. 2022;14(7):1681. doi:10.3390/cancers14071681
54. Zou J, Liu S, Long J, Yan B. High DHCR7 expression predicts poor prognosis for cervical cancer. Comput Math Methods Med. 2022;2022:8383885. doi:10.1155/2022/8383885
55. Xiao J, Li W, Zheng X, et al. Targeting 7-dehydrocholesterol reductase integrates cholesterol metabolism and IRF3 activation to eliminate infection. Immunity. 2020;52(1):109–122.e6. doi:10.1016/j.immuni.2019.11.015
 © 2023 The Author(s). This work is published and licensed by Dove Medical Press Limited. The
full terms of this license are available at https://www.dovepress.com/terms
and incorporate the Creative Commons Attribution
- Non Commercial (unported, 3.0) License.
By accessing the work you hereby accept the Terms. Non-commercial uses of the work are permitted
without any further permission from Dove Medical Press Limited, provided the work is properly
attributed. For permission for commercial use of this work, please see paragraphs 4.2 and 5 of our Terms.
© 2023 The Author(s). This work is published and licensed by Dove Medical Press Limited. The
full terms of this license are available at https://www.dovepress.com/terms
and incorporate the Creative Commons Attribution
- Non Commercial (unported, 3.0) License.
By accessing the work you hereby accept the Terms. Non-commercial uses of the work are permitted
without any further permission from Dove Medical Press Limited, provided the work is properly
attributed. For permission for commercial use of this work, please see paragraphs 4.2 and 5 of our Terms.