")
Back to Journals » International Journal of Chronic Obstructive Pulmonary Disease » Volume 16
Intramuscular and Intermuscular Abdominal Fat Infiltration in COPD: A Propensity Score Matched Study
Authors Jeon YJ , Han S, Park GM, Lee TY , Park SE, Lee H, Kang BJ
Received 26 March 2021
Accepted for publication 16 June 2021
Published 5 July 2021 Volume 2021:16 Pages 1989—1999
DOI https://doi.org/10.2147/COPD.S312888
Checked for plagiarism Yes
Review by Single anonymous peer review
Peer reviewer comments 3
Editor who approved publication: Dr Richard Russell
Young-Jee Jeon,1,* Sangyoung Han,2,* Gyung-Min Park,2 Tae Young Lee,3 Soon Eun Park,4 Hyunho Lee,4 Byung Ju Kang2
1Department of Family Medicine, Ulsan University Hospital, University of Ulsan College of Medicine, Ulsan, Republic of Korea; 2Department of Internal Medicine, Ulsan University Hospital, University of Ulsan College of Medicine, Ulsan, Republic of Korea; 3Department of Radiology, Ulsan University Hospital, University of Ulsan College of Medicine, Ulsan, Republic of Korea; 4Department of Anesthesiology and Pain Medicine, Ulsan University Hospital, University of Ulsan College of Medicine, Ulsan, Republic of Korea
*These authors contributed equally to this work
Correspondence: Byung Ju Kang
Department of Internal Medicine, Ulsan University Hospital, University of Ulsan, College of Medicine, 877, Bangeojinsunhwando-ro, Dong-gu, Ulsan, 44033, Republic of Korea
Tel +82-52-250-8870
Fax +82-52-250-8997
Email [email protected]
Purpose: Low-attenuation muscle area (LAMA) and normal-attenuation muscle area (NAMA) indicate lipid-rich and lipid-poor skeletal muscle areas, respectively. Additionally, intermuscular adipose tissue (IMAT) indicates localized fat between muscle groups. In this study, we aimed to evaluate the intramuscular and intermuscular fat infiltration in individuals with chronic obstructive pulmonary disease (COPD) by performing quantitative assessment of the LAMA, NAMA, and IMAT observed on abdominopelvic computed tomography (APCT) images.
Patients and Methods: We performed a cross-sectional study using data of subjects who underwent a general health examination with APCT at Ulsan University Hospital between March 2014 and June 2019. We classified the subjects into control and COPD groups based on age, smoking history, and pulmonary function results. We compared the attenuation and body mass index adjusted area of intra-abdominal components between the two groups using propensity score matching. We also evaluated these outcomes in COPD subgroups (mild and moderate stage subjects).
Results: Overall, 6,965 subjects were initially enrolled, and 250 pairs of control and COPD subjects were selected after propensity score matching. The NAMA attenuation (unstandardized β=− 1.168, P< 0.001) was lower, and the IMAT (unstandardized β=0.042, P=0.006) and LAMA (unstandardized β=0.120, P< 0.001) indexes were greater in the COPD group than in the control group. In subgroup analysis, those with mild and moderate COPD also had high IMAT (unstandardized β=0.037, P=0.009 and unstandardized β=0.045, P< 0.001) and LAMA (unstandardized β=0.089, P=0.002 and unstandardized β=0.147, P< 0.001) indexes compared to the control subjects. However, the NAMA attenuation (unstandardized β=− 1.075, P< 0.001) and NAMA index (unstandardized β=− 0.133, P=0.015) were significantly lower in moderate COPD subjects only.
Conclusion: Our study showed that intramuscular and intermuscular abdominal fat infiltration could be present in subjects with mild COPD, and it might be exacerbated in those with moderate COPD.
Keywords: abdominal fat, abdominal muscles, chronic obstructive pulmonary disease, computed tomography
Introduction
Chronic obstructive pulmonary disease (COPD) is a chronic inflammatory airway disease that causes incompletely reversible airflow limitation related with cough, sputum, and progressive dyspnea. Several studies have reported that an increase in muscle fat infiltration was observed in COPD patients related with systemic inflammation, metabolic diseases, and comorbidities.1–5 However, these studies simply evaluated the muscular fat infiltration based on the muscle attenuation value determined using computed tomography (CT); they did not fully adjust for the metabolic factors and comorbidities that influenced the body composition of the subjects.6
Body fat and muscle composition can be assessed using CT scans, which visualize fat and muscle areas based on attenuation values. Several studies reported that CT-based muscle mass and adipose tissue measurements were reliable for the quantitative assessment of body composition.7–9 Skeletal muscle areas can be divided into low attenuation muscle area (LAMA) and normal attenuation muscle area (NAMA) based on muscle attenuation values from the CT scans.10 LAMA is related with more intramuscular fat infiltration, and conversely NAMA is related with less intramuscular fat infiltration.11 Intermuscular adipose tissue (IMAT) is the fat beneath muscle fascia and between muscle groups; it reflects intermuscular fat infiltration.12 We can evaluate the intramuscular and intermuscular fatty infiltration through the quantitative assessment of LAMA, NAMA, and IMAT. In this study, we aimed to evaluate the intramuscular and intermuscular fatty infiltration in COPD subjects using the LAMA, NAMA, and IMAT after adjustment for the various confounding factors, including metabolic components and underlying diseases.
Patients and Methods
Study Design and Subjects
The present study was a cross-sectional study based on data collected from the health examination results of subjects who underwent self-referred abdominopelvic computed tomography (APCT) evaluation as part of a general health examination at the Health Promotion Center in Ulsan University Hospital, Ulsan, Korea, between March 2014 and June 2019. Among those with multiple health checkups, the first health examination was considered to be the index health examination and was used for data collection. We excluded individuals under 45 years of age and those who had missing data for their baseline characteristics.13,14 COPD subjects were identified based on smoking history (≥10 pack-years) and the ratio of the forced expiratory volume in the first 1 second (FEV1) to the forced vital capacity (FVC) (FEV1/FVC; < 0.7) criteria.15,16 The rest of the study population was defined as controls (Figure 1). Additionally, subjects in the COPD group were further classified into subgroups based on their FEV1 value (mild stage: FEV1 ≥ 80%; moderate stage: 50% ≤ FEV1 < 80%; severe stage: 30% ≤ FEV1 < 50%). The baseline characteristics and abdominal compositions for these different subgroups were evaluated. This study was approved by the Institutional Review Board of Ulsan University Hospital (No. 2020–08-013), which waived the requirement for informed consent requirement due to the anonymization of data and cross-sectional design of the study.
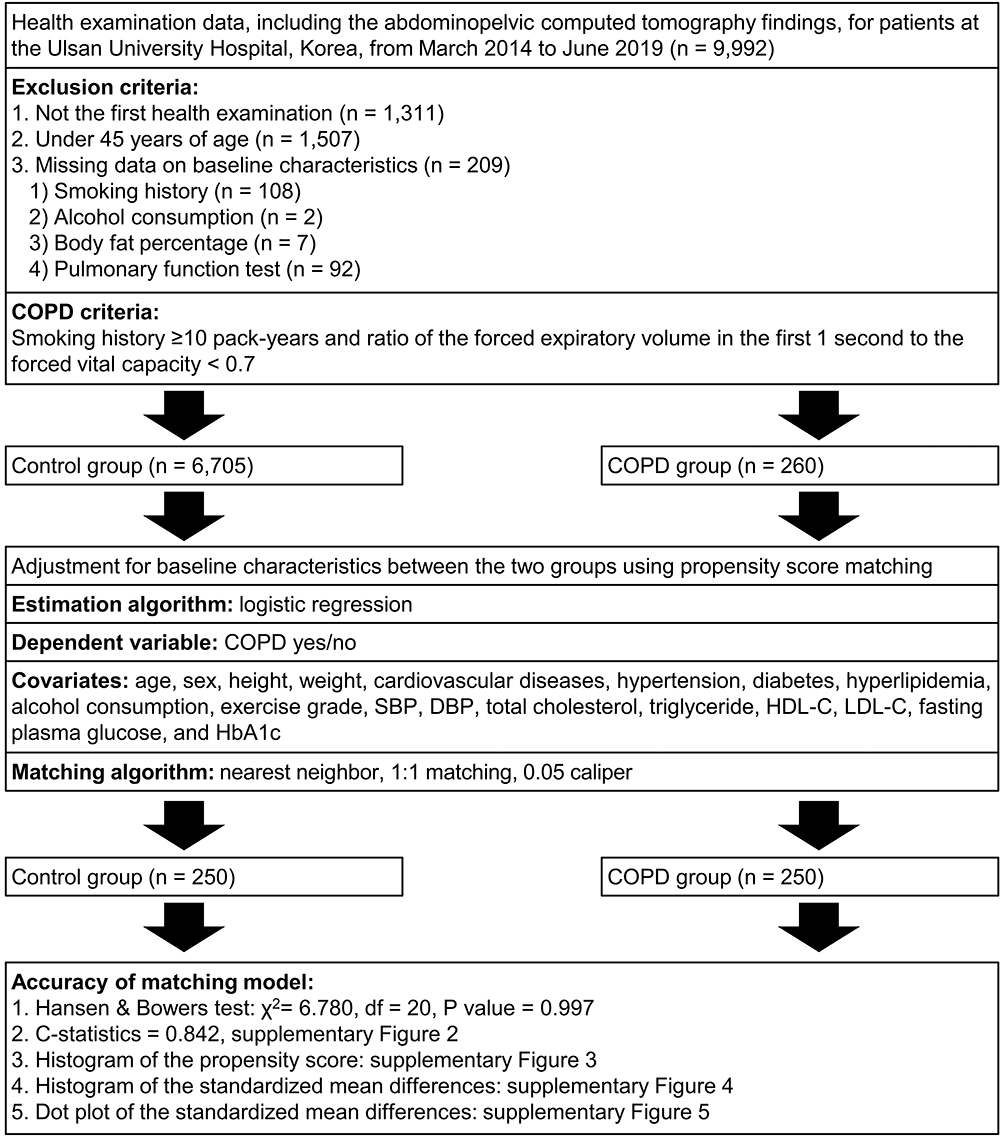 |
Figure 1 Distribution of the study subjects and propensity score matching. Abbreviations: COPD, chronic obstructive pulmonary disease; DBP, diastolic blood pressure; HbA1c, glycosylated hemoglobin; HDL-C, high-density lipoprotein cholesterol; LDL-C, low-density lipoprotein cholesterol; SBP, systolic blood pressure. |
Clinical and Laboratory Measurements
The clinical and laboratory information were collected from the clinical data warehouse platform in conjunction with the electronic medical records at the Ulsan University Hospital. The clinical information was obtained from a systemized self-report questionnaire (age, sex, smoking status, alcohol consumption, exercise grade, and underlying comorbidities including cardiovascular disease, hypertension, diabetes, and hyperlipidemia) issued before the health examination. Smoking status was classified as non-, ex-, or current smoking; alcohol consumption grade was determined according to the self-reported drinking (irrelevant to dose) frequency per week (none, 1–2 drinks/week, and ≥ 3 drinks/week); and exercise grade was determined according to the self-reported moderate to high-intensity exercise frequency per week (none, 1–2 sessions/week, and ≥ 3 sessions/week). Height and weight were measured in light clothing, without shoes, on a digital scale. Body mass index (BMI) was calculated as the subject’s weight in kilograms divided by the squared height in meters. Blood pressure was measured at the right upper arm in the sitting position after resting for longer than 5 minutes using an automatic manometer. A venous blood sample was taken from each subject’s antecubital vein in the early morning after overnight fasting and then analyzed in the central and certified laboratory of the Ulsan University Hospital. Laboratory information included total cholesterol, triglyceride, high-density lipoprotein cholesterol (HDL-C), low-density lipoprotein cholesterol (LDL-C), fasting plasma glucose, and glycosylated hemoglobin (HbA1c).
Pulmonary Function Tests
Spirometric testing was conducted by experienced pulmonary technicians using Vmax 2130 (Sensormedics, Yorba Linda, CA, USA) and Vmax Encore 20 (CareFusion Respiratory Care Inc., Yorba Linda, CA, USA) spirometers based on the recommendations of the American Thoracic Society/European Respiratory Society for standardization of spirometry.17 The collected spirometry parameters were FVC, FEV1, and FEV1/FVC. Predicted spirometry values (%) were calculated using a formula based on the pulmonary function test parameter scores of Korean representative samples with the same age, weight, and height.18
APCT Scan Technique
All study subjects received an abdominopelvic exam using the SOMATOM Definition FLASH CT scanner (Siemens Healthcare, Erlangen, Germany). The CT scanner had a single source helical scan, 128×0.6mm beam collimation, 0.6 pitch, and 100 kVp tube voltage dose modulation (CARE Dose4D, Siemens Medical Solutions, Erlangen, Germany). The gantry rotation time was 0.5 second, and the reconstructed slice thickness and increment were all 3mm. Enhanced CT images were acquired 80 second after intravenous injection of the contrast agent (Xenetix 350, Guerbet, Roissy, France) and the expiration of the breath-hold state.
CT-Based Body Composition Assessment
We analyzed the abdominal fat and muscle compositions presented by APCT using the Asan-J software, which was made on the basis of ImageJ (NIH, Bethesda, MD, USA).19,20 Asan-J software exhibits high performance and accuracy in the analysis of abdominal muscle and fat on CT images.21 In each subject, the average value of two consecutive axial CT images at the third lumbar vertebra level was analyzed for area and attenuation of all fat (subcutaneous, visceral and intermuscular) and muscles (psoas, quadratus lumborum, latissimus dorsi, erector spinae, external abdominal oblique, internal abdominal oblique, transversus abdominis, and rectus abdominis). We identified and quantified the LAMA, and NAMA based on threshold of −29 to +29, and +30 to +150 Hounsfield units (HU).10,22 We also outlined and measured the subcutaneous fat area (SFA), visceral fat area (VFA), and IMAT all based on the threshold of −190 to −30 HU21,23 (Figure S1). We adjusted the cross-sectional areas of fat and muscle to BMI (cm2/[kg/m2]) based on Foundation for the National Institutes of Health Sarcopenia Project recommendation, and described as SFA index (SFA [cm2]/BMI [kg/m2]), VFA index (VFA [cm2]/BMI [kg/m2]), IMAT index (IMAT [cm2]/BMI [kg/m2]), LAMA index (LAMA [cm2]/BMI [kg/m2]), and NAMA index (NAMA [cm2]/BMI [kg/m2]).24
Statistical Analysis
Continuous variables are reported as means ± standard deviation, and compared using the Student’s t-test for unmatched subjects and paired t-test for matched subjects. Categorical variables are reported as numbers (percentages) and compared using a chi-square test for unmatched subjects and the McNemar test (or marginal homogeneity test) for matched subjects.
To reduce the bias and potential confounding among subjects in the two study groups, we performed careful adjustment for different distributions of baseline characteristics using a 1:1 propensity score matching analysis with the nearest neighbor method based on a greedy matching algorithm that sorts based on the estimated propensity score (Figure 1). By configuring a caliper of 0.05 on the distance of the estimated propensity scores between the two pairs, we excluded the subjects who were not relevant to propensity score in further analyses. Propensity score matching was executed with a logistic regression and without a replacement algorithm until all possible matches had been built.
We matched the following variables for age, sex, height, weight, underlying comorbidities (cardiovascular diseases, hypertension, diabetes, and hyperlipidemia), lifestyle (alcohol consumption and exercise grade), and metabolic factors (systolic blood pressure, diastolic blood pressure, total cholesterol, triglyceride, HDL-C, LDL-C, fasting plasma glucose, and HbA1c). We also evaluated the adequacy of the matched model using a Hansen & Bowers test (χ2 = 6.780, df = 20, P value = 0.997), and by investigating the diagnostic plots before and after propensity score matching such as receiver operating characteristic curves (c-statistics = 0.842, Figure S2), histograms of the propensity score (Figure S3), histograms of the standardized mean differences (Figure S4), and dot plots of the standardized mean differences (Figure S5).
We evaluated the abdominal fat and muscle composition between the control and COPD groups using simple and multiple linear regression analyses. All baseline characteristics (except the smoking history and pulmonary function test results) with P values less than 0.1 in the simple linear regression analysis were included in the multiple linear regression analysis. Considering a logit link between the two propensity score matched pairs, we evaluated the risks of clinical end points by generalized estimating equations using a linear regression model. We also evaluated the body composition differences between the control and COPD subgroups. We excluded the subgroup with severe COPD due to the small number of subjects. Thereafter, simple and multiple linear regression analyses were conducted to compare the abdominal fat and muscle composition between the mild and moderate COPD subgroups to the control group. We investigated the variance inflation factor for all analyses to determine the multicollinearity.
Propensity score matching analysis was performed using the “psmatching” program (version 3.04) in conjunction with SPSS version 24.25 The program performs all analyses in R (version 3.2.0) through the IBM SPSS statistics Essentials for R as described by Thoemmes.26 Statistical analysis was performed using the IBM SPSS Statistics for Windows software (version 24.0; IBM Corporation, Armonk, New York, USA), and differences with a P value < 0.05 were considered statistically significant.
Results
Baseline Characteristics and Abdominal Body Composition of Study Subjects
During the study period, 6,965 subjects met the inclusion criteria. Among them, 6,705 (96.3%) and 260 (3.7%) individuals were classified into the control and COPD groups, respectively. The baseline characteristics and abdominal body composition results for study subjects before propensity score matching are presented in Table S1. After propensity score matching, we selected 250 pairs of subjects with similar baseline characteristics (Table 1), with the exception of smoking history (Table S2) and pulmonary function test results (Figure S6). Figure 2 shows the distribution of the individual mean value for attenuation and the BMI adjusted cross-sectional areas between the control and COPD groups after propensity score matching. The COPD group had significantly lower NAMA attenuation (58.6 ± 3.8 vs 57.4 ± 3.7 HU, P < 0.001), and a higher IMAT index (0.2 ± 0.2 vs 0.3 ± 0.2 cm2/[kg/m2], P = 0.007) and LAMA index (1.2 ± 0.4 vs 1.3 ± 0.4 cm2/[kg/m2], P = 0.001) compared with the control group.
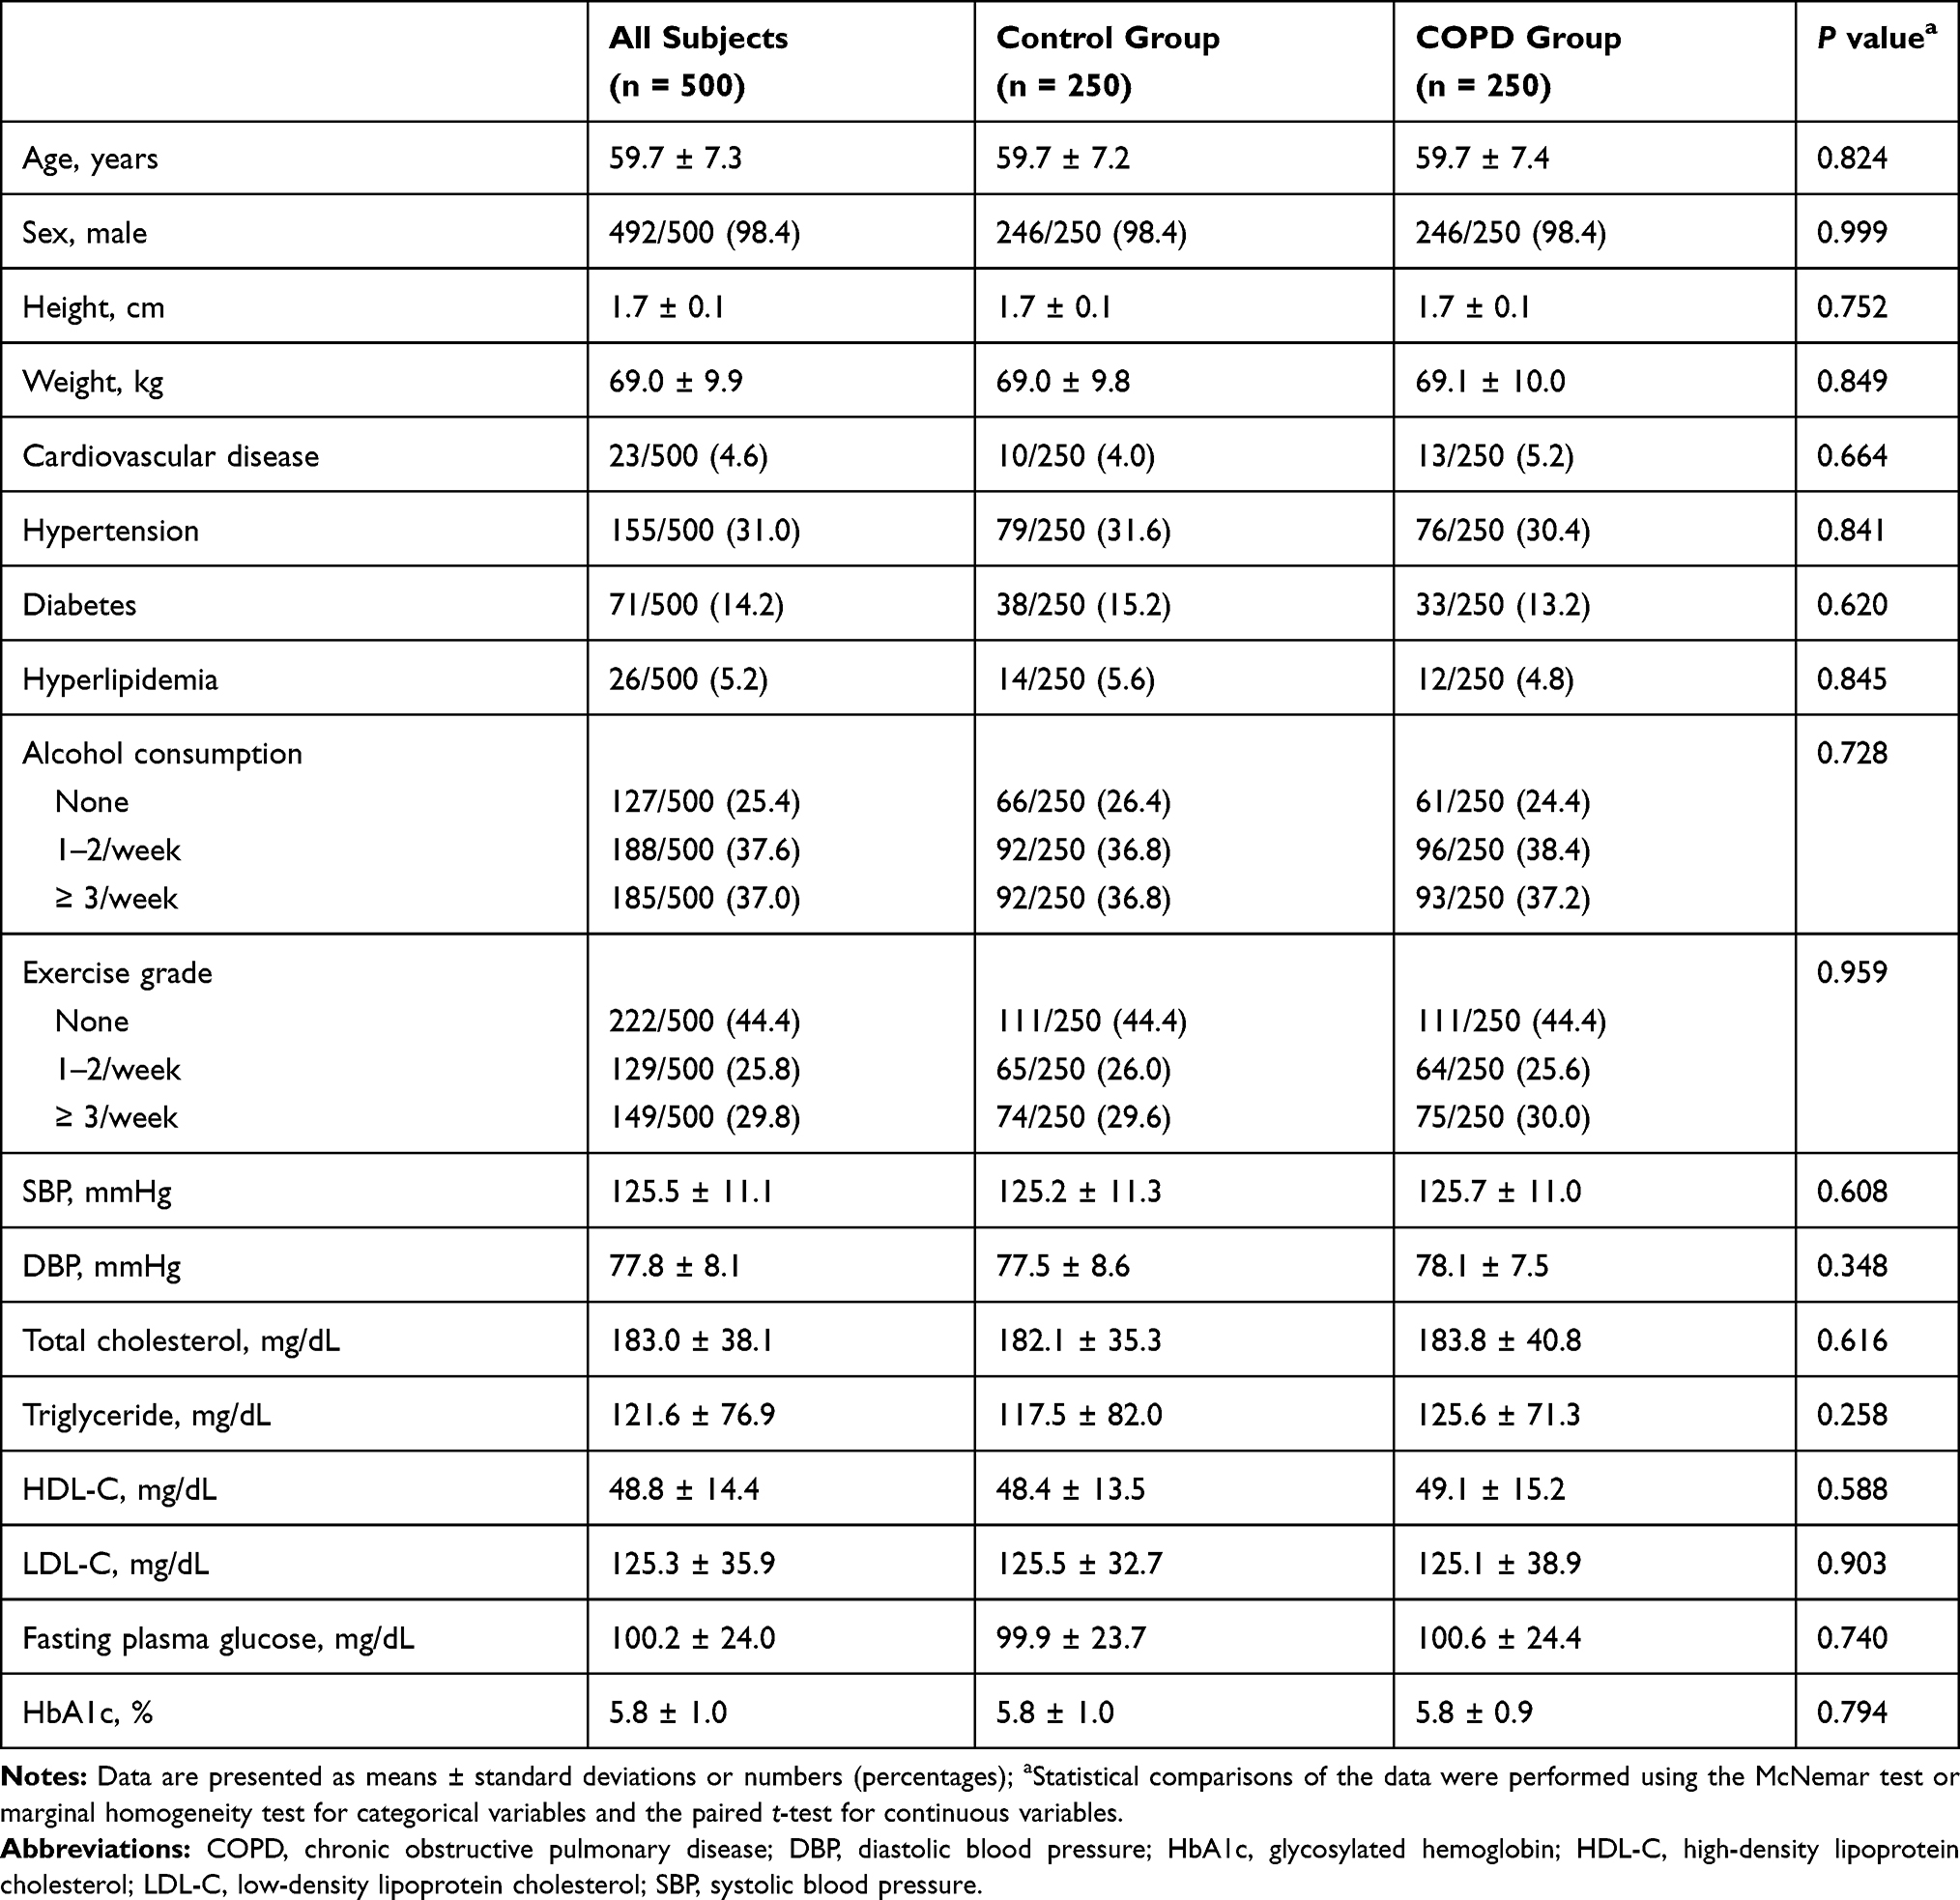 |
Table 1 Baseline Characteristics of the Study Subjects After Propensity Score Matching |
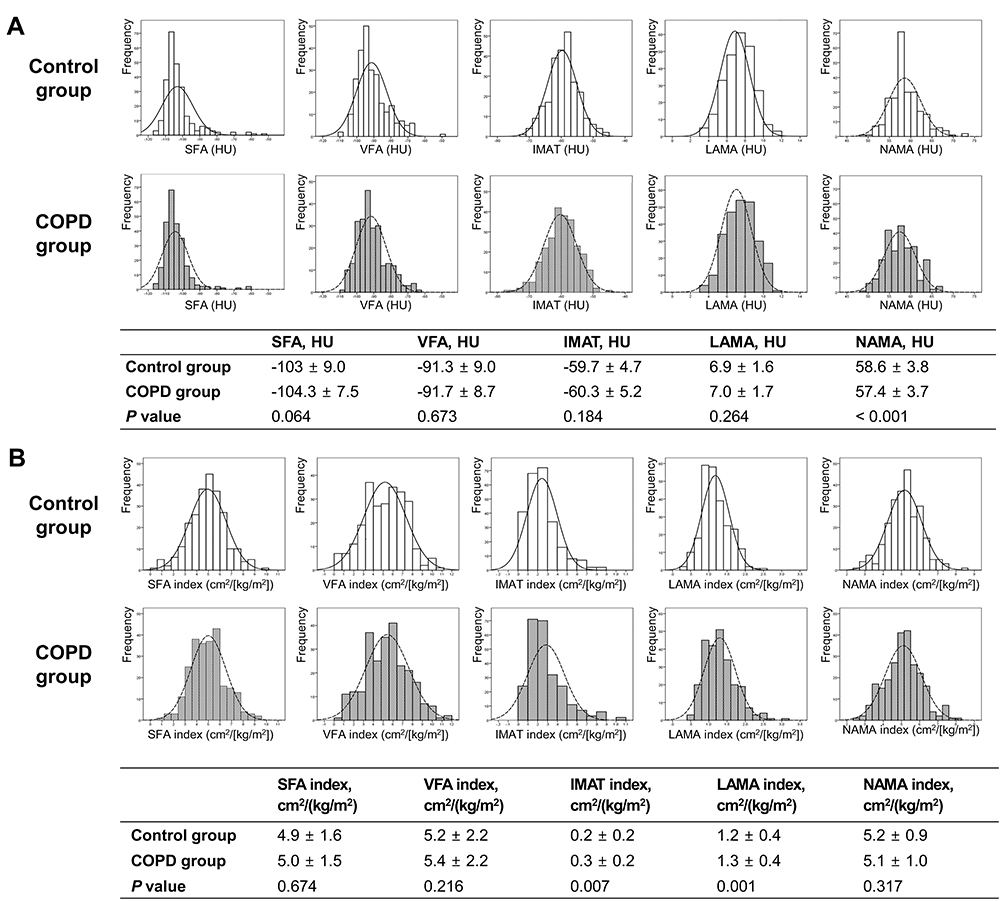 |
Figure 2 Distribution of the abdominal body compositions between the control and chronic obstructive pulmonary disease groups in the propensity score matching cohort. (A) Comparison of the attenuations for abdominal fat and muscle, (B) Comparison of the body mass index adjusted cross-sectional areas for abdominal fat and muscle. Abbreviations: COPD, chronic obstructive pulmonary; HU, Hounsfield units; IMAT, intermuscular adipose tissue; LAMA, low attenuation abdominal muscle area; NAMA, normal attenuation muscle area; SFA, subcutaneous fat area; VFA, visceral fat area. |
Propensity Score Adjusted and Matched Results
Upon conducting the multiple linear regression analyses using propensity score and variables with P values less than 0.1 from the simple linear regression, the COPD group had a significantly increased IMAT (unstandardized β = 0.040, P < 0.001) and LAMA indexes (unstandardized β = 0.113, P < 0.001) when compared with the control group. Additionally, the COPD group had a decreased NAMA attenuation (unstandardized β = −0.933, P < 0.001) compared with the control group. When we performed generalized estimating equations using the linear regression model for propensity score matched cases, the COPD group also had a significantly increased IMAT (unstandardized β = 0.042, P = 0.006) and LAMA indexes (unstandardized β = 0.120, P < 0.001), and a decreased NAMA attenuation (unstandardized β = −1.168, P < 0.001) compared with the control group (Table 2).
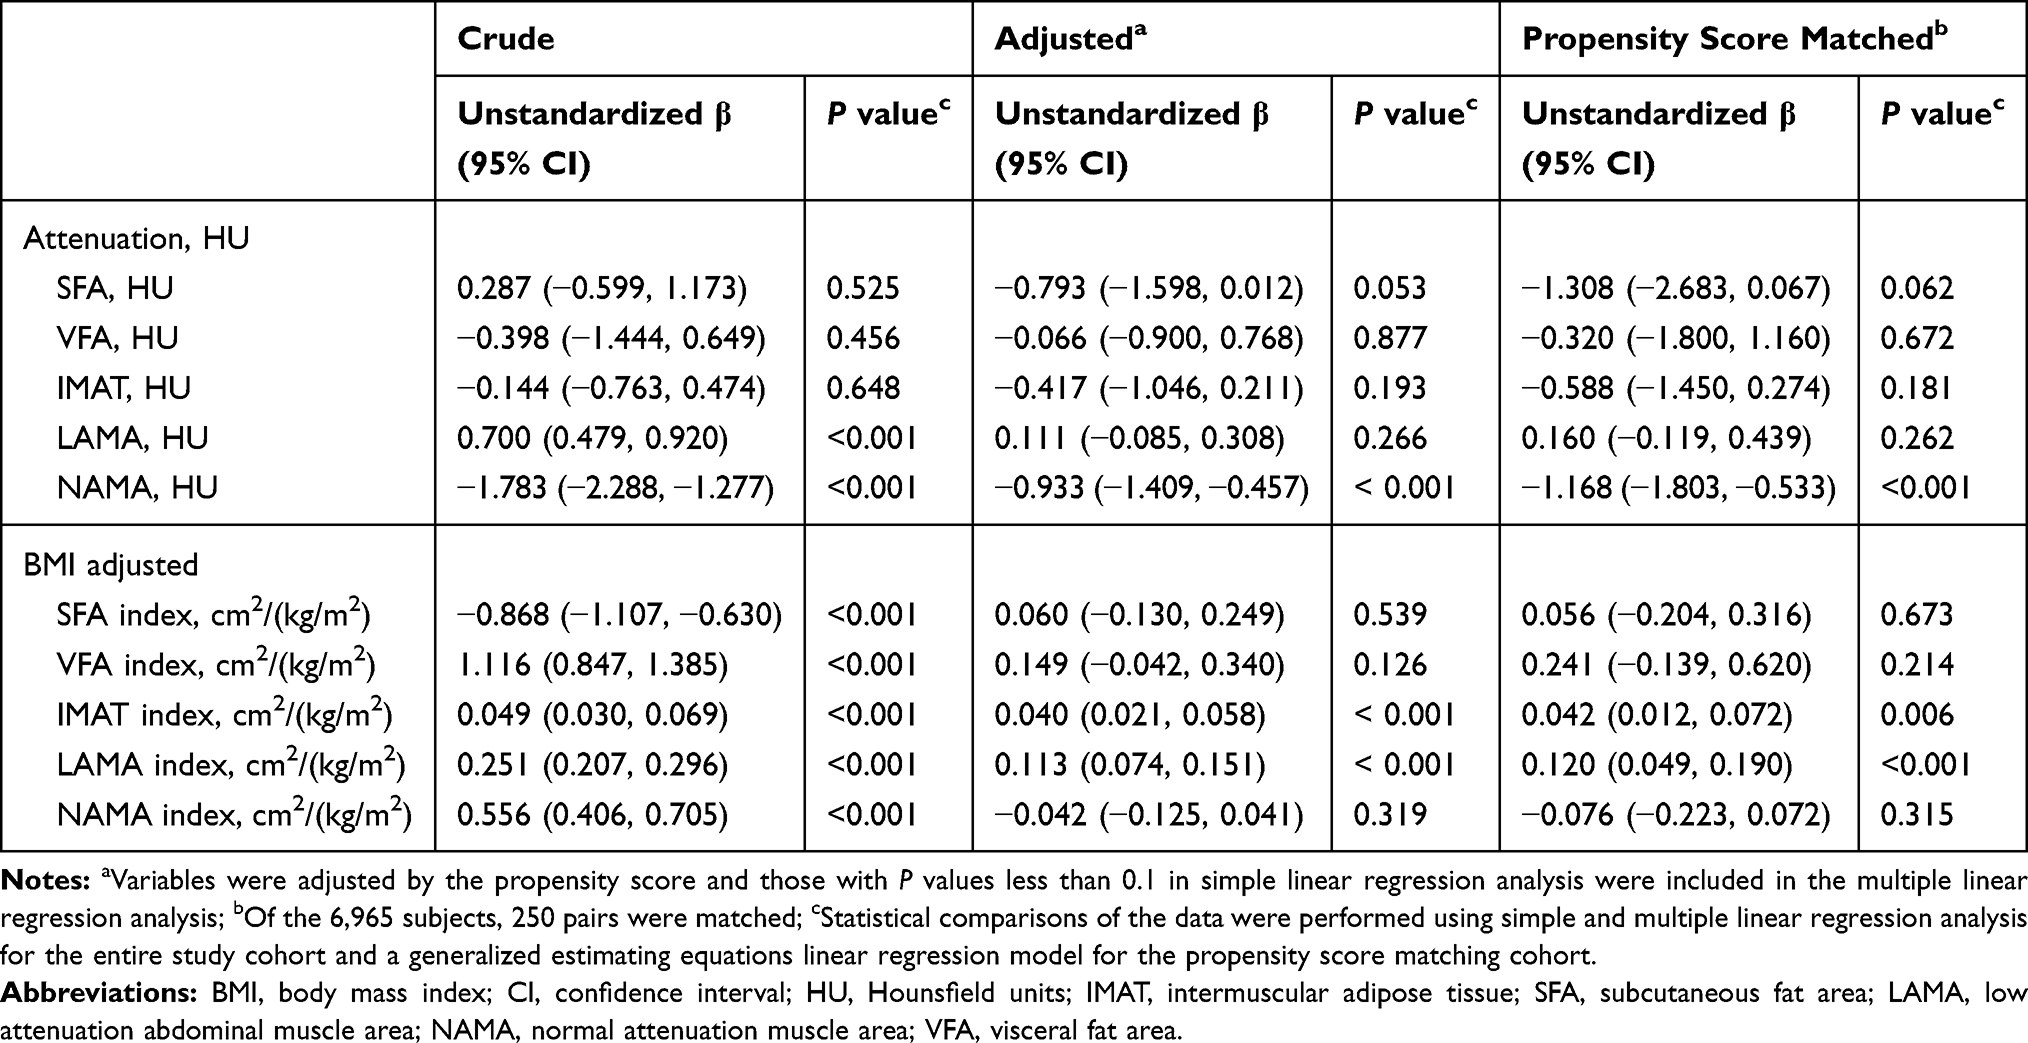 |
Table 2 Abdominal Body Fat and Muscle Composition Analysis Results for the Chronic Obstructive Pulmonary Disease Group Compared with the Control Group |
COPD Subgroup Analysis
The baseline characteristics and abdominal compositions for subjects in the COPD subgroup are presented in Table S3. The majority of COPD subjects had mild (108, 41.5%) to moderate (145, 55.8%) disease stages. In the multiple linear regression analyses including the variables with P values less than 0.1 from the simple linear regression, VFA attenuation for mild COPD subjects was higher than that of control subjects (unstandardized β = 1.287, P = 0.041). Additionally, NAMA attenuation of moderate COPD subjects was lower than that of the control subjects (unstandardized β = −1.075, P < 0.001). In the BMI adjusted cross-sectional areas comparison between the control group and each COPD subgroup, subjects with mild COPD had higher IMAT (unstandardized β = 0.037, P = 0.009) and LAMA (unstandardized β = 0.089, P = 0.002) indexes when compared to control subjects. Subjects with moderate COPD had higher VFA (unstandardized β = 0.276, P = 0.027), IMAT (unstandardized β = 0.045, P < 0.001), and LAMA (unstandardized β = 0.147, P < 0.001) indexes, and they had a lower NAMA index (unstandardized β = −0.133, P = 0.015) compared to the control subjects (Table 3).
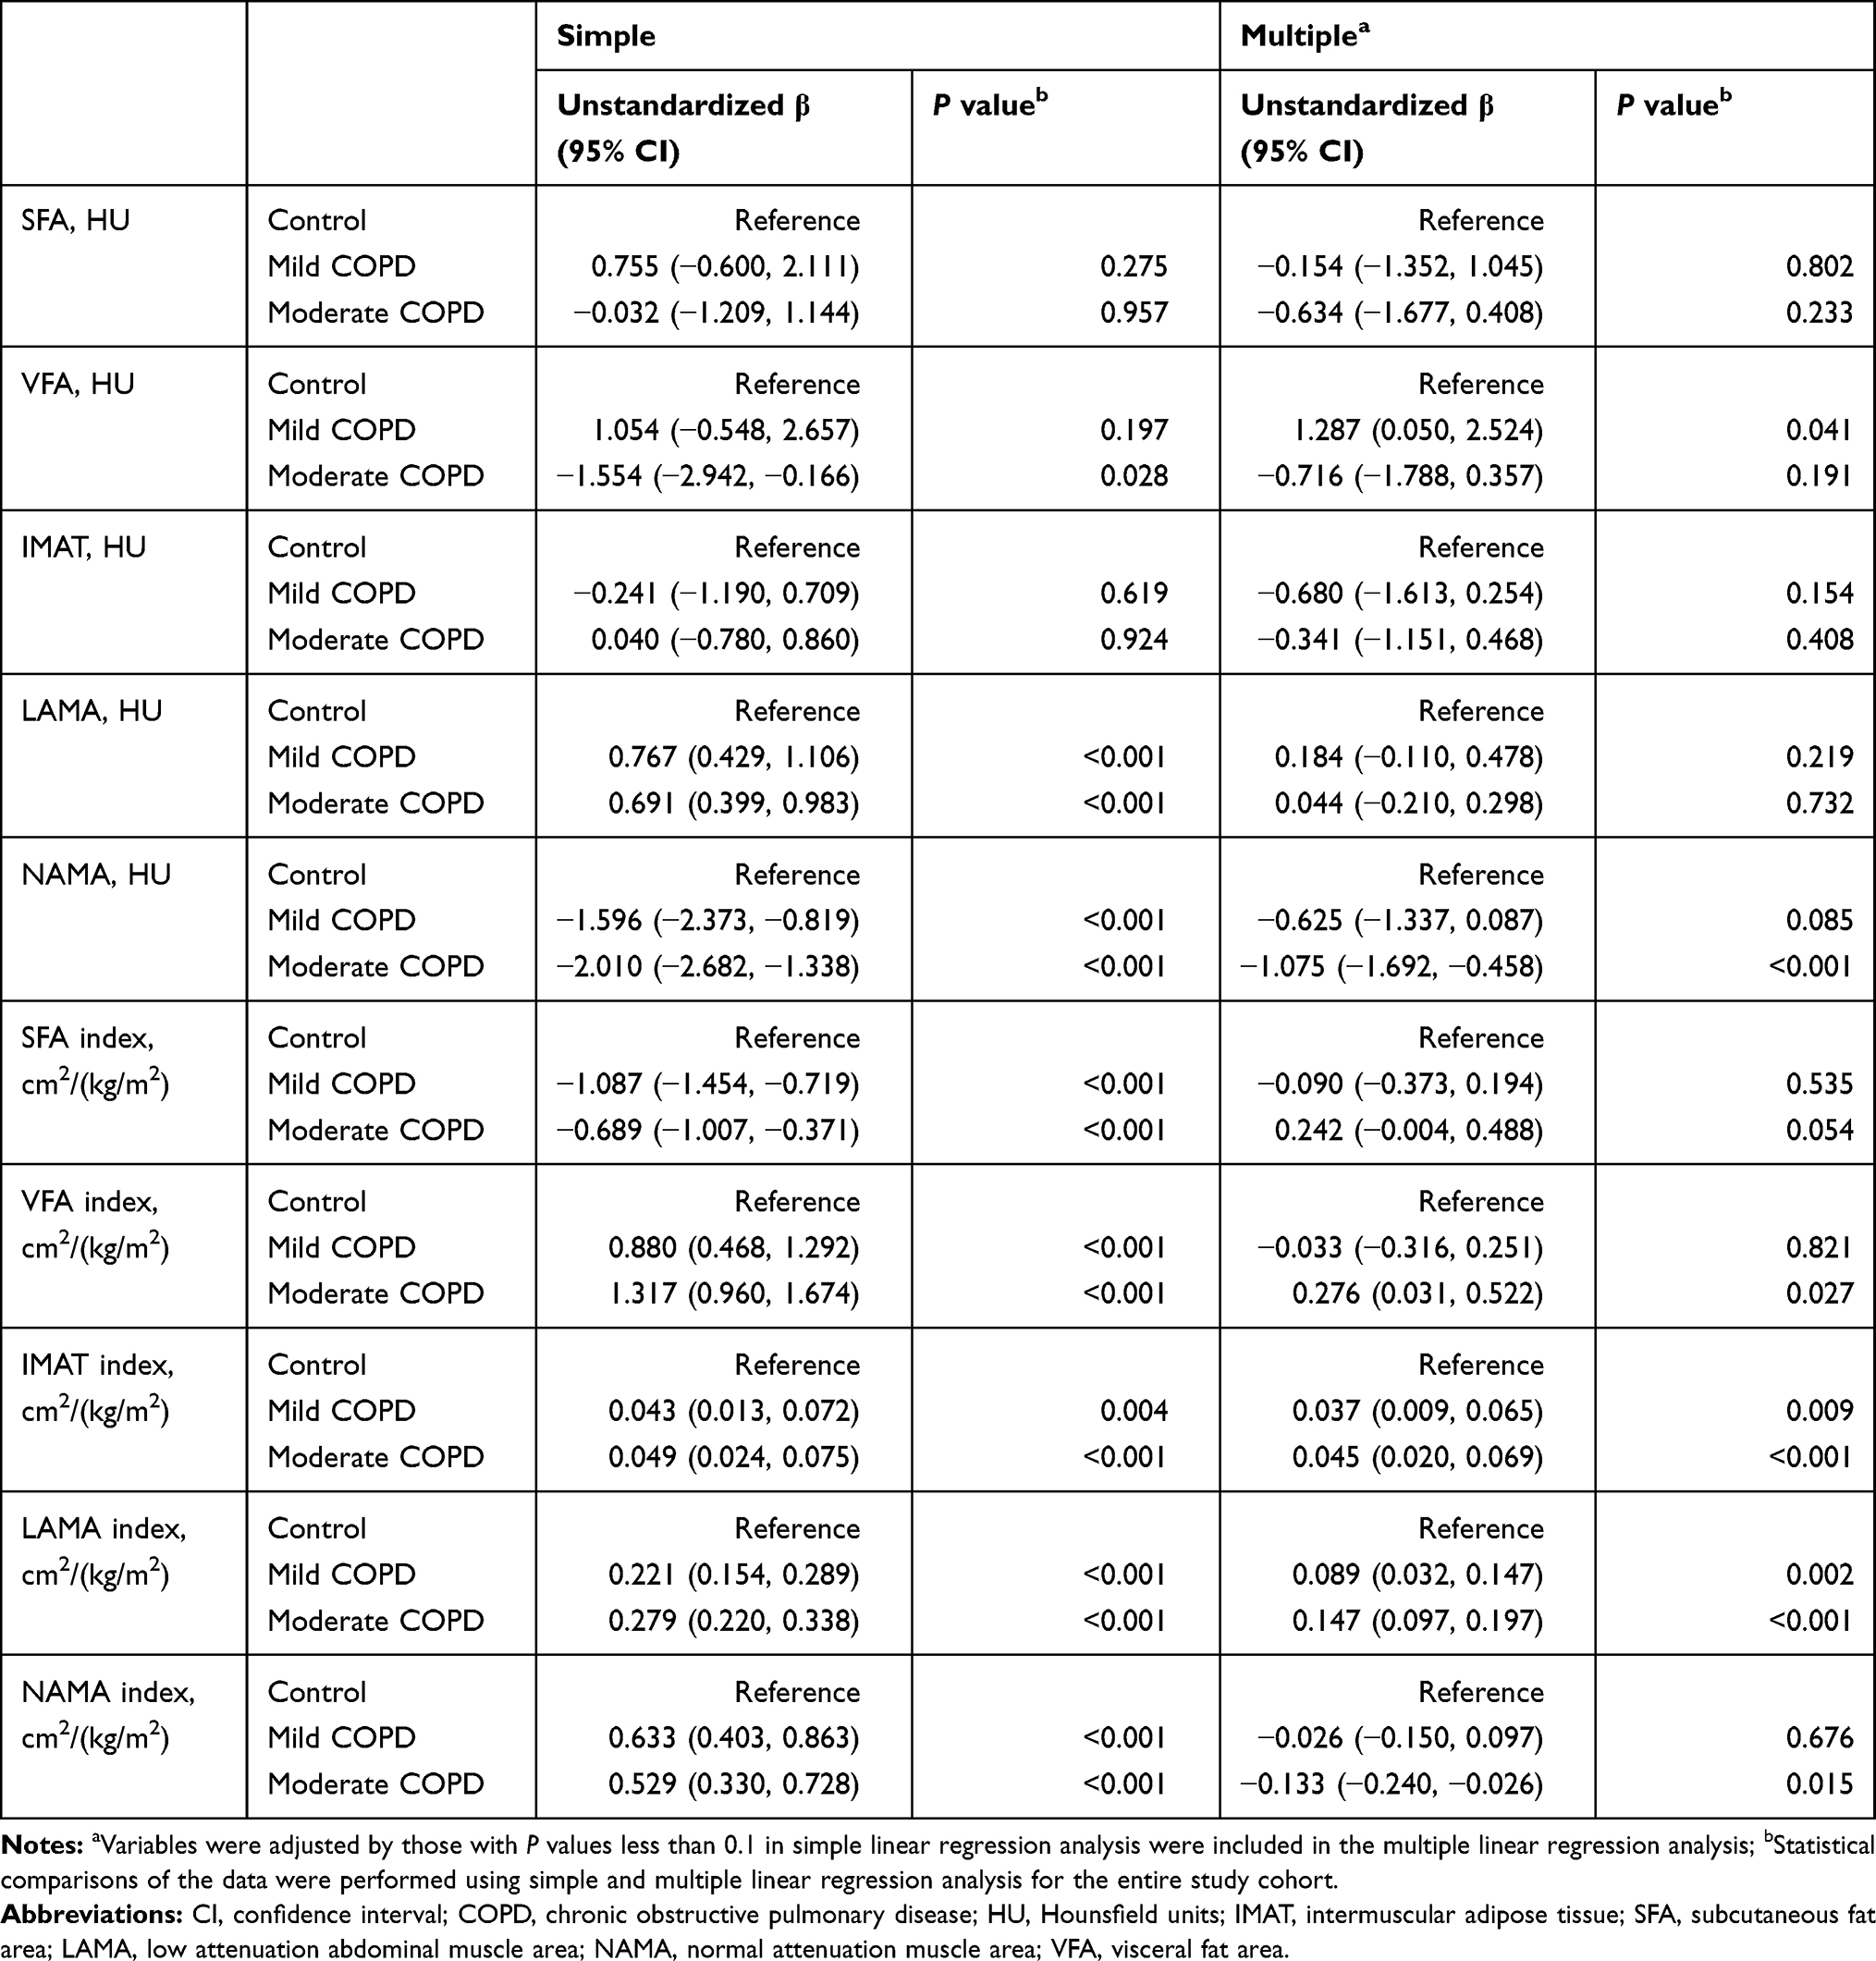 |
Table 3 Abdominal Body Fat and Muscle Composition Analysis Results for the Chronic Obstructive Pulmonary Disease Subgroups Compared with the Control Group |
Discussion
These study findings suggested that intramuscular and intermuscular abdominal fat infiltration can be present in subjects with mild COPD, and it may be exacerbated in subjects with moderate COPD. Although previous studies have assessed the increase of ectopic fat in COPD subjects,2,4,5,27,28 the current study focused on the intramuscular and intermuscular fat infiltration in COPD subjects based on LAMA, NAMA, and IMAT concepts determined using CT attenuation values. Additionally, we adjusted for the metabolic factors and comorbidities that influence the body composition of subjects.
The LAMA index is a BMI adjusted value that reflects the muscle mass with increased intramuscular fat infiltration, and the IMAT index is a BMI adjusted value that reflects the lipid volume in intermuscular spaces. Based on the findings from this study, LAMA and IMAT indexes were increased in COPD subjects after propensity score matching and after multiple linear regression of the mild and moderate COPD subgroups. These findings suggest that intramuscular and intermuscular fat infiltration could be present in mild COPD subjects.
Several studies have reported that muscle attenuation is reduced in COPD subjects.4,5 Based on the propensity score matching and multiple linear regression results from the current study, NAMA attenuation and the NAMA index were decreased in moderate COPD subjects; however, the same trends were not found for those with mild COPD. Additionally, the LAMA index was increased more in subjects with moderate COPD compared to those with mild COPD. These findings suggest that intramuscular and intermuscular fat infiltration were more advanced in the subjects with moderate COPD than among those with mild COPD. Intramuscular fat infiltration is strongly associated with impaired muscle function and atrophy.29 NAMA represents the quantity of muscle mass with good functionality; inversely LAMA represents the quantity of muscle mass with poor functionality. Previous studies have reported that muscular atrophy and muscle dysfunction are serious complications in COPD patients.23,30,31 Based on these findings, we predict that muscle atrophy and impairment of muscle function were exacerbated in subjects with moderate COPD.
The VFA is a localized adipose tissue area around the internal organs, and several studies have reported that abdominal VFA is increased in COPD patients.27,28 In the current study, there was no significant difference in the VFA index between the control and COPD groups after propensity score matching, or between the control group and mild COPD subgroup in the multiple regression model. However, subjects in the moderate COPD subgroup had a higher VFA index when compared with the control group in the multiple regression model. These results suggest that abdominal VFA were increased in subjects with a more advanced COPD stage.
Considering the findings for the VFA index in the COPD subgroups, we anticipated that there would be no change or a slight decrease in VFA attenuation among mild COPD subjects when compared with control subjects. However, the VFA attenuation was increased in subjects with mild COPD. This might be an accidental finding because there was relatively little difference in the abdominal body compositions between the control and mild COPD subjects, and there was no increase in VFA attenuation in the subjects with moderate COPD. Further large-scale studies are required to evaluate these findings further.
Based on the decreased NAMA attenuation, and the increased LAMA, and IMAT indexes, we can conclude that intra-abdominal lipid components were increased in COPD subjects when compared with control subjects. Although the mechanism for intra-abdominal lipid accumulation in COPD subjects is not clear, it might be attributed to chronic systemic inflammation, smoking, dietary habits, lifestyle, genetic factors, hormonal changes, and the use of drugs such as steroids.2,32–34 Additionally, ectopic fat contributes to increased proinflammatory mediators such as TNF-α, IL-6, leptin, and adiponectin, which, as a result, can lead to the incompetence of the muscle oxidative capacity, poor functional status, insulin resistance, cardiovascular comorbidities, and all-cause mortality in COPD patients.5,27,35–38
This study was subject to several limitations. First, due to the cross-sectional nature of the study design, there might be causal relationships. However, we tried to minimize the bias by adjusting for the differences between the control and COPD groups using propensity score matching and multiple linear regression. Second, COPD diagnosis for the included subjects might have been inaccurate. COPD diagnosis in our study was not made by the doctor, it was determined on the basis of the pre-bronchodilator FEV1/FVC results. Additionally, we could not discriminate between mixed and pure obstructive patterns in some subjects due to the absence of total lung capacity. Although we considered age and smoking history for the COPD diagnosis, it is possible that subjects with asthma were included or non-smoking COPD subjects were excluded. Therefore, our study results should be interpreted with caution. Third, considering the FEV1 values, because we enrolled subjects undergoing health examinations, most of the subjects included in the COPD group had mild to moderate disease. Our study results might differ among subjects with severe or very severe COPD. Well-designed and large-scale studies targeting subjects with advanced stage COPD are required to draw definitive conclusions. Fourth, it is possible that underlying comorbidities (cardiovascular disease, hypertension, diabetes, and hyperlipidemia) obtained from self-report questionnaires were incorrectly diagnosed. Additionally, heart, lung, liver, kidney, and rheumatic disorders might have been underdiagnosed, since focus was placed on metabolic problems and metabolic-syndrome-related diseases. Fifth, lifestyle factors (alcohol consumption and exercise grade) might have not been objectively quantified, and we could not investigate the subjects’ medication use (such as bronchodilators, steroids, antihypertensive medications, diabetic medications, and lipid lowering agents). However, we tried to adjust for these limitations by enrolling a large number of subjects and by conducting in-depth matching of study subjects. Finally, we could not evaluate the abdominal fat and muscle differences according to the COPD phenotype, such as chronic bronchitis and emphysema. There might have been different findings between the two phenotypes; thus, further studies are required to investigate this.
Conclusion
In this large cross-sectional study using CT-based body composition analysis, it was found that intramuscular and intermuscular abdominal fat infiltration may be increased in mild COPD subjects, and it may be more advanced in moderate COPD subjects independent of age, sex, height, weight, BMI, underlying diseases, lifestyle, and metabolic factors. These results suggest that intramuscular and intermuscular abdominal fat infiltration is an important finding of abdominal composition changes in COPD subjects. Our study findings should be validated by larger, prospective randomized control studies investigating abdominal fat and muscle in COPD subjects.
Abbreviations
APCT, abdominopelvic computed tomography; BMI, body mass index; COPD, chronic obstructive pulmonary disease; CT, computed tomography; FEV1, forced expiratory volume in the first 1 second; FVC, forced vital capacity; HbA1c, glycosylated hemoglobin; HDL-C, high-density lipoprotein cholesterol; HU, Hounsfield units; IMAT, intermuscular adipose tissue; LAMA, low attenuation abdominal muscle area; LDL-C, low-density lipoprotein cholesterol, NAMA, normal attenuation muscle area; SFA, subcutaneous fat area; VFA, visceral fat area.
Data Sharing Statement
The dataset supporting the conclusions of this article is available upon request.
Ethics Approval and Informed Consent
This study was approved by the appropriate ethics review board (No. 2020-08-013) and abided by the Declaration of Helsinki. The need for informed consent was waived owing to the retrospective nature of the study. We have read and understood your journal’s policies, and we believe that neither the manuscript nor the study violates any of these.
Acknowledgments
Clinical and laboratory variables were collected from the clinical data warehouse platform (Ulsan University Hospital Information of Clinical Ecosystem [uICE]) by the Medical Information Center of Ulsan University Hospital.
Disclosure
The authors report no conflicts of interest in this work.
References
1. Ferrari R, Caram LM, Faganello MM, Sanchez FF, Tanni SE, Godoy I. Relation between systemic inflammatory markers, peripheral muscle mass, and strength in limb muscles in stable COPD patients. Int J Chron Obstruct Pulmon Dis. 2015;10:1553–1558. doi:10.2147/COPD.S85954
2. Resorlu M, Karatag O, Toprak CA, Ozturk MO. Neglected areas on thorax computed tomography evaluation in patients with chronic obstructive pulmonary disease: paravertebral muscles and para-aortic adipose tissue. J Med Imaging Radiat Oncol. 2018;62(4):487–492. doi:10.1111/1754-9485.12716
3. Rutten EP, Breyer MK, Spruit MA, et al. Abdominal fat mass contributes to the systemic inflammation in chronic obstructive pulmonary disease. Clin Nutr. 2010;29(6):756–760. doi:10.1016/j.clnu.2010.04.007
4. Coats V, Després JP, Alméras N, et al.; on behalf of CanCOLD Collaborative Research Group, Canadian Respiratory Research Network. Ectopic adiposity and cardiometabolic health in COPD. Int J Chron Obstruct Pulmon Dis. 2018;13:3331–3340. doi:10.2147/COPD.S168963
5. Martin M, Almeras N, Després JP, et al. Ectopic fat accumulation in patients with COPD: an ECLIPSE substudy. Int J Chron Obstruct Pulmon Dis. 2017;12:451–460. doi:10.2147/COPD.S124750
6. Pi-Sunyer X. Changes in body composition and metabolic disease risk. Eur J Clin Nutr. 2019;73(2):231–235. doi:10.1038/s41430-018-0320-x
7. Jones KI, Doleman B, Scott S, Lund JN, Williams JP. Simple psoas cross-sectional area measurement is a quick and easy method to assess sarcopenia and predicts major surgical complications. Colorectal Dis. 2015;17(1):O20–O26. doi:10.1111/codi.12805
8. Mourtzakis M, Prado CM, Lieffers JR, Reiman T, McCargar LJ, Baracos VE. A practical and precise approach to quantification of body composition in cancer patients using computed tomography images acquired during routine care. Appl Physiol Nutr Metab. 2008;33(5):997–1006. doi:10.1139/H08-075
9. Shuster A, Patlas M, Pinthus JH, Mourtzakis M. The clinical importance of visceral adiposity: a critical review of methods for visceral adipose tissue analysis. Br J Radiol. 2012;85(1009):1–10. doi:10.1259/bjr/38447238
10. Aubrey J, Esfandiari N, Baracos VE, et al. Measurement of skeletal muscle radiation attenuation and basis of its biological variation. Acta Physiol. 2014;210(3):489–497. doi:10.1111/apha.12224
11. Kim D, Nam S, Ahn C, et al. Correlation between midthigh low-density muscle and insulin resistance in obese nondiabetic patients in Korea. Diabetes Care. 2003;26(6):1825–1830. doi:10.2337/diacare.26.6.1825
12. Tuttle LJ, Sinacore DR, Mueller MJ. Intermuscular adipose tissue is muscle specific and associated with poor functional performance. J Aging Res. 2012;2012:172957. doi:10.1155/2012/172957
13. Kim DS, Kim YS, Jung KS, et al.; on behalf of Korean Academy of Tuberculosis and Respiratory Diseases. Prevalence of chronic obstructive pulmonary disease in Korea: a population-based spirometry survey. Am J Respir Crit Care Med. 2005;172(7):842–847. doi:10.1164/rccm.200502-259OC
14. Liu Y, Pleasants RA, Croft JB, et al. Smoking duration, respiratory symptoms, and COPD in adults aged ≥45 years with a smoking history. Int J Chron Obstruct Pulmon Dis. 2015;10:1409–1416. doi:10.2147/COPD.S82259
15. Global strategy for the diagnosis, management, and prevention of chronic obstructive pulmonary disease: 2021 report [report on the Internet]. Global initiative for Chronic Obstructive Lung Disease, Inc; 2020. Available from: https://goldcopd.org/wp-content/uploads/2020/11/GOLD-REPORT-2021-v1.1-25Nov20_WMV.pdf.
16. McDonald MN, Diaz AA, Rutten E, et al. Chest computed tomography-derived low fat-free mass index and mortality in COPD. Eur Respir J. 2017;50(6):1701134. doi:10.1183/13993003.01134-2017
17. Miller MR, Hankinson J, Brusasco V, et al. Standardisation of spirometry. Eur Respir J. 2005;26(2):319–338. doi:10.1183/09031936.05.00034805
18. Choi JK, Paek D, Lee JO. Normal predictive values of spirometry in Korean population. Tuberc Respir Dis. 2005;58(3):230–242. doi:10.4046/trd.2005.58.3.230
19. Lee K, Kim KW, Lee JB, et al. Impact of remnant stomach volume and anastomosis on nutrition and body composition in gastric cancer patients. Surg Oncol. 2019;31:75–82. doi:10.1016/j.suronc.2019.09.008
20. Lee K, Shin Y, Huh J, et al. Recent issues on body composition imaging for sarcopenia evaluation. Korean J Radiol. 2019;20(2):205–217. doi:10.3348/kjr.2018.0479
21. Park HJ, Shin Y, Park J, et al. Development and validation of a deep learning system for segmentation of abdominal muscle and fat on computed tomography. Korean J Radiol. 2020;21(1):88–100. doi:10.3348/kjr.2019.0470
22. Mitsiopoulos N, Baumgartner RN, Heymsfield SB, Lyons W, Gallagher D, Ross R. Cadaver validation of skeletal muscle measurement by magnetic resonance imaging and computerized tomography. J Appl Physiol. 1998;85(1):115–122. doi:10.1152/jappl.1998.85.1.115
23. Maddocks M, Shrikrishna D, Vitoriano S, et al. Skeletal muscle adiposity is associated with physical activity, exercise capacity and fibre shift in COPD. Eur Respir J. 2014;44(5):1188–1198. doi:10.1183/09031936.00066414
24. Studenski SA, Peters KW, Alley DE, et al. The FNIH sarcopenia project: rationale, study description, conference recommendations, and final estimates. J Gerontol a Biol Sci Med Sci. 2014;69(5):547–558. doi:10.1093/gerona/glu010
25. Thoemmes F, Wang L. PS matching in SPSS ver 3.04 [SPSS plug-in on the internet]. SOURCEFORGE; 2015. Available from: https://sourceforge.net/projects/psmspss/files/psmatching3.04/.
26. Thoemmes F. Propensity score matching in SPSS [preprint on the internet]. arXiv; 2012. Available from: https://arxiv.org/abs/1201.6385.
27. van den Borst B, Gosker HR, Koster A, et al.; for Health, Aging, and Body Composition (Health ABC) Study. The influence of abdominal visceral fat on inflammatory pathways and mortality risk in obstructive lung disease. Am J Clin Nutr. 2012;96(3):516–526. doi:10.3945/ajcn.112.040774
28. Furutate R, Ishii T, Wakabayashi R, et al. Excessive visceral fat accumulation in advanced chronic obstructive pulmonary disease. Int J Chron Obstruct Pulmon Dis. 2011;6:423–430. doi:10.2147/COPD.S22885
29. Robles PG, Sussman MS, Naraghi A, et al. Intramuscular fat infiltration contributes to impaired muscle function in COPD. Med Sci Sports Exerc. 2015;47(7):1334–1341. doi:10.1249/MSS.0000000000000556
30. Bolton CE, Ionescu AA, Shiels KM, et al. Associated loss of fat-free mass and bone mineral density in chronic obstructive pulmonary disease. Am J Respir Crit Care Med. 2004;170(12):1286–1293. doi:10.1164/rccm.200406-754OC
31. Rabinovich RA, Vilaró J. Structural and functional changes of peripheral muscles in chronic obstructive pulmonary disease patients. Curr Opin Pulm Med. 2010;16(2):123–133. doi:10.1097/MCP.0b013e328336438d
32. Després JP, Lemieux I. Abdominal obesity and metabolic syndrome. Nature. 2006;444(7121):881–887. doi:10.1038/nature05488
33. Donaldson AV, Maddocks M, Martolini D, Polkey MI, Man WD. Muscle function in COPD: a complex interplay. Int J Chron Obstruct Pulmon Dis. 2012;7:523–535. doi:10.2147/COPD.S28247
34. Dallman MF, la Fleur SE, Pecoraro NC, Gomez F, Houshyar H, Akana SF. Minireview: glucocorticoids—food intake, abdominal obesity, and wealthy nations in 2004. Endocrinology. 2004;145(6):2633–2638. doi:10.1210/en.2004-0037
35. Borkan GA, Hults DE, Gerzof SG, Robbins AH, Silbert CK. Age changes in body composition revealed by computed tomography. J Gerontol. 1983;38(6):673–677. doi:10.1093/geronj/38.6.673
36. Simoneau JA, Colberg SR, Thaete FL, Kelley DE. Skeletal muscle glycolytic and oxidative enzyme capacities are determinants of insulin sensitivity and muscle composition in obese women. FASEB J. 1995;9(2):273–278. doi:10.1096/fasebj.9.2.7781930
37. Visser M, Kritchevsky SB, Goodpaster BH, et al. Leg muscle mass and composition in relation to lower extremity performance in men and women aged 70 to 79: the health, aging and body composition study. J Am Geriatr Soc. 2002;50(5):897–904. doi:10.1046/j.1532-5415.2002.50217.x
38. Lang T, Cauley JA, Tylavsky F, Bauer D, Cummings S, Harris TB. Computed tomographic measurements of thigh muscle cross-sectional area and attenuation coefficient predict hip fracture: the health, aging, and body composition study. J Bone Miner Res. 2010;25(3):513–519. doi:10.1359/jbmr.090807
 © 2021 The Author(s). This work is published and licensed by Dove Medical Press Limited. The full terms of this license are available at https://www.dovepress.com/terms.php and incorporate the Creative Commons Attribution - Non Commercial (unported, v3.0) License.
By accessing the work you hereby accept the Terms. Non-commercial uses of the work are permitted without any further permission from Dove Medical Press Limited, provided the work is properly attributed. For permission for commercial use of this work, please see paragraphs 4.2 and 5 of our Terms.
© 2021 The Author(s). This work is published and licensed by Dove Medical Press Limited. The full terms of this license are available at https://www.dovepress.com/terms.php and incorporate the Creative Commons Attribution - Non Commercial (unported, v3.0) License.
By accessing the work you hereby accept the Terms. Non-commercial uses of the work are permitted without any further permission from Dove Medical Press Limited, provided the work is properly attributed. For permission for commercial use of this work, please see paragraphs 4.2 and 5 of our Terms.