Back to Journals » Journal of Hepatocellular Carcinoma » Volume 12
Integrative Multi-Omics and Functional Validation Reveal the Role of the TACE Refractoriness-Associated Gene ATP1B3 in Hepatocellular Carcinoma
Authors Zhang C, Hu Q, Meng H, Wu Q, Zeng L, Zheng L, Weng Q ![]() , Qiu R, Xu M, Chen M, Chen F
, Qiu R, Xu M, Chen M, Chen F ![]() , Zhao Z, Yang Y, Ji J
, Zhao Z, Yang Y, Ji J ![]()
Received 1 May 2025
Accepted for publication 23 October 2025
Published 19 November 2025 Volume 2025:12 Pages 2565—2583
DOI https://doi.org/10.2147/JHC.S537990
Checked for plagiarism Yes
Review by Single anonymous peer review
Peer reviewer comments 2
Editor who approved publication: Dr Ahmed Kaseb
Cong Zhang,1,* Qin Hu,2,3,* Hui Meng,3 Qingqing Wu,3 Lulu Zeng,3 Liyun Zheng,1,3 Qiaoyou Weng,1,3 Rongfang Qiu,1,3 Min Xu,1,3 Minjiang Chen,1,3 Feng Chen,4 Zhongwei Zhao,1,3 Yang Yang,2,3,5 Jiansong Ji1– 3
1Zhejiang Key Laboratory of Imaging and Interventional Medicine, Zhejiang Engineering Research Center of Interventional Medicine Engineering and Biotechnology, Lishui Hospital, School of Medicine, Zhejiang University, Lishui, 323000, People’s Republic of China; 2Cixi Biomedical Research Institute, Wenzhou Medical University, Ningbo, 315300, People’s Republic of China; 3Department of Radiology, Lishui Central Hospital, The Fifth Affiliated Hospital of Wenzhou Medical University, Lishui, 323000, People’s Republic of China; 4Department of Radiology, The First Affiliated Hospital, Zhejiang University School of Medicine, Hangzhou, 310003, People’s Republic of China; 5Key Laboratory of Precision Medicine of Lishui, Lishui, 323000, People’s Republic of China
*These authors contributed equally to this work
Correspondence: Jiansong Ji, Zhejiang Key Laboratory of Imaging and Interventional Medicine, Zhejiang Engineering Research Center of Interventional Medicine Engineering and Biotechnology, Lishui Hospital, School of Medicine, Zhejiang University, Lishui, 323000, People’s Republic of China, Email [email protected] Yang Yang, Cixi Biomedical Research Institute, Wenzhou Medical University, Ningbo, 315300, People’s Republic of China, Email [email protected]
Background: Transarterial chemoembolization (TACE) is the standard treatment for intermediate-stage hepatocellular carcinoma (HCC), but resistance to TACE is a major clinical challenge. This study aimed to identify genes associated with TACE refractoriness and their roles in HCC progression.
Methods: Gene expression profiles from 104 HCC patients treated with TACE were analyzed using unsupervised clustering to identify molecular subtypes. Key genes associated with TACE refractoriness were identified through univariate Cox regression and lasso, with ATP1B3 emerging as a candidate. Functional annotation of ATP1B3 was conducted using KEGG, GO, and GSEA analyses, while immune profiling and immunotherapy response were compared between ATP1B3-high and ATP1B3-low groups. Single-cell RNA sequencing (scRNA-seq) was employed to explore ATP1B3 expression and its cellular interactions. In vitro functional assays validated its role in migration, invasion, cell cycle, chemotherapy sensitivity, and apoptosis.
Results: Unsupervised clustering revealed two distinct molecular subtypes of HCC. Cluster 1 was associated with significantly prolonged overall and recurrence-free survival, whereas Cluster 2 exhibited aggressive tumor behavior and adverse clinical outcomes. ATP1B3 was identified as a pivotal gene linked to TACE refractoriness and poor prognosis. Elevated ATP1B3 expression was strongly correlated with metabolic dysregulation, heightened tumor aggressiveness, immune evasion, and diminished therapeutic responses to TACE, sorafenib, and immunotherapy. scRNA-seq analyses demonstrated widespread ATP1B3 expression across tumor and immune cell subsets, with ATP1B3-positive HCC cells displaying enhanced interactions with immune cells. Functional assays revealed that ATP1B3 overexpression promoted tumor migration, invasion, and chemoresistance, while its silencing induced cell cycle arrest, apoptosis, and increased sensitivity to cisplatin.
Conclusion: This study identifies TACE refractoriness-related gene ATP1B3 as a key regulator of tumor progression, immune evasion, and therapeutic resistance in HCC. These findings highlight ATP1B3 as a promising biomarker for patient stratification and a potential therapeutic target to improve clinical outcomes in HCC.
Keywords: hepatocellular carcinoma, TACE refractoriness, ATP1B3, transcriptomics, molecular subtypes
Introduction
Hepatocellular carcinoma (HCC) is the most common type of liver cancer, accounting for approximately 90% of liver cancer cases.1 Despite the recent plateau in its incidence, HCC remains the third leading cause of cancer-related mortality worldwide.2,3 The poor overall survival (OS) rate of HCC patients (5-year OS < 20%) is primarily attributed to the fact that the majority of cases are diagnosed at intermediate or advanced stages, where curative treatment options are no longer viable.4,5
Transarterial chemoembolization (TACE) is the most widely used treatment for unresectable HCC and is recommended as the standard therapy for Barcelona Clinic Liver Cancer (BCLC) stage B HCC.6,7 It is also utilized as a palliative treatment for advanced disease, a bridging therapy to liver transplantation, and as a tumor downstaging strategy prior to surgical resection.1,4,8 TACE delivers cytotoxic agents through intra-arterial injection, followed by embolization of tumor-feeding blood vessels, inducing cytotoxic and ischemic effects within the tumor.9 Despite its widespread use, the efficacy of TACE varies significantly among patients. The objective response rate of TACE is approximately 52%, with OS rates of 70%, 52%, and 32% at 1, 2, and 5 years, respectively, and a median OS of 19.4 months.10 These findings reveal contrasting patient outcomes, as 30% of patients die within the first year due to poor responses, while 32% survive beyond five years. This suggests the existence of a subgroup of patients who derive substantial benefit from TACE. The phenomenon of patients showing poor response to TACE is termed “TACE refractoriness” or “TACE failure”, first introduced by the Japan Society of Hepatology in 2010.11 In addition, emerging evidence indicates that TACE refractoriness is strongly associated with an unfavorable prognosis in HCC patients.12,13 Therefore, identifying the specific genes and pathways underlying TACE refractoriness is critical for advancing HCC research and improving therapeutic outcomes.
Recent advancements in sequencing methods and bioinformatic algorithms have transformed multi-omics technology into an indispensable tool for HCC research.14–16 Nevertheless, the inherent complexity and immense scale of sequencing data present substantial challenges in pinpointing critical genes. Machine learning, a branch of artificial intelligence, provides powerful tools for analyzing complex datasets by uncovering patterns and predicting outcomes from unknown data. Additionally, machine learning systems can continuously update and refine their performance by integrating new knowledge.17 With ongoing advancements in machine learning, more accurate and sophisticated algorithms enable reducing data dimensionality and identifying key disease-related genes with greater precision.18 For example, Zhang et al identified macrophage-specific PLA2G7 as a key biomarker associated with prognosis and immunotherapy response in HCC through single-cell RNA sequencing and machine learning analysis, demonstrating the potential of such approaches to uncover novel therapeutic targets.19
In this study, we conducted unsupervised clustering analysis to stratify HCC patients treated with TACE into two distinct subgroups based on their gene expression profiles. These subgroups demonstrated significant differences in clinical outcomes and molecular characteristics, highlighting the heterogeneity underlying TACE refractoriness. Among the differentially expressed genes identified between the two clusters, ATP1B3 emerged as a key gene associated with TACE refractoriness, as determined through univariate Cox regression, lasso regression, differential expression, and survival analyses. To further elucidate the role of ATP1B3 in HCC, we integrated transcriptomics, genomics, and scRNA sequencing data to perform multi-omics analyses, including functional, mutational, immune, cell subset composition, and cell communication analyses. The functional significance of ATP1B3 in HCC progression was validated through in vitro assays, including differential expression, migration, invasion, cell cycle, chemotherapy sensitivity, and apoptosis experiments. Our findings suggest that the TACE refractoriness-associated gene ATP1B3 may serve as a promising therapeutic target for improving treatment outcomes in HCC patients.
Materials and Methods
Data Collection
A total of seven public datasets were analyzed in this study, covering scRNA-seq, high-throughput RNA sequencing (RNA-seq), microarray data, and clinical treatment cohorts. The HCC scRNA-seq datasets GSE14961420 and GSE24288921 were obtained from the Gene Expression Omnibus (GEO). Gene expression data and complete clinical information for the TCGA-LIHC and GSE1452022 cohorts were downloaded from TCGA and GEO, respectively, while somatic mutation and copy number variation (CNV) data for TCGA-LIHC were retrieved from cBioPortal. Additional microarray datasets, GSE104580 and GSE109211,23 were retrieved from GEO. GSE104580 contains data on TACE treatment, while GSE109211 focuses on sorafenib therapy. Information regarding patient response to treatment in both datasets was provided by the original authors. Lastly, the Imvigor210 cohort,24 an immune therapy dataset, was included for further analysis.
Unsupervised Clustering and Functional Profiling in TACE-Treated Cohort
Unsupervised clustering analysis was performed on 104 TACE-treated patients from the GSE14520 cohort using the ConsensusClusterPlus package.25 To identify the most variable genes, the median absolute deviation (MAD) was calculated for each gene, and the top 150 genes with the highest variability were selected for clustering. The optimal number of clusters was determined based on cumulative distribution function (CDF) curves, changes in the area under the CDF, and the consensus heatmap. This was further validated using the proportion of ambiguous clustering (PAC) method.26 Kaplan-Meier survival analysis was conducted to assess the ability of the identified subgroups to predict OS and recurrence-free survival (RFS) in TACE-treated patients. Differentially expressed genes (DEGs) between the two subgroups were identified using the limma package, with thresholds of adjusted P value < 0.05 and |logFC| > 1. Gene Ontology (GO) and Kyoto Encyclopedia of Genes and Genomes (KEGG) enrichment analyses of the DEGs were performed using the ClusterProfiler package.27 To identify potential therapeutic compounds and target pathways, the Connectivity Map (CMap) database was utilized. For CMap analysis, 150 upregulated and 150 downregulated genes were submitted simultaneously to identify candidate compounds based on similarities in gene expression profiles.
Workflow of Gene Selection
First, univariate Cox regression analysis was performed to identify TACE prognosis-related genes among the upregulated genes associated with TACE refractoriness, as determined through differential expression analysis. Subsequently, univariate Cox regression was also applied to the TCGA cohort to further identify genes associated with HCC prognosis. To refine the selection, key genes were identified using lasso regression. Finally, core gene for further investigation were comprehensively determined by evaluating three critical factors: (1) differences in gene expression between HCC tissues and adjacent non-tumor tissues, (2) their prognostic significance in HCC patients, and (3) their associations with HCC malignancy progression.
Identification of ATP1B3 Co-Expressed Genes and Enrichment Analysis
The TCGA-LIHC cohort was analyzed to identify genes co-expressed with ATP1B3. The Spearman correlation coefficient was used to evaluate the correlation between ATP1B3 expression and other genes. The top 150 positively and negatively correlated genes were selected for GO and KEGG pathway enrichment analysis. In addition, the Spearman correlation analysis and gene set enrichment analysis (GSEA) were further performed to investigate the association between ATP1B3 expression and hallmark gene sets from the Molecular Signatures Database (MSigDB).
Somatic Mutation and Copy Number Variation Analysis
The genomic variation landscape was examined by analyzing somatic mutations and CNV data. Differences in somatic mutations between ATP1B3-high and ATP1B3-low groups were assessed by evaluating single nucleotide polymorphisms (SNPs), insertions and deletions (INDELs), tumor mutation burden (TMB), and mutation frequencies. Visualizations were created using the maftools package.28 The top 20 frequently mutated genes (FMGs), identified based on mutation frequency, were considered potential drivers of tumorigenesis.29 CNV profiles were compared between the two groups, emphasizing the top 10 genes with the highest frequencies of amplification (AMP) or homozygous deletion (HOMDEL) in each group.
Comprehensive Analysis of Immune-Omics Molecular Characterization and Immunotherapy Response
The relative infiltration levels of 28 types of immune cells were quantified using the ssGSEA method,30,31 and their correlation with ATP1B3 expression was calculated using Spearman correlation analysis. Using the IOBR package,32 we collected previously published gene signatures associated with immunotherapy response, immune suppression, and immune exclusion. A unified scoring method was applied to calculate the enrichment scores for each sample, enabling a comprehensive analysis of immunological differences between patients with high or low ATP1B3 expression. To evaluate immunotherapy response, the TIDE algorithm33 was used, and the findings were further validated in the Imvigor210 cohort.
scRNA-Seq Analysis
The Seurat R package34 was used for processing scRNA-seq data. Quality control standards for scRNA-seq data included the following criteria: (1) the number of detected features (nFeature_RNA) > 500, and (2) the percentage of mitochondrial genes (percent_mito) < 20%. Subsequently, the Harmony R package35 was used to integrate data from fifteen samples. Dimensionality reduction and visualization were performed using t-SNE. Cell clustering was conducted using the “FindNeighbors” and “FindClusters” functions in Seurat. Finally, cell clusters were annotated to ten known cell types based on canonical marker genes. CNVs were assessed by calculating a moving average of relative expression using InferCNV.36
Cell-Cell Communication Analysis
Cellular communication analysis was conducted using the R package CellChat (v1.6.1). The normalized expression matrix was first imported into a CellChat object through the createCellChat function. Default preprocessing steps were then performed, including identifyOverExpressedGenes, identifyOverExpressedInteractions, and projectData. Potential ligand-receptor interactions were identified using the computeCommunProb, filterCommunication, and computeCommunProbPathway functions. The results were visualized with the ktplots package (v2.3.0).
Cell Culture and Transfection
HCC-LM3 and Huh-7 cell lines were obtained from the National Collection of Authenticated Cell Cultures (Shanghai, China). THLE-2 cell line was obtained from Meisen Chinese Tissue Culture Collections (Zhejiang, China). HCC-LM3 cells were cultured in DMEM medium supplemented with 10% fetal bovine serum (FBS, Vivacell, C04001-050) and 1% penicillin-streptomycin. Huh-7 cells were maintained in MEM medium containing 10% FBS and 1% penicillin-streptomycin. THLE-2 cells were cultured in BEGM medium supplemented with 10% FBS and 5 ng/mL EGF.
Small interfering RNA (siRNA) targeting ATP1B3 was synthesized by TsingkeBio (Beijing, China). Transient transfection was performed using Opti-MEM™ reduced serum medium (Thermo Fisher Scientific), siRNA (5 µL), and Lipofectamine™ RNAiMAX Transfection Reagent (5 µL, Invitrogen, 13778030). The components were thoroughly mixed and incubated at room temperature for 10 minutes. The resulting mixture was then added to 6-well plate cultures and incubated for 48 hours before further analysis.
Real-Time Quantitative RT–PCR
Total cellular RNA was extracted using the RNA-Quick Purification Kit (ES Science, RN001) following the manufacturer’s protocol. RNA concentration and purity were determined using the NanoQ spectrophotometer (NanoQ, China). Complementary DNA (cDNA) was synthesized using the Hifair® AdvanceFast 1st Strand cDNA Synthesis Kit (YisBio, 11150ES60) according to the manufacturer’s instructions. Relative quantitative PCR was performed using the Applied Biosystems ABI 7500 system through the measurement of real-time SYBR Green fluorescence. Relative gene expression levels were calculated using the 2−ΔΔCt method to determine fold changes, normalized to GAPDH expression levels as an internal control.
Western Blotting
Total proteins were extracted using RIPA lysis buffer on ice and quantified using the Bradford assay. Proteins were separated by SDS-PAGE and transferred onto a PVDF membrane using electroblotting. The membrane was blocked with 5% skim milk dissolved in TBST for 1 hour at room temperature and incubated overnight at 4°C with a specific primary antibody. After washing three times with TBST, the membrane was incubated with HRP-linked secondary antibodies (1:10,000 dilution) for 1 hour at room temperature. The enhanced chemiluminescent detection kit was employed to visualize the proteins bands. The primary antibodies used in this study included anti-ATP1B3 (Proteintech, 11142-1-AP, 1:1000) and anti-β-tubulin (Cell Signaling Technology, 2146S, 1:1000).
Cell Apoptosis Analysis
After 48 hours of siRNA transfection, the culture medium was replaced with fresh complete medium, and the cells were cultured for an additional 48 hours. Both floating and adherent cells were then collected and stained with the Annexin V-FITC/PI Staining Kit (Beyotime, C1062L) according to the manufacturer’s protocol. The samples were incubated in the dark at room temperature for 15 minutes and then analyzed using a flow cytometer (BD FACSCanto, BD Biosciences, USA). Results were analyzed using FlowJo software.
Cell Cycle Analysis
HCC cells were collected after 48 hours of siRNA transfection and were stained with the cell cycle kit (MULTI SCIENCES, CCS012) according to the manufacturer’s protocol. Cells were resuspended in PI staining solution and the mixture was vortexed for 10 seconds to ensure homogeneity and incubated in the dark at room temperature for 30 minutes. After staining, the samples were analyzed using a flow cytometer (BD FACSCanto, BD Biosciences, USA).
Wound Healing Assay
When the cell density reached over 90% confluence, a sterile 200-μL pipette tip was used to create a cross-shaped scratch at the bottom of the well. The wells were then washed three times with PBS to remove suspended cells. The cells were cultured in serum-free medium under standard culture conditions (37°C, 5% CO2), and images of the scratch area were captured every 12 hours using an inverted microscope. The relative wound areas were quantified using ImageJ software.
Invasion Assay
Matrigel (Corning, 354234) was diluted with serum-free medium at a ratio of 1:3, and the mixture was evenly spread onto the membrane of a Transwell insert (Corning, 3422). The inserts were incubated at 37°C with 5% CO2 for 1 hour to allow the Matrigel to polymerize. Then, 100 µL of serum-free medium containing 5 × 10⁴ cells was added to the upper chamber, and 500 µL of complete medium with 10% FBS was added to the lower chamber as a chemoattractant. The plates were incubated at 37°C with 5% CO2 for 18–24 hours. After incubation, non-invaded cells on the upper surface of the membrane were removed using a cotton swab. The invaded cells on the lower surface of the membrane were fixed with 4% paraformaldehyde for a period of time, stained with crystal violet, and rinsed gently with distilled water. The membranes were air-dried, and images were captured using an inverted microscope.
CCK8 Assay
Drug sensitivity was determined using the CCK8 assay. Cells were seeded in a 96-well plate (10,000 cells/well) and cultured at 37°C with 5% CO2 for 24 hours. Cisplatin (MCE, HY-17394) was then added to the wells and continued incubation for 48 hours. Following treatment, CCK-8 solution (beyotime, C2015L) was added to each well to evaluate cell viability, and the plate was incubated at 37°C for an additional 3 hours. The absorbance was measured at 450 nm using a microplate reader (Tecan, Tecan infinite m200).
Statistical Analyses
Statistical analyses were performed using R (version 4.3.1) and GraphPad Prism (version 9.5). Spearman correlation coefficient was used to evaluate the correlation between two continuous variables. The chi-square test was applied to compare categorical variables, while continuous variables were analyzed using the Wilcoxon rank-sum test or the t-test based on the distribution of the data. Survival analyses were conducted using the Kaplan-Meier method, and differences between survival curves were assessed with the Log rank test. All P values were two-sided, and statistical significance was defined as P < 0.05.
Results
Unsupervised Clustering Identifies Two Subtypes with Distinct Responses to TACE Treatment
To explore the molecular heterogeneity of HCC patients treated with TACE, we performed unsupervised clustering analysis on the gene expression profiles of 104 patients. The consensus heatmap, CDF curves and the PAC statistic indicated that the optimal number of clusters was two (Figures 1A and S1A–C). Principal component analysis (PCA) further supported theses clustering results (Figure 1B). A Log rank test revealed significant differences between the two groups in OS (P < 0.001) and RFS (P = 0.002), indicating better prognoses for patients in cluster 1 for both OS and RFS (Figure 1C and D). We then divided the TACE-treated patients into two subgroups, namely adjuvant TACE and post-recurrence TACE. Results showed that cluster 1 continued to have superior OS and RFS compared to cluster 2 (Figure 1E–H). Additionally, we analyzed HCC patients who underwent only surgical resection. Cluster 1 showed a greater survival benefit compared to surgery alone, whereas cluster 2 did not exhibit significant survival advantages (Figure 1I and Table S1). This suggests heterogeneity in the effectiveness of TACE treatment between clusters 1 and 2.
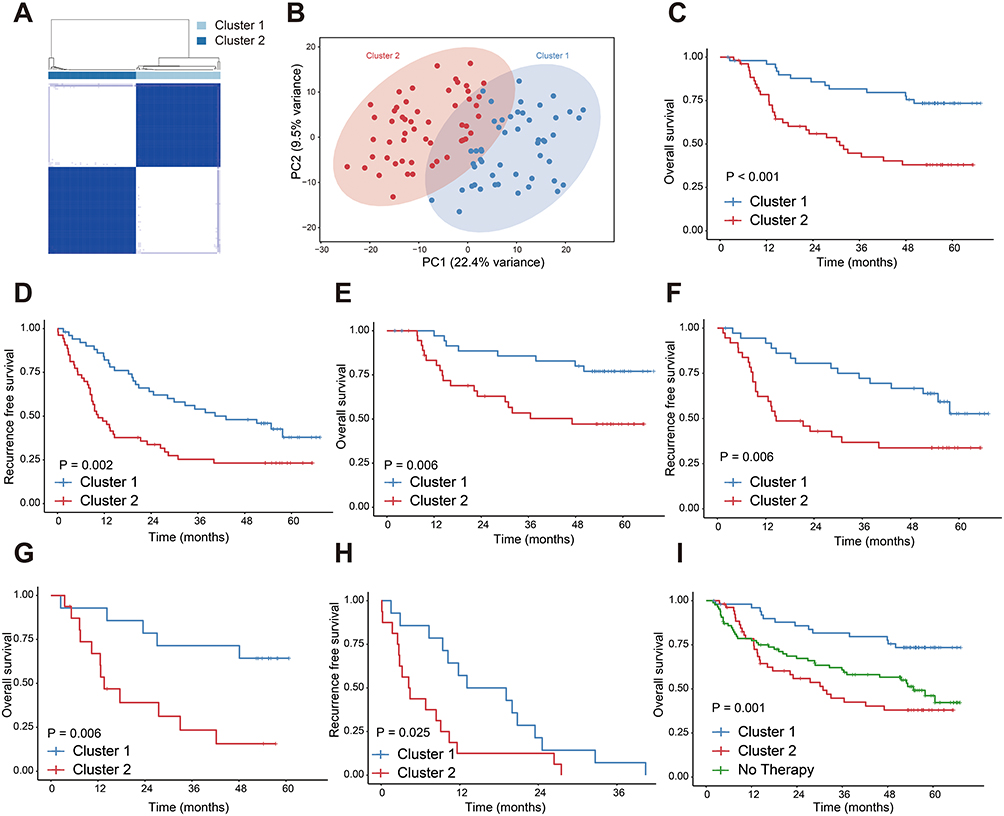 |
Figure 1 Unsupervised clustering reveals distinct prognostic clusters of HCC patients treated with TACE. (A) Unsupervised consensus clustering illustrates two clusters in 104 HCC patients treated with TACE. (B) PCA illustrates the distribution of two clusters. (C) OS and (D) RFS of patients receiving TACE treatment. (E) OS and (F) RFS of patients receiving adjuvant TACE treatment. (G) OS and (H) RFS of patients receiving post-recurrence TACE treatment. (I) Comparison of OS among cluster1, cluster2 and patients who underwent surgical resection without additional therapy. All data are from the GSE14520 cohort. |
Comparative Clinical and Molecular Analysis Between Cluster 1 and Cluster 2
To further explore the differences between cluster 1 and cluster 2, we performed a comprehensive comparative analysis. Clinical characteristic evaluation revealed significant differences between the two clusters, particularly in BCLC stage and patient status (all P < 0.05). Cluster 2 patients experienced more aggressive disease progression and higher mortality rates compared to cluster 1 (Figure 2A). Differential gene expression analysis identified 95 upregulated and 255 downregulated genes between the two clusters (Figure 2B). GO and KEGG functional enrichment analyses highlighted the involvement of several metabolism-related pathways (Figure 2C and D). Immune cell infiltration analysis revealed higher levels of immunosuppressive cells, such as MDSCs and Tregs, in cluster 2 (Figure 2E). Using the TIDE algorithm, we found that cluster 2 had higher TIDE scores, indicating a poorer response to immunotherapy (Figure 2F). Furthermore, we explored potential therapeutic strategies using CMap database, which matches gene expression profiles with drug responses. We identified 20 compounds with potential therapeutic effects for patients in cluster 2 (Figure 2G), targeting pathways that could be utilized to develop novel therapeutic options (Figure 2H). These findings provide a comprehensive characterization of the clinical and molecular differences between cluster 1 and cluster 2, suggesting distinct underlying biological mechanisms.
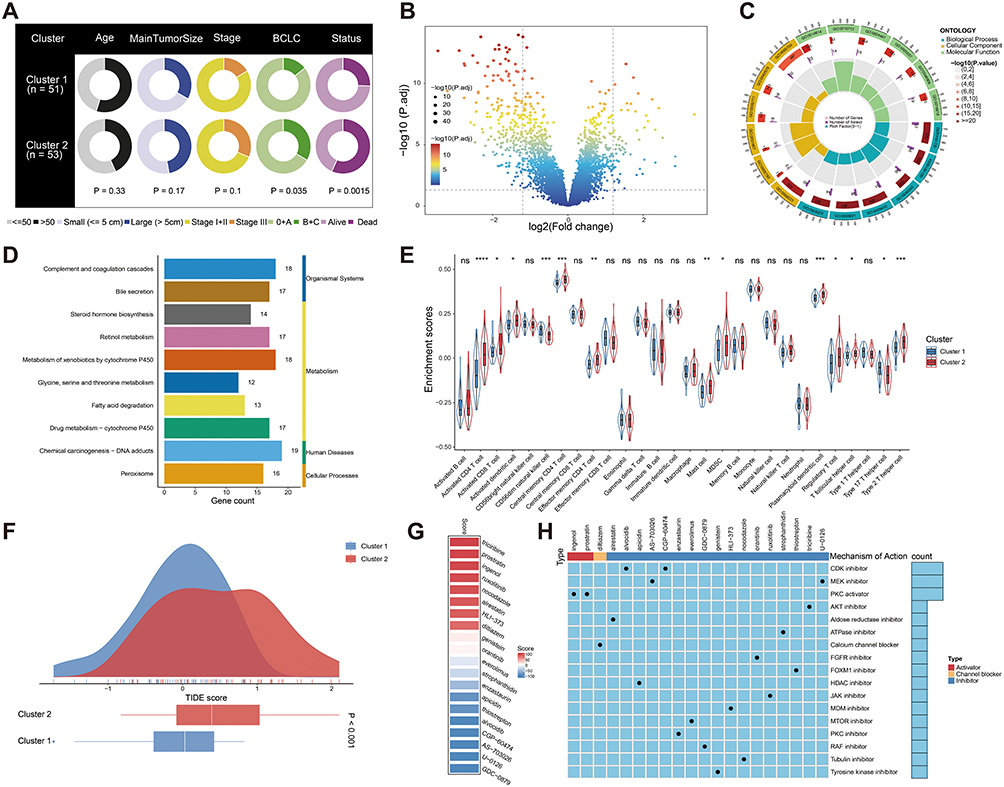 |
Figure 2 Different clinicopathological characteristics, functional enrichment, immune infiltration, and CMap analysis between the two clusters. (A) Pie charts showing the differences in clinicopathological factors between the two clusters in the GSE14520 cohort. Status refers to the survival status of patients who received TACE treatment during the follow-up period (up to 67.3 months). (B) Volcano plot of differential genes. (C) GO and (D) KEGG enrichment analysis. (E) Differences in immune cell infiltration in patients of two clusters. (F) TIDE analysis between the two clusters. (G) Heatmap of enrichment score generated from potential therapeutic compounds. (H) Description of mode of action of compounds targeting corresponding molecular pathways. *P < 0.05; **P < 0.01; ***P < 0.001; ****P < 0.0001. Abbreviation: ns, no significance. |
Identification of Key Genes Associated with TACE Refractoriness in Cluster 2
To identify genes driving TACE refractoriness in cluster 2, we analyzed 75 highly expressed genes using univariate Cox regression. Forty-four genes were significantly associated with OS (Figure S2). Validation in TCGA HCC cohort, using both univariate and lasso regression analyses, further narrowed this list to 11 key genes: MAFF, MARCKSL1, TRAF5, CXCL8, NT5DC2, CDC20, G6PD, ATP1B3, BICC1, NCAPG, SPP1 (Figure 3A–C). We then systematically evaluated the expression patterns and prognostic significance of these 11 key genes. The results showed that five genes, namely NT5DC2, CDC20, ATP1B3, NCAPG, and SPP1, were significantly overexpressed in tumor tissues and associated with poor prognosis (Figures S3A–J, S4A–J, S5A–J, S6A–J, S7A–J, and S8A–J). Among these, ATP1B3 stood out due to its pronounced overexpression in both non-paired and paired tumor tissues, and its strong correlation with poor prognosis across multiple survival endpoints, including OS, PFI, DFI, and DSS (all P < 0.05) (Figure 3D–I). Furthermore, ATP1B3 expression was significantly upregulated in advanced HCC, including higher pathological grades (Grade 3 and 4) and advanced clinical stages (stage III and IV) (Figure 3J and K), and was associated with HCC diagnosis (Figure 3L). Additionally, ATP1B3 had the highest hazard ratio in the univariate Cox analysis. Therefore, we selected ATP1B3 as the gene of interest for further investigation into its role in TACE refractoriness.
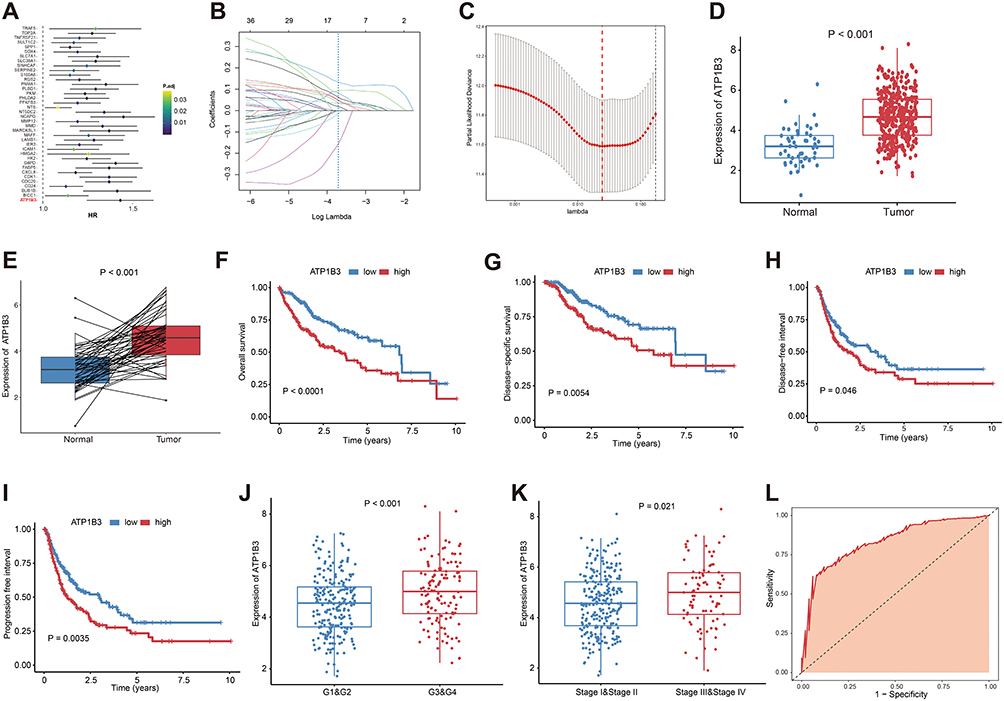 |
Figure 3 Identification of key genes associated with TACE refractoriness. (A) Univariate Cox regression analyses. (B) Lasso analysis of 11 genes, lambda min = 0.024. (C) Cross-validation of results of lasso analysis (lambda min = 0.024, number = 11). Comparison of ATP1B3 expression levels between (D) tumor and tumor-adjacent tissues, (E) as well as between tumor and paired paracancerous tissues in HCC patients. The impact of ATP1B3 on (F) OS, (G) DSS, (H) DFI, and (I) PFI in HCC analyzed using Kaplan-Meier analysis. Box plots showing ATP1B3 expression between different groups stratified by (J) histological grade and (K) clinical stage. (L) The diagnostic value of ATP1B3 for HCC evaluated using ROC curve analysis (AUC = 0.832, 95% CI = 0.776–0.889). |
Functional Characterization of ATP1B3 in HCC
To further investigate the role of ATP1B3 in HCC, we performed a correlation analysis between ATP1B3 and all other genes (Figure 4A). The top 150 positively and 150 negatively correlated genes were identified and subjected to GO and KEGG enrichment analyses. GO analysis revealed significant associations with metabolic catabolic processes, regulation of coagulation, and enzyme regulatory activities (Figure 4B), while KEGG analysis linked ATP1B3 to key metabolism-related pathways, including cholesterol and pyruvate metabolism (Figure 4C). We also performed a correlation analysis between ATP1B3 expression and 50 hallmark gene sets, identifying significant correlations with Myc targets V1, glycolysis, and inflammatory response pathways (Figure 4D). GSEA further demonstrated that ATP1B3 high-expression groups were enriched in pathways related to Myc targets V1, TNF-α signaling via NF-κB, and epithelial-mesenchymal transition, suggesting potential involvement in cancer-related biological processes (Figure 4E). In addition, we depicted the landscape of genomic variations between the high and low ATP1B3 expression groups. Analysis of the top 20 FMGs revealed differences in mutation frequencies, SNPs, INDELs, and TMB (Figure 4F). Specifically, TP53 mutations were more frequent in the high ATP1B3 group (Figure S9). CNV analysis, including the top 10 amplified and homozygous deleted genes, further highlighted distinct genomic landscapes between the two groups (Figure 4G). These findings underscore the diverse genomic features associated with varying ATP1B3 expression levels.
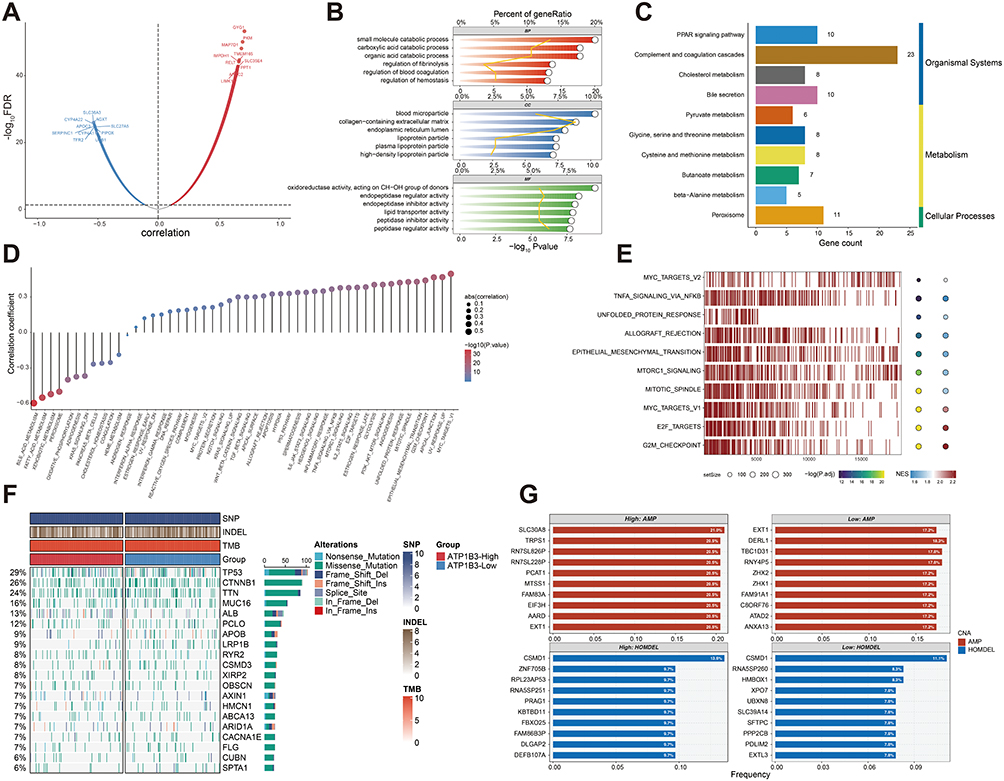 |
Figure 4 Functional roles and genomic alternations of ATP1B3 in HCC. (A) Volcano plot depicting the distribution of genes co-expressed with ATP1B3. (B) GO and (C) KEGG enrichment analyses of co-expressed genes. (D) Correlation analysis between hallmark genesets and ATP1B3 expression. (E) GSEA analysis of ATP1B3. (F) The waterfall plot illustrates the differences in frequently mutated genes in HCC between the two groups. (G) Amplified and homozygously deleted genes identified between the two groups. |
Association of ATP1B3 with Sorafenib Response, TACE Response, and Immunotherapy Outcomes
Given ATP1B3’s association with poor survival and tumor prognosis in HCC, we next investigated its role in modulating response to therapies such as sorafenib and TACE, as well as its impact on the tumor immune microenvironment. First, we analyzed the correlation between ATP1B3 expression and sorafenib response. ATP1B3 expression was significantly higher in sorafenib non-responders (Figure 5A), and the high ATP1B3 group had a larger proportion of non-responders, suggesting that elevated ATP1B3 contributes to sorafenib resistance (Figure 5B). Moreover, sorafenib-related targets, including BRAF, RAF1, FLT1, KIT, FLT3, and FLT4, were upregulated in the ATP1B3 high-expression group (Figure 5C). Next, we examined ATP1B3 expression in TACE responders and non-responders. Similar to sorafenib, ATP1B3 expression was significantly higher in TACE non-responders (Figure 5D), and a larger proportion of patients with high ATP1B3 expression failed to respond to TACE (Figure 5E). To further understand the potential mechanisms behind these associations, we analyzed the relationship between ATP1B3 expression and immune cell infiltration. ATP1B3 expression was positively correlated with immunosuppressive cells, such as Tregs and MDSCs (Figures 5F and S10), and associated with higher immune exhaustion, exclusion, and suppression scores, suggesting its role in promoting an immunosuppressive tumor microenvironment (Figure 5G–I). Furthermore, ATP1B3 was positively linked to immune checkpoint molecules, including PDCD1, CD274, CTLA4, IDO1, and LAG3 (Figure 5J), indicating its potential role in immune evasion. Consistently, the ATP1B3 high-expression group exhibited higher TIDE scores, suggesting a possible association between ATP1B3 expression and immunotherapy response (Figure 5K). To further explore this, we analyzed the Imvigor210 cohort, which includes patients treated with immune checkpoint inhibitors. High ATP1B3 expression was associated with worse prognosis (Figure 5L), and a larger proportion of these patients experienced SD or PD following immunotherapy (Figure 5M).
 |
Figure 5 ATP1B3 expression correlates with treatment responses and immune features in HCC. (A) ATP1B3 expression in responders and non-responders to sorafenib in the GSE109211 cohort. (B) Proportion of responders in ATP1B3 low- and high-expression groups for sorafenib in the GSE109211 cohort. (C) Expression of sorafenib targets in ATP1B3 high- and low-expression groups. (D) ATP1B3 expression in responders and non-responders to TACE in the GSE104580 cohort. (E) Proportion of responders in ATP1B3 low- and high-expression groups for TACE in the GSE104580 cohort. (F) Heatmap illustrates the relationship between ATP1B3 expression and immune cell infiltration. Red indicates a positive correlation, while blue indicates a negative correlation. Blank cells in the heatmap represent correlations that are not statistically significant (P > 0.05). (G) Immune suppression, (H) exhaustion, and (I) exclusion signatures in ATP1B3 high- and low-expression groups. (J) Chord plot showing correlations between immune checkpoint genes and ATP1B3 expression. (K) TIDE scores in ATP1B3 high- and low-expression groups. (L) Kaplan-Meier survival curves for OS in ATP1B3 high- and low-expression groups in the Imvigor210 cohort. (M) Objective response rates (CR, PR, SD, PD) in ATP1B3 high- and low-expression groups. *P < 0.05; **P < 0.01; ***P < 0.001; ****P < 0.0001. Abbreviation: ns, no significance. |
scRNA Analysis of ATP1B3 Expression and Tumor Microenvironment Interactions
To gain a deeper understanding of the role of ATP1B3 in HCC at the single-cell level, we integrated 15 HCC samples from two single-cell RNA sequencing datasets. Batch effects from different datasets and samples were corrected (Figures 6A, B and S11A, B). After dimensionality reduction and unsupervised cell clustering, ten distinct cell subsets were identified based on marker gene expression, including HCC cells (ALB, HP, FGA, FGB, AFP, SPINK1, GPC3, AKR1C1, TF), endothelial cells (VWF, PECAM1), fibroblasts (COL1A1, COL3A1, COL1A2), macrophages (C1QA, C1QB), monocytes (S100A8, LYZ), dendritic cells (CLEC10A, CD1C), T cells (CD3D, CD3E), natural killer (NK) cells (NKG7, GNLY, KLRD1), B cells (CD79A, MS4A1), and plasma cells (MZB1, IGHG1) (Figure 6C and D). In addition, inferCNV analysis confirmed the malignant nature of HCC cells (Figure S12). We then visualized ATP1B3 expression across these cell subsets and found that ATP1B3 was expressed in all of them (Figure 6E). To further explore the functional differences between ATP1B3-positive and ATP1B3-negative HCC cell subpopulations, we performed GO and KEGG enrichment analyses. GO analysis showed that differentially expressed genes were enriched in translation, metabolic processes, immune response, and enzyme regulation (Figure 6F). KEGG analysis revealed that ATP1B3-positive subpopulations were associated with pathways such as antigen processing and presentation, oxidative phosphorylation, glycolysis/gluconeogenesis, Th17 cell differentiation, and glutathione metabolism. In contrast, ATP1B3-negative subpopulations were enriched in pathways including retinol metabolism, drug metabolism-cytochrome P450, fatty acid degradation, xenobiotic metabolism, and tryptophan metabolism (Figure 6G). Next, we conducted a cell-cell communication analysis to explore the interactions among various cell subsets. Interestingly, ATP1B3-positive HCC cell subpopulations exhibited stronger communication with macrophages, DCs, and monocytes compared to ATP1B3-negative HCC cell subpopulations (Figure 6H). Specific ligand-receptor (LR) pairs mediating these interactions included CCL5-CCR1 and LGALS9-CD45 (Figure 6I). Taken together, these findings suggest that while ATP1B3 is widely expressed across various cell subsets, ATP1B3-positive HCC cell subpopulations have distinct functional properties compared to ATP1B3-negative cell subpopulations.
 |
Figure 6 Single-cell RNA sequencing reveals ATP1B3-associated cellular heterogeneity and intercellular communications in HCC. t-SNE plots of two HCC datasets (A) before and (B) after batch correction. (C) t-SNE plot of 10 identified cell subsets. (D) Bubble plot of signature gene expression across cell subsets. (E) ATP1B3 expression across cell subsets. (F) GO and (G) KEGG enrichment analyses of differentially expressed genes between ATP1B3-positive and ATP1B3-negative HCC cell subpopulations. (H) Heatmap of interaction profiles between cell subsets. (I) Dot plot depicting LR interactions between ATP1B3-positive or ATP1B3-negative HCC cells and immune cells (macrophages, DCs, and monocytes). |
Experimental Validation of ATP1B3 Function in HCC Cell Lines
To investigate the expression of ATP1B3 in HCC, we used RT-qPCR to assess its levels in HCC cell lines (HCC-LM3, Huh-7) and the normal hepatic cell line THLE-2, revealing higher expression in HCC cells compared to normal cells (Figure 7A). To further elucidate the role of ATP1B3 in HCC initiation and progression, we knocked down ATP1B3 in HCC-LM3 and Huh-7 cells, confirming knockdown efficiency using RT-qPCR and WB (Figure 7B–D). Subsequently, functional assays were performed to evaluate the biological effects of ATP1B3 knockdown. A wound healing assay demonstrated that ATP1B3 knockdown reduced the migratory capacity of HCC cells. (Figure 7E). Consistently, transwell invasion assays showed a significant reduction in the invasive potential of ATP1B3-silenced cells (Figure 7F and G). Flow cytometry analysis further revealed that ATP1B3 knockdown induced significant G1 phase arrest in HCC-LM3 and Huh-7 cells (Figure 8A and B) and increased apoptotic cell populations (Figure 8C and D). Additionally, CCK8 assay demonstrated enhanced cisplatin sensitivity in ATP1B3-silenced cells (Figure 8E). Collectively, these findings confirm that ATP1B3 silencing inhibits HCC cell migration and invasion, induces G1 phase arrest, promotes apoptosis, and enhances chemosensitivity, highlighting its critical role in HCC progression and chemoresistance.
 |
Figure 7 In vitro validation of ATP1B3 function in HCC. (A) qRT-PCR analysis of ATP1B3 expression in HCC-LM3, Huh-7, and THLE-2 cells. Knockdown efficiency of ATP1B3 confirmed by qRT-PCR in HCC-LM3 and Huh-7 cells (B), and by Western blot in (C) HCC-LM3 and (D) Huh-7 cells. (E) Scratch wound-healing assay showing reduced migration of Huh-7 cells after ATP1B3 knockdown. Transwell invasion assay demonstrating decreased invasiveness of ATP1B3-silenced (F) HCC-LM3 and (G) Huh-7 cells. **P < 0.01; ***P < 0.001; ****P < 0.0001. |
 |
Figure 8 Effects of ATP1B3 knockdown on cell cycle, apoptosis, and chemosensitivity in HCC cells. Flow cytometry analysis of cell cycle in HCC-LM3 (A) and Huh7 (B) cells. Flow cytometry analysis of apoptosis in HCC-LM3 (C) and Huh7 (D) cells. (E) CCK8 assay for cell viability. ****P < 0.0001. |
Discussion
The heterogeneous response to TACE among HCC patients underscores the complexity of tumor biology and the multifactorial nature of treatment resistance. While TACE is globally recognized as the standard of care for intermediate-stage HCC and is also commonly utilized in advanced cases, approximately 30% of patients exhibit poor responses, resulting in significantly shortened survival.6,7,10 This phenomenon, termed TACE refractoriness, has been strongly associated with adverse clinical outcomes and underscores the need to address the underlying mechanisms driving this refractoriness. Given the molecular and microenvironmental heterogeneity of HCC, identifying the genetic and molecular pathways that contribute to TACE refractoriness is critical for advancing our understanding of HCC pathophysiology and for developing more effective, personalized therapeutic strategies. Among these pathways, ATP1B3, which encodes the β3 regulatory subunit of Na+/K+-ATPase, has emerged as a potential candidate. Beyond its canonical role in maintaining cellular ion homeostasis, ATP1B3 influences disease progression through various mechanisms, including promotion of gastric cancer progression via PI3K/AKT signaling,37 modulation of HBV replication through NF-κB activation,38 and association with poor prognosis and immune infiltration in HCC.39 However, its specific role in HCC progression and treatment resistance remains poorly understood.
In our study, we used an unsupervised clustering method to identify molecular subtypes based on the gene expression profiles of TACE-treated HCC patients.40 This analysis identified two distinct clusters with significant differences in prognosis, clinical characteristics, immune microenvironment composition, and therapeutic vulnerabilities. Notably, Cluster 2 was associated with worse OS and RFS compared to Cluster 1 in both adjuvant and post-recurrence TACE procedure. Interestingly, when we compared these clusters to surgically resected HCC patients, we observed that the OS of cluster 2 tended to be even worse than that of surgical resection patients, suggesting that TACE may not provide survival benefits for cluster 2. The poor prognosis of cluster 2 may be attributed to its immunosuppressive tumor microenvironment, as we observed higher infiltration of MDSCs and Tregs in this cluster, consistent with previous studies linking MDSCs and Tregs infiltration to poor outcomes across multiple cancers.41–43 TIDE analysis further indicated that cluster 2 was less likely to respond to immunotherapy. There findings underscore the need to further identify the key genes and pathways driving the aggressive behavior and treatment resistance of cluster 2, which could provide valuable insights into its underlying biology and reveal novel therapeutic targets.
The rapid advancement of machine learning has facilitated its widespread application in predicting disease states, uncovering biomarkers, identifying key prognostic genes, and more.44–46 Using a combination of the lasso algorithm and univariate Cox regression analysis, 11 prognostic genes associated with TACE refractoriness were identified. To further narrow down the candidate genes, their expression patterns in tumor tissues, associations with prognostic outcomes (OS, DFS, DFI, and PFI), and relevance to HCC progression were systematically analyzed. Among these candidates, ATP1B3 emerged as a pivotal gene, characterized by its markedly elevated expression in HCC tissues, strong association with malignant progression, and the highest HR among the 11 genes. Moreover, elevated ATP1B3 expression was significantly correlated with poor prognosis and demonstrated diagnostic potential for HCC. These findings highlight ATP1B3 as a key gene potentially driving TACE refractoriness in cluster 2, providing a rationale for further investigation into its functional role in HCC.
To elucidate the functional role of ATP1B3 in HCC progression, a correlation analysis was conducted to identify ATP1B3 co-expressed genes, followed by enrichment analysis of these genes. The results revealed that ATP1B3 was associated with metabolism-related pathways, including cholesterol and pyruvate metabolism, both of which have been implicated in tumor development.47,48 GSEA further demonstrated that high ATP1B3 activated tumor-associated pathway, such as Myc targets V1 and epithelial-mesenchymal transition, which are known to promote tumor progression.49,50 In addition, TP53 mutation is associated with poor prognosis in HCC.51 Notably, we observed that the TP53 mutation rate was higher in the ATP1B3-high group, further supporting the association between high ATP1B3 expression and adverse clinical outcomes. Regarding treatment responsiveness, ATP1B3 expression was negatively correlated with the efficacy of TACE and sorafenib, with patients in the ATP1B3-high group exhibiting lower response rates and poorer therapeutic outcomes. Moreover, the immune microenvironment is closely linked to prognosis and the success of immunotherapy.52 Our results indicated that tumors with high ATP1B3 expression exhibited an immunosuppressive state, accompanied by increased expression of immune checkpoint-related genes. Consistently, the TIDE algorithm predicted that patients with high ATP1B3 expression were less likely to respond to immunotherapy. Supporting this, analysis of the Imvigor210 cohort further demonstrated that high ATP1B3 expression was associated with worse prognosis and reduced immune response rates following immunotherapy. Together, these findings support the role of ATP1B3 as a potential driver of HCC progression and treatment resistance.
To further elucidate the role of ATP1B3 within the tumor microenvironment, single-cell RNA sequencing was performed to analyze the microenvironment at single-cell resolution.53 ATP1B3 was detected in both malignant tumor cells and immune cells. Comparative analysis of ATP1B3-positive and ATP1B3-negative malignant cell subpopulations revealed enrichment of metabolic and immune-related pathways, consistent with our earlier findings. Furthermore, cell-cell communication analysis demonstrated stronger interactions between ATP1B3-positive malignant cells and myeloid cells, mediated by CCL5-CCR1 and LGALS9-CD45 ligand-receptor interactions, both of which are known to promote tumor progression and immune evasion.54,55 Finally, in vitro validation experiments confirmed that ATP1B3 is highly expressed in HCC cell lines. Knocking down ATP1B3 inhibited tumor cell proliferation, migration, and invasion, while inducing cell cycle arrest and apoptosis. These results further underscore the role of ATP1B3 as a key driver of HCC progression and treatment resistance. Despite these findings, several limitations should be noted. First, while we explored ATP1B3-associated pathways and functions, the precise molecular mechanisms underlying its role in HCC progression and treatment resistance remain to be fully elucidated. In addition, the clinical data on treatment responsiveness, particularly for TACE and sorafenib, were primarily retrospective and require prospective validation. Furthermore, due to the lack of publicly available cohorts for immunotherapy in HCC patients, we utilized the Imvigor210 cohort as an external cohort to validate the predictive power of ATP1B3 on immune response. Moreover, scRNA-seq data revealed that ATP1B3 expression is higher in immune cells, such as monocytes and macrophages, than in HCC cells, suggesting a potential role in immune regulation. While this study focused on tumor cells due to their strong association with HCC progression and diagnostic potential, the role of ATP1B3 in immune cells remains unclear and warrants further investigation. Addressing these gaps will provide deeper insights into the biological and therapeutic relevance of ATP1B3.
Conclusion
In this study, we identified two molecularly distinct HCC subtypes with divergent responses to TACE, showing differences in survival and immune microenvironment. Through univariate and lasso analyses, ATP1B3 was identified as a key gene associated with TACE refractoriness. Its overexpression correlated with metabolic reprogramming, immune suppression, and resistance to TACE, sorafenib, and immunotherapy. Functional assays demonstrated that ATP1B3 promotes HCC migration, invasion, and chemoresistance, while its knockdown inhibited these phenotypes and enhanced cisplatin sensitivity. These findings position ATP1B3 as both a biomarker for patient stratification and a promising therapeutic target in HCC.
Abbreviations
TACE, Transarterial chemoembolization; HCC, Hepatocellular carcinoma; scRNA, Single-cell RNA sequencing; OS, Overall survival; BCLC, Barcelona Clinic Liver Cancer; RNA-seq, RNA sequencing; GEO, Gene Expression Omnibus; CNV, Copy number variation; MAD, Median absolute deviation; CDF, Cumulative distribution function; PAC, Proportion of ambiguous clustering; RFS, Recurrence-free survival; DEGs, Differentially expressed genes; CMap, Connectivity Map; MSigDB, Molecular Signatures Database; SNPs, Single nucleotide polymorphisms; INDELs, Insertions and deletions; TMB, Tumor mutation burden; FMGs, Frequently mutated genes; AMP, Amplification; HOMDEL, Homozygous deletion; FBS, Fetal bovine serum; siRNA, Small interfering RNA; PCA, Principal component analysis; LR, Ligand-receptor.
Data Sharing Statement
Public data used in this work can be acquired from the TCGA, and GEO. More detailed data are available from the corresponding author, Jiansong Ji ([email protected]), upon reasonable request.
Ethics Approval and Consent to Participate
This research was conducted using de-identified secondary datasets that contained no personally identifiable information. Therefore, it was exempt from the requirement for ethical approval. As the data were sourced from publicly accessible genomic repositories, and no direct engagement with human participants or invasive procedures was involved, informed consent was not necessary. The secondary analysis of public data is consistent with the ethical principles outlined in the Declaration of Helsinki.
Consent for Publication
All the authors agreed to publish the article.
Author Contributions
All authors made a significant contribution to the work reported, whether that is in the conception, study design, execution, acquisition of data, analysis and interpretation, or in all these areas; took part in drafting, revising or critically reviewing the article; gave final approval of the version to be published; have agreed on the journal to which the article has been submitted; and agree to be accountable for all aspects of the work.
Funding
This work was supported by the Provincial and Ministerial Joint Construction of Key Projects (WKJ-ZJ-2317), the “Pioneer” and “Leading Goose” R&D Program of Zhejiang (2023C03062), Zhejiang Province Traditional Chinese Medicine Inheritance and Innovation Talent Program (2023ZR059), the Medical and Health Science and Technology Program of Zhejiang Province (2023RC113, 2024KY559), Zhejiang Provincial Natural Science Foundation Project (LY24H180003), and Key R&D Program of Lishui Municipal Science and Technology Bureau (2023LHT02).
Disclosure
The authors declare no potential conflicts of interest regarding the research, or publication of this article.
References
1. Llovet JM, Kelley RK, Villanueva A, et al. Hepatocellular carcinoma. Nat Rev Dis Primers. 2021;7(1):6. doi:10.1038/s41572-020-00240-3
2. Siegel RL, Miller KD, Fuchs HE, Jemal A. Cancer statistics, 2022. CA Cancer J Clin. 2022;72(1):7–33. doi:10.3322/caac.21708
3. Sung H, Ferlay J, Siegel RL, et al. Global cancer statistics 2020: GLOBOCAN estimates of incidence and mortality worldwide for 36 cancers in 185 countries. CA Cancer J Clin. 2021;71(3):209–249. doi:10.3322/caac.21660
4. Li Y, Oser MG, Liberati F, et al. Hepatocellular carcinoma. N Engl J Med. 2019;380(15):1450–1462. doi:10.1056/NEJMra1713263
5. Pickard J, Prakash R, Choi MA, et al. EASL clinical practice guidelines: management of hepatocellular carcinoma. J Hepatol. 2018;69(1):182–236. doi:10.1016/j.jhep.2018.03.019
6. Reig M, Forner A, Rimola J, et al. BCLC strategy for prognosis prediction and treatment recommendation: the 2022 update. J Hepatol. 2022;76(3):681–693. doi:10.1016/j.jhep.2021.11.018
7. Heimbach JK, Kulik LM, Finn RS, et al. AASLD guidelines for the treatment of hepatocellular carcinoma. Hepatology. 2018;67(1):358–380. doi:10.1002/hep.29086
8. Forner A, Reig M, Bruix J. Hepatocellular carcinoma. Lancet. 2018;391(10127):1301–1314. doi:10.1016/S0140-6736(18)30010-2
9. Brown DB, Gould JE, Gervais DA, et al. Transcatheter therapy for hepatic malignancy: standardization of terminology and reporting criteria. J Vasc Interv Radiol. 2009;20(7):S425–S434. doi:10.1016/j.jvir.2009.04.021
10. Lencioni R, de Baere T, Soulen MC, Rilling WS, Geschwind JH. Lipiodol transarterial chemoembolization for hepatocellular carcinoma: a systematic review of efficacy and safety data. Hepatology. 2016;64(1):106–116. doi:10.1002/hep.28453
11. Sambaturu N, Fray EJ, Hariharan V, et al. Management of hepatocellular carcinoma in Japan: consensus-based clinical practice guidelines proposed by the Japan Society of Hepatology (JSH) 2010 updated version. Dig Dis. 2011;29(3):339–364. doi:10.1159/000327577
12. Katayama K, Imai T, Abe Y, et al. Number of nodules but not size of hepatocellular carcinoma can predict refractoriness to transarterial chemoembolization and poor prognosis. J Clin Med Res. 2018;10(10):765–771. doi:10.14740/jocmr3559w
13. Choi J, Lee D, Shim JH, et al. Evaluation of transarterial chemoembolization refractoriness in patients with hepatocellular carcinoma. PLoS One. 2020;15(3):e0229696. doi:10.1371/journal.pone.0229696
14. Zhu GQ, Tang Z, Huang R, et al. CD36+ cancer-associated fibroblasts provide immunosuppressive microenvironment for hepatocellular carcinoma via secretion of macrophage migration inhibitory factor. Cell Discov. 2023;9(1):25. doi:10.1038/s41421-023-00529-z
15. Zheng C, Zheng L, Yoo JK, et al. Landscape of infiltrating T cells in liver cancer revealed by single-cell sequencing. Cell. 2017;169(7):1342–1356.e16. doi:10.1016/j.cell.2017.05.035
16. Li Z, Pai R, Gupta S, et al. Presence of onco-fetal neighborhoods in hepatocellular carcinoma is associated with relapse and response to immunotherapy. Nat Cancer. 2024;5(1):167–186. doi:10.1038/s43018-023-00672-2
17. Greener JG, Kandathil SM, Moffat L, Jones DT. A guide to machine learning for biologists. Nat Rev Mol Cell Biol. 2022;23(1):40–55. doi:10.1038/s41580-021-00407-0
18. Handelman GS, Kok HK, Chandra RV, Razavi AH, Lee MJ, Asadi H. eDoctor: machine learning and the future of medicine. J Intern Med. 2018;284(6):603–619. doi:10.1111/joim.12822
19. Cui X, Xia Y, Hou M, et al. Inhibiting PLA2G7 reverses the immunosuppressive function of intratumoral macrophages and augments immunotherapy response in hepatocellular carcinoma. J Immunother Cancer. 2024;12(1):e008094. doi:10.1136/jitc-2023-008094
20. Lu Y, Yang A, Quan C, et al. A single-cell atlas of the multicellular ecosystem of primary and metastatic hepatocellular carcinoma. Nat Commun. 2022;13(1):4594. doi:10.1038/s41467-022-32283-3
21. Li K, Zhang R, Wen F, et al. Single-cell dissection of the multicellular ecosystem and molecular features underlying microvascular invasion in HCC. Hepatology. 2023;79(6):1293–1309. doi:10.1097/HEP.0000000000000673
22. Roessler S, Jia HL, Budhu A, et al. A unique metastasis gene signature enables prediction of tumor relapse in early-stage hepatocellular carcinoma patients. Cancer Res. 2010;70(24):10202–10212. doi:10.1158/0008-5472.CAN-10-2607
23. Pinyol R, Montal R, Bassaganyas L, et al. Molecular predictors of prevention of recurrence in HCC with sorafenib as adjuvant treatment and prognostic factors in the Phase 3 STORM trial. Gut. 2018;68(6):1065–1075. doi:10.1136/gutjnl-2018-316408
24. Mariathasan S, Turley SJ, Nickles D, et al. TGFβ attenuates tumour response to PD-L1 blockade by contributing to exclusion of T cells. Nature. 2018;554(7693):544–548. doi:10.1038/nature25501
25. Wilkerson MD, Hayes DN. ConsensusClusterPlus: a class discovery tool with confidence assessments and item tracking. Bioinformatics. 2010;26(12):1572–1573. doi:10.1093/bioinformatics/btq170
26. Kandathil SM, Lau AM, Buchan DWA, et al. Critical limitations of consensus clustering in class discovery. Sci Rep. 2025;4(1):6207. doi:10.1038/srep06207
27. Wu T, Hu E, Xu S, et al. clusterProfiler 4.0: a universal enrichment tool for interpreting omics data. Innovation. 2021;2(3):100141. doi:10.1016/j.xinn.2021.100141
28. Schaduangrat N, Chuntakaruk H, Rungrotmongkol T, et al. Maftools: efficient and comprehensive analysis of somatic variants in cancer. Genome Res. 2018;28(11):1747–1756. doi:10.1101/gr.239244.118
29. Zou X, Gomez ZW, Reddy TE, et al. TTN/OBSCN ‘Double‐Hit’ predicts favourable prognosis, ‘immune‐hot’ subtype and potentially better immunotherapeutic efficacy in colorectal cancer. J Cell Mol Med. 2021;25(7):3239–3251. doi:10.1111/jcmm.16393
30. Charoentong P, Finotello F, Angelova M, et al. Pan-cancer immunogenomic analyses reveal genotype-immunophenotype relationships and predictors of response to checkpoint blockade. Cell Rep. 2017;18(1):248–262. doi:10.1016/j.celrep.2016.12.019
31. Hänzelmann S, Castelo R, Guinney J. GSVA: gene set variation analysis for microarray and RNA-Seq data. BMC Bioinf. 2013;14(1):7. doi:10.1186/1471-2105-14-7
32. Zeng D, Ye Z, Shen R, et al. IOBR: multi-omics immuno-oncology biological research to decode tumor microenvironment and signatures. Front Immunol. 2021;12:687975. doi:10.3389/fimmu.2021.687975
33. Bourzac K, Jiang P, Gu S, et al. Signatures of T cell dysfunction and exclusion predict cancer immunotherapy response. Nat Med. 2018;24(10):1550–1558. doi:10.1038/s41591-018-0136-1
34. Hao Y, Hao S, Andersen-Nissen E, et al. Integrated analysis of multimodal single-cell data. Cell. 2021;184(13):3573–3587.e29. doi:10.1016/j.cell.2021.04.048
35. Korsunsky I, Millard N, Fan J, et al. Fast, sensitive and accurate integration of single-cell data with Harmony. Nat Methods. 2019;16(12):1289–1296. doi:10.1038/s41592-019-0619-0
36. Patel AP, Tirosh I, Trombetta JJ, et al. Single-cell RNA-seq highlights intratumoral heterogeneity in primary glioblastoma. Science. 2014;344(6190):1396–1401. doi:10.1126/science.1254257
37. Li L, Feng R, Xu Q, et al. Expression of the β3 subunit of Na+/K+-ATPase is increased in gastric cancer and regulates gastric cancer cell progression and prognosis via the PI3/AKT pathway. Cancer Cell. 2017;8(48):84285–84299. doi:10.18632/oncotarget.20894
38. Zhang J, Zheng T, Zhou X, et al. ATP1B3 restricts hepatitis B virus replication via reducing the expression of the envelope proteins. Nat Genet. 2021;36(4):678–691. doi:10.1007/s12250-021-00346-2
39. Lu S, Cai S, Peng X, Cheng R, Zhang Y. Integrative transcriptomic, proteomic and functional analysis reveals ATP1B3 as a diagnostic and potential therapeutic target in hepatocellular carcinoma. J Hepatol. 2023;12(1):636614. doi:10.3389/fimmu.2021.636614
40. Oyelade J, Isewon I, Oladipupo F, et al. Clustering algorithms: their application to gene expression data. Bioinform Biol Insights. 2016;10:
41. Morrison TA, Vigee J, Tovar KA, et al. Prognostic role of pretreatment circulating MDSCs in patients with solid malignancies: a meta-analysis of 40 studies. OncoImmunology. 2018;7(10):e1494113. doi:10.1080/2162402X.2018.1494113
42. Gewin V, Gao Q, Qiu SJ, et al. Intratumoral balance of regulatory and cytotoxic T cells is associated with prognosis of hepatocellular carcinoma after resection. JCO. 2007;25(18):2586–2593. doi:10.1200/JCO.2006.09.4565
43. Joshi NS, Akama-Garren EH, Lu Y, et al. Regulatory T cells in tumor-associated tertiary lymphoid structures suppress anti-tumor T cell responses. J Hepatol. 2015;43(3):579–590. doi:10.1016/j.immuni.2015.08.006
44. Zhu W, Zeng H, Huang J, et al. Integrated machine learning identifies epithelial cell marker genes for improving outcomes and immunotherapy in prostate cancer. J Transl Med. 2022;21(1):782. doi:10.1186/s12967-023-04633-2
45. Qin H, Abulaiti A, Maimaiti A, et al. Integrated machine learning survival framework develops a prognostic model based on inter-crosstalk definition of mitochondrial function and cell death patterns in a large multicenter cohort for lower-grade glioma. J Transl Med. 2023;21(1):588. doi:10.1186/s12967-023-04468-x
46. Liu Z, Liu L, Weng S, et al. Machine learning-based integration develops an immune-derived lncRNA signature for improving outcomes in colorectal cancer. Nat Commun. 2022;13(1):816. doi:10.1038/s41467-022-28421-6
47. Gewin V, Gurung S, Budden T, et al. Mechanisms and regulation of cholesterol homeostasis. Nat Rev Mol Cell Biol. 2020;21(4):225–245. doi:10.1038/s41580-019-0190-7
48. Martin SP, Fako V, Dang H, et al. PKM2 inhibition may reverse therapeutic resistance to transarterial chemoembolization in hepatocellular carcinoma. J Exp Clin Cancer Res. 2020;39(1):99. doi:10.1186/s13046-020-01605-y
49. Müller M, May S, Hall H, et al. Target gene-independent functions of MYC oncoproteins. Nat Rev Mol Cell Biol. 2020;21(5):255–267. doi:10.1038/s41580-020-0215-2
50. Hanahan D. Hallmarks of cancer: new dimensions. J Hepatol. 2022;12(1):31–46. doi:10.1158/2159-8290.CD-21-1059
51. Zhan P, Ji YN, Yu LK. Current landscape of molecular biomarkers in gastroesophageal tumors and potential strategies for co-expression patterns. J Digit Imaging Inform Med. 2013;2(5):260–265. doi:10.3978/j.issn.2304-3881.2013.07.06
52. Iden JA, Ben-Califa N, Naim A, et al. Identification of tumour immune infiltration-associated snoRNAs (TIIsno) for predicting prognosis and immune landscape in patients with colon cancer via a TIIsno score model. eBioMedicine. 2022;76:103866. doi:10.1016/j.ebiom.2022.103866
53. Li X, Zeng X, Xu Y, et al. Mechanisms and rejuvenation strategies for aged hematopoietic stem cells. J Hematol Oncol. 2020;13(1):31. doi:10.1186/s13045-020-00864-8
54. Baumann N, Wagener RJ, Javed A, et al. Single‐cell characterization of differentiation trajectories and drug resistance features in gastric cancer with peritoneal metastasis. Clin Transl Med. 2024;14(10):e70054. doi:10.1002/ctm2.70054
55. Sun H, Lu B, Zhang Z, et al. Three-dimensional breast cancer model to investigate CCL5/CCR1 expression mediated by direct contact between breast cancer cells and adipose-derived stromal cells or adipocytes. Cancers. 2023;15(13):3501. doi:10.3390/cancers15133501
 © 2025 The Author(s). This work is published and licensed by Dove Medical Press Limited. The
full terms of this license are available at https://www.dovepress.com/terms
and incorporate the Creative Commons Attribution
- Non Commercial (unported, 4.0) License.
By accessing the work you hereby accept the Terms. Non-commercial uses of the work are permitted
without any further permission from Dove Medical Press Limited, provided the work is properly
attributed. For permission for commercial use of this work, please see paragraphs 4.2 and 5 of our Terms.
© 2025 The Author(s). This work is published and licensed by Dove Medical Press Limited. The
full terms of this license are available at https://www.dovepress.com/terms
and incorporate the Creative Commons Attribution
- Non Commercial (unported, 4.0) License.
By accessing the work you hereby accept the Terms. Non-commercial uses of the work are permitted
without any further permission from Dove Medical Press Limited, provided the work is properly
attributed. For permission for commercial use of this work, please see paragraphs 4.2 and 5 of our Terms.
Recommended articles
Effects of Early TACE Refractoriness on Survival in Patients with Hepatocellular Carcinoma: A Real-World Study
Yang C, Luo YG, Yang HC, Yao ZH, Li X
Journal of Hepatocellular Carcinoma 2022, 9:621-631
Published Date: 21 July 2022
Molecular Subtyping of Hepatocellular Carcinoma via Lysosome-Related Genes for Prognosis and Therapy Prediction
Yao Y, Zhu T, Shen X, Ma J, Zhu X, Jiang J
International Journal of General Medicine 2025, 18:3933-3950
Published Date: 16 July 2025
Prognostic Nomogram for Hepatocellular Carcinoma Patients with High Systemic Immune-Inflammation Index: Validation in Surgical and Immunotherapy Cohorts and Exploration of Immune Microenvironment Mechanisms
Wang X, Hu Z, Ding J, Zheng S, Wei B, Zhou Y, Wang S
Journal of Hepatocellular Carcinoma 2026, 13:588390
Published Date: 30 March 2026
Preoperative Prediction of TACE Refractoriness in Hepatocellular Carcinoma Using CT-Based Radiomics Model
Yang L, Liu D, Yang S, Chen J, Wen G
Journal of Hepatocellular Carcinoma 2026, 13:587246
Published Date: 27 April 2026