Back to Journals » Drug Design, Development and Therapy » Volume 17
Integrating Network Pharmacology and Experimental Validation to Explore the Effects and Mechanisms of Qinghao Biejia Decoction and Its Active Compound Artemisinin B Against Non-Small-Cell Lung Cancer
Authors Ye Y, Yang Y, Yan L, Zhou L ![]() , Yu S, Du Q, Dong X, Yuan Q, Shan L
, Yu S, Du Q, Dong X, Yuan Q, Shan L ![]() , Guo L
, Guo L
Received 7 April 2023
Accepted for publication 16 August 2023
Published 22 August 2023 Volume 2023:17 Pages 2461—2479
DOI https://doi.org/10.2147/DDDT.S414098
Checked for plagiarism Yes
Review by Single anonymous peer review
Peer reviewer comments 2
Editor who approved publication: Professor Jianbo Sun
Yonghua Ye,1 Yuping Yang,1 Li Yan,1 Li Zhou,2 Shihui Yu,1 Quan Du,3 Xiaoqiao Dong,3 Qiang Yuan,1 Letian Shan,2,4 Le Guo1
1College of Pharmaceutical Sciences, Zhejiang Chinese Medical University, Hangzhou, People’s Republic of China; 2The First Affiliated Hospital, Zhejiang Chinese Medical University, Hangzhou, People’s Republic of China; 3Department of Neurosurgery, Affiliated Hangzhou First People’s Hospital, Zhejiang University School of Medicine, Hangzhou, People’s Republic of China; 4Cell Resource Bank and Integrated Cell Preparation Center of Xiaoshan District, Hangzhou Regional Cell Preparation Center (Shangyu Biotechnology Co., Ltd), Hangzhou, People’s Republic of China
Correspondence: Letian Shan, The First Affiliated Hospital, Zhejiang Chinese Medical University, Hangzhou, People’s Republic of China, Tel +15355015568, Email [email protected] Le Guo, College of Pharmaceutical Sciences, Zhejiang Chinese Medical University, Hangzhou, People’s Republic of China, Tel +18986648306, Email [email protected]
Purpose: To explore the pharmacological effects and mechanisms of Qinghao Biejia decoction (QBD) against non-small-cell lung cancer (NSCLC) based on network pharmacology and to verify the anticancer effect of artemisinin B (ART B), the active ingredient of QBD, on H1299 cells.
Methods: Ultra-performance liquid chromatography coupled with quadrupole-time-of-flight mass spectrometry (UPLC-QTOF-MS/MS) was applied to explore the chemoprofile of QBD. A zebrafish xenograft model was used to determine the anti-cancer efficacy of QBD. Cell counting kit-8 assay, terminal deoxyribonucleotide transferase-mediated-dUTP nick-end labeling assay; immunofluorescence, and flow cytometry were used to evaluate the in vitro anti-proliferative and pro-apoptotic effects of QBD and ART B on H1299 cells. Subsequently, the related targets and action mechanisms of both QBD and ART B predicted by network pharmacological analyses were experimentally validated by real-time PCR and Western blot assays on H1299 cells.
Results: UPLC-QTOF-MS/MS identified a total of 69 compounds (such as ART B, mangiferin, and artemisinic acid) in QBD. The in vivo data showed that QBD significantly inhibited the growth of H1299 cells in xenograft larval zebrafish from 125 to 500 μg/mL. The in vitro data showed that QBD induced apoptosis of H1299 cells, accompanied by down-regulating the expression of BCL-2 and up-regulating the expression of BIM, PUMA, BAX, c-PARP, γ-H2A.X, c-CASP3, and c-CASP8. Alike QBD, ART B exerted similar anti-proliferative and pro-apoptotic effects on H1299 cells. Moreover, ART B inhibited expressions of BCL2L1, AKT1, AKT2, MMP-2, and EGFR, and up-regulated ALB expression. Mechanistically, ART B promoted apoptosis of H1299 cells by inhibiting PI3K/Akt signaling pathway.
Conclusion: This study revealed the anti-NSCLC efficacy of QBD. ART B, the effective component of QBD, plays an anti-NSCLC role by down-regulating the PI3K-Akt signaling pathway. It suggests that QBD and ART B are promising drug candidates for NSCLC treatment.
Keywords: Qinghao Biejia decoction, non-small-cell lung cancer, larval zebrafish, network pharmacology, artemisinin B
Graphical Abstract:

Introduction
Global cancer statistics in 2020 reported that lung cancer ranked at the forefront of all malignant tumors in China in terms of morbidity and mortality. The five-year survival of lung cancer in 2019 was 19.4%, and the morbidity of lung cancer has increased by 12.16% over the past decade.1–4 Non-small-cell lung cancer (NSCLC) accounts for about 80% of all lung cancer cases, and approximately 75% of patients develop into the advanced stage.3,5 Up to now, the current treatments of NSCLC include radiotherapy, surgical therapy, targeted therapy, and immunotherapy.6 However, their clinical efficacy is unsatisfactory and the prognosis is poor, because of the side effects of chemotherapy and immunotherapy, drug resistance of targeted therapy, and high recurrence rate of operation, which brings great challenges to the treatment of lung cancer.6
Traditional Chinese medicine (TCM) has a long history of treating various diseases with certain beneficial effects and few side effects, which have attracted increasing attention in recent years.7 Qinghao Biejia decoction (QBD) is a traditional Chinese herbal prescription composed of Artemisia annua L. (Qing Hao), Carapax Amydae (Bie Jia), Anemarrhena asphodeloides Bunge (Zhi Mu), Rehmannia Glutinosa (Sheng Di), Paeonia suffruticosa Andr. (Mu Dan Pi) with effects of antipyretic and detoxification, anti-inflammatory, nourishing and strong.8 Traditionally, QBD was used to clear away heat, eliminate toxins, and strengthen the body by TCM clinicians. According to the TCM theory, the body immunity is decreased due to the accumulation of heat and toxins, resulting in an increased risk of tumor growth, and the TCM formula capable of eliminating heat and toxins possesses anti-cancer activity.9 The herbs in QBD have therapeutic potential on lung cancer. For example, Artemisia annua L. exerts anti-NSCLC effects by slowing proliferation, inducing cell cycle arrest in G2/M cells and apoptosis;10 Rehmannia glutinosa polysaccharide can produce an anti-CT26 carcinoma effect by activating natural killer cells;11 timosaponin AIII, an active component with anti-tumor activity from Anemarrhena asphodeloides Bunge, can induce both autophagy and apoptosis of lung cancer cells.12 Notably, artemisinin B (ART B), a precursor of arteannuin from Artemisia annua L, was first used as antimalarial drugs.13 Modern pharmacological studies have shown that ART B exhibits strong anti-inflammatory and immunological activities in preliminary screening.13 It was also reported that ART B could inhibit the proliferation of HT-29, HepG2, SGC-7901, A549, K562, B16-F10, and Du145 cells, while having no obvious toxicity to normal human embryonic liver cells L-02.14 However, the anti-cancer effect and mechanism of both QBD and ART B on NSCLC are unknown, and the chemical basis of QBD action is also unclear.
In this study, ultra-performance liquid chromatography coupled with quadrupole-time-of-flight mass spectrometry (UPLC-Q/TOF-MS/MS) was employed to explore the chemoprofile of QBD. A xenograft model of larval zebrafish was used to determine the in vivo efficacy of QBD against NSCLC (H1299 cells). The cellular and molecular effects of both QBD and ART B on H1299 cells were in vitro studied. Moreover, network pharmacology analysis and experimental verification were applied to predict the potential material basis and mechanism of both QBD and ART B. This was the first study on the anti-NSCLC efficacy of both QBD and ART B by using network pharmacology analysis and experimental verification, which provided a promising candidate of TCM-based therapeutics for NSCLC.
Materials and Methods
Chemicals and Reagents
Artemisinic acid (HA062213) was purchased from Baoji Herbest Bio-Tech Co., Ltd (Baoji, China). Artemisinin B (ART B) (CFN98807-100MG) was purchased from ChemFaces (Wuhan, China). Insulin-like growth factor-1 (IGF-1) was acquired from Novoprotein (Shanghai, China). Formic acid and acetonitrile (LC-MS grade) were purchased from Fisher Scientific (Pittsburgh, PA, USA). Artemisia annua L. (Lot. No.201101), Carapax Amydae (Lot. No.201001), Rehmannia Glutinosa (Lot. No. 202101), Paeonia suffruticosa Andr. (Lot. No.210201), and Anemarrhena asphodeloides Bunge (Lot. No.201101) were obtained from Zhejiang Chinese Medical University Chinese Medicine Yinpian Co., Ltd. (Zhejiang, China). Roswell Park Memorial Institute (RPMI) 1640 and 0.25% trypsin were purchased from Gibco (NY, USA). Phosphate buffered saline (PBS) was purchased from Basal Media (Shanghai, China). Fetal bovine serum (FBS) was purchased from CellMax (Beijing, China). ProLong® Diamond Antifade Mountant with DAPI was purchased from Invitrogen (CA, USA). Cell Counting Kit 8 (CCK-8) was purchased from Bimake (Houston, USA). FITC-Annexin V apoptosis detection kit was purchased from BD Biosciences (NJ, USA). In situ cell death detection terminal deoxyribonucleotide transferase-mediated-dUTP nick-end labeling (TUNEL) kit was purchased from Roche Molecular Biochemical (Mannheim, Germany). TRIzol reagent and real-time polymerase chain reaction (real-time PCR) kits were purchased from TaKaRa Biotechnology Co., Ltd. (Dalian, China). Bicinchoninic acid (BCA) protein assay kit was purchased from Beyotime (Shanghai, China). Bovine serum albumin (BSA) was purchased from Sangon Biotech (Shanghai, China) Co., Ltd. Antibodies were purchased from Cell Signaling Technology (CST) Inc. (MA, USA), Sigma (MO, USA), and Abcam (MA, USA). CM-Dil dye was obtained from Molecular Probes (Leiden, the Netherlands). HPLC grade acetonitrile and methanol were purchased from Tedia Company (OH, USA). Ultrapure water was prepared by the Millipore Synergy system (MA, USA).
Preparation of QBD
QBD is composed of five herbs, including Artemisia annua L., Carapax Amydae, Anemarrhena asphodeloides Bunge, Rehmannia Glutinosa, and Paeonia suffruticosa. Andr. The dosage of herbs in QBD was listed in Table 1. The herbs were steeped in 500 mL distilled water and boiled at 100 °C for 1.5 h. After filtering the filtrate from the first decoction, the filtrates from the second and the third decoctions were obtained by successive boiling in distilled water at 100 °C for 1.5 h. The three filtrates were combined and concentrated with a rotary evaporator and then dried with a freeze dryer to obtain lyophilized powder for later use.
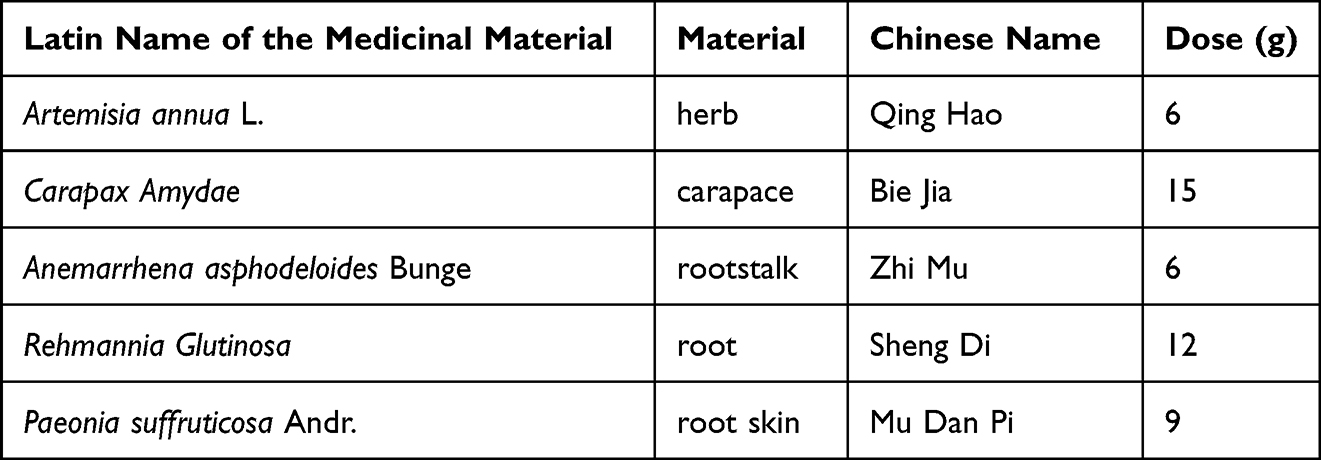 |
Table 1 Herbal Formula of QBD |
UPLC-Q/TOF-MS/MS Conditions
The UPLC and MS conditions have been developed and validated based on our previously reported protocols with some modifications.15 A Waters Acquity UPLC system (MA, USA) and a CORTECS® UPLC® C18 column (2.1 mm × 100 mm, 1.7 μm) were applied to the chromatographic separation of QBD. The mobile phase was composed of 0.1% formic acid water solution (mobile phase A) and acetonitrile (mobile phase B). The gradient elution conditions were as follows: 0–2 min, 5% B; 2–33 min, 5%-100% B; 33–33.5 min, 100%-5% B. The flow rate was 0.2 mL/min, the injection volume of the sample was 5 μL, and the column temperature was 40 °C.
A Waters Xevo QTS MS/MS (MA, USA) with an electron spray ionization (ESI) source was used for MS detection in both positive- and negative-ion modes. The optimized mass parameters were set as follows: full scan range: (m/z 100–1500), argon as collision gas, and nitrogen as nebulizer and heater gases (500 L/h). MS conditions were optimized as follows: capillary voltage (CE), 15–40 V, collision energy spread, 35 ± 15 eV, ion source temperature, 500 °C; desolvation temperature, 500 °C; and dwell time, 5 ms. During data collection, the screening was completed based on the exact mass number of compounds from QBD. The molecular formula was accurately set within a mass error of 5 ppm. Finally, we used several public MS online databases, including ChemSpider, SciFinder, and PubMed to identify the chemical compositions of QBD according to the primary and secondary MS data.
Cell Line and Culture
The human NSCLC H1299 cell line was purchased from the Shanghai Cell Bank of the Chinese Academy of Sciences (Shanghai, China), and cultured in RPMI 1640 medium containing 10% FBS at 37 °C in a humidified 5% CO2 incubator. The medium was changed daily and H1299 cells in their logarithmic growth period were used in the subsequent experiments.
Zebrafish Preparation
The wild-type AB strain of zebrafish was purchased from the China Zebrafish Resource Center, Institute of Hydrobiology, China Academy of Science (Wuhan, China) and accredited by the Association for Assessment and Accreditation of Laboratory Animal Care International (SYXK 2012–0171). Larval zebrafish were produced by natural pair-mating and housed in a light-controlled aquaculture facility with a standard 14:10 h day/night photoperiod and fed with live brine shrimp twice a day and fry flakes once a day.
Animal Experiment in Larval Zebrafish
To screen out the optimal dose range of QBD, 240 larval zebrafish at 3 days post-fertilization (dpf) were assigned to 8 groups (n = 30) and treated with QBD at a dose of 0, 62.5, 125, 250, 500, 1000, 2000, and 4000 μg/mL, respectively, for 24 h. Subsequently, the zebrafish of each group were observed under a stereoscopic microscope to record the mortality of toxic manifestation. According to the no observed adverse effect level (NOAEL) of QBD, death event was found after treatment with QBD at 1 mg/mL. Therefore, we selected 125, 250, and 500 μg/mL as low, middle, and high concentrations, respectively, for the following experiments. Cis-platinum (DDP, 22.5 μg/mL) was used as a positive control.
To establish a human NSCLC xenograft model in zebrafish, H1299 cells were labeled with fluorescent dye CM-Dil, as described previously.16 Briefly, 200 CM-Dil labeled H1299 cells were microinjected into the yolk sac of zebrafish at 2 dpf. The zebrafish were cultured at 35 °C for 72 h after the operation and were observed under a fluorescence microscope (Tokyo, Japan) for the xenograft model verification. Finally, zebrafish were divided into 5 groups (n = 20) and treated with 0, 125, 250, and 500 μg/mL of QBD, and treated with 30 μM DDP for 24 h, respectively. Zebrafish in each experimental group were randomly selected and photographed under a fluorescence microscope. The fluorescence intensity (FI) of the H1299 cell mass of zebrafish was collected by NIS Elements D 3.20 advanced image processing software. The tumor inhibitory rate (%) of H1299 cells induced by QBD was calculated as inhibitory rate (%) = [1-(FI of treated group/ FI of the control group)] × 100%.
Cell Viability Assay
The cell viability of H1299 with QBD, ART B, and artemisinic acid treatment was conducted by CCK-8 assay. Briefly, H1299 cells were inoculated on 96-well plates with a density of 4×10³ cells/well. After inoculation for 24 h, H1299 cells were treated with QBD (0, 0.7, 0.8, 0.9, 1.0, 1.1, 1.2, 1.3, 1.4, 1.5, 2.0, 3.0, 4.0 mg/mL) for 24 h or 48 h, ART B (0, 10, 16, 22, 28, 34, 40 μM) and artemisinic acid (0, 100, 200, 300, 400, 500 μM) for 24 h in different concentrations, respectively. After the supernatant was discarded, the CCK-8 working solution was added to each well under dark conditions and incubated at 37 °C for 2 h. Then, the optical density (OD) value was measured at 450 nm with a microplate reader (CA, USA). Inhibitory rate (%) = [1-(treated OD/untreated OD)] × 100%.
Network Pharmacology Analysis
Network pharmacology analysis was applied to predict the targets and mechanisms of both QBD and ART B on lung cancer. The Traditional Chinese Medicine System Pharmacology Database (TCMSP, http://tcmspnw.com) or Pharmmapper (http://www.lilab-ecust.cn/pharmmapper/) database was used to obtain protein targets of QBD (the screening condition was oral bioavailability (OB) ≥ 30%, and drug-likeness (DL) ≥ 0.18) or ART B, respectively. The ingredient of Bie Jia, which cannot be searched out in TCMSP, were downloaded from HIT 2.0 (http://hit2.badd-cao.net/). Then, the UniProt knowledge base was used to translate protein names into official gene symbols (Homo sapiens) (https://www.uniprot.org/). “Lung cancer” was used as the keyword and searched in the Genecards database (https://www.genecards.org/), TTD database (https://db.idrblab.org/ttd/), Pharmgkb database (https://www.pharmgkb.org/), Drugbank database (https://go.drugbank.com/), and OMIM database (https://omim.org/). The Protein-Protein-interaction (PPI) network was constructed based on the public database STRING (https://cn.string-db.org/), displaying connected nodes and scores higher than the highest confidence (0.900) in STRING settings. Subsequently, the QBD and ART B-lung cancer-target network were constructed by using Cytoscape_v3.8.2 (https://www.cytoscape.org/). CytoNCA was used to calculate topological parameters, and core proteins were screened based on the thresholds of betweenness centrality (BC), closeness centrality (CC), degree centrality (DC), eigenvector centrality (EC), local average connectivity-based method (LAC), and network centrality (NC). BC, CC, DC, EC, LAC, and NC were initially set as greater than or equal to 90.68177528, 0.4349731975, 13.5, 0.0308499395, 5.784090909, and 7.021794872, respectively. To narrow down the potential gene targets, we further modified the above parameters as 11.135521185, 0.6, 21, 0.112437692, 14.96521739, and 17.187482285, respectively. Gene Ontology (GO) and Kyoto Encyclopedia of Genes and Genomes (KEGG) analyses were performed by using the clusterProfiler_v4.0.5 software package of the R platform.
Cell Morphology and DAPI Staining
Cell apoptosis of H1299 cells induced by ART B was determined by DAPI staining. H1299 cells were seeded on plates with a density of 4×10⁴ cells/well and induced by ART B with 20 μM, 30 μM, and 40 μM for 24 h, respectively. DDP (30 μM) was set as a positive control. Each set of cells was fixed with 4% paraformaldehyde in PBS for 30 min at room temperature, followed by permeabilization with 0.1% Triton X-100 in PBS for 30 min. The cells were mounted with DAPI in dark and were observed under a fluorescence microscope (Gottingen, Germany). Five coverslips were subjected to replicates of each group and apoptotic nuclei of cells were visualized at an excitation wavelength of 405 nm.
TUNEL Assay
The apoptotic rate of H1299 cells induced by QBD and ART B was determined by using the TUNEL assay, according to the manufacturer’s specification.17 H1299 cells were seeded on plates with a density of 4×10⁴ cell/well for 24 h, followed by QBD treatment (0 mg/mL, 1.5 mg/mL, 2.25 mg/mL, 3.0 mg/mL) or ART B treatment (0 μM, 20 μM, 30 μM, 40 μM) for another 24 h, respectively. DDP (30 μM) was set as a positive control. The cells were washed three times with PBS, fixed with 4% paraformaldehyde for 30 min at room temperature, and permeabilized with 0.1% Triton X-100 in PBS at 4 °C for 30 min. Subsequently, the prepared TUNEL reagent was added to plates and the cells were incubated at room temperature for 1 h under dark conditions. The cells were then counter-stained with DAPI. The stained cells were observed under a fluorescence microscope at an excitation wavelength of 450–500 nm and a detection wavelength of 515–565 nm for the TUNEL assay. Three coverslips’ repeats were carried out for each group.
Immunofluorescence
H1299 cells were seeded on plates with a density of 4×10⁴ cell/well for 24 h, followed by ART B treatment at 0 μM, 20 μM, 30 μM, and 40 μM for another 24 h, respectively. DDP (30 μM) was set as a positive control. Then, all coverslips were permeabilized with 0.1% Triton X-100 in PBS at 4 °C for 30 min. Blocking was performed with 1% BSA at 4 °C for 1 h. Subsequently, the primary antibody of γ-H2A.X (1:400, v/v) was incubated at 4 °C overnight, followed by the secondary antibody [fluorescein (FITC) coupled affinity pure donkey anti-mouse IgG (H + L)] incubation at 4 °C in dark for at least 2 h. Finally, DAPI staining was carried out for nuclei staining. γ-H2A.X positive cells were imaged under a fluorescent microscope. Three coverslips’ repeats were carried out for each group.
Flow Cytometry
The cell apoptosis of H1299 cells induced by QBD and ART B was determined by using the FITC-Annexin V and PI method.18 Briefly, H1299 cells were seeded on seven 10 cm petri dishes with a density of 8×10⁵ cells/dishes. 24 h later, the cells were treated with QBD at 0 mg/mL, 1.5 mg/mL, 2.25 mg/mL, and 3 mg/mL or ART B at 0 μM, 20 μM, 30 μM, and 40 μM for another 24 h, respectively. DDP (30 μM) was set as a positive control. Subsequently, cells were collected and washed thrice with cold PBS, followed by resuspension in binding buffer and staining with FITC-Annexin V and PI at room temperature in dark, according to the manufacturer’s protocol. The fluorescence intensity of the staining cells was measured thrice by using a flow cytometer (CA, USA).
Real-Time PCR (qPCR) Assay
To elucidate the molecular effects of both QBD and ART B on H1299 cells, the qPCR experiment was carried out with an ABI QuantStudioTM 7 Flex Real-Time PCR System (CA, USA). The total RNA of H1299 cells was extracted by Trizol reagent and the RNA concentration was measured by NanoDrop 2000 spectrophotometer (CA, USA). Then, the RNA reverse transcription was performed with Primescript RT master mix (TaKaRa, Japan) to synthesize cDNA. According to the manufacturer’s protocol, the final PCR reaction system was 20 μL, including 10 μL SYBR Premix Ex Taq II (Tli RNase H Plus), 0.4 μL PCR reverse primer, 0.4 μL PCR forward primer, 1 μL template cDNA, and 8.2 μL ddH2O. The reaction conditions of PCR were as follows: 95 °C for 5 min for initial denaturation, then 40 cycles of denaturation at 95 °C for 3 sec, annealing and extension at 60 °C for 5 sec. β-ACTIN was regarded as the reference gene and the 2−ΔΔCT method was carried out to analyze the relative mRNA expressions (Table 2).19 Each experiment was conducted in triplicate.
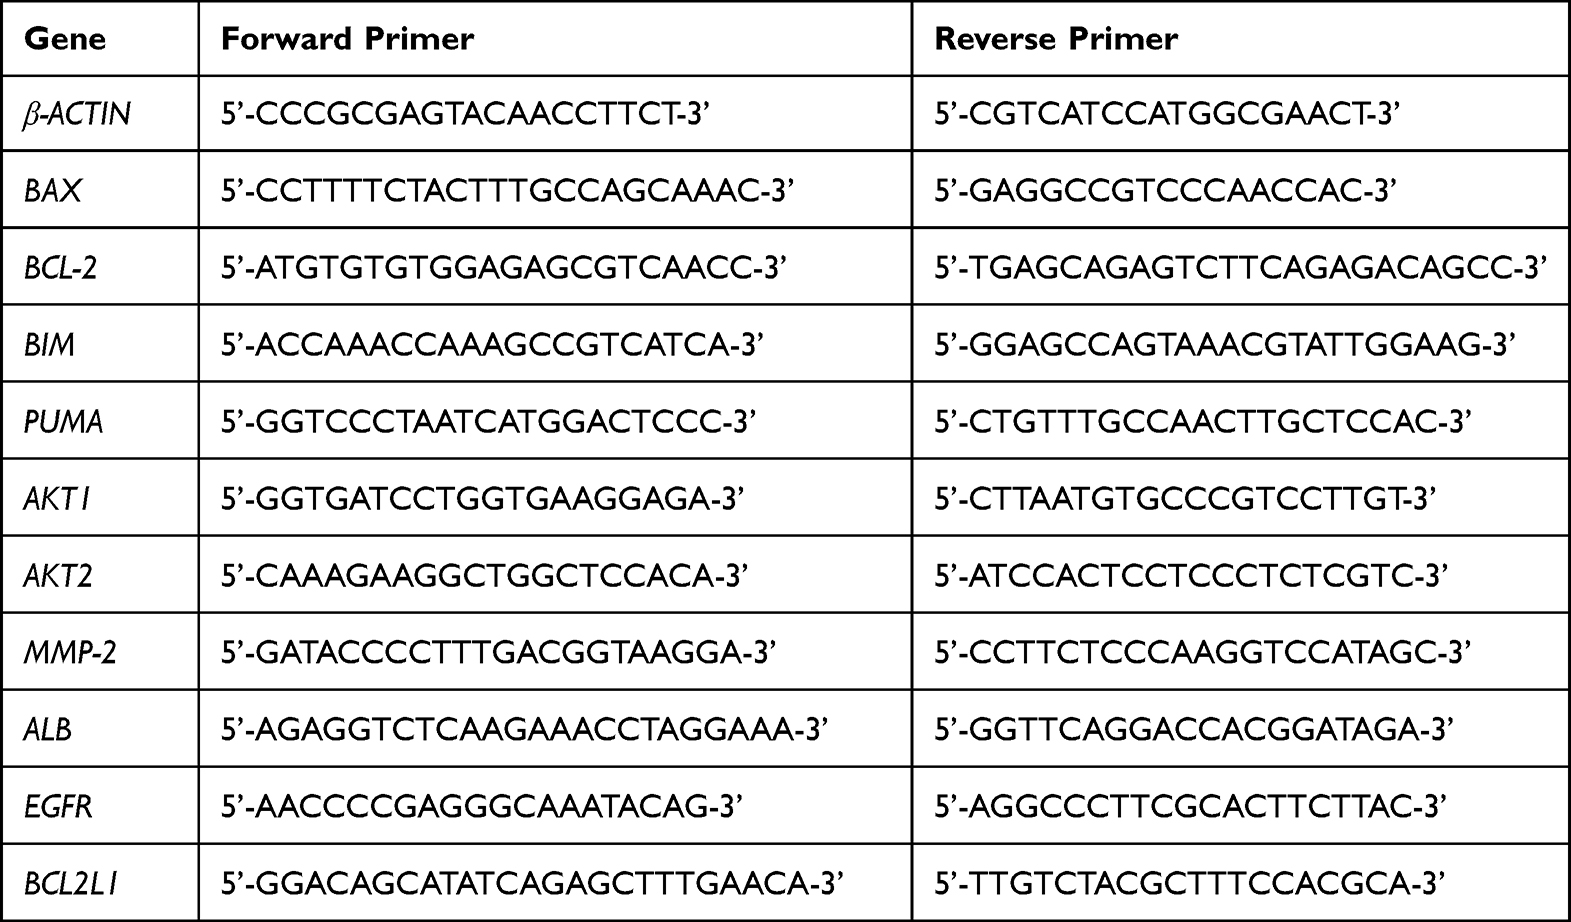 |
Table 2 Primer Sequences Used for qPCR Analysis |
Western Blot (WB) Analysis
Total proteins were extracted in ice-cold RIPA buffer (50 mM Tris-HCl, pH 7.4, 150 mM NaCl, 1mM EDTA, 1% Triton, 0.1% SDS, 5 μg/mL leupeptin, and 1 mM PMSF) for 30 min on ice and constantly shook during the period. Protein concentration was determined by a BCA protein assay kit, according to the manufacturer’s protocol. The targeted protein of H1299 cells was separated by sodium dodecyl sulfate modified polyacrylamide gel electrophoresis (SDS-PAGE: 7.5–12%) and transferred to nitrocellulose membranes (Gottingen, Germany). After transferring, the membranes were blocked with 5% non-fat milk or 5% BSA at 4 °C for 2 h, followed by overnight incubation at 4 °C with the primary antibodies: β-ACTIN, BAX, BCL-2, PARP, cleaved-PARP (c-PARP), γ-H2A.X, cleaved CASP3 (c-CASP3), cleaved CASP3 (c-CASP8), Akt, phosphorylated Akt (p-Akt), PI3K, and phosphorylated PI3K (p-PI3K). Finally, the membranes were incubated with the secondary antibody (peroxidase-conjugated goat anti-mouse or rabbit IgG) at 4 °C for 2 h. Each protein was visualized by using Western Lighting® Plus ECL (MA. USA) and analyzed by using ImageQuant TL 7.0 analysis software (GE, USA).20 Antibody information was given in Table 3. β-ACTIN was used as the reference protein.
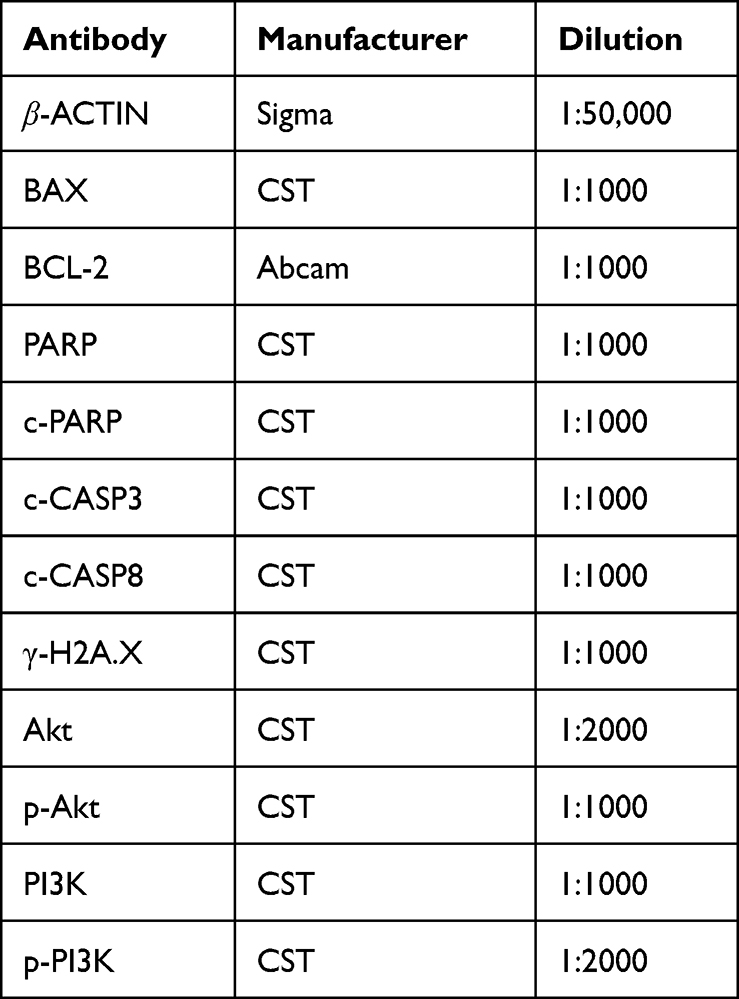 |
Table 3 Antibodies Used for WB Analysis |
Statistical Analysis
Data were expressed as mean ± standard deviation (SD), followed by using an independent sample t-test. All analyses were performed using an updated version of SPSS software (v 20.0). P-value < 0.05 was regarded as a significant difference and P-value < 0.01 was regarded as a very significant difference.
Results
Identification of the Main Constituent in QBD
In this study, a total of 69 compounds were unambiguously identified or tentatively characterized. The total ion chromatogram of QBD in positive- and negative-ion modes were displayed in Figure 1A and B, respectively. As shown in Figure 1, the negative-ion mode was better than the positive-ion mode with a good chromatogram characteristic. A summary of identified compounds and their characteristic ion fragments were displayed in Supplementary Table S1.
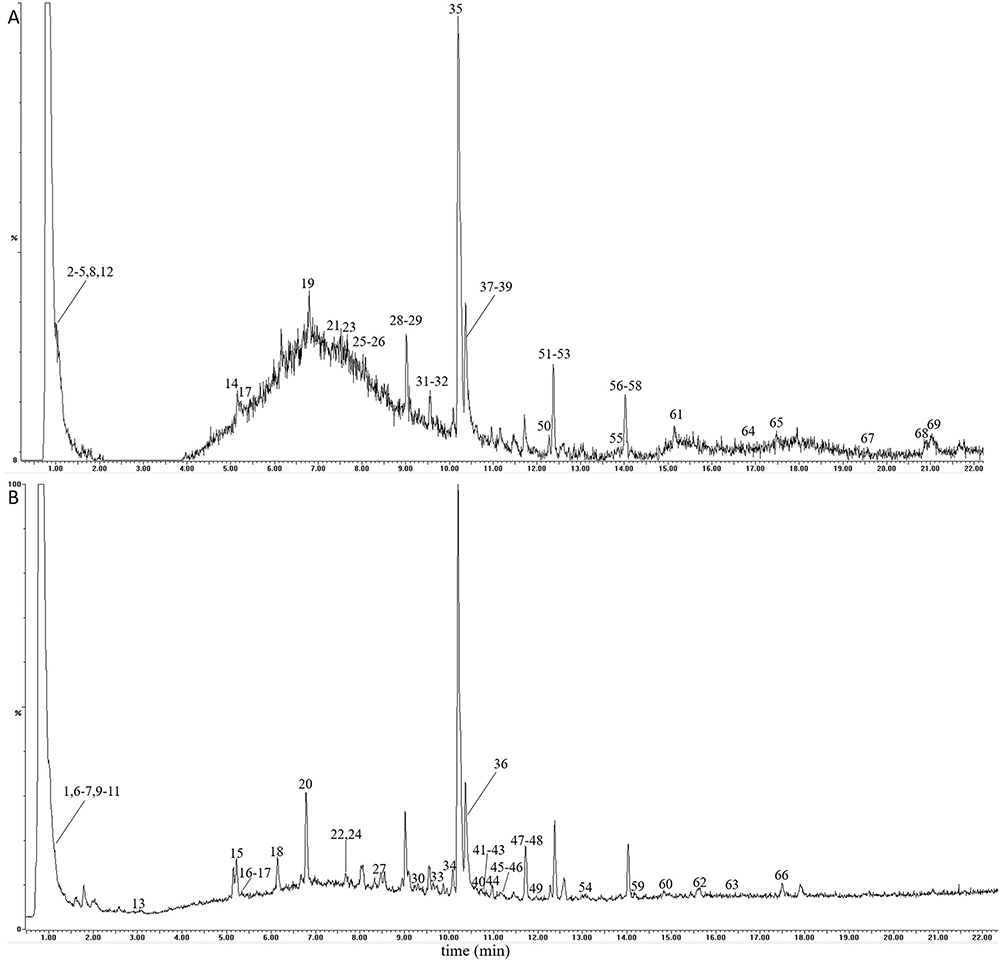 |
Figure 1 The total ion chromatograms of the QBD by UPLC-Q/TOF-MS/MS. (A) The positive-ion mode. (B) The negative-ion modes. |
In vivo Efficacy of QBD on NSCLC in a Xenograft Zebrafish Model
As shown in Figure 2A, zebrafish death occurred when the QBD concentration increased to 1 mg/mL with a 7% of death rate, to 2 mg/mL with a 13% of death rate, and no fish survived with QBD concentration at 4 mg/mL, indicating the maximum non-lethal dose of QBD was less than 1 mg/mL. According to the results of the maximum tolerated concentration of QBD, we used 125, 250, and 500 μg/mL concentrations as the low, middle, and high doses of QBD for the subsequent in vivo experiments. As shown in Figure 2B and C, a zebrafish xenograft model of H1299 cells was successfully established in larval zebrafish. Compared with the model group, QBD significantly inhibited H1299 tumor growth with inhibitory rates of 24%, 32%, and 39% (each P <0.05 vs control group) at the dosage of 125, 250, and 500 μg/mL, respectively, suggesting a dose-dependent manner. Moreover, the middle and high dosages of QBD had better anti-tumor efficiency than the positive DDP control (23% inhibitory rate).
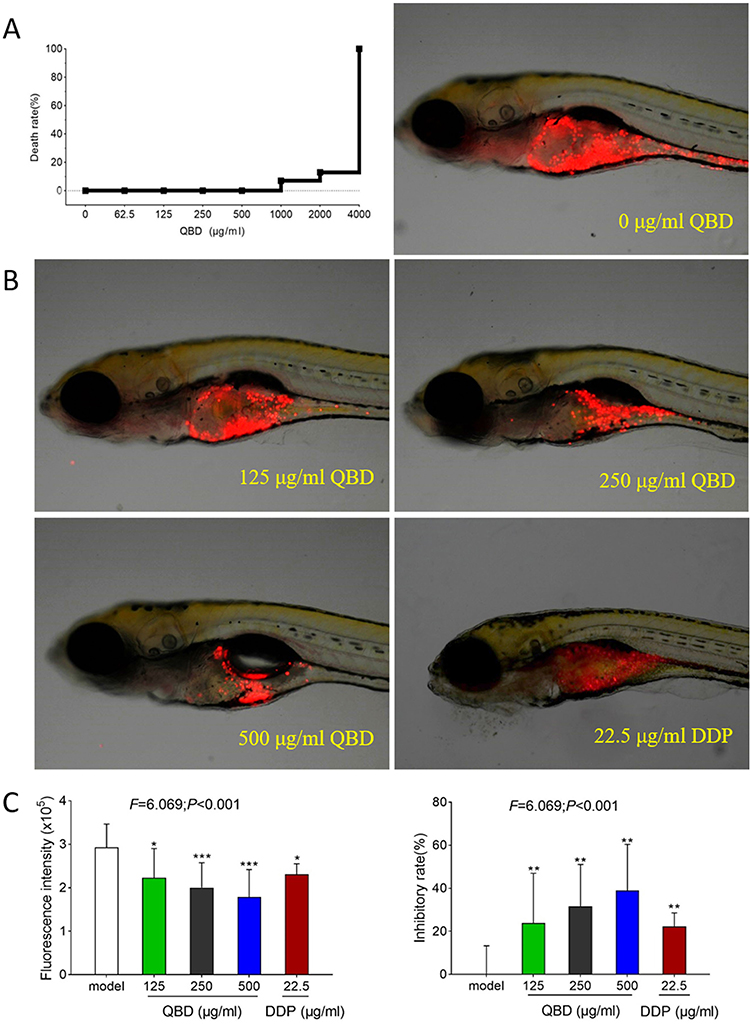 |
Figure 2 In vivo anti-tumor efficacy of QBD on H1299 cells. (A) Mortality of larval zebrafish treated with QBD at a dose of 0, 62.5, 125, 250, 500, 1000, 2000, and 4000 μg/mL, respectively, for 24 h. (B) The fluorescence intensity and inhibitory rates of QBD. (C) Observations of H1299 xenograft zebrafish after 24 h treatment of QBD (0, 125, 250, and 500 μg/mL) or DDP (22.5 μg/mL). The fluorescence area in red represented the H1299 cell’s mass. Values were presented as the mean ± SD, *P < 0.05, **P < 0.01, and ***P < 0.001 vs control group. |
Growth-Inhibitory and Pro-Apoptotic Effects of QBD on H1299 Cells
Morphological observation and CCK-8 assays were conducted to evaluate the anti-proliferative effect of QBD on H1299 cells. As shown in Figure 3A, after QBD treatment at the concentration of 1.5, 2.25, and 3 mg/mL for 24 h, the morphology of H1299 cells appeared to be in shrunken and round shape, with many cells in a non-adherent state. As shown in Figure 3B, after treatment for 24 h, and 48 h, QBD significantly inhibited the cell viability of H1299 cells from 1 to 4 mg/mL, with the inhibitory rates from −1.07% to 86.06% (P < 0.01 and P < 0.05 vs control group), in a dose- and time-dependent manner. According to the results of CCK-8, the concentration of QBD at 1.5, 2.25, and 3.0 mg/mL were used as low, middle, and high doses for the subsequent cellular experiments, respectively.
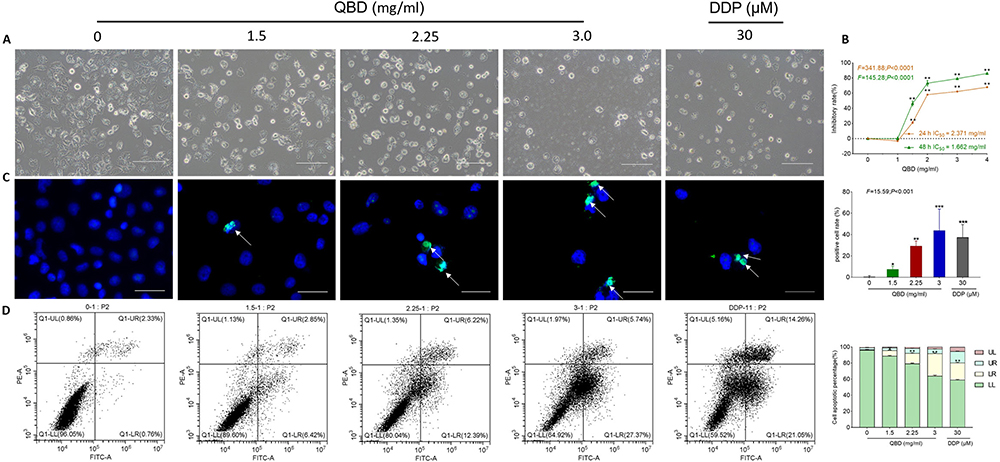 |
Figure 3 In vitro pro-apoptotic effects of QBD (0, 1.5, 2.25, and 3 mg/mL) on H1299 cells. (A) Morphological observation of H1299 cells treated with QBD (0, 1.5, 2.25, and 3 mg/mL) or DDP (22.5 μg/mL) for 24 h. (B) Cell viability of H1299 cells treated with QBD (0, 1, 1.5, 2, 3, and 4 mg/mL) for 24 and 48 h. (C) DAPI staining, TUNEL assay observations of H1299 cells after 24 h treatment of QBD (0, 1.5, 2.25, and 3 mg/mL) or DDP (22.5 μg/mL), with white arrows indicating TUNEL positive cells. (D) Flow cytometry analysis of H1299 cells after 24 h treatment of QBD (0, 1.5, 2.25, and 3 mg/mL) or DDP (22.5 μg/mL) and the statistical analyses of the apoptotic rate. LL: FITC-Annexin V and PI negative; LR: FITC-Annexin V positive; UR: FITC-Annexin V and PI positive; UL: PI positive, Values were presented as the mean ± SD, *P < 0.05, **P < 0.01, and ***P < 0.001 vs control group. Scale bar: 50 μm. |
Flow cytometry and TUNEL staining were conducted to evaluate the pro-apoptotic effects of QBD on the H1299 cells. As shown in Figure 3C, the apoptotic rate of H1299 increased from 0.47% in the control group to 7.57% (P < 0.05, vs control group), 29.23% (P < 0.01, vs control group), and 43.83% (P < 0.001, vs control group) in the QBD groups, and to 37.38% (P < 0.001, vs control group) in the DDP group. The results of flow cytometry showed QBD-induced early and late apoptosis of H1299 cells. After treatment with 1.5, 2.25, and 3.0 mg/mL of QBD, as shown in Figure 3D, the percentage of apoptotic cells was increased from 3.28% in the control group to 10.30% (P < 0.01, vs control group), 19.23% (P < 0.01, vs control group), and 33.68% (P < 0.01, vs control group), respectively. DDP showed similar effects with high doses of QBD. These data suggested that QBD induced apoptosis in a dose-dependent manner.
Molecular Actions of Pro-Apoptotic QBD on H1299 Cells
The relative mRNA expression of apoptotic relative genes in QBD-targeted H1299 cells was determined by qPCR assay. As shown in Figure 4A, after treatment with 1.5, 2.25, and 3.0 mg/mL of QBD, it significantly up-regulated the expression of BAX, BIM, and PUMA mRNA transcripts in H1299 cells (P < 0.01 or P < 0.05 vs control group), and down-regulated the expression of BCL-2 (P < 0.05 vs control group).
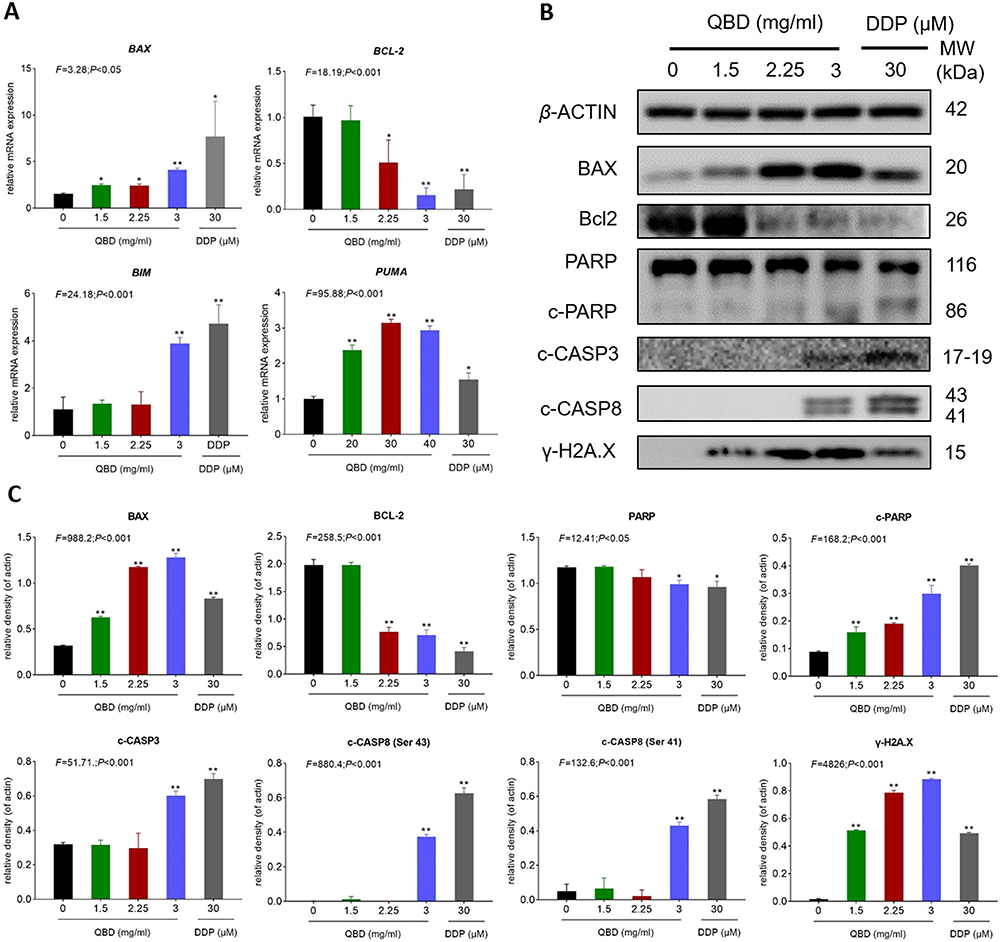 |
Figure 4 QBD (0, 1.5, 2.25, and 3 mg/mL) induced apoptosis in H1299 cells. (A) Relative mRNA expression of apoptosis-related genes in H1299 cells treated with QBD (0, 1.5, 2.25, and 3 mg/mL) or DDP (22.5 μg/mL) for 24 h. (B) Western blot analysis of related protein expressions in H1299 cells treated with QBD (0, 1.5, 2.25, and 3 mg/mL) or DDP (22.5 μg/mL) for 24 h. (C) The statistical analyses of the relative protein expressions. Data are presented as mean ± SD (n = 3). *P < 0.05, and **P < 0.01 vs control group. |
Western blot assay was carried out to determine the expression of targeted proteins. As shown in Figure 4B and C, after treatment with 1.5, 2.25, and 3.0 mg/mL of QBD for 24 h, QBD dose-dependently significantly up-regulated the protein expressions of BAX, γ-H2A.X, c-PARP, c-CASP3, and c-CASP8 (P < 0.01 and P < 0.05 vs control group) and down-regulated the expression of BCL-2 (P < 0.01 vs control group). DDP showed similar pro-apoptotic effects with QBD in mRNA and protein levels.
Growth-Inhibitory and Pro-Apoptotic Effects of ART B in H1299 Cells
Among the 69 components identified in QBD, rutin, D-catechin, galloylpaeoniflorin, paeoniflorin, mangiferin, artemisinic acid, and adenosine have been reported with anti-lung cancer effects, but their IC50 levels were not satisfactory (Supplementary Table S2, Figure 5C and D). By contrast, ART B showed promising cytotoxicity against lung cancer cells in preliminary screenings, so we selected ART B for further study. To evaluate the anti-proliferation effect of ART B, an active compound of QBD, morphological observations and CCK-8 assays were carried out on H1299 cells with a concentration range of ART B from 10 μM to 40 μM for 24 h. As shown in Figure 5C, the viability of H1299 cells was inhibited with the treatment of ART B in a dose-dependent manner. H1299 cells were treated with ART B from 10 μM to 40 μM for 24 h, with the inhibitory rates from 5.82% to 75.93% (each P < 0.01), and the IC50 of ART B was calculated as 25.835 μM. Then, we used 20 μM, 30 μM, and 40 μM as subsequent experimental concentrations. As shown in Figure 5A, after 24 h ART B treatment, the H1299 cell number was obviously decreased, and the morphology of H1299 cells appeared to be in shrunken shape. In addition, to evaluate the anti-proliferation effect of artemisinic acid, CCK-8 assays were conducted on H1299 cells following artemisinic acid treatments from 100 to 500 μM for 24 h. As shown in Figure 5D, the viability of H1299 cells was inhibited as increased concentrations of artemisinic acid, indicating a dose-dependent manner. The IC50 of artemisinic acid treatment for 24 h was calculated as 450.897 μM.
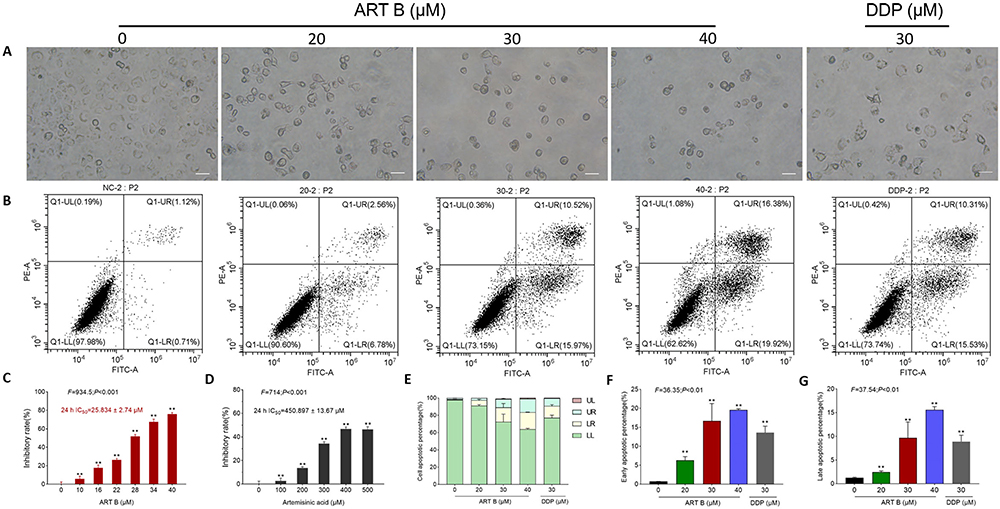 |
Figure 5 Efficacy of ART B on H1299 cell viability and pro-apoptotic effects. (A) Morphological observations of H1299 cells with different doses of ART B (0, 20, 30, and 40 μM) or DDP (30 μM) treatment for 24 h. (B) Apoptosis analysis with annexin V-FITC/PI staining by flow cytometry in H1299 cells with ART B (0, 20, 30, and 40 μM) or DDP (30 μM) treatment for 24 h, displaying the apoptosis rates at early and late-stage. (C) Viability of H1299 induced by ART B (0, 10, 16, 22, 28, 34, and 40 μM) for 24 h. (D) Viability of H1299 induced by artemisinic acid (0, 100, 200, 300, 400, 500 μM) for 24 h. (E) The statistical analyses of the apoptotic rate. LL: FITC-Annexin V and PI negative; LR: FITC-Annexin V positive; UR: FITC-Annexin V and PI positive; UL: PI positive. (F) Early apoptosis of ART B on H1299 cells treated with ART B (0, 20, 30, and 40 μM) or DDP (30 μM). (G) Late apoptosis of ART B on H1299 cells treated with ART B (0, 20, 30, and 40 μM) or DDP (30 μM). Data are presented as mean ± SD (n = 3), **P < 0.01 vs control group. Scale bar: 50 μm. |
To evaluate the pro-apoptotic effect of ART B, DAPI staining, TUNEL staining, annexin V-FITC/PI staining, and immunofluorescence were conducted on H1299 cells after treatment with 20 μM, 30 μM, and 40 μM of ART B for 24 h, respectively. As shown in Figure 6A, typical apoptotic cells with nuclear fragmentation, chromatin condensation, and karyopyknosis were increasingly seen with ART B treatment from low to high doses. The number of apoptotic cells of H1299 were increased induced by ART B compared to the control groups (P < 0.01 and P < 0.05 vs control group) with the increasing doses of ART B. As shown in Figure 6B, the percentage of apoptotic cells increased from 1.23% in the control group to 8.54% (P < 0.01, vs control group), 40.84% (P < 0.01, vs control group), and 65.43% (P < 0.01, vs control group), respectively in the ATR B groups. DDP induced apoptosis of H1299 cells with 56.52% (P < 0.01, vs control group) apoptotic percentage. In addition, the γ-H2A.X positive cells of H1299 cells increased from 0.79% in the control group to 28.88% (P < 0.01, vs control group), 54.08% (P < 0.01, vs control group), and 72.37% (P < 0.01, vs control group) in the ART B groups, and to 56.52% (P < 0.01, vs control group) in the DDP group.
 |
Figure 6 In vitro pro-apoptotic effects of ART B on H1299 cells for 24 h. (A) DAPI, TUNEL, and γ-H2A.X immunofluorescence observations of H1299 cells after 24 h treatment of ART B (0, 20, 30, and 40 μM) or DDP (30 μM). White arrows in the top row indicate the abnormal shape of the nucleus, white arrows in the middle row indicate apoptosis positive cells, and white arrows in the bottom row indicate γ-H2A.X positive cells. (B) Statistical data. Data are presented as mean ± SD (n = 3), **P < 0.01, and ***P < 0.001 vs control group. Scale bar: 50 μm. |
As shown in Figure 5B and E-G, both the early and late apoptosis of H1299 cells were elevated by ART B treatment in a dose-dependent manner, as compared to control groups (P < 0.01, and P < 0.05 vs control group). The above data results indicated that ART B induced apoptosis of H1299 cells in a dose-dependent manner.
Identification of Targets and Pathways of ART B by Network Pharmacology
204 targets of ART B were screened from the Pharmmapper database, and 18258 lung cancer-related targets were obtained from the above databases. As shown in Figure 7A, Venn analysis showed that there were 204 overlapping targets between ART B targets and lung cancer-related targets, which could be used as candidate targets for ART B to treat lung cancer. To elucidate the relationship between ART B and potential targets as well as lung cancer, an ingredient-target-disease network was constructed by Cytoscape 3.8.0, consisting of 204 nodes and 203 edges, as shown in Figure 7B. To identify the core proteins of ART B intervention for lung cancer, a PPI network with 100 nodes and 3636 edges was constructed by using the String database. As shown in Figure 7D-F, a total of 24 core proteins were closely related to lung cancer, including MMP9, STAT1, Akt1, PGR, GSK3B, ALB, HSP90AA1, CASP3, IGF1, MMP2, MAP2K1, BCL2L1, EGFR, Akt2, MDM2, MAPK14, PPARG, MAPK1, SRC, PIK3R1, MAPK8, NR3C1, ESR1, IL2, and AR. The KEGG functional enrichment analyses were carried out based on the potential targets of ART B. As shown in Figure 7C, in the KEGG pathway analysis, the top of 30 significantly enriched signaling pathways were obtained (P < 0.05), including PI3K-Akt signaling pathway, and Ras signaling pathway, etc. Interestingly, we found that the PI3K/Akt was the common pathway relating to the anti-lung cancer mechanism of both ART B and QBD (Figure 7C, and Figure S1).
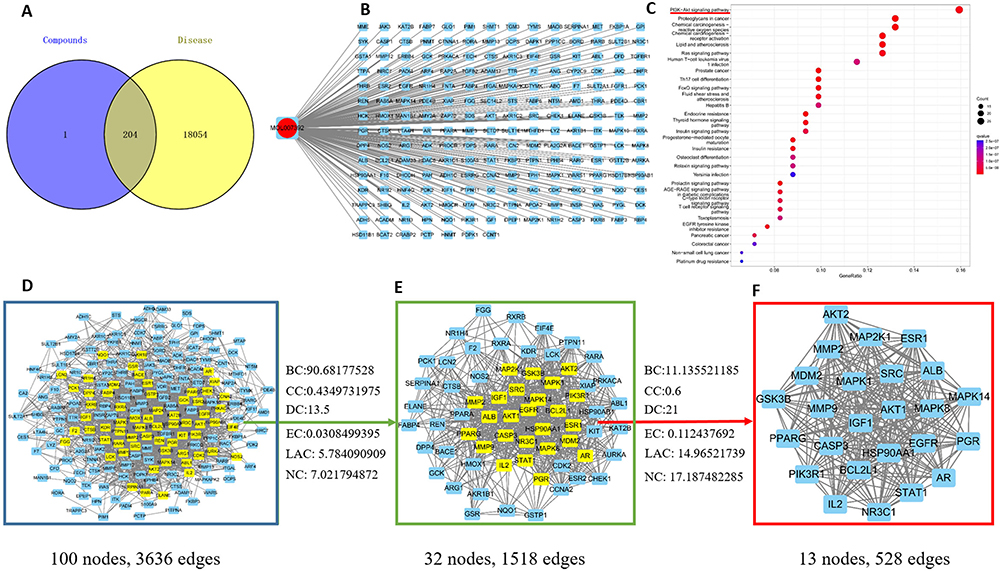 |
Figure 7 Network pharmacology of ART B in lung cancer. (A) Venn diagram summarizing the intersection of targets of ART B and lung cancer. The purple circle and the yellow circle represent targets of ART B and lung cancer, respectively. (B) The network of ingredient-target-disease. ART B on the left rings, and 204 target genes (right rectangles). (C) The top 30 of KEGG enrichment analysis. The red and blue bars reflect the P value, the redder the color, the smaller the P value. The red underline indicates that ART B is strongly associated with PI3K/Akt signal pathway. (D) PPI network of the potential protein targets of ART B for the treatment of lung cancer. The yellow rectangles represent core proteins, and the blue rectangles represent non-core proteins. (E) Significant anti-lung cancer protein targets after BC, CC, DC, EC, LAC, NC screenings in (D). The yellow rectangles represent core proteins, and the blue rectangles represent non-core proteins. (F) 24 core proteins of ART B for the treatment lung cancer screening from BC, CC, DC, EC, LAC, NC in (E). |
Molecular Actions of Pro-Apoptotic ART B on H1299 Cells
To evaluate the relative expression of ART B-targeted molecules in H1299 cells, the qPCR and Western blot assays were conducted. Pro-apoptotic genes (BAX, BIM), anti-apoptotic gene (BCL2), and core targets (BCL2L1, AKT1, AKT2, MMP-2, EGFR, ALB) of ART B to lung cancer based on network pharmacology analysis were chosen for studying the cell apoptosis, and verifying ART B-targeted genes results, respectively. As shown in Figure 8, compared with the control group, the expressions of BAX, and BIM were significantly up-regulated, while BCL-2 down-regulated with ART B treatment (P < 0.01 and P < 0.05 vs control group). DDP showed different effects on H1299 cells. In addition, ART B could inhibit the expressions of BCL2L1, AKT1, AKT2, MMP-2, EGFR, and significantly up-regulated ALB expression (P < 0.01 vs control group), which indicated that ART B could inhibit growth of H1299 cells and metastasis of lung cancer.
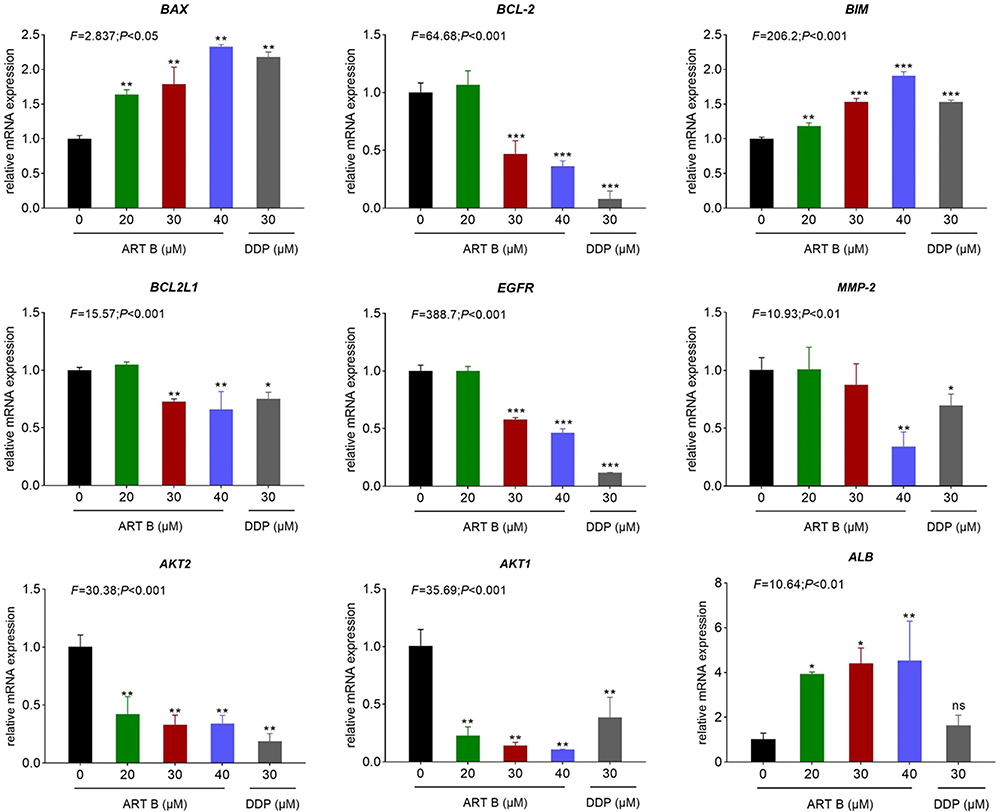 |
Figure 8 Pro-apoptotic-genes expression evaluated by qPCR in H1299 cells with ART B (0, 20, 30, and 40 μM) or DDP (30 μM) treatment for 24 h. Data are presented as mean ± SD (n = 3), *P < 0.05, **P < 0.01, and ***P < 0.001 vs control group; ns, P > 0.05 vs control group. |
Western blot assays were applied to determine the expression and phosphorylation of ART-B targeted proteins in H1299 cells after 24 h treatment of ART B. As shown in Figure 9A and B, compared with control group, the expressions of p-Akt/Akt, p-PI3K/PI3K, and BCL-2 were significantly down-regulated by ART B (P < 0.01 and P < 0.05 vs control group), and the expressions of BAX, c-PARP, c-CASP3, and γ-H2A.X were significantly up-regulated. (P < 0.01 vs control group). DDP showed similar effects with ART B. The above data results indicated that ART B induced apoptosis of H1299 cells in a dose-dependent manner.
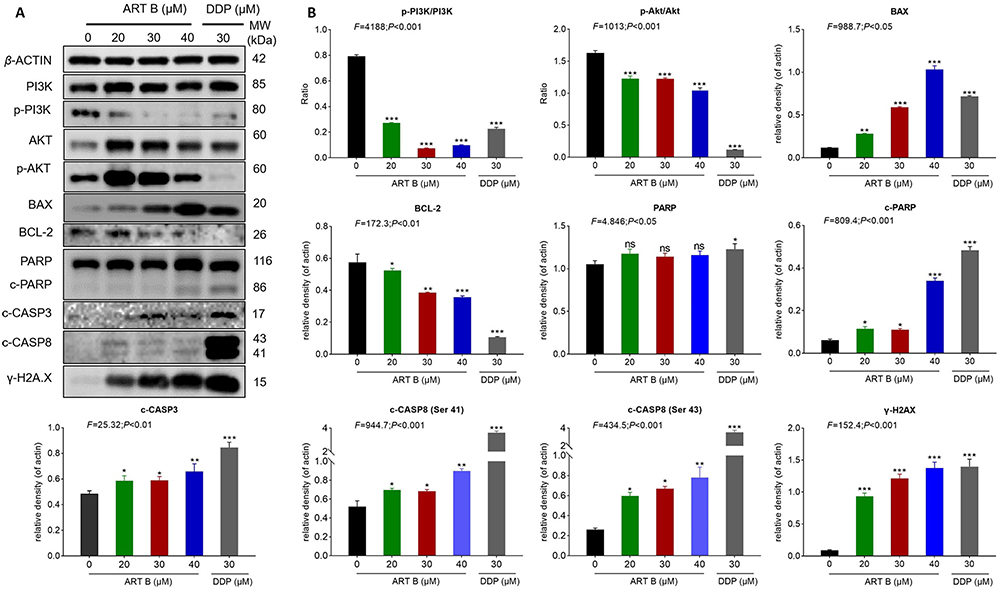 |
Figure 9 ART B (0, 20, 30, and 40 μM) induced apoptosis in H1299 cells. (A) Western blot analysis of related protein expressions of p-PI3K, PI3K, Akt, p-Akt, BAX, BCL-2, PARP, c-PARP, c-CASP3, and γ-H2A.X in H1299 cells with ART B (0, 20, 30, and 40 μM) or DDP (30 μM) treatment for 24 h. (B) The statistical analyses of the related protein expressions. Data are presented as mean ± SD (n = 3), *P < 0.05, **P < 0.01 vs, and ***P < 0.01 vs control group. |
ART B Promotes Apoptosis of H1299 Cells by Inhibiting PI3K/AKT Pathway
To verify whether ART B promotes H1299 cell apoptosis by inhibiting PI3K/AKT pathway. IGF-1, an agonist of PI3K/Akt pathway, was used in combination with ART B. As shown in Figure 10A and B, IGF-1 not only significantly counteracted the pro-apoptosis regulation of ART B on BAX, c-PARP, c-CASP8, γ-H2A.X, but also reversed the anti-apoptosis regulation of ART B on BCL-2 in H1299 cells. The above results confirmed that ART B exerted pro-apoptotic activity by inhibiting PI3K/Akt pathway.
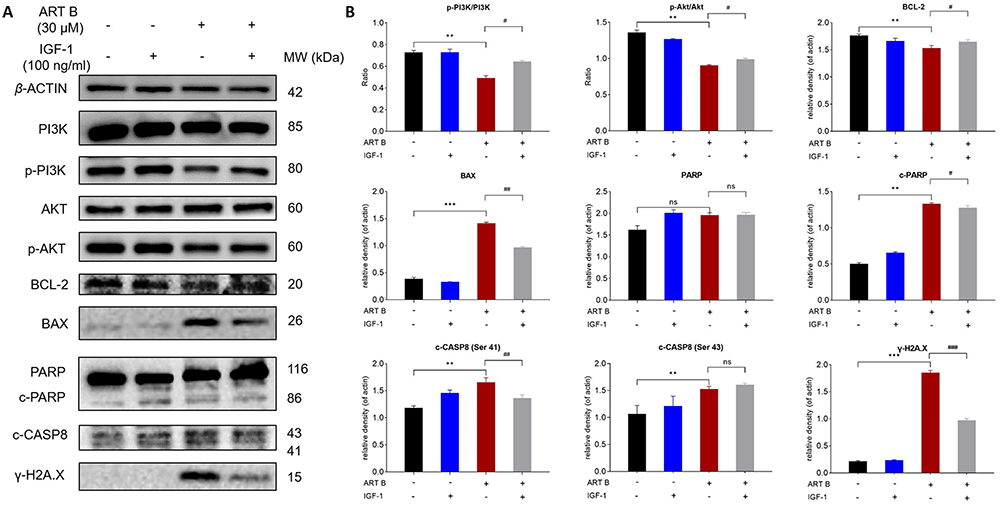 |
Figure 10 IGF-1 reversed ART B-induced apoptosis in H1299 cells. Cells were treated with ART B (30 μM) with or without IGF-1 (100 ng/mL) for 24 h. (A) The expression of PI3K, p-PI3K, Akt, p-Akt, BCL-2, BAX, PARP, c-PARP, c-CASP8, γ-H2A.X in H1299 cells were detected by Western blotting. (B) The statistical analyses of the related protein expressions. β-ACTIN was used as an internal control. Data are presented as mean ± SD (n = 3), **P < 0.01, and ***P < 0.001 vs control group. #P < 0.05, ##P < 0.01, and ###P < 0.001 vs the ART B treatment group. ns, P > 0.05 vs control group or the ART B treatment group. |
Discussion
Nowadays, TCM has attracted global attention in the treatment prospect of many diseases including cancer. Many TCM prescriptions have shown clinical anti-cancer efficacies with minimal toxicity. QBD is a classical TCM prescription used for treating lung cancer,21 and the anti-cancer activities of its herbal components (eg Artemisia annua L.) have been reported.22,23 However, the anti-NSCLC efficacy and mechanism of QBD remain undetermined. For the first time, this study revealed that QBD significantly suppressed the tumor growth of NSCLC in xenograft zebrafish and triggered the proliferation inhibition and the apoptosis of NSCLC cells. According to the combined analysis of UPLC-Q/TOF-MS/MS, a total of 69 components were identified. Among these 69 components, rutin, D-catechin, galloylpaeoniflorin, paeoniflorin, mangiferin, artemisinic acid, and adenosine have been reported with anti-lung cancer effects, but their IC50 levels were not satisfactory (Supplementary Table S2). After a preliminary screening, we found that ART B is promising in treating NSCLC cells. In this study, we determined that ART B could inhibit H1299 cells with IC50 of 25.83 μM, which might be the most effective compound among the 69 compounds. Then, network pharmacology and molecular verification were applied to explore the potential mechanism of ART B. Altogether, the innovation point of this study was the first demonstration of the anti-NSCLC efficacy of QBD as well as the determination of ART B as the most effective anti-NSCLC compound in QBD.
Recently, xenograft models of larval zebrafish have been widely used in cancer studies, due to their advantages of larval zebrafish compared to other animal models. Larval zebrafish is a small vertebrate with the following features: (1) zebrafishes at the larvae stage have little immune rejection against heterologous cells, making success of xenotransplantation; (2) the transparency of larval zebrafish allows real-time visible observation of toxicity and tumor growth; and (3) large-scale generation and rapid organogenesis provide shorter experimental period.24–26 Previously, we and other groups have applied larval zebrafishes to establish xenograft models of lung cancer, liver cancer, and osteosarcoma, and to evaluate the anti-cancer efficacies of TCM products for drug discovery.16,18,27,28 For instance, by using the zebrafish model, our group has found that theabrownin could trigger DNA damage, induce apoptosis, and inhibit tumor growth, resulting in anti-cancer effects on lung cancer and other cancers, which laid an experimental foundation of theabrownin for the development of anti-cancer drugs.16,17,29 In this study, the effective dose range of QBD (from 125 to 500 μg/mL) in the xenograft zebrafish was estimated as 5.88 to 23.53 mg/kg in human body by means of dose conversion, which was far less than the pharmacopeia-recommended clinical dose, indicating QBD as a promising candidate for anti-cancer treatment.30
Since the abnormality of programmed cell death results in the occurrence of tumor growth, the induction of tumor cell apoptosis becomes the basis of successful treatment of cancer.31 In this study, both QBD and ART B inhibited the growth of NSCLC cells through induction of cell apoptosis, as demonstrated by the up-regulation of pro-apoptotic genes (BAX, PUMA, and BIM), and down-regulation of the anti-apoptotic gene (BCL-2) in H1299 cells (Figures 4, and 8). The TUNEL staining, immunofluorescence, and flow cytometry assay further verified the QBD and ART B-induced apoptosis of H1299 cells (Figures 3 and 6). Such apoptosis might be mediated by two pathways, the intrinsic mitochondria route or the extrinsic death receptor route.32 We found that both QBD and ART B up-regulated the expressions c-PARP, c-CASP3, and c-CASP8, indicating that the caspase-dependent intrinsic pathway might mediate the pro-apoptotic effects of both QBD and ART B (Figures 4 and 9). In addition, γ-H2A.X, a member of the H2A protein family, was significantly up-regulated by QBD and ART B. γ-H2A.X is regarded as a marker of early DNA damage, playing important roles in recruiting and localizing DNA repair proteins as the prime response to DNA double-strand breaks.33 Therefore, both QBD and ART B might induce cell apoptosis of NSCLC cells by triggering DNA damage, and finally inhibiting the tumor growth in vivo. It was reported that curcumol inhibited lung adenocarcinoma metastasis via down-regulating MMP-2 expression;34 cordycepin induced apoptosis and inhibited proliferation of H1975 cells via inhibiting the phosphorylation of EGFR;35 exogenous let-7a-5p induced A549 lung cancer cell apoptosis through down-regulating BCL2L1;36 the development of NSCLC was negatively correlated with the high expression of ALB (albumin).37 Akt1 and Akt2 lay specific roles in different steps of breast cancer progression, with Akt1 involved in the local tumor growth, and Akt2 involved in the distant tumor dissemination, and consequently being worthwhile targets for therapy.38 In this study, ART B could induce H1299 cells apoptosis through inhibiting PI3K/Akt signaling pathway by down-regulating the expression of MMP-2, EGFR, BCL2L1, AKT1, AKT2, and up-regulating the expression of ALB (Figure 8). Therefore, the above results showed that ART B could be a potential candidate drug for the treatment of NSCLC.
In this study, we showed that ART B induced apoptosis of H1299 cells by inhibiting PI3K/Akt signaling pathways. However, it is not clear which component in QBD is responsible for its anti-NSCLC efficacy and mechanism of actions. The known compounds in QBD, such as artemisinin, mangiferin, catechin, etc., have been found to have anti-NSCLC potential. For example, artemisinin induced a ROS-mediated amplification activation loop among CASP9, CASP8, and CASP3 to dominantly mediate the apoptosis of A549 cells;39 mangiferin induced apoptosis and cell cycle arrest of human lung carcinoma A549 cells by inducing tumor necrosis factor expression and activating NF-κB signaling pathway;40 catechin in combination with phthalocyanine could induce DNA damage and apoptosis in A549 cells.41 Although the effects of these compounds on NSCLC have been reported, their regulations of the relevant network pharmacological pathways have not been clarified and need further study. These compounds can be regarded as the material basis of QBD, which may independently or synergistically exert effects in treating NSCLC. It is necessary to explore the individual effect and mechanism of the rest chemical compounds in QBD.
Conclusion
For the first time, this study identified the chemoprofile of QBD by using UPLC-QTOF-MS/MS method and demonstrated the growth-inhibitory and pro-apoptotic effects of QBD and ART B against NSCLC by using xenograft zebrafish and H1299 cells. The pro-apoptotic mechanism of ART B, an active ingredient in QBD on NSCLC might be mediated by the DNA damage-triggered intrinsic mitochondria route through inhibiting PI3K/Akt signaling pathway. In sum, this study suggests QBD and ART B as potential candidate drugs for the treatment of NSCLC.
Abbreviations
NSCLC, non-small cell lung cancer; QBD, Qinghao Biejia decoction; DDP, cis-platinum; UPLC-Q/TOF-MS/MS, ultra-performance liquid chromatography coupled with quadrupole time-of-flight mass spectrometry; TCM, traditional Chinese medicine; RPMI, Roswell Park Memorial Institute 1640 medium; FBS, fetal bovine serum; PBS, phosphate-buffered saline; TUNEL, in situ cell death detection terminal deoxyribonucleotide transferase-mediated-dUTP nick-end labeling; qPCR, Real-time PCR; FI, fluorescence intensity; OD, optical density; CASP, caspase.
Ethical Statement
This study was approved by the IACUC (Institutional Animal Care and Use Committee) at Hunter Biotechnology, Inc. and the IACUC approval number was IACUC-2021-3034-01. The zebrafish facility and the laboratory at Hunter Biotechnology, Inc. are accredited by the Association for Assessment and Accreditation of Laboratory Animal Care (AAALAC) International.
Author Contributions
All authors made a significant contribution to the work reported, whether that is in the conception, study design, execution, acquisition of data, analysis and interpretation, or in all these areas; took part in drafting, revising or critically reviewing the article; gave final approval of the version to be published; have agreed on the journal to which the article has been submitted; and agree to be accountable for all aspects of the work.
Funding
This work was supported by the National Natural Science Foundation of China (Grant No. 81893049), Zhejiang traditional Chinese medicine science and technology plan project (Grant No. 2015ZA194), and Science and Technology Development Project of Hangzhou (Grant No. 2020ZDSJ0900).
Disclosure
The authors have no conflicts of interest related to this work.
References
1. He Y, Li D, Shan B, et al. Incidence and mortality of esophagus cancer in China, 2008-2012. Chine j Cancer Res. 2019;31(3):426–434. doi:10.21147/j.issn.1000-9604.2019.03.04
2. Cao M, Chen W. Epidemiology of lung cancer in China. Thoracic Cancer. 2019;10(1):3–7. doi:10.1111/1759-7714.12916
3. Howlader N, Forjaz G, Mooradian MJ, et al. The Effect of Advances in Lung-Cancer Treatment on Population Mortality. N Engl J Med. 2020;383(7):640–649. doi:10.1056/NEJMoa1916623
4. Martín-Sánchez JC, Lunet N, González-Marrón A, et al. Projections in Breast and Lung Cancer Mortality among Women: a Bayesian Analysis of 52 Countries Worldwide. Cancer Res. 2018;78(15):4436–4442. doi:10.1158/0008-5472.Can-18-0187
5. Walters S, Maringe C, Coleman MP, et al. Lung cancer survival and stage at diagnosis in Australia, Canada, Denmark, Norway, Sweden and the UK: a population-based study, 2004-2007. Thorax. 2013;68(6):551–564. doi:10.1136/thoraxjnl-2012-202297
6. Duma N, Santana-Davila R, Molina JR. Non-Small Cell Lung Cancer: epidemiology, Screening, Diagnosis, and Treatment. Mayo Clinic Proce. 2019;94(8):1623–1640. doi:10.1016/j.mayocp.2019.01.013
7. Wang K, Chen Q, Shao Y, et al. Anticancer activities of TCM and their active components against tumor metastasis. Biomed Pharmacother. 2021;133:111044. doi:10.1016/j.biopha.2020.111044
8. Xin C, Xinlong H, Xiaomei T, et al. Effect of qinghao biejia decoction on metabolism of liver cancer mice. Life Sci. 2021;23(03):662–670.
9. Li Z, Feiyue Z, Gaofeng L. Traditional Chinese medicine and lung cancer--From theory to practice. Biomed Pharmacother. 2021;137:111381. doi:10.1016/j.biopha.2021.111381
10. Feng X, Cao S, Qiu F, Zhang B. Traditional application and modern pharmacological research of Artemisia annua L. Pharmacol Ther. 2020;216:107650. doi:10.1016/j.pharmthera.2020.107650
11. Xu L, Zhang W, Zeng L, Jin JO. Rehmannia glutinosa polysaccharide induced an anti-cancer effect by activating natural killer cells. Int J Biol Macromol. 2017;105(Pt 1):680–685. doi:10.1016/j.ijbiomac.2017.07.090
12. Liu J, Deng X, Sun X, Dong J, Huang J. Inhibition of autophagy enhances timosaponin AIII-induced lung cancer cell apoptosis and anti-tumor effect in vitro and in vivo. Life Sci. 2020;257:118040. doi:10.1016/j.lfs.2020.118040
13. Qiang W, Cai W, Yang Q, et al. Artemisinin B Improves Learning and Memory Impairment in AD Dementia Mice by Suppressing Neuroinflammation. Neuroscience. 2018;395:1–12. doi:10.1016/j.neuroscience.2018.10.041
14. Wang Y, Huang W, Wang N, et al. Development of Arteannuin B Sustained-Release Microspheres for Anti-Tumor Therapy by Integrated Experimental and Molecular Modeling Approaches. Pharmaceutics. 2021;13(8):57.
15. Sun L, Ding S, Luo Q, et al. Taxus wallichiana var. chinensis (Pilg.) Florin Aqueous Extract Suppresses the Proliferation and Metastasis in Lung Carcinoma via JAK/STAT3 Signaling Pathway. Front Pharmacol. 2021;12:736442. doi:10.3389/fphar.2021.736442
16. Xiao X, Guo L, Dai W, et al. Green tea-derived theabrownin suppresses human non-small cell lung carcinoma in xenograft model through activation of not only p53 signaling but also MAPK/JNK signaling pathway. J Ethnopharmacol. 2022;291:115167. doi:10.1016/j.jep.2022.115167
17. Jin W, Zhou L, Yan B, et al. Theabrownin triggers DNA damage to suppress human osteosarcoma U2OS cells by activating p53 signalling pathway. J Cell Mol Med. 2018;22(9):4423–4436. doi:10.1111/jcmm.13742
18. Xu J, Yan B, Zhang L, et al. Theabrownin Induces Apoptosis and Tumor Inhibition of Hepatocellular Carcinoma Huh7 Cells Through ASK1-JNK-c-Jun Pathway. Onco Targets Ther. 2020;13:8977–8987. doi:10.2147/ott.S254693
19. Zhang L, Meng S, Yan B, et al. Anti-Proliferative, Pro-Apoptotic, Anti-Migrative and Tumor-Inhibitory Effects and Pleiotropic Mechanism of Theaflavin on B16F10 Melanoma Cells. Onco Targets Ther. 2021;14:1291–1304. doi:10.2147/ott.S286350
20. Zhang L, Dong X, Yan B, Yu W, Shan L. CircAGFG1 drives metastasis and stemness in colorectal cancer by modulating YY1/CTNNB1. Cell Death Dis. 2020;11(7):542. doi:10.1038/s41419-020-2707-6
21. Li L. Qinghao Biejia Decoction Treatment Experience of Bone Metastasis in lung cancer. Drug Combination Therapy. 2015;6(29):133–134.
22. Fu C, Zhang K, Wang M, Qiu F. Casticin and chrysosplenol D from Artemisia annua L. induce apoptosis by inhibiting topoisomerase IIα in human non-small-cell lung cancer cells. Phytomedicine. 2022;100:154095. doi:10.1016/j.phymed.2022.154095
23. Lang SJ, Schmiech M, Hafner S, et al. Chrysosplenol d, a Flavonol from Artemisia annua, Induces ERK1/2-Mediated Apoptosis in Triple Negative Human Breast Cancer Cells. Int J Mol Sci. 2020;21(11):56.
24. MacRae CA, Peterson RT. Zebrafish as tools for drug discovery. Nat Rev Drug Discov. 2015;14(10):721–731. doi:10.1038/nrd4627
25. Brown HK, Schiavone K, Tazzyman S, Heymann D, Chico TJ. Zebrafish xenograft models of cancer and metastasis for drug discovery. Expert Opin Drug Discov. 2017;12(4):379–389. doi:10.1080/17460441.2017.1297416
26. Völkel P, Dupret B, Le Bourhis X, Angrand PO. Le modèle poisson zèbre dans la lutte contre le cancer. [The zebrafish model in oncology]. Medecine Sciences. 2018;34(4):345–353. doi:10.1051/medsci/20183404016
27. Yu S, Guo L, Yan B, et al. Tanshinol suppresses osteosarcoma by specifically inducing apoptosis of U2-OS cells through p53-mediated mechanism. J Ethnopharmacol. 2022;292:115214. doi:10.1016/j.jep.2022.115214
28. White R, Rose K, Zon L. Zebrafish cancer: the state of the art and the path forward. Nat Rev Cancer. 2013;13(9):624–636. doi:10.1038/nrc3589
29. Xu J, Xiao X, Yan B, et al. Green tea-derived theabrownin induces cellular senescence and apoptosis of hepatocellular carcinoma through p53 signaling activation and bypassed JNK signaling suppression. Cancer Cell Int. 2022;22(1):39. doi:10.1186/s12935-022-02468-3
30. Zhang C, Willett C, Fremgen T. Zebrafish: an animal model for toxicological studies. Curr Protocols Toxicol. 2003. doi:10.1002/0471140856.tx0107s17
31. Bajbouj K, Shafarin J, Hamad M. High-Dose Deferoxamine Treatment Disrupts Intracellular Iron Homeostasis, Reduces Growth, and Induces Apoptosis in Metastatic and Nonmetastatic Breast Cancer Cell Lines. Technol Cancer Res Treat. 2018;17:1533033818764470. doi:10.1177/1533033818764470
32. Xu Z, Zhang F, Bai C, et al. Sophoridine induces apoptosis and S phase arrest via ROS-dependent JNK and ERK activation in human pancreatic cancer cells. J Exp Clin Cancer Res. 2017;36(1):124. doi:10.1186/s13046-017-0590-5
33. Kuo LJ, Yang LX. Gamma-H2AX - A novel biomarker for DNA double-strand breaks. vivo. 2008;22(3):305–309.
34. Li S, Zhou G, Liu W, Ye J, Yuan F, Zhang Z. Curcumol Inhibits Lung Adenocarcinoma Growth and Metastasis via Inactivation of PI3K/AKT and Wnt/-Catenin Pathway. Oncol Res. 2021;28(7):685–700. doi:10.3727/096504020x15917007265498
35. Wang Z, Wu X, Liang YN, et al. Cordycepin Induces Apoptosis and Inhibits Proliferation of Human Lung Cancer Cell Line H1975 via Inhibiting the Phosphorylation of EGFR. Molecules. 2016;21(10). doi:10.3390/molecules21101267
36. Duan S, Yu S, Yuan T, Yao S, Zhang L. Exogenous Let-7a-5p Induces A549 Lung Cancer Cell Death Through BCL2L1-Mediated PI3Kγ Signaling Pathway. Front Oncol. 2019;9:808. doi:10.3389/fonc.2019.00808
37. Zhou T, Zhao Y, Zhao S, et al. Comparison of the Prognostic Value of Systemic Inflammation Response Markers in Small Cell Lung Cancer Patients. J Cancer. 2019;10(7):1685–1692. doi:10.7150/jca.29319
38. Riggio M, Perrone MC, Polo ML, et al. AKT1 and AKT2 isoforms play distinct roles during breast cancer progression through the regulation of specific downstream proteins. Sci Rep. 2017;7:44244. doi:10.1038/srep44244
39. Gao W, Xiao F, Wang X, Chen T. Artemisinin induces A549 cell apoptosis dominantly via a reactive oxygen species-mediated amplification activation loop among caspase-9, −8 and −3. Apoptosis. 2013;18(10):1201–1213. doi:10.1007/s10495-013-0857-z
40. Sarkar A, Sreenivasan Y, Ramesh GT, Manna SK. beta-D-Glucoside suppresses tumor necrosis factor-induced activation of nuclear transcription factor kappaB but potentiates apoptosis. J Biol Chem. 2004;279(32):33768–33781. doi:10.1074/jbc.M403424200
41. Senapathy GJ, George BP, Abrahamse H. Enhancement of Phthalocyanine Mediated Photodynamic Therapy by Catechin on Lung Cancer Cells. Molecules. 2020;25(21). doi:10.3390/molecules25214874
 © 2023 The Author(s). This work is published and licensed by Dove Medical Press Limited. The
full terms of this license are available at https://www.dovepress.com/terms
and incorporate the Creative Commons Attribution
- Non Commercial (unported, 3.0) License.
By accessing the work you hereby accept the Terms. Non-commercial uses of the work are permitted
without any further permission from Dove Medical Press Limited, provided the work is properly
attributed. For permission for commercial use of this work, please see paragraphs 4.2 and 5 of our Terms.
© 2023 The Author(s). This work is published and licensed by Dove Medical Press Limited. The
full terms of this license are available at https://www.dovepress.com/terms
and incorporate the Creative Commons Attribution
- Non Commercial (unported, 3.0) License.
By accessing the work you hereby accept the Terms. Non-commercial uses of the work are permitted
without any further permission from Dove Medical Press Limited, provided the work is properly
attributed. For permission for commercial use of this work, please see paragraphs 4.2 and 5 of our Terms.