Back to Journals » OncoTargets and Therapy » Volume 14
Integrated Profiling Identifies CCNA2 as a Potential Biomarker of Immunotherapy in Breast Cancer
Authors Wang Y, Zhong Q, Li Z, Lin Z, Chen H, Wang P
Received 23 December 2020
Accepted for publication 26 March 2021
Published 9 April 2021 Volume 2021:14 Pages 2433—2448
DOI https://doi.org/10.2147/OTT.S296373
Checked for plagiarism Yes
Review by Single anonymous peer review
Peer reviewer comments 2
Editor who approved publication: Prof. Dr. Takuya Aoki
Yichao Wang,1,* Qianyi Zhong,1,* Zhaoyun Li,1 Zhu Lin,2 Hanjun Chen,1 Pan Wang1
1Department of Clinical Laboratory Medicine, Taizhou Central Hospital (Taizhou University Hospital), Taizhou, Zhejiang, 318000, People’s Republic of China; 2Department of Ultrasound, Taizhou Central Hospital (Taizhou University Hospital), Taizhou, Zhejiang, 318000, People’s Republic of China
*These authors contributed equally to this work
Correspondence: Pan Wang
Department of Clinical Laboratory Medicine, Taizhou Central Hospital (Taizhou University Hospital), No. 999 Donghai Road, Jiaojiang District, Taizhou, Zhejiang, 318000, People’s Republic of China
Tel +86 13586106875
Email [email protected]
Introduction: Breast cancer is the main reason for cancer-related deaths in women and the most common malignant cancer among women. In recent years, immunosuppressive factors have become a new type of treatment for cancer. However, there are no effective biomarkers for breast cancer immunotherapy. Therefore, exploring immune-related biomarkers is presently an important topic in breast cancer.
Methods: Gene expression profile data of breast cancer from The Cancer Genome Atlas (TCGA) was downloaded. Scale-free gene co-expression networks were built with weighted gene co-expression network analysis. The correlation of genes was performed with Pearson’s correlation values. The potential associations between clinical features and gene sets were studied, and the hub genes were screened out. Gene Ontology and gene set enrichment analysis were used to reveal the function of hub gene in breast cancer. The gene expression profiles of GSE15852, downloaded from the Gene Expression Omnibus database, were used for hub gene verification. In addition, candidate biomarkers expression in breast cancer was studied. Survival analysis was performed using Log rank test and Kaplan–Meier. Immunohistochemistry was used to analyze the expression of CCNA2.
Results: A total of 6 modules related to immune cell infiltration were identified via the average linkage hierarchical clustering. According to the threshold criteria (module membership > 0.9 and gene significance > 0.35), a significant module consisting of 13 genes associated with immune cells infiltration were identified as candidate hub genes after performed with the human protein interaction network. And 3 genes with high correlation to clinical traits were identified as hub genes, which were negatively associated with the overall survival. Among them, the expression of CCNA2 was increased in metastatic breast cancer compare with non-metastatic breast cancer, who underwent immunotherapy. Immunohistochemistry results showed that CCNA2 expression in carcinoma tissues was elevated compared with normal control.
Discussion: CCNA2 identified as a potential immune therapy marker in breast cancer, which were first reported here and deserved further research.
Keywords: breast cancer, immune infiltration, molecular markers, immunotherapy
Introduction
Breast cancer is the main cause of cancer-related deaths in women worldwide and the most common malignant tumor in women.1 According to the 2018 Global Cancer Survey data, new breast cancer cases accounted for 24.2% of all new malignant tumors globally, and the fatality rate of breast cancer accounted for 15% of the malignant tumor mortality rate.2 Metastasis of breast cancer to lymph nodes or other organs determines the prognosis of patients.3 Despite advances in treatment options such as surgery, chemotherapy, radiotherapy, endocrine therapy, and targeted therapy, the high mortality rate of the disease remains a global challenge.4,5 At present, it is believed that tumor immune microenvironment plays an important role in the evolution of cancer metastasis.6–8 Immunotherapy is revolutionizing the clinical management of multiple tumors.9,10 However, only a fraction of patients with cancer responds to immunotherapy, and currently available immunotherapeutic agents are expensive and generally associated with considerable toxicity, calling for the identification of robust predictive biomarkers.
Traditionally, breast cancer is considered to be less immunogenic, and its mutation burden is relatively lower compared with “inflamed” carcinoma.11 Cumulative results show that compared with estrogen receptor-positive, HER2-negative luminal breast cancer, triple-negative breast cancer (TNBC) and human epidermal growth factor receptor 2 (HER2) breast cancer have higher T lymphocyte infiltration.12,13 In order to improve the clinical benefit of breast cancer immunotherapy, it is necessary to develop immuno-tumor combination therapy. The response of immunotherapy relies on the dynamic interaction between immune cells and tumor in the carcinoma microenvironment. At present, in order to maximize the clinical benefits of tumor immunotherapy, it is necessary to explore the actual immune response and develop biomarkers.14–16
The Cancer Genome Atlas (TCGA) is a database supplying comprehensively clinical information and genomic for all kinds of cancer types.17 The pathology and biology of carcinoma could be studied by researchers with this database.18 In addition, TCGA provides cancer individualized treatment and diagnosis by the identification of hub genes related to cancer.19 Co-expression analysis is a useful tool, which could be used for constructing scale-free gene co-expression networks.20 The weighted gene co-expression network analysis (WGCNA) is a powerful tool to build large-scale data sets and search modules of hub genes.21 Additionally, WGCNA is used to study relationship between clinical information and genomic, and find out potential biomarkers of all kinds of carcinoma.22–24
In order to find out useful biomarkers of immunotherapy and to explore the underlying mechanisms in breast cancer, this study aimed to use weighted gene co-expression network analysis (WGCNA) to screen key modules and key genes related to immune cell infiltration, and to analyze the function of hub genes. GSE15852 dataset and clinical data were utilized for verification. Taken together, CCNA2 was identified as potential immunotherapy biomarker, is closely related to immune infiltrating cells and cytokines, which may become targeted gene for breast cancer immunotherapy.
Materials and Methods
Data Sources
We downloaded breast cancer gene (BRCA) expression profile samples from The Cancer Genome Atlas (TCGA) database (https://portal.gdc.cancer.gov)—1215 in total, including 1102 tumor samples and 113 normal samples. We preprocessed the expression profile samples, including the expression value normalization log2(x + 1), and replaced 0 in the expression profile with the smallest positive number in the data set.25 Then, we downloaded the v22 version of the genome-wide annotation file from the GENCODE database (https://www.gencodegenes.org/), extracted the annotation information between ENSG and symbol, and annotated the symbol information of the breast cancer expression profile sample. The workflow of current study is showed in Figure S1.
Screening for Differentially Expressed Genes (DEGs)
This study is based on the linear models for microarray data package which was used to perform differential analysis of BRCA expression profile samples, and p value was corrected using the Benjamini–Hochberg method. Only genes with corrected p ≤0.05 and |log FC | ≥ 1 were considered to be significantly differentially expressed genes (DEGs).
Constructing the Co-Expression Network
We utilized WGCNA, which aims to find co-expressed gene modules, and to explore the relationship between gene networks and the phenotype of interest, as well as the core genes in the network. In terms of methods, WGCNA is divided into two parts: expression cluster analysis and phenotypic correlation. We calculated the clustering of the sample, and the result is shown in Figure S2.
Analysis of Gene Function
In this study, the R package clusterProfiler was used to perform GO function enrichment analysis on the blue module gene, and the Search Tool for Retrieval of Interacting Genes/Proteins (STRING) database was used to perform Kyoto Encyclopedia of Genes and Genomes (KEGG) pathway enrichment analysis on the blue module gene. P value was corrected using Benjamini–Hochberg method, and only GO terms and KEGG pathways with p <0.05 after correction were reserved for evaluating the biological functions of these genes.
Clinical Samples
Thirty of breast cancer tissue samples were obtained from Taizhou central hospital (Taizhou, Zhejiang Province, China) from 2015 to 2017. The patients who had a definite histological diagnosis of triple-negative breast cancer on the basis of the American Joint Committee Cancer (AJCC) without prior medical therapy were recruited for this study. And they all received immunotherapy after surgery. Clinical follow-up within 3 years, 8 cases appeared recurrence and metastasis. All the samples were obtained with the patients’ informed consent. This study was approved with the Medical Ethics and Human Clinical Trial Committee of Taizhou Central Hospital.
Expression of genes in cancer tissues of breast cancer patients was detected using qRT-PCR kit (Takara, Dalian, China) according to the instructions. All the sequences are as follows: CCNA2, F: CAGAAAACCATTGGTCCCTC, R: CACTCACTGGCTTTTCATCTTC; GAPDH, F: GCACCGTCAAGGCTGAGAAC, R: TGGTGAAGACGCCAGTGGA.
Analysis of Immunohistochemistry
The Human Protein Atlas (https://www.proteinatlas.org/) was utilized for validating candidate hub genes through immunohistochemistry. The result of images were from the following sources: i)
CCNA2 in normal control (n=3; https://www.proteinatlas.org/ENSG00000145386-CCNA2/tissue/breast#img); ii) CCNA2 in carcinoma tissue (n=3; https://www.proteinatlas.org/ENSG00000145386-CCNA2/pathology/breast+cancer#img). The result of each immunohistochemical staining sample was annotated manually. The illustration was based on fraction of stained cells (>75%, 25~75%, <25%) and staining intensity (strong, moderate, weak or negative).
Statistics
Statistical analysis was performed with SPSS software 26.0 (SPSS Inc., Chicago, IL, USA) or GraphPad Prism (Version8, GraphPad Software, Inc.). Data are presented as mean±standard deviation. The relative quantification of mRNA was calculated using the equation: amount of target = 2−ΔΔCt, the Mann–Whitney U-test was used for 2 sample comparisons that the data were non-normal distribution. The correlation of genes was calculated using Pearson’s correlation values. P-value of <0.05 was used to represent a statistically significant difference.
Results
Patients’ Characteristics
Clinical data included age, tumor, metastasis (TNM) stage, and estrogen receptor (ER) expression. Cluster analysis was utilized for calculating the correlation coefficient matrix, which showed that the variation was small and these genes were suitable for subsequent analysis. Detailed information on patients’ characteristics is presented in Table 1.
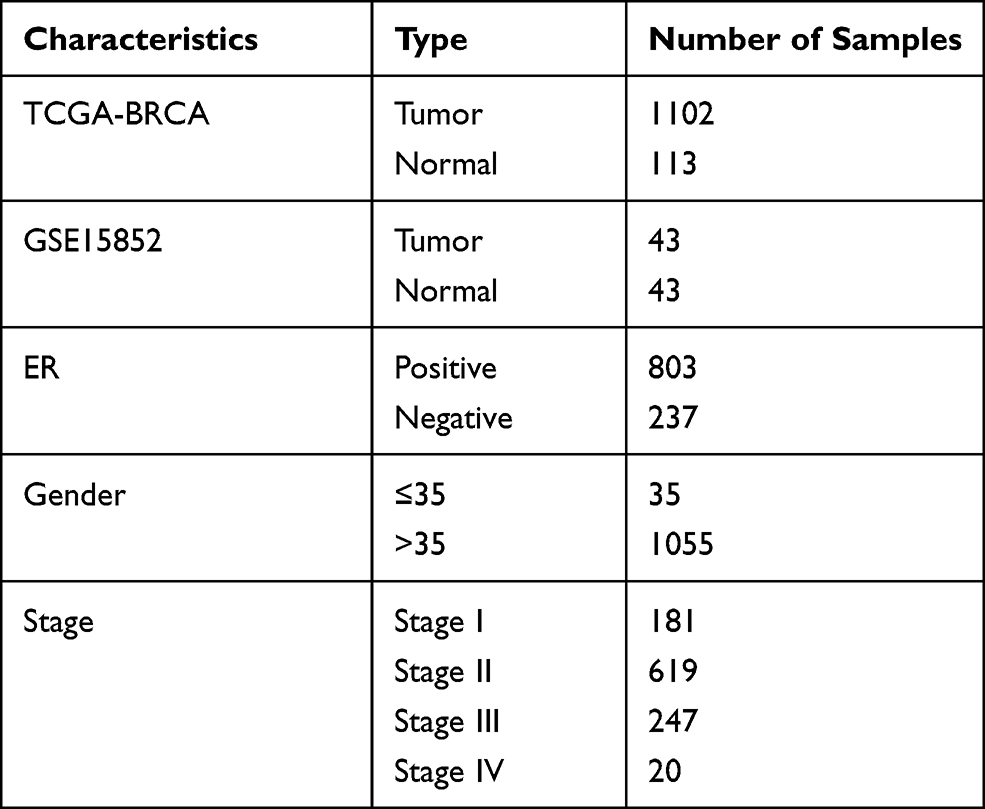 |
Table 1 Sample Information and Clinical Information |
Building a Co-Expression Network Based on DEGs
A total of 1721 DEGs were identified in this study, as shown in Figure 1. Based on the expression value matrix of the DEGs, the optimal β value was determined to be 6, as shown in Figure 2A and B. The horizontal axis of the graph represents the weight parameter β, and the vertical axis of 2A represents the square of the correlation coefficient between log(k) and log(p(k)) in the corresponding network. The higher the square of the correlation coefficient, the closer the network is to the distribution without the network scale. The vertical axis of 2B represents the mean value of all gene adjacency functions in the corresponding gene module.
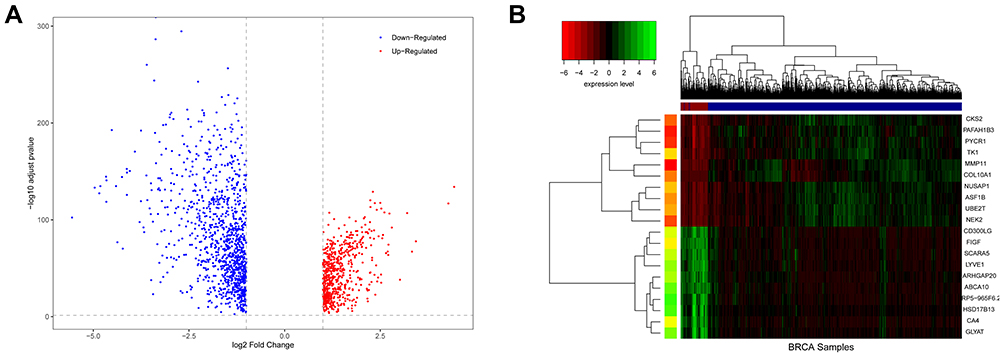 |
Figure 1 Differences in BRCA expression. (A) is a volcano map of differentially expressed genes. (B) is a hierarchical clustering heat map of the top 20 significant differentially expressed genes. On the x-axis, dark blue represents tumor samples, and brown represents normal samples. The y-axis represents the top 20 differentially expressed genes. |
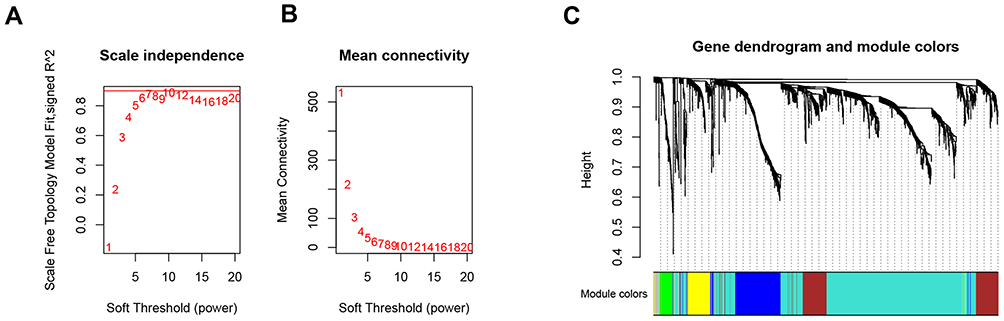 |
Figure 2 Choosing a suitable β value to construct a hierarchical clustering tree. (A) shows the scale-free fit index for the analysis of the soft threshold of 1‒20. (B) shows the analysis of the average connectivity of the 1‒20 soft threshold. (C) shows that genes were divided into different modules through hierarchical clustering, where different colors represent different modules. |
With the expression matrix and the estimated optimal β value, the co-expression matrix was directly constructed. This allows categorization of thousands of genomes of the input expression matrix into dozens of modules. We calculated the adjacency between genes and the similarity between genes according to the adjacency, inferred the coefficient of dissimilarity between genes, and obtained a hierarchical clustering tree between genes based on this. Then, according to the standard of the hybrid dynamic shearing tree, the minimum number of genes for each gene module was set to 30. After determining the gene modules according to the dynamic shearing method, the eigenvector value of each module was calculated in turn, and then cluster analysis on the modules was performed, and modules with a closer distance were merged into a new module. In the end, 6 modules were obtained, among which genes that could not be contained in any module were put into the gray module and removed in the subsequent analysis. The module clustering diagram is shown in Figure 2C.
Identification of Hub Genes Related to Immune Cell Infiltration
In this study, the Cell-type Identification By Estimating Relative Subsets Of known RNA Transcripts (CIBERSORT) algorithm was used to calculate the infiltration ratio of immune cells in the sample, and to screen the key modules related to immune cell infiltration. As shown in Figure 3, the blue module was related to a variety of immune cells, of which it was most related to memory-activated CD4 T cell (R2 = 0.39). Then, the key module genes were analyzed for the enrichment of GO and KEGG pathways, the top 20 GO items bubble chart (Figure 4A–C) and KEGG pathway circle chart (Figure 4D) are shown in Figure 4.
 |
Figure 3 Screening of modules that were related to sample traits. This picture is a heat map showing the correlation between the characteristic genes of the module and immune cells. |
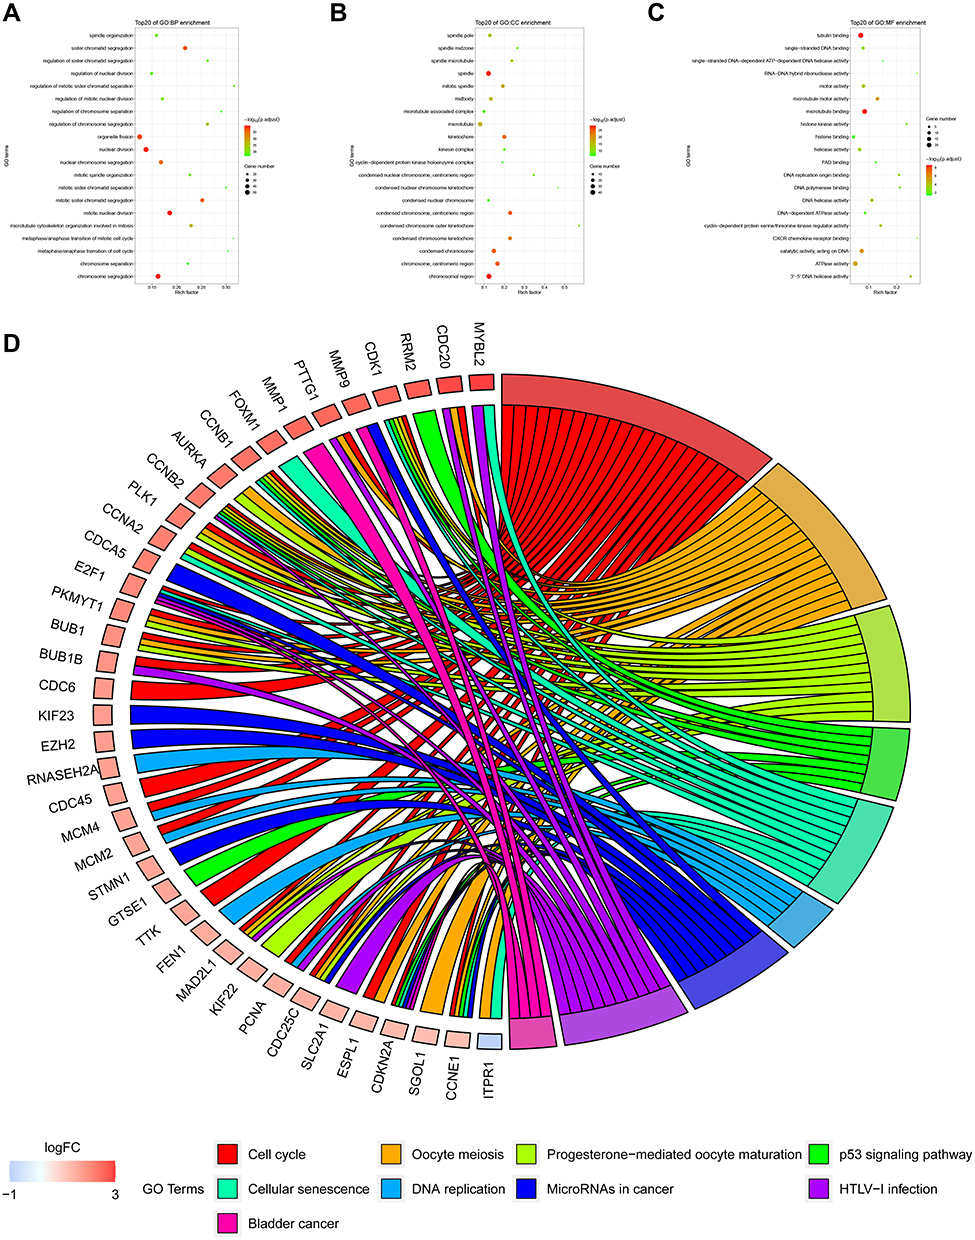 |
Figure 4 GO function and KEGG pathway analysis of key module genes. (A–C) are the bubble charts of the top 20 GO function items of the key module genes. (D) shows the top 20 KEGG pathway circle diagrams of key module genes. |
After analyzing the correlation between the modules and immune cells, the blue module had the greatest correlation with memory-activated CD4 T cells. According to the threshold criteria (module membership >0.9 and gene significance >0.35), 27 genes were identified as candidate hub genes. The results are shown in Figure 5B. This study further used genes in the blue module to construct a protein–protein interaction network, using confidence >0.7 and network node degree (degree) ≥95 as the threshold, and a total of 27 candidate hubs were identified. We used Cytoscape software to visualize the network, and the results are shown in Figure 5A. There was a total of 13 nodes that met two filtering conditions, as shown in Figure 5C.
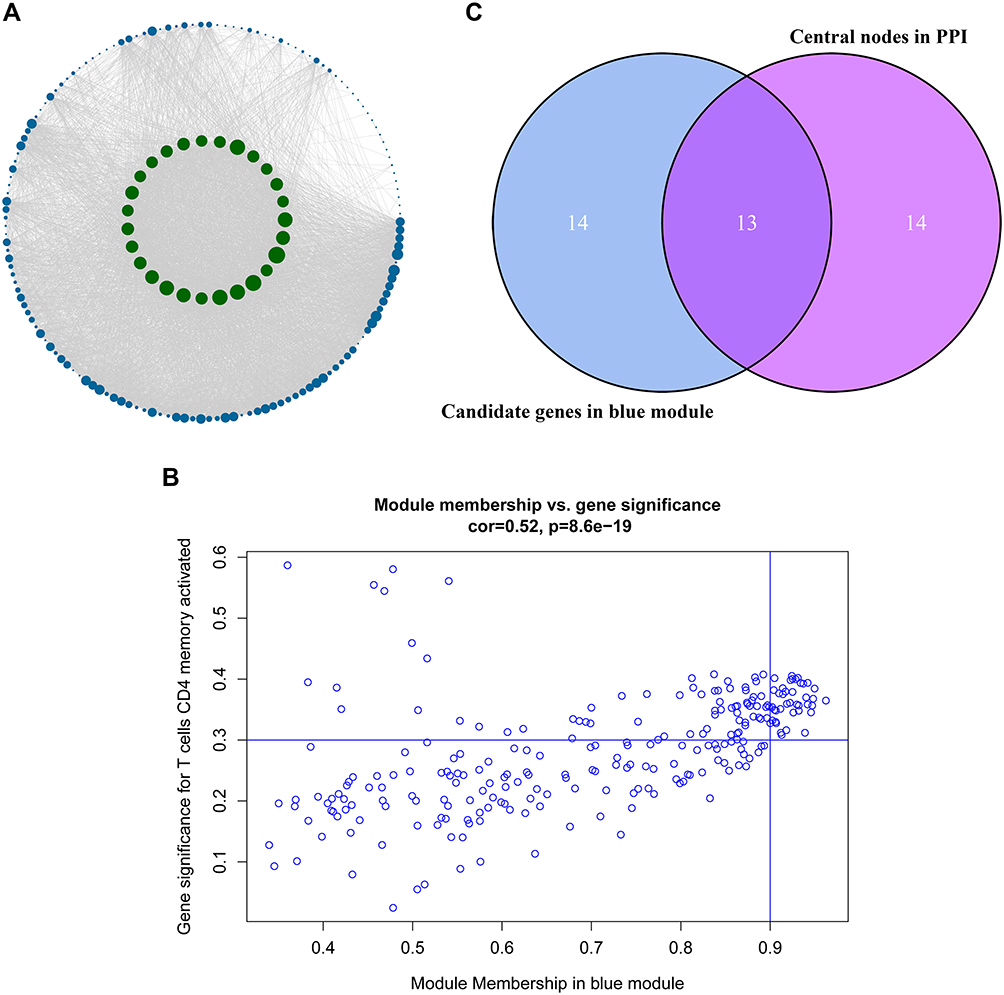 |
Figure 5 Identification of the hub genes. (A) is the protein–protein interaction (PPI) network from the blue modular gene. The greater the number of connected nodes, the larger the nodes. The green node represents the central node which is greater than 95 degrees. (B) is a scatter plot of blue modular genes. (C) is based on the genes whose PPI and co-expression network overlap and were selected as hub genes. |
Analysis of the Correlation Between the Hub Genes and Immune Cells, and the Correlation Between Immune Factors
In order to study the relationship between 13 of candidate hub genes and memory-activated immune CD4 T cells, we analyzed the expression data of these genes in the Tumor Immune Estimation Resource (TIMER) database (https://cistrome.shinyapps.io/timer/). The results show that these genes have a significant positive correlation with the level of memory-activated CD4 T cell infiltration (R<0.4) (Figure 6A). Figure 6B shows a scatter plot of CCNA2 expression and memory-activated CD4 T cell infiltration levels. There was a significant correlation between CCNA2 expression and memory-activated immune CD4 T cells infiltration (R=0.334, p <0.01).
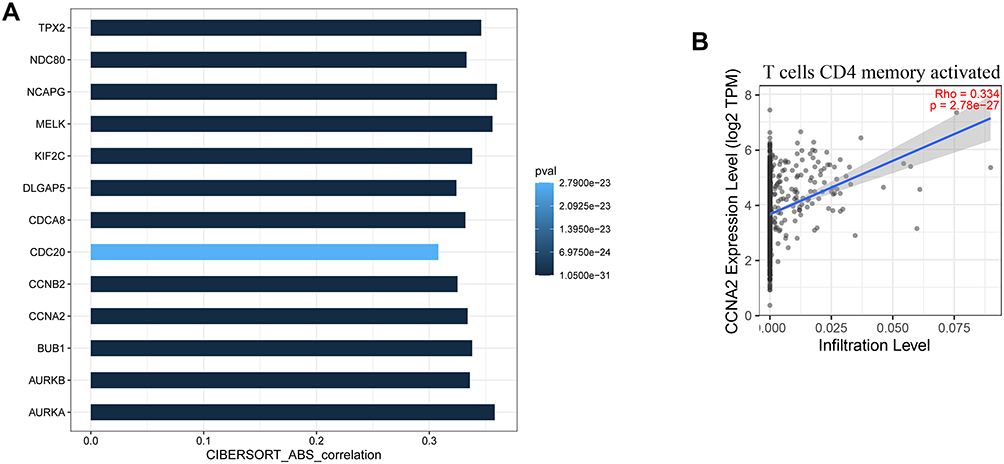 |
Figure 6 Validation of hub genes in TIMER database. (A) shows the relationship between the expression of the 13 hub genes and the level of memory-activated CD4 T cell infiltration. P≤0.05 was considered significant. (B) is a scatter plot of CCNA2 expression and memory-activated CD4 T cell infiltration level. |
We further used the Tumor and Immune System Interaction Database (TISIDB) (http://bioinformatics.psb.ugent.be/webtools/Venn/) to obtain the correlation coefficient between tumor-infiltrating lymphocytes (TILs) and gene expression. The most closely related cell was activated CD4 T cell (Figure 7A). We assessed correlation between the expression levels of these 13 hub genes and the expression levels of immune factors in the TISIDB, including chemokines, receptors, immune-inhibitory factors, and immune-stimulatory factors. Immune factors related to the hub gene, with an average correlation coefficient greater than 0.3, were selected, and the network was constructed using STRING and Cytoscape (Figure 7B). CCL7 was the most related chemokine, CCR8 was the most related receptor, LAG3 was the most related immune-inhibitory factor, and PVR and ULBP1 were the most related immune-stimulatory factors (Figure 7C–F).
 |
Figure 7 Validation of the hub genes in Tumor and Immune System Interaction Database. (A) and (C–F) represent heat maps of the correlation between hub genes and immune cells, chemokines, receptors, immune-inhibitory factors, and immune-stimulatory factors, respectively. (B) shows the protein–protein interaction network of the immune microenvironment. Green represents hub genes, red represents chemokines, purple represents receptors, yellow represents immune-inhibitory factors, and blue represents immune-stimulatory factors. |
Validation and Correlation Analysis Between Immune-Related Hub Genes and Clinical Indicators
We downloaded clinical data for breast cancer from TCGA to study the relationship between 13 of hub genes and clinical indicators. The correlation between the 13 hub genes and ER is shown in Figure 8A. The results show that there is a significant correlation between the hub genes and ER. The expression of the hub genes by ER-positive cells was significantly lower than that of ER-negative cells (p <0.01). The correlation between these hub genes and age characteristics is shown in Figure 8B. We grouped patients by age, using 35 years of age as the dividing line. The results showed that 8 of the 13 hub genes were closely related to age characteristics (p <0.05). They are AURKA, AURKB, CCNA2, CCNB2, CDCA8, DLGAP5, NCAPG, and NDC80. In addition, the correlation between the hub genes and breast cancer stage was studied, and the results showed that there was significant correlation between different genes and stages (p <0.01, Figure 8C).
 |
Figure 8 Analysis of the correlation between hub genes and clinical characteristics. (A–C) are box plots of the correlation between hub genes and estrogen receptor, age groups, and stages, respectively. |
We further used GSE15852 as a validation data set to verify the expression of these hub genes. The results are shown in Figure 9. The genes with significant differences in expression by the tumors were AURKA, CCNA2, CDC20, MELK, and NDC80.
 |
Figure 9 The expression levels of hub genes in the validation set. (A–M) are box plots of the expression levels of the hub genes in the validation set. (N) is a volcano map of differentially expressed genes. |
Survival Analysis of Hub Genes and Single Gene Set Enrichment Analysis
Kaplan–Meier survival analysis was performed on the 13 hub genes. Among them, BUB1, CCNA2, and CCNB2 were closely related to survival results. The results are shown in Figure 10. According to the median expression levels of BUB1, CCNA2, and CCNB2, breast cancer samples from TCGA were divided into high expression group and low expression group, and pathway gene set enrichment analysis was performed. For example, the enrichment analysis of the CCNA2 gene set showed that there were 5 significantly enriched pathways in the high expression group, and 2 significantly enriched pathways in the low expression group. The most significant pathways in the high and low expression groups are shown in Figure 11.
 |
Figure 10 Kaplan–Meier survival analysis. Figure shows the overall survival analysis for BUB1 (A), CCNA2 (B), CCNB2 (C). |
 |
Figure 11 Single gene enrichment analysis. (A and B) are the enrichment classification diagrams of these two pathways (cell cycle and neuroactive ligand receptor interaction). (C) is a diagram of the enrichment pathway and its gene circle. |
The Expression of CCNA2 is Associated with Metastatic Breast Cancer
In addition, the expression of CCNA2 was detected in tissues from 30 of patients with a definite histological diagnosis of triple-negative breast cancer. Clinical follow-up within 3 years, 8 cases appeared recurrence and metastasis after surgery and immunotherapy. The result showed that a marked increase of CCNA2 level in the patients with metastatic compared with nonmetastatic (Figure 12). Furthermore, the expression of CCNA2 was investigated through immunohistochemistry. The result showed that the expression of CCNA2 in tumor tissues was elevated compared with control (Figure 13).
 |
Figure 12 Expression levels of CCNA2 in tissues between non-metastatic breast cancer and metastatic breast cancer patients after surgery and immunotherapy. *p<0.05. |
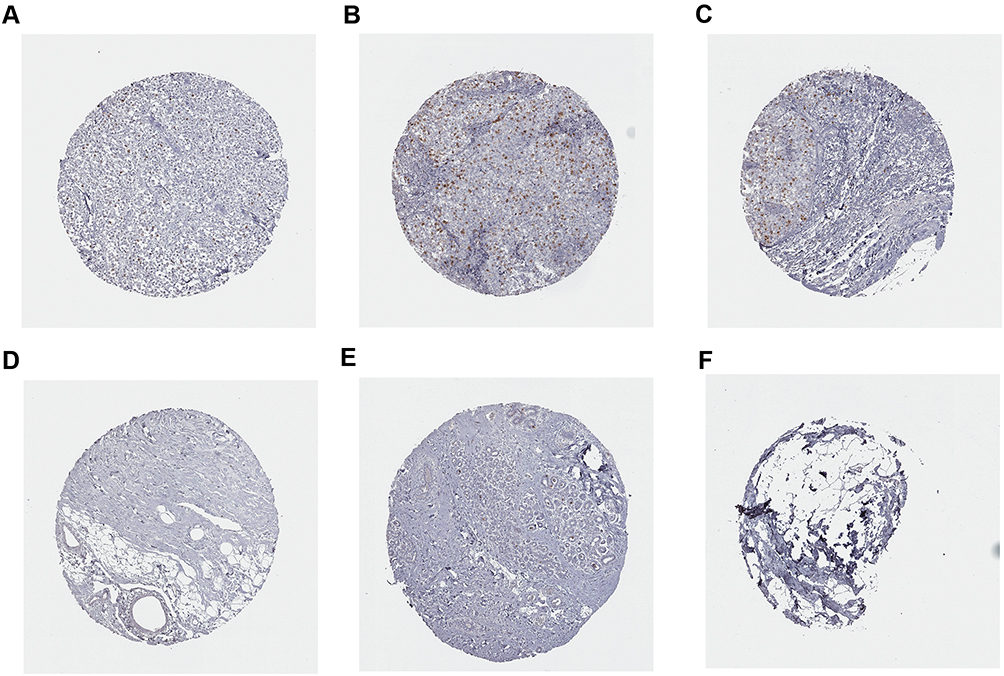 |
Figure 13 Immunohistochemistry analysis of CCNA2 expression in breast cancer samples. Data were obtained from the human protein atlas. (A) Protein levels of CCNA2 in tumor tissue (staining: Low; intensity: week; quantity: <25%). (B and C) Protein levels of CCNA2 in tumor tissue (staining: Medium; intensity: strong; quantity: <25%). (D–F) Protein levels of CCNA2 in normal tissue (staining: not detected; intensity: negative; quantity: none). |
Discussion
Breast cancer is a global disease, with the highest incidence rate among malignant tumors affecting women worldwide26,27 and the genes involved have a high degree of variability and a special biological microenvironment,28,29 which limit the efficacy of breast cancer therapy. Breast cancer patients mostly die from tumor metastasis and recurrence.30–32 Immunotherapy has become a new type of effective treatment for cancer, which can improve the survival rate of patients. Initially, breast cancer was considered as a poorly immunogenic malignant tumor, and it was not extensively studied because of its supposed insensitivity to immunotherapy.32 However, with advances in research, breast cancer immunotherapy has made clinically significant research progress,33,34 and the development of immunotherapy has brought new hope for the treatment of breast cancer.10,35 The purpose of this project was to identify potential immunotherapy biomarkers in breast cancer.
The WGCNA approach typically deals with the identification of gene modules by using the gene expression levels that are highly correlated across samples. Further, this approach also leads to construction of Gene Co-expression Network, a scale free network, where, genes are represented as nodes and edges depict associations among genes. In such network, highly connected genes are called hub genes, which are expected to play an important role in understanding the biological mechanism.
Tumor-Infiltrating Lymphocytes (TILs) exist around tumor cells and are of great significance for determining the prognosis of breast cancer patients. TILs present pre-existing immunity and are useful markers response to immunotherapy in breast cancer, especially for TNBC.36,37 The subgroups of TILs in the tumor microenvironment mainly include CD4+ cell, CD8+ cell, and regulatory T cell. Our results show that the key module was mostly related to activated and memory CD4+ T cells. Recent studies have shown that the balance between infiltrating immune cells in the tumor microenvironment determines the prognosis of tumor patients. It has been reported that improved breast cancer treatment response is related to immune phenotype, which is typically characterized by activated and memory CD4 T cells.38,39
The results of GO and KEGG pathway analysis indicated that the gene cluster in the most important module may play the key role in cell cycle, tumor growth, and aging. From the protein–protein interaction network, 13 of hub genes were screened out: AURKA, AURKB, BUB1, CCNA2, CCNB2, CDC20, CDCA8, DLGAP5, KIF2C, MELK, NCAPG, NDC80, and TPX2. The relationship between these hub genes and memory-activated immune CD4 T cells was analyzed using the TIMER database, and the results showed that these genes have a significant positive correlation with the level of memory-activated CD4 T cell infiltration. The TISIDB was used to study the correlation between the expression levels of hub genes and the expression levels of immune factors, such as immune cells, chemokines, receptors, immune-inhibitory factors, and immune-stimulatory factors. A significant relationship between hub genes and clinical indicators was also indicated. The results revealed that the expression of the hub genes in patients with ER-positive tumors was significantly lower than that in patients with ER-negative tumors, and there was a significant correlation between different genes and TNM stage. Especially there was a marked increase of genes expression when the lymph node appeared the symptom of swollen. These genes therefore played important roles in the development of breast cancer. We further used GSE15852 as a validation data set to verify the expression of these hub genes. The results revealed that genes with significant increase by the tumors were AURKA, CCNA2, CDC20, MELK, and NDC80. Furthermore, the Kaplan–Meier curve showed the poor prognostic outcomes when BUB1, CCNA2, and CCNB2 increased in patients with breast cancer. These genes may participate in the remodeling of the tumor microenvironment and lay the foundation for tumor metastasis and progression. Taken together, CCNA2 was identified as potential marker for immune therapy in breast cancer. It is reported that CCNA2 were overexpressed in triple-negative breast cancer, and they could be novel biomarkers for the diagnosis and treatment of triple-negative breast cancer.26,40 Additionally, CCNA2 expression was detected in clinical tissue samples from 30 of patients with a definite histological diagnosis of triple-negative breast cancer. After clinical follow-up within 3 years, 8 cases appeared recurrence and metastasis after surgery and immunotherapy. The result showed an increase of CCNA2 level in the patients with metastatic compared to nonmetastatic. Furthermore, immunohistochemistry result showed that the expression of CCNA2 in tumor tissues was elevated compared with control. Through the current research, we discovered the new significance and important role of CCNA2 in immunotherapy, which could be helpful on the selection of treatment strategies.
In conclusion, we identified that CCNA2 may play an important role in immune infiltration of breast cancer, and provides important evidence that supports the significance of CCNA2 as a potential immunotherapy biomarker for breast cancer.
Data Sharing Statement
All data, models, and code generated or used during the study appear in the submitted article.
Ethics Approval and Consent to Participate
The methodologies of this research were approved by the Ethics Committee of Taizhou Central Hospital and obeyed the principles of the Declaration of Helsinki.
Author Contributions
All authors made substantial contributions to conception and design, acquisition of data, or analysis and interpretation of data; took part in drafting the article or revising it critically for important intellectual content; agreed to submit to the current journal; gave final approval of the version to be published; and agree to be accountable for all aspects of the work.
Funding
This work was supported by Natural Science Foundation of China (grant no. 81902138), Zhejiang Science & Technology of Analysis and Testing Planning Project (grant no. LGC19H200002, 2018C37037), the Zhejiang Medical and Health Science and Technology Project (grant no. 2019KY788), and Taizhou Science & Technology Plan Project (grant no. 1901ky35).
Disclosure
The authors declare no potential conflicts of interest.
References
1. Liao WS, Ho Y, Lin YW, et al. Targeting EGFR of triple-negative breast cancer enhances the therapeutic efficacy of paclitaxel- and cetuximab-conjugated nanodiamond nanocomposite. Acta Biomater. 2019;86:395–405. doi:10.1016/j.actbio.2019.01.025
2. Bray F, Ferlay J, Soerjomataram I, Siegel RL, Torre LA, Jemal A. Global cancer statistics 2018: GLOBOCAN estimates of incidence and mortality worldwide for 36 cancers in 185 countries. CA Cancer J Clin. 2018;68(6):394–424. doi:10.3322/caac.21492
3. Tsuchida J, Nagahashi M, Takabe K, Wakai T. Clinical impact of sphingosine-1-phosphate in breast cancer. Mediators Inflamm. 2017;2017:2076239. doi:10.1155/2017/2076239
4. Aumeeruddy MZ, Mahomoodally MF. Combating breast cancer using combination therapy with 3 phytochemicals: piperine, sulforaphane, and thymoquinone. CA Cancer Soc. 2019;125(10):1600–1611.
5. Wang J, Zhou P. New approaches in CAR-T cell immunotherapy for breast cancer. Adv Exp Med Biol. 2017;1026:371–381.
6. Hong BS, Ryu HS, Kim N, et al. Tumor suppressor miRNA-204-5p regulates growth, metastasis, and immune microenvironment remodeling in breast cancer. Cancer Res. 2019;79(7):1520–1534. doi:10.1158/0008-5472.CAN-18-0891
7. Hadadi E, Taylor W, Li XM, et al. Chronic circadian disruption modulates breast cancer stemness and immune microenvironment to drive metastasis in mice. Nat Commun. 2020;11(1):3193. doi:10.1038/s41467-020-16890-6
8. Savas D, Tzankov A, Muenst SE. Role of the tumor microenvironment in breast cancer. Pathobiology. 2015.
9. Di Cosimo S. Advancing immunotherapy for early-stage triple-negative breast cancer. Lancet. 2020;396(10257):1046–1048. doi:10.1016/S0140-6736(20)31962-0
10. Deng J, Thennavan A, Shah S, et al. Serial single-cell profiling analysis of metastatic TNBC during Nab-paclitaxel and pembrolizumab treatment. Breast Cancer Res Treat. 2020;185(1):85–94. doi:10.1007/s10549-020-05936-4
11. Mansour M, Teo ZL, Luen SJ, Loi S. Advancing immunotherapy in metastatic breast cancer. Curr Treat Options Oncol. 2017;18(6):35. doi:10.1007/s11864-017-0478-9
12. Budczies J, Bockmayr M, Denkert C, et al. Classical pathology and mutational load of breast cancer – integration of two worlds. J Pathol Clin Res. 2015;1(4):225–238. doi:10.1002/cjp2.25
13. Loi S, Sirtaine N, Piette F, et al. Prognostic and predictive value of tumor-infiltrating lymphocytes in a Phase III randomized adjuvant breast cancer trial in node-positive breast cancer comparing the addition of docetaxel to doxorubicin with doxorubicin-based chemotherapy: BIG 02-98. J Clin Oncol. 2013;31(7):860–867. doi:10.1200/JCO.2011.41.0902
14. Tang S, Ning Q, Yang L, Mo Z, Tang S. Mechanisms of immune escape in the cancer immune cycle. Int Immunopharmacol. 2020;86:106700. doi:10.1016/j.intimp.2020.106700
15. Song L, Chen X, Mi L, et al. Icariin-induced inhibition of SIRT6/NF-kappaB triggers redox mediated apoptosis and enhances anti-tumor immunity in TNBC. Cancer Sci. 2020;111(11):4242–4256. doi:10.1111/cas.14648
16. Fiorini E, Veghini L, Corbo V. Modeling cell communication in cancer with organoids: making the complex simple. Front Cell Dev Biol. 2020;8:166. doi:10.3389/fcell.2020.00166
17. Weinstein JN, Collisson EA, Mills GB, et al. The cancer genome atlas pan-cancer analysis project. Nat Genet. 2013;45(10):1113–1120. doi:10.1038/ng.2764
18. Zhu Y, Qiu P, Ji Y. TCGA-assembler: open-source software for retrieving and processing TCGA data. Nat Methods. 2014;11(6):599–600. doi:10.1038/nmeth.2956
19. Uhlen M, Zhang C, Lee S, et al. A pathology atlas of the human cancer transcriptome. Science. 2017;357(6352):eaan2507. doi:10.1126/science.aan2507
20. Baughman JM, Perocchi F, Girgis HS, et al. Integrative genomics identifies MCU as an essential component of the mitochondrial calcium uniporter. Nature. 2011;476(7360):341–345. doi:10.1038/nature10234
21. Radulescu E, Jaffe AE, Straub RE, et al. Identification and prioritization of gene sets associated with schizophrenia risk by co-expression network analysis in human brain. Mol Psychiatry. 2020;25(4):791–804. doi:10.1038/s41380-018-0304-1
22. Liang H, Bai Y, Wang H, Yang X. Identification of LncRNA prognostic markers for ovarian cancer by integration of co-expression and CeRNA network. Front Genet. 2020;11:566497. doi:10.3389/fgene.2020.566497
23. Huang H, Tan M, Zheng L, et al. Prognostic implications of the complement protein C1Q and its correlation with immune infiltrates in osteosarcoma. Onco Targets Ther. 2021;14:1737–1751. doi:10.2147/OTT.S295063
24. Qi J, Liu Y, Hu J, et al. Identification of FPR3 as a unique biomarker for targeted therapy in the immune microenvironment of breast cancer. Front Pharmacol. 2020;11:593247. doi:10.3389/fphar.2020.593247
25. Ding W, Chen G, Shi T. Integrative analysis identifies potential DNA methylation biomarkers for pan-cancer diagnosis and prognosis. Epigenetics. 2019;14(1):67–80. doi:10.1080/15592294.2019.1568178
26. Gao T, Han Y, Yu L, Ao S, Li Z, Ji J. CCNA2 is a prognostic biomarker for ER+ breast cancer and tamoxifen resistance. PLoS One. 2014;9(3):e91771.
27. Cheng Y, Li Z, Xie J, et al. MiRNA-224-5p inhibits autophagy in breast cancer cells via targeting Smad4. Biochem Biophys Res Commun. 2018;506(4):793–798. doi:10.1016/j.bbrc.2018.10.150
28. Guha M, Srinivasan S, Raman P, et al. Aggressive triple negative breast cancers have unique molecular signature on the basis of mitochondrial genetic and functional defects. Biochim Biophys Acta Mol Basis Dis. 2018;1864(4 Pt A):1060–1071. doi:10.1016/j.bbadis.2018.01.002
29. Hollern DP, Andrechek ER. A genomic analysis of mouse models of breast cancer reveals molecular features of mouse models and relationships to human breast cancer. Breast Cancer Res. 2014;16(3):R59. doi:10.1186/bcr3672
30. Liu Y, Xie X, Hou X, et al. Functional oral nanoparticles for delivering silibinin and cryptotanshinone against breast cancer lung metastasis. J Nanobiotechnology. 2020;18(1):83. doi:10.1186/s12951-020-00638-x
31. Tseng YJ, Huang CE, Wen CN, et al. Predicting breast cancer metastasis by using serum biomarkers and clinicopathological data with machine learning technologies. Int J Med Inform. 2019;128:79–86. doi:10.1016/j.ijmedinf.2019.05.003
32. Gallego-Ortega D, Ledger A, Roden DL, et al. ELF5 drives lung metastasis in luminal breast cancer through recruitment of Gr1+ CD11b+ myeloid-derived suppressor cells. Plos Biol. 2015;13(12):e1002330. doi:10.1371/journal.pbio.1002330
33. Kreutzfeldt J, Rozeboom B, Dey N, De P. The trastuzumab era: current and upcoming targeted HER2+ breast cancer therapies. Am J Cancer Res. 2020;10(4):1045–1067.
34. Panagi M, Voutouri C, Mpekris F, et al. TGF-beta inhibition combined with cytotoxic nanomedicine normalizes triple negative breast cancer microenvironment towards anti-tumor immunity. Theranostics. 2020;10(4):1910–1922. doi:10.7150/thno.36936
35. Desai D, Shende P. Strategic aspects of NPY-based monoclonal antibodies for diagnosis and treatment of breast cancer. Curr Protein Pept Sci. 2020;21(11):1097–1102. doi:10.2174/1389203721666200918151604
36. Lyu L, Yao J, Wang M, et al. Overexpressed pseudogene HLA-DPB2 promotes tumor immune infiltrates by regulating HLA-DPB1 and indicates a better prognosis in breast cancer. Front Oncol. 2020;10:1245. doi:10.3389/fonc.2020.01245
37. Goff SL, Danforth DN. The role of immune cells in breast tissue and immunotherapy for the treatment of breast cancer. Clin Breast Cancer. 2020;21(1):e63–e73. doi:10.1016/j.clbc.2020.06.011
38. von der Lippe GH, Lien T, Tekpli X, et al. Immune phenotype of tumor microenvironment predicts response to bevacizumab in neoadjuvant treatment of ER-positive breast cancer. Int J Cancer. 2020.
39. Zerdes I, Sifakis EG, Matikas A, et al. Programmed death-ligand 1 gene expression is a prognostic marker in early breast cancer and provides additional prognostic value to 21-gene and 70-gene signatures in estrogen receptor-positive disease. Mol Oncol. 2020;14(5):951–963. doi:10.1002/1878-0261.12654
40. Lu Y, Yang G, Xiao Y, et al. Upregulated cyclins may be novel genes for triple-negative breast cancer based on bioinformatic analysis. Breast Cancer. 2020;27(5):903–911. doi:10.1007/s12282-020-01086-z
 © 2021 The Author(s). This work is published and licensed by Dove Medical Press Limited. The
full terms of this license are available at https://www.dovepress.com/terms
and incorporate the Creative Commons Attribution
- Non Commercial (unported, 3.0) License.
By accessing the work you hereby accept the Terms. Non-commercial uses of the work are permitted
without any further permission from Dove Medical Press Limited, provided the work is properly
attributed. For permission for commercial use of this work, please see paragraphs 4.2 and 5 of our Terms.
© 2021 The Author(s). This work is published and licensed by Dove Medical Press Limited. The
full terms of this license are available at https://www.dovepress.com/terms
and incorporate the Creative Commons Attribution
- Non Commercial (unported, 3.0) License.
By accessing the work you hereby accept the Terms. Non-commercial uses of the work are permitted
without any further permission from Dove Medical Press Limited, provided the work is properly
attributed. For permission for commercial use of this work, please see paragraphs 4.2 and 5 of our Terms.