Back to Journals » Journal of Inflammation Research » Volume 19
Integrated Multi-Omics Analysis Reveals IRF1-Driven Microglial PANoptosis via ZBP1 in Spinal Cord Injury
Authors Xu X, Chen S, Liu S ![]() , Wang Y, Wang C, Liang R
, Wang Y, Wang C, Liang R ![]()
Received 23 October 2025
Accepted for publication 3 March 2026
Published 16 March 2026 Volume 2026:19 574990
DOI https://doi.org/10.2147/JIR.S574990
Checked for plagiarism Yes
Review by Single anonymous peer review
Peer reviewer comments 3
Editor who approved publication: Prof. Dr. Dharmappa Krishnappa
Xiongjie Xu,1,* Song Chen,1,* Shichao Liu,1,* Yinqing Wang,1 Chunhua Wang,1,2 Risheng Liang1,2
1Department of Neurosurgery, Fujian Medical University Union Hospital, Fujian, People’s Republic of China; 2Fujian Institute of Neurosurgery, Fujian, People’s Republic of China
*These authors contributed equally to this work
Correspondence: Chunhua Wang, Department of Neurosurgery, Fujian Medical University Union Hospital, 29 Xinquan Road, Gulou, Fuzhou, Fujian, 350001, People’s Republic of China, Tel +8613599396262, Email [email protected] Risheng Liang, Department of Neurosurgery, Fujian Medical University Union Hospital, 29 Xinquan Road, Gulou, Fuzhou, Fujian, 350001, People’s Republic of China, Tel +8613365910331, Email [email protected]
Background: Spinal cord injury (SCI) is a devastating condition with high disability rates. In the secondary injury phase, activated microglia play a central role by mediating the inflammatory response. Notably, pro-inflammatory forms of programmed cell death, including PANoptosis, can exacerbate inflammatory cascade. Although microglia-driven inflammation is well-characterized in SCI, it remains unclear whether microglia undergo PANoptosis. Furthermore, potential therapeutic agents targeting this specific process remain to be discovered in SCI.
Methods: We performed an integrated analysis of bulk RNA-seq and scRNA-seq to investigate the heterogeneity of programmed cell death and PANoptosis across different cell types. Candidate genes associated with high PANoptosis activity scores were identified using correlation analysis. Furthermore, four machine learning algorithms were applied to screen for core genes. By combining transcription factor (TF) activity prediction and Chip-atlas database analysis, we identified TFs that potentially regulate PANoptosis. Validation experiments were conducted at each analytical stage using animal and cellular models.
Results: Pyroptosis, apoptosis, and necroptosis, were persistently upregulated following SCI. Notably, the PANoptosis pathway was significantly enriched and predominantly localized to microglia. Further investigation identified ZBP1 as prominently upregulated PANoptosome sensor associated with microglial PANoptosis. Moreover, IRF1 was found to be enriched at the promoter region of Zbp1 and transcriptionally regulated its expression. Pharmacological inhibition of IRF1 was accompanied by reduced ZBP1 expression, suppression of PANoptosis-related execution markers, decreased TNF-α and IL-6 release, and attenuation of M1-like microglial polarization.
Conclusion: These findings highlight the IRF1–ZBP1 axis as a regulatory mechanism of PANoptosis in microglia following SCI and suggest it as a potential therapeutic target to modulate neuroinflammation.
Keywords: interferon regulatory factor 1, Z-DNA binding protein 1, programmed cell death, spinal cord injury, neuroinflammation
Background
Spinal cord injury (SCI) is a devastating condition characterized by primary mechanical injury and secondary cascade injuries that can lead to irreversible neuronal loss and persistent inflammatory responses in the injury microenvironment.1 After the initial injury, a secondary cascade injury involving inflammation, oxidative stress, and programmed cell death (PCD) can exacerbate tissue damage and impede functional recovery. The oxidative stress elaborates reactive oxygen species (ROS) that induce lipid peroxidation of the myelin sheath due to its elevated lipid composition, leading to neurodegenerative changes.2 Among the pathological mechanisms, microglia-mediated neuroinflammation have a critical impact on functional outcomes. Due to the inevitability of primary injury, aggressive intervention to block secondary cascade amplification effect is an important therapeutic strategy to improve neurological function. Basic medical studies have revealed potential treatments, but they have yet to be successfully translated into clinical applications. Therefore, a greater understanding of the pathogenesis is needed to be fully elucidated.
Microglia are innate immune cells of the central nervous system that rapidly transition from a resting state to an activated state after SCI. The pro-inflammatory M1-like phenotype (marked by iNOS and CD86) produces proinflammatory cytokines such as TNF-α, IL-1β, and IL-6. Notably, persistent overactivation of microglia ultimately culminates in cell death. This pro-inflammatory cell death provides new pro-inflammatory molecules for the continued occurrence of inflammation. Uncontrolled hyper-inflammation may result in further cell death, leading to the formation of a positive feedback loop of inflammation and cell death, ultimately resulting in a poor prognosis.3 Therefore, inhibiting pro-inflammatory microglial death and thus blocking the continued occurrence of inflammation may be a promising strategy for the treatment of SCI.4
Depending on the triggering mechanism, cell death can be divided into uncontrollable accidental cell death and PCD. PCD is classified into 13 different forms according to the pathological mechanisms, including: alkaliptosis, apoptosis, autophagy, cuproptosis, disulfidptosis, entotic cell death, ferroptosis, lysosome-dependent cell death, necroptosis, NETotic cell death, oxeiptosis, parthanatos, and pyroptosis.5 Many forms of PCD have been identified in SCI model, but most studies focus only on one form.6–8 The findings of these studies suggest a potential hypothesis that multiple forms of PCD may coexist in the injured spinal cord. PANoptosis is a novel form of pro-inflammatory cell death regulated by the PANoptosome, which is based on the extensive crosstalk among pyroptosis, apoptosis, and necroptosis.9 When a single pathway is blocked, compensation from other pathways may occur, ultimately resulting in lytic cell death. Recent studies have revealed that PANoptosis plays an important role in neurodegenerative diseases and sterile inflammatory diseases. Notably, Lou et al revealed the existence of ZBP1-mediated neuronal PANoptosis after SCI.10 However, whether SCI causes microglia to be regulated by multiple forms of PCD and whether PANoptosis is involved in microglial pro-inflammatory cell death remains unknown.
Therefore, we used temporal transcriptomic analysis (bulk RNA-seq) to investigate the presence of different forms of PCD after SCI and explore their underlying mechanisms. By combining the results of single-cell mRNA sequencing (scRNA-seq), we found that there were three forms of PCD (pyroptosis, apoptosis, and necroptosis) and PANoptosis, which were mainly localized in microglia. Signal transduction regulated by the transcriptional cascade plays a central role in maintaining cellular homeostasis and stress response, and its regulatory patterns are stimulus-specific and cell type-dependent. Clarifying the mechanism of transcriptional activation after SCI may help expand new therapeutic approaches. Combined with Chromatin immunoprecipitation-sequencing (ChIP-seq) analysis, it was revealed that microglia are regulated by interferon regulatory factor 1 (IRF1) to promote Z-DNA binding protein 1 (Zbp1) transcription, which in turn is associated with the occurrence of PANoptosis, thereby facilitating secondary cascade injury responses.
Materials and Methods
Data Collection
Bulk RNA-seq (GSE45006, GSE133093, GSE174549, GSE183591) and scRNA-seq (GSE213240) data sets for SCI in Sprague-Dawley (SD) rats were downloaded from the Gene Expression Omnibus (GEO) database. All time points (Day 1 to Day 56) of the included GSE45006 were used for time series analysis. Data from day 7 after SCI and sham group in GSE133093, GSE174549, and GSE183591 were included. For scRNA-seq data (GSE213240), the injury samples were selected for subsequent analysis. In order to validate the robustness of the analytical results across different species, we downloaded mouse scRNA-seq data from figshare and included the injury samples from day 7 for analysis.11
The key regulatory genes containing the above 13 PCD patterns were included.12 A total of 7 alkaliptosis genes, 126 apoptosis genes, 144 autophagy genes, 14 cuproptosis genes, 4 disulfidptosis genes, 8 entotic cell death genes, 69 ferroptosis genes, 202 lysosome-dependent cell death genes, 123 necroptosis genes, 6 NETotic cell death genes, 21 oxeiptosis genes, 5 parthanatos genes, and 28 pyroptosis genes were collected (Table S1). The PANoptosis gene set was collated according to previous studies, with a total of 40 genes (Table S2).13,14 As for the PANoptosome gene set, there were a total of 12 genes (Table S3).9
C-Means Clustering
Cluster analysis was performed in R using the clusterGvis package (v.0.1.2), with parameters set to the Mfuzz and C-means algorithms.15,16
Bulk RNA-Seq Analysis
Differentially Expressed Genes (DEGs) were obtained using the limma package (v.3.62.2). P-values were corrected for multiple comparisons via the Benjamini-Hochberg procedure (adjusted p-value). The adjusted p-value <0.05 and absolute fold change ≥2 were used as thresholds for screening DEGs.
Functional Enrichment Analysis
The Gene Ontology (GO) and Kyoto Encyclopedia of Genes and Genomes (KEGG) pathway enrichment analyses were performed using clusterProfiler (v.4.14.4).17 Gene Set Enrichment Analysis (GSEA) was performed using GSVA (v.2.0.4).
scRNA-Seq Analysis
scRNA-seq data were processed and analyzed using Seurat (v.5.2.0). Cells with nFeature_RNA > 200, nFeature_RNA < 2500, and less than 10% mitochondrial genes were included. Gene expression data were normalized and scaled. The first 2000 genes were analyzed using the RunPCA function, and the top 15 principal components were selected. Batch effects were identified and removed using the harmony (v.1.2.3) algorithm. The “FindNeighbors” and “FindClusters” functions were applied to cluster cells. UMAP were generated for visualizing clusters. Cell type annotation of clusters was based on canonical marker genes. Using the “FindMarkers” function, the threshold was set to logfc.threshold=0.25 and min.pct=0.25, and the Wilcoxon rank-sum test was performed to identify the DEGs.
Pathway Activity Evaluation
The ssGSEA algorithm was used to calculate the pathway activity score. For scRNA-seq, pearson correlation coefficient analysis was conducted to identify genes that were closely related to PANoptosis activity. We also identified DEGs between the two groups by dividing cells into high and low PANoptosis activity groups based on the median of the scores.
Identify Independent Risk Factors Using Multivariate Logistic Regression Analysis
Further analysis was performed to determine the candidate genes for high PANoptosis activity. Four machine learning algorithms, including Extreme Gradient Boosting (xGBoost), Boruta, Random Forest (RF), and Least absolute shrinkage and selection operator (LASSO), were used to identify candidate genes. The intersection of all machine learning algorithms was the core genes. The core genes were included in univariate and multivariate logistic regression analysis. Independent risk factors were assessed using the odds ratio (OR) and 95% confidence interval (CI).
Assessment of Transcription Factor Activity
Transcription factor (TF) activity was assessed using decoupleR (v.2.9.7). Rat TFs were obtained from the OmniPath database, where TF complexes were maintained. The inference of TF activity was based on a Univariate Linear Model. TF activity was inferred from gene expression of target genes induced or repressed by TFs.18
Animals and Ethics
Male wild-type SD rats (6–8 weeks old, weighing 200–250 g) were purchased from SiPeiFu (Beijing, China). All rats were housed under controlled conditions with a 12-hour light/dark cycle, 55–60% humidity, and a temperature of 22–24°C. Throughout the study, the rats had ad libitum access to food and water and were cared for by dedicated personnel blinded to the experimental procedures. This research was performed in compliance with the ARRIVE guidelines (Animal Research: Reporting of In Vivo Experiments) to ensure comprehensive reporting. This study was approved by the Animal Ethics Committee of Fujian Medical University (IACUC Approval No. FJMU 2024–0314), and all procedures complied with the guidelines for the ethical review of laboratory animal welfare People’s Republic of China National Standard (GB/T 35892–2018). This study exclusively analyzed publicly available and de-identified datasets from the GEO database. No direct interaction with human participants or access to identifiable private information was involved. In accordance with Article 32 (Items 1 and 2) of the Measures for Ethical Review of Life Science and Medical Research Involving Human Subjects (Ministry of Science and Technology of the People’s Republic of China, February 18, 2023), research using legally obtained public data or anonymized information is exempt from ethical review. Therefore, formal Institutional Review Board approval was not required for this study.
SCI Model
Following anesthesia induced with an isoflurane/oxygen (induction: 3–4%, maintenance: 1.5–2%), a laminectomy was performed at the T10 level to expose the spinal cord. A spinal cord contusion injury was induced using an impactor device (striker tip diameter: 2 mm; 68099, RWD, Shenzhen, China) with the following parameters: velocity of 0.5 m/s, depth of 1 mm, and dwell time of 1 s. Immediately following injury, muscles were sutured, and skin was stapled. Subcutaneous saline (2 mL) and intramuscular penicillin sodium (80000U) were administered daily for 3 consecutive days. Manual bladder expression was performed twice a day until euthanasia. Rats in the sham group underwent the entire surgical procedure associated with the SCI model, except for the actual contusion. Euthanasia was performed at the experimental endpoint via an intraperitoneal injection of pentobarbital sodium (150 mg/kg).
Cell Culture
The rat microglial cell line GMI-R1 (HTX3594, Otwo Biotech, Shenzhen, China) was cultured in Dulbecco’s Modified Eagle Medium (DMEM; SH30022.01, Cytiva, Chicago, USA) supplemented with 10% fetal bovine serum (FBS; S711-001S, Lonsera, Shanghai, China) and 1% penicillin-streptomycin (SV30010, HyClone, Logan, USA) at 37°C under 5% CO2. Cell line authentication was performed by the supplier.
Drug Administration and Cell Model Construction
5Z-7-Oxozeaenol (Oxo; HY-12686, MedChemExpress, Monmouth Junction, USA) and IRF1-IN-1 (HY-171006, MedChemExpress) were dissolved in dimethyl sulfoxide (DMSO; BL165, Anhui, China), while lipopolysaccharide (LPS; S1732, Beyotime, Shanghai, China) was reconstituted in phosphate-buffered saline (PBS; G4202, Servicebio, Wuhan, China). Final concentrations were 1.0 μM for Oxo, 20 μg/mL for LPS, and as specified in figure legends for IRF1-IN-1. An equivalent volume of DMSO was used control. The PANoptosis cellular model was established using a well-characterized protocol.19 Briefly, GMI-R1 cells were pretreated with Oxo for 1h before stimulation with LPS for 4 hours. Cells were treated with IRF1-IN-1 for 24 hours before building the model.
Cell Death Assays
Lytic cell death was assessed by propidium iodide (PI) staining as previously described.19 Briefly, cells were stained with PI (2 μg/mL, G1021, Servicebio) and Hoechst 33342 (5 μg/mL, G1127, Servicebio) for 10 min, followed by observation under an inverted fluorescence microscope (DMI8; Leica Microsystems GmbH, Germany).
Western Blot
Total protein was extracted from 1-cm spinal cord segments centered on the injury site using a commercial extraction kit (P1250, Applygen, Beijing, China) supplemented with phosphatase/protease inhibitors (P1050, Beyotime). Cultured cells were lysed in RIPA buffer (P0013B, Beyotime) containing phosphatase/protease inhibitors. Protein samples were resolved on 4–20% gradient SDS-PAGE gels (X15420LGel, ACE Biotechnology) and transferred to nitrocellulose membranes (66485, Pall, State of Arizona, USA). After blocking with 5% non-fat dry milk (1172GR500, BioFroxx, Germany), membranes were incubated overnight at 4°C with the primary antibodies: BCL-2 (Abcam, ab196495; 1:2000), BAX (Abcam, ab32503; 1:2000), cle-CASP3 (Cell Signaling Technology, 9664; 1:1000), GSDMD (Abcam, ab219800; 1:1000), N-GSDMD (Affinity, DF13758; 1:1000), RIPK3 (Abclonal, A5431; 1:2000), p-RIPK3 (Ser232) (Invitrogen, PA5-105701; 1:2000), MLKL (Affinity, DF7412; 1:2000), p-MLKL (Ser358) (Affinity, AF7420; 1:1000), ZBP1 (Boster, A04739-3; 1:1000), AIM2 (Proteintech, 20590-1-AP; 1:1000), ARGI1 (Arg1, ThermoFisher, PA5-85267; 1:1000), NOS2 (iNOS, ThermoFisher, PA1-036; 1:1000), ACTB (β-actin, ThermoFisher, MA1-140; 1:10,000), VINCULIN (Vinculin, Proteintech, 26520-1-AP; 1:10,000). Membranes were then probed with species-matched HRP-conjugated secondary anti-mouse/rabbit antibodies (Proteintech, RGAM001/RGAR001, 1:10000) for 1 h at room temperature. Protein bands were visualized using ultrasensitive ECL substrate (HY-K1005, MedChemExpress). β-actin or Vinculin were respectively used as the loading control in the same experiment.
Immunofluorescence
Immunofluorescence staining was performed using established protocols. Samples were washed 3 times with PBS, then blocked for 1 h with 5% normal goat serum (C0265, Beyotime) containing 0.1% Triton X-100. Primary antibodies were incubated overnight at 4°C: Iba1 (Abcam, ab283319; 1:200), p-MLKL (Ser358) (Affinity, AF7420; 1:200), GSDMD (Abcam, ab219800; 1:200), cle-CASP3 (Cell Signaling Tech, 9664; 1:200), ZBP1 (Boster, A04739-3; 1:200), IRF1 (Selleck, F0285; 1:200), Arg1 (ThermoFisher, PA5-85267; 1:200), iNOS (ThermoFisher, PA1-036; 1:50). After PBST washes, samples were incubated for 1 h at RT in the dark with fluorescent secondary antibodies: goat anti-mouse antibody AF488 (1:200, A32723, Invitrogen, California, USA) and goat anti-rabbit antibody AF568 (1:200, ab175471, Abcam, Cambridge, United Kindom). Nuclei were counterstained with DAPI (HY-K1048, MedChemExpress). Images were acquired using an inverted fluorescence microscope (DMI8, Leica) or PanoCube whole-slide scanner (Meca Scientific, Wuhan, China).
Enzyme-Linked Immunosorbent Assay (ELISA)
Cell culture supernatants were collected in sterile centrifuge tubes and centrifuged at 1000 × g for 20 minutes. The supernatants were then carefully aspirated, and the levels of TNF-α, IL-6, and IL-18 were measured using corresponding ELISA kits (JL13202, JL20896, and JL20882, JONLNBIO, Shanghai, China) according to the manufacturer’s protocols.
Statistical Analysis
Data were presented as means ± standard error of means (SEMs). The analysis was performed using R software (version 4.4.2) or GraphPad Prism (version 8.0). All experiments were repeated 3 times unless mentioned. Unpaired two-tailed Student’s t-tests were employed for comparisons between two independent groups, while one-way ANOVA with Dunnett’s post-hoc testing was applied for comparisons across three or more groups. Statistical significance was defined as p < 0.05.20
Results
Dynamic Transcriptome Landscape of SCI and Its Core Clusters
In order to understand the gene expression changes at different stages after SCI, we analyzed the gene expression profiles of the spinal cord at different time points after injury. PCA showed that the SCI group and the sham group clustered separately, and distinct clusters were produced in the SCI group for different time points, suggesting that the injured region might have different gene expression patterns at different stages (Figure S1A). To further analyze gene expression patterns after SCI, we constructed a complex heatmap. A total of 10 different temporal patterns were observed, with genes exhibiting similar temporal expression patterns clustered in the same group, while different clusters indicated different transcriptional dynamics (Figure 1A). Overall, clusters 4, 5, and 9 represented gene expression that was downregulated after SCI, clusters 3, 6, and 7 represented upregulated genes, while clusters 1, 2, 8, and 10 represented genes with a bimodal expression pattern. Typically, the pathological mechanisms represented by the inflammatory response were upregulated after injury and persisted into the chronic phase.21,22 It was remarkable that the gene expression of clusters 3, 6, and 7 fitted this trend, and continuously upregulated inflammation-related DEGs were observed at different time points, suggesting that the functions carried out by genes in clusters 3, 6, and 7 might be related to inflammatory response (Figure 1B). Functional enrichment analysis showed that neuroinflammatory response, interferon (IFN)-mediated signaling pathway, and NF-kappa B signaling pathway were significantly up-regulated in the SCI group compared with the sham group (Figure 1C and D). In addition, the result of GSEA showed that the PCD was significantly upregulated (Figure 1E). In this study, we focused on exploring the detailed PCD events in SCI. Since PCD had various forms,23 such as pyroptosis, apoptosis, and necroptosis, it was thus necessary to explore the possible forms after SCI.
 |
Figure 1 Temporal dynamics of gene expression and PCD pathway activation after SCI revealed by bulk RNA-seq. (A) Heatmap of time-series RNA-seq data from sham and SCI rat spinal cords at indicated timepoints. (B) Multi-volcano plots highlighting DEGs from the Irfs, Cxcls, and Ccls families across different SCI stages. (C–D) GO (C) and KEGG (D) enrichment analyses of DEGs at day 7 post-injury compared to sham. (E) GSEA indicating significant upregulation of PCD pathways at day 7; accompanying heatmap visualization of core enrichment genes. (F) Dot plot summarizing the ssGSEA result of PCD-related pathways activities at day 7 after SCI. (G) Heatmap showing dynamic change in pyroptosis, apoptosis, and necroptosis activity across SCI stages, based on ssGSEA. (H) The bar plot showing the fold-changes in expression of executioner proteins (CASP3, GSDMD, MLKL), alongside a heatmap of the protein expression level normalized by Z-score. (I and J) Western blot (I) and corresponding quantification (J) of key PCD markers at 3 and 7 days post-injury. β-actin was used as a loading control (n=4 rats per group). *, p<0.05; **, p<0.01; ***, p<0.001; ****, p<0.0001. Abbreviation: ns, non-significant. |
The PCD Pathway Was Activated in SCI Rats
In the results of pathway activity assessment (Figure 1F), the pyroptosis, apoptosis, necroptosis, and alkaliptosis pathway scores were significantly higher in SCI rats compared with the sham group (p<0.05). Among them, pyroptosis, apoptosis, and necroptosis had received considerable attention and would be further explored in this study. The results of time series analysis showed that the pathway activity scores of pyroptosis, apoptosis, and necroptosis increased significantly from the first day after injury until day 56 after injury (p<0.05), which was consistent with the gene expression patterns of clusters 3, 6, and 7 (Figure 1G). In order to clarify whether pyroptosis, apoptosis, and necroptosis occur simultaneously in SCI rats, we determined the expression levels of key proteins, that was GSDMD, MLKL, and CASP3, using unpublished rat proteomics data, which showed a significant upregulation 7 days post-injury (Figure 1H). This result was validated in the meta-sci database (Figure S1B).24 The expression levels of these key proteins were further verified by WB (Figures 1I, J, and S2). The above results showed that there were pyroptosis, apoptosis, and necroptosis coexisting in SCI rats, suggesting the importance of PCD in SCI.
 |
Figure 2 Microglia underwent pyroptosis, apoptosis, and necroptosis after SCI. (A) UMAP visualization of 11 cell types (a total of 23,985 cells). (B) Heatmap showing the representative marker genes for each annotated cell type. (C) UMAP showing the expression distribution of Gsdmd, Bcl2, Bax, Casp3, Ripk3, and Mlkl across all cell types. (D–F) UMAP visualization of pyroptosis (D) apoptosis (E) and necroptosis (F) pathways in all cell types using ssGSEA. (G–I) Boxplots showing the pyroptosis (G) apoptosis (H) and necroptosis (I) pathway scores across cell types. (J) Immunofluorescence showing the co-localization of the microglia marker Iba1 (green) with GSDMD, cle-CASP3, p-MLKL (red). Scale bars, 20μm (n=4 rats per group). In (G–I), the box boundaries represent the 25th −75th percentiles; the midline indicates the median. Statistical significance was determined using the Kruskal–Wallis test with Dunn’s post-hoc test: ***, p<0.001. |
Microglia Underwent Pyroptosis, Apoptosis, and Necroptosis After SCI
To elucidate which cells underwent pyroptosis, apoptosis, and necroptosis in SCI rats, we used scRNA-seq data for further analysis. A total of 23,985 cells were captured in the injury group. Different transcriptome clusters were observed in the UMAP, and the cells were classified into the following 11 types according to the canonical marker genes: Neutrophil, Microglia, T cell, OPC, Astrocyte, Oligodendrocyte, DC, Fibroblast, B cell, Erythrocyte, and Endothelial (Figure 2A and B). In contrast to other cell populations, the key genes for pyroptosis, apoptosis, and necroptosis were relatively higher expressed in immune cells (Figure 2C). Next, we used the ssGSEA algorithm to seek to clarify pathway activity in different cells. The results showed that pyroptosis, apoptosis, and necroptosis had higher pathway activity scores in immune cells, with microglia as the major cell (Figure 2D–I). In addition, the results of the Addmodulescore algorithm were consistent with ssGSEA (Figure S3A–F). Subsequently, we used immunofluorescence to find that the key proteins of pyroptosis, apoptosis, and necroptosis (GSDMD, cle-CASP3, p-MLKL) co-localized with microglia marker Iba1 (Figure 2J), and confirmed that microglia in the injured region suffered from pyroptosis, apoptosis, and necroptosis.
Bulk RNA-Seq and scRNA-Seq Revealed the Existence of PANoptosis in SCI Rats
It was worth exploring in depth that the newly defined PANoptosis was a pro-inflammatory cell death characterized by pyroptosis, apoptosis, and necroptosis, which cannot be represented by a single form. We first analyzed bulk RNA-seq through the ssGSEA algorithm and found that the PANoptosis activity was significantly upregulated after SCI (Figure 3A), presenting a similar temporal expression pattern (Figure S4A), suggesting the potential role of PANoptosis in SCI. The formation of the PANoptosome complex was initiated by the recognition of damage-associated molecular patterns (DAMPs) or cytokines by innate immune sensors, thereby inducing membrane damage and lytic cell death.9 Therefore, we then explored the expression of the sensors after SCI. Compared to the sham group, multiple bulk RNA-seq datasets revealed that Zbp1 was the most significantly upregulated sensor after SCI (p<0.05) (Figures 3B and S4B–D). ZBP1 had been reported to be specifically upregulated in microglia and macrophages of stroke and central nervous system inflammation, leading to necroptosis through the ZBP1-pRIPK3-pMLKL axis.25,26 Therefore, we first chose ZBP1 for further discussion. WB showed that ZBP1 was significantly increased after SCI, while the protein expression of AIM2 showed an opposite trend to the bulk RNA-seq (Figures 3C and S5). Immunofluorescence showed that ZBP1 was increased at day 7 after SCI and colocalized mainly with microglia marker Iba1 (Figure 3D), suggesting that ZBP1 mainly plays a potential functional role through mediating PANoptosis in microglia.
 |
Figure 3 Bulk RNA-seq and scRNA-seq revealed the existence of PANoptosis in SCI rats. (A) Boxplot showing a significant increase in PANoptosis pathway activity scores in SCI rat spinal cord tissue compared to the sham group, based on bulk RNA-seq data. (B) The heat map showing the expression patterns and fold-changes of PANoptosis key sensor genes (Zbp1, Nlrp3, Aim2, Ripk1) at the transcriptomic levels. (C) WB analysis of AIM2 and ZBP1 protein expression in perilesional spinal cord tissue at 3 and 7 days post-injury. Vinculin was used as a loading control. (D) Immunofluorescence showing the co-localization of the microglial marker Iba1 (green) with ZBP1 (red). Scale bars, 20μm (n=4 rats per group). (E) The dotplot shows the expression of genes associated with the PANoptosis pathway in all cell types. (F) UMAP visualization of PANoptosis score in all cell types. (G) Boxplots comparing PANoptosis scores among different cell types. In (G) the box boundaries represent the 25th −75th percentiles; the midline indicates the median. Statistical significance was determined using the Kruskal–Wallis test with Dunn’s post-hoc test: ns, non-significant; *, p<0.05; ***, p<0.001; ****, p<0.0001. |
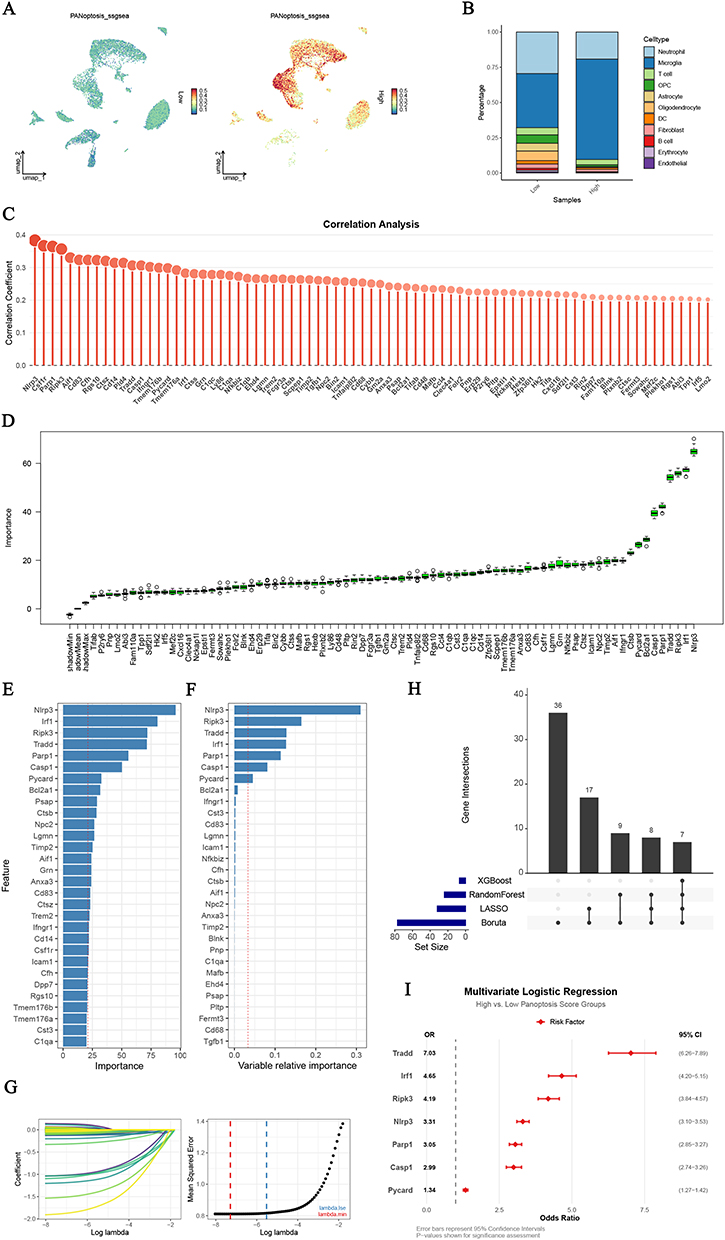 |
Figure 4 Irf1 served as an independent risk factor for PANoptosis in microglia. (A) UMAP visualization of PANoptosis scores across all cells (stratified into Low and High activity groups based on the median score). (B) Bar plot showing the proportions of different cell types within the Low and High PANoptosis activity groups. (C) Lollipop plot displaying the Pearson’s correlation analysis between gene expression and PANoptosis scores. Only genes with statistically significant correlations were shown (p < 0.05). (D–G) Feature importance rankings of PANoptosis-associated genes identified using four machine learning algorithms: (D) Boruta, (E) Random Forest (RF), (F) XGBoost, and (G) LASSO regression. (H) UpSet plot showing the intersection of core genes concurrently identified by all four machine learning methods. (I) Forest plot of multivariate logistic regression analysis showing odds ratios (ORs) and 95% confidence intervals for the identified core genes. |
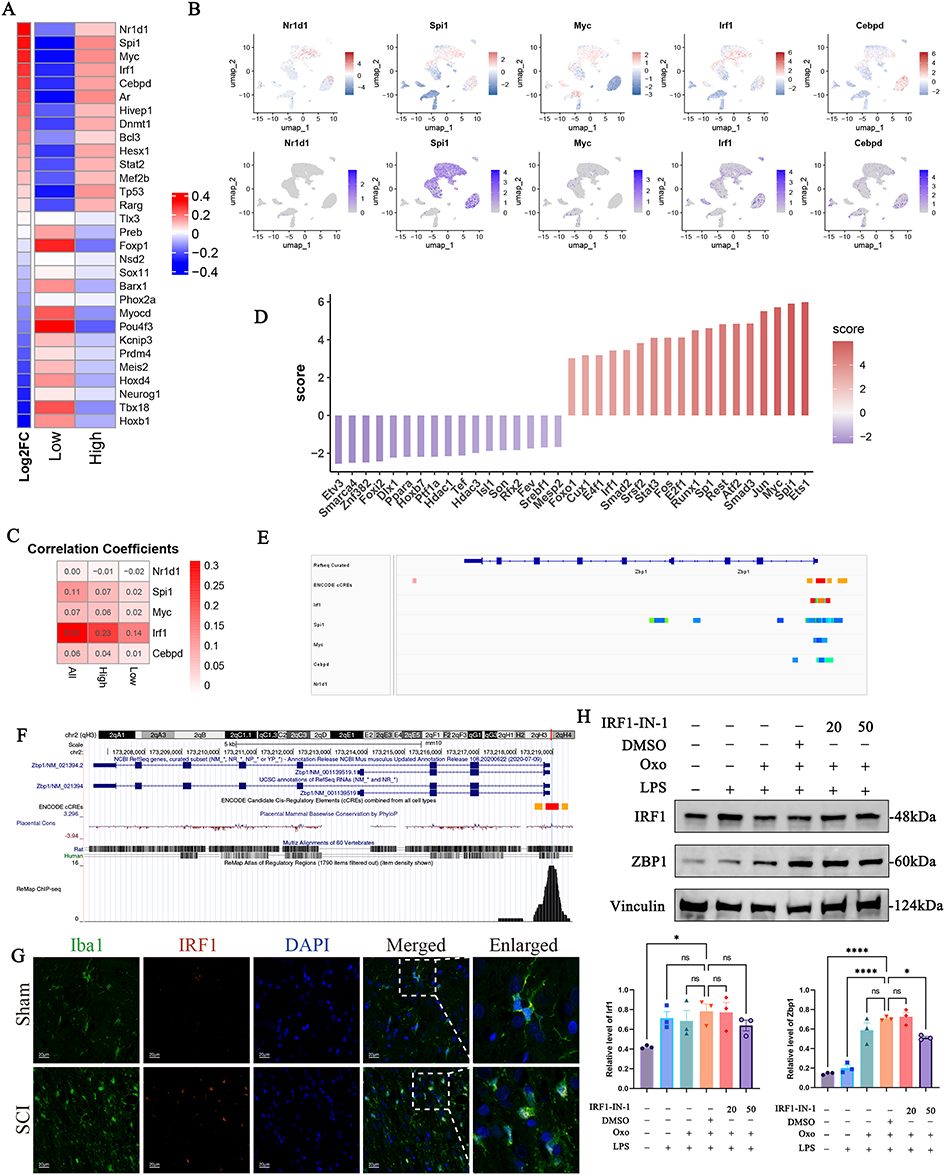 |
Figure 5 IRF1 drove Zbp1 transcription in microglia. (A) Heatmap showing TF activity scores (right) and fold-change expression (left) associated with PANoptosis activity in microglia. (B) UMAP visualization of transcriptional activity scores (top) and gene expression levels (bottom) of Nr1d1, Spi1, Myc, Irf1, and Cebpd across all cell types. (C) Heatmap showing the results of Pearson’s correlation analysis between Nr1d1, Spi1, Myc, Irf1, and Cebpd and PANoptosis activity scores. (D) Bar graph showing the inferred TF activity at bulk RNA-seq levels. (E) The IGV browser illustrating the potential regulatory relationship between NR1D1, SPI1, MYC, IRF1, and CEBPD and the Zbp1 promoter region. (F) UCSC Genome Browser showing a distinct IRF1 binding peak within the Zbp1 promoter region, based on public ChIP-seq data. (G) Immunofluorescence at 7 days after SCI showing nuclear translocation of IRF1 (red) in Iba1+ microglia (green); nuclei were counterstained with DAPI (blue). Scale bars, 20μm (n=4 rats per group). (H) WB analysis of IRF1 and ZBP1 protein expression of microglia in vitro. Vinculin was used as a loading control. *, p<0.05; ****, p<0.0001. Abbreviation: ns, non-significant. |
To elucidate the expression of PANoptosis at the single-cell level after SCI, dotplot showed that the PANoptosis key genes were predominantly expressed in microglia (Figure 3E), consistent with the expression of the PANoptosome genes (Figure S6). Next, the ssGSEA algorithm was used to assess the PANoptosis activity score of each cell. Consistent with pyroptosis, apoptosis, and necroptosis, PANoptosis activity score was higher in immune cells (Figure 3F). Moreover, consistent with expectations, the boxplot indicated that Microglia exhibits the highest PANoptosis activity score (Figure 3G). These results revealed that PANoptosis was highly expressed in SCI rats and led to lytic cell death in microglia.
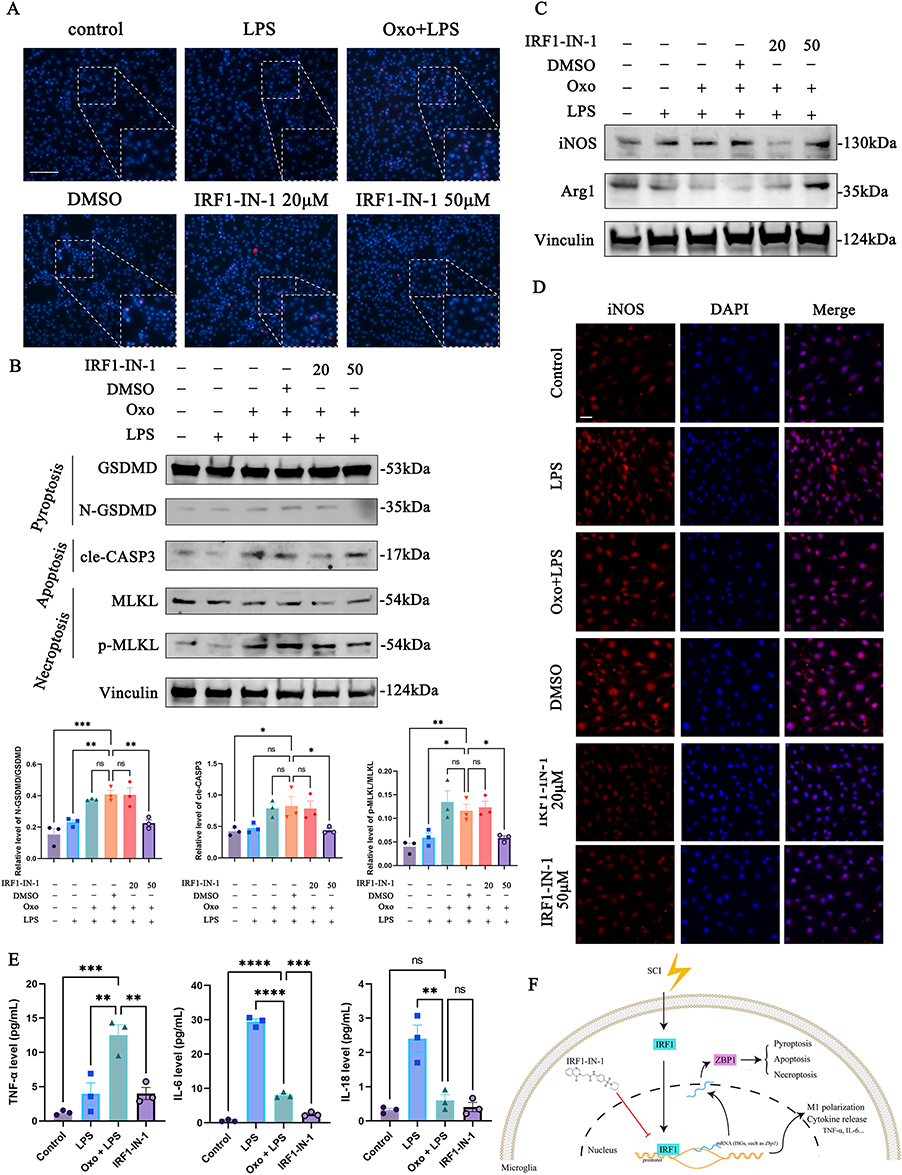 |
Figure 6 Pharmacological targeting of the DNA-binding domain (DBD) of IRF1 functionally suppresses ZBP1-associated microglial PANoptosis and pro-inflammatory activation. (A) Cell death was assayed by staining with PI (Red) and Hoechst 33342 (blue). (Scale bar: 100 μm) (B) WB analysis of GSDMD, N-GSDMD, cle-CASP3, MLKL, and p-MLKL protein expression of microglia in vitro. Vinculin was used as a loading control. (C) WB analysis of iNOS (M1-like marker), and Arg1 (M2-like marker) protein expression of microglia in vitro. Vinculin was used as a loading control. (D) Representative of immunofluorescence staining of M1 state (iNOS) in microglia. (Scale bar: 20 μm). (E) The expression levels of TNF-α, IL-6, and IL-18 in microglia culture supernatant were assessed using ELISA. (F) Schematic diagram of IRF1 nuclear translocation promoting ISGs transcription (e.g., Zbp1) mediating PANoptosis, M1-like polarization, and pro-inflammation cytokines release in microglia in SCI. *, p<0.05; **, p<0.01; ***, p<0.001; ****, p<0.0001. Abbreviation: ns, non-significant. |
Irf1 Served as an Independent Risk Factor for PANoptosis in Microglia
Based on the median score of PANoptosis, all cells were categorized into a high PANoptosis activity group and a low PANoptosis activity group (Figure 4A). Unsurprisingly, microglia accounted for a majority of high PANoptosis activity cells (Figure 4B). The results of correlation analysis showed that 134 genes were positively correlated with PANoptosis activity (Pearson’s correlation coefficient > 0.2 and adjusted p-value < 0.05) (Table S4). Subsequently, a total of 167 up-regulated DEGs were identified by differential expression analysis of the high PANoptosis activity group and the low PANoptosis activity group (Table S5). Ultimately, a total of 77 genes were found to be present concurrently in the results of the correlation analysis and DEGs (Figures 4C, S7A, and Table S6).
To accurately identify the core genes for high PANoptosis activity, we used four machine learning algorithms for subsequent analysis. Seventy-seven key genes were identified after 100 iterations using the Boruta algorithm (Figure 4D). Using the RF algorithm, we identified 24 key genes with the importance scores greater than the mean importance scores (Figure 4E). Using the xGBoost algorithm, we obtained an importance score greater than the mean importance score for 7 key genes (Figure 4F). Moreover, the LASSO algorithm was applied to identify 32 key genes as diagnostic markers for high PANoptosis activity (Figure 4G). Finally, after intersecting the key genes, a total of 7 core genes were identified: Nlrp3, Ripk3, Tradd, Irf1, Parp1, Casp1, and Pycard (Figure 4H). Univariate logistic regression analysis was used to determine that the core genes were significantly associated with high PANoptosis activity scores (Figure S7B), and Irf1 (OR 4.65, 95% CI 4.20−5.15) was identified as an independent risk factor for high PANoptosis activity by multivariate logistic regression analysis (Figure 4I). Meanwhile, we validated the interspecies robustness of Irf1 as an independent risk factor for high PANoptosis activity in scRNA-seq of the SCI mice (Figure S7C–D). These results suggest that Irf1 may play a potential regulatory role in PANoptosis in microglia after SCI.
IRF1 Drove Zbp1 Transcription in Microglia
In the previous results, we had confirmed that the Zbp1 mRNA and ZBP1 protein expression levels were upregulated. Therefore, we hypothesized that the activity of TF that regulated Zbp1 expression was enhanced in SCI rats, and then the protein expression level of ZBP1 was upregulated. Thus, we utilized decoupleR to investigate the TFs activity in microglia at the single-cell level.27 Compared with the low PANoptosis activity group, the top 5 activities of TFs in the microglia with high PANoptosis activity group were Nr1d1, Spi1, Myc, Irf1, and Cebpd (Figure 5A and B). Correlation analysis showed that Irf1, which regulated the transcription of interferon-stimulated genes (ISGs), had the strongest correlation with high PANoptosis activity scores (Pearson’s correlation coefficient 0.31, p<0.05) (Figure 5C), suggesting that Irf1 may play a role in the regulation of PANoptosis in microglia. The activity of Irf1 was confirmed in bulk RNA-seq (Figure 5D).
Coincidentally, Zbp1 was an ISG, and its promoter region contained an interferon-stimulated gene responsive element (ISRE).28 Therefore, we attempted to build a connection between IRF1 and Zbp1 in microglia. We reviewed the Chip-atlas database (http://chip-atlas.org/), which provided the analysis results of Chip-seq data from the NCBI Sequence Read Archive. The results of Chip-seq data were visualized using Integrative Genomics Viewer (IGV, v.2.19.4), and the binding fraction of IRF1 to Zbp1 was the highest among the top 5 TFs ranked in high PANoptosis activity microglia (Figure 5E). Consistent results were observed in the UCSC Genome Browser (Figure 5F). Subsequently, immunofluorescence showed that IRF1, originally localized to the cytoplasm of microglia, was specifically localized to the nucleus in SCI rats (Figure 5G). To demonstrate that IRF1 regulates the protein expression of ZBP1, an in vitro experiment showed that pharmacological inhibition of IRF1 downregulated ZBP1 protein expression (Figures 5H and S8). These results suggest that IRF1 nuclear translocation was associated with the increased expression of ZBP1 in microglia, which can be inhibited by IRF1-IN-1.
Pharmacological Targeting of the DNA-Binding Domain (DBD) of IRF1 Functionally Suppresses ZBP1-Associated Microglial PANoptosis and Pro-Inflammatory Activation
To investigate whether pharmacological inhibition of IRF1 attenuates microglial PANoptosis, we pretreated microglia with IRF1-IN-1, a specific IRF1 inhibitor, for 24 hours in vitro. Cell death assays demonstrated that Oxo/LPS treatment induced lytic cell death in microglia, whereas pretreatment with IRF1-IN-1 significantly reduced lytic cell death in a dose-dependent manner (Figure 6A). Consistently, WB analysis revealed that the expression levels of PANoptosis-related markers (N-GSDMD, cle-CASP3, and p-MLKL) were markedly decreased following IRF1-IN-1 treatment (Figures 6B and S9).
Given the critical role of microglia as innate immune cells in mediating pro-inflammatory responses after SCI, we next assessed whether PANoptosis promoted microglial polarization. The result of WB showed that Oxo/LPS treatment markedly increased the expression of the M1-like marker iNOS while reducing the expression of the M2-like marker Arg1. Pretreatment with IRF1-IN-1 partially reversed these Oxo/LPS–induced changes, resulting in decreased iNOS and increased Arg1 expression (Figures 6C and S9). Immunofluorescence analysis further confirmed that iNOS expression was significantly upregulated in microglia following Oxo/LPS stimulation and was markedly suppressed by IRF1-IN-1 pre-treatment (Figure 6D).
To determine whether IRF1-driven microglial PANoptosis was accompanied by functional inflammatory consequences, we next quantified the release of pro-inflammatory cytokines in microglial culture supernatants using ELISA. The result showed that Oxo/LPS treatment significantly increased TNF-α and IL-6 secretion compared with control group, whereas pretreatment with IRF1-IN-1 markedly attenuated the release of both cytokines (Figure 6E). Notably, IL-18 levels were elevated following LPS stimulation but remained unchanged under Oxo/LPS conditions, indicating that PANoptosis-associated inflammation was distinct from classical inflammasome-dependent responses (Figure 6E).
Taken together, these findings indicate that pharmacological inhibition of IRF1 not only suppresses ZBP1-associated PANoptosis in microglia but also attenuates M1-like polarization, providing functional evidence linking IRF1 activity to microglial PANoptosis and inflammatory polarization in SCI. (Figure 6F).
Discussion
In this study, we combined bulk RNA-seq, scRNA-seq, and ChIP-seq data to demonstrate temporally distinct patterns of PCD and sustained inflammatory pathway activation in SCI. Based on the current study, we have confirmed the coexistence of multiple forms of PCD in microglia after SCI and identified the pivotal role for IRF1 in governing microglial cell death and phenotypic polarization. Importantly, pharmacological inhibition of IRF1 in vitro provided functional evidence that IRF1 is required for ZBP1-associated microglial PANoptosis and pro-inflammatory polarization. These findings provide a new perspective on the mechanisms underlying secondary injury in SCI and identify the IRF1–ZBP1 axis as a potential therapeutic target, thereby extending our study beyond correlative multi-omics analyses.
As shown in the previous studies, neuroinflammation and glial cell death critically impair neurological reconstitution after SCI.29 However, the temporal dynamics of inflammatory and PCD across SCI stages remain poorly characterized. Our time-series bulk RNA-seq analysis revealed persistent transcriptional activation of inflammatory and PCD post-SCI. Unresolved neuroinflammation during acute and subacute phases exacerbates the neural microenvironment through dual mechanisms: (1) promoting a cytotoxic milieu that compromises neuronal and glial survival, and (2) triggering concurrent activation of multiple cell death forms, ultimately driving irreversible neural damage. Notably, sustained upregulation of inflammatory signaling pathways was observed at 8 weeks post-injury, indicating the persistence of inflammatory signaling after SCI. However, the biological significance of sustained inflammation remains controversial. Previous studies demonstrate that pro-inflammatory microglia inhibit remyelination in neurodegenerative conditions, where pro-inflammatory microglial depletion enhances regenerative outcomes.30 Similarly, microglial ablation in SCI models attenuates inflammation and improves functional recovery.31 Thus, we propose that neuroinflammation and PCD critically contribute to the entire course of SCI, and that microglia play a central role in it.
In secondary injury, primary trauma-induced damage, DAMPs release, and other mechanisms induce continuous microglial activation and promote neuroinflammation.21 Meanwhile, aberrant sustained activation drives microglia toward divergent death modalities, which can be non-inflammatory apoptosis or pro-inflammatory lytic cell death (pyroptosis, necroptosis, and PANoptosis). Different studies have reported that microglial PCD, including apoptosis,32 necroptosis33,34 and pyroptosis,34,35 can promote the development of central nervous system diseases. However, few studies focus on exploring different cell death forms that coexist in microglia after SCI. Our study demonstrates concurrent activation of three PCD forms within the injury region. The result of scRNA-seq revealed significantly elevated PCD activity scores in microglia compared to other cells. The immunofluorescence analysis confirmed these results. Notably, inflammation and PCD are thought to engage in a self-amplifying cycle, in which excessive inflammatory signaling promotes PCD activation, while lytic forms of PCD further amplify inflammatory cascades.36 Consistent with this concept, our in vitro experiments showed that Oxo/LPS stimulation induced microglial PANoptosis was accompanied by increased pro-inflammatory output, whereas pharmacological inhibition of Irf1 simultaneously attenuated PANoptosis execution and inflammatory response. These findings suggest that microglial PANoptosis may contribute to the amplification of inflammatory responses rather than a secondary bystander effect during secondary injury, potentially underlying the complexity and refractory nature of SCI.
PANoptosis is primarily driven by PANoptosome assembly. Upon sensing DAMPs, sensor molecules (eg., ZBP1, AIM2, RIPK1, NLRP3, NLRP12) initiate downstream signaling cascades that promote PANoptosome formation. This multiprotein complex subsequently coordinates the synergistic activation of executioner proteins—CASP3, MLKL, and GSDMD—to execute lytic cell death. Subsequently, bulk RNA-seq analysis revealed that Zbp1 was the most significantly upregulated sensor following SCI. Although previous studies have shown that the AIM2 inflammasome is activated in microglia and contributes to pyroptosis after SCI,37,38 our Western blot results demonstrated a downregulation of AIM2 expression at 7 days post-injury. This finding aligns with previous reports describing the temporal dynamics of AIM2 expression.39 Therefore, our data do not support AIM2 as the sensor mediating PANoptosis in microglia after SCI. In contrast, immunofluorescence showed that ZBP1 was predominantly localized in microglia, suggesting that ZBP1—rather than AIM2—serves as the primary receptor initiating PANoptosome assembly in microglia following SCI.
Although ZBP1 has been identified as a PANoptosome sensor in various diseases, no specific inhibitors targeting ZBP1 are currently available. This highlights the need to explore the upstream regulatory mechanisms controlling ZBP1 expression and to identify alternative therapeutic targets. Through TF activity inference and correlation analysis, we identified IRF1 as the most strongly associated TF with the high PANoptosis activity group. IRF1 is known to be activated by IFNs, TNF-α, and IL-1, subsequently translocating to the nucleus to initiate transcription of downstream target genes.40 Analysis of publicly available ChIP-seq datasets confirmed a prominent IRF1 binding peak in the promoter region of Zbp1, indicating that Zbp1 is a direct transcriptional target of IRF1. Our results further demonstrate that pharmacological inhibition of IRF1 leads to a reduction in ZBP1 expression and suppress PANoptosis execution. These findings provide evidence that IRF1 acts as a key upstream regulator of ZBP1-associated PANoptosis in microglia. While IRF1 has been preliminarily implicated in SCI, its role in microglia is not well defined.41–43 In our in vitro experiments, pharmacological inhibition of IRF1 effectively reduced microglial M1-like polarization and reduced pro-inflammatory cytokine production, supporting its functional relevance in microglia. Given that PANoptosis is thought to amplify inflammatory signaling, the observed reduction in M1-like polarization following IRF1 inhibition further supports the functional link between IRF1-driven PANoptosis and the pro-inflammatory microglial phenotype.
Our study has certain limitations. First, although scRNA-seq and immunofluorescence analyses confirmed that the key proteins involved in PANoptosis were predominantly expressed in microglia, we cannot exclude the possibility that astrocytes and other cell types also undergo PANoptosis following SCI. Second, the precise mechanism by which ZBP1 initiates and assembles the PANoptosome in microglia after SCI was not directly demonstrated in this study. Finally, the functional experiment of the IRF1–ZBP1 axis was primarily based on in vitro approaches, and in vivo evidence using cell type–specific genetic or pharmacological manipulation remains to be established. Future studies using microglia–specific genetic manipulation of IRF1 or ZBP1 will be necessary to further validate their roles in vivo.
Conclusions
In summary, our study identifies IRF1 as a key upstream regulator of ZBP1-associated PANoptosis in microglia following SCI. By integrating multi-omics analyses with functional and cytokine-level experiments, we demonstrate that microglial PANoptosis represents a regulated inflammatory cell death program rather than a secondary bystander event of neuroinflammation. Importantly, pharmacological inhibition of IRF1 attenuates PANoptosis-associated inflammatory responses and M1-like polarization, highlighting the IRF1–ZBP1 axis as a potential therapeutic target for modulating secondary injury in SCI.
Code Availability
Code used in the current research is available from the corresponding author upon reasonable request.
Data Sharing Statement
The data that support the findings of this study are available in the Gene Expression Omnibus (GEO) database at https://www.ncbi.nlm.nih.gov/geo/. Other data used in the current research are available from the corresponding author upon reasonable request.
Ethics Approval and Consent to Participate
This study was approved by the Animal Ethics Committee of Fujian Medical University (IACUC Approval No. FJMU 2024-0314), and all procedures complied with the guidelines for the ethical review of laboratory animal welfare People’s Republic of China National Standard (GB/T 35892-2018). This study exclusively analyzed publicly available and de-identified datasets from the GEO database. No direct interaction with human participants or access to identifiable private information was involved. In accordance with Article 32 (Items 1 and 2) of the Measures for Ethical Review of Life Science and Medical Research Involving Human Subjects (Ministry of Science and Technology of the People’s Republic of China, February 18, 2023), research using legally obtained public data or anonymized information is exempt from ethical review. Therefore, formal Institutional Review Board approval was not required for this study.
Acknowledgments
The author gratefully acknowledges the GEO database for providing the data that made this study possible. Sincere appreciation is also extended to the reviewers and editors for their insightful comments and constructive suggestions.
Author Contributions
Xiongjie Xu: Conceptualisation, Data Curation, Formal Analysis, Investigation, Methodology, Software, Validation, Visualisation, Writing - Original Draft, Writing - Review & Editing.
Song Chen: Conceptualisation, Data Curation, Formal Analysis, Investigation, Methodology, Software, Validation, Writing - Original Draft, Writing - Review & Editing.
Shichao Liu: Investigation, Methodology, Writing - Review & Editing.
Yinqing Wang: Funding Acquisition, Supervision, Writing - Review & Editing.
Chunhua Wang: Methodology, Funding Acquisition, Project Administration, Supervision, Writing - Review & Editing.
Risheng Liang: Funding Acquisition, Project Administration, Supervision, Writing - Review & Editing.
All authors made a significant contribution to the work reported, whether that is in the conception, study design, execution, acquisition of data, analysis and interpretation, or in all these areas; took part in drafting, revising or critically reviewing the article; gave final approval of the version to be published; have agreed on the journal to which the article has been submitted; and agree to be accountable for all aspects of the work.
Funding
This research was supported by Joint Funds for the Innovation of Science and Technology, Fujian Province (No. 2023Y9163, 2023Y9169) and the Neurosurgery Specialty Capacity Building Fund of Fujian Medical University Union Hospital (No. 14008012).
Disclosure
The authors declare that they have no conflicts of interest.
References
1. Ramakonar H, Fehlings MG. “Time is spine”: new evidence supports decompression within 24 h for acute spinal cord injury. Spinal Cord. 2021;59(8):933–18. doi:10.1038/s41393-021-00654-0
2. Kashef SM, Abo Elnasr SE. Effect of peripheral blood mononuclear cells on ischemia-reperfusion injury of sciatic nerve of adult male albino rat: histological, immunohistochemical, and ultrastructural study. Ultrastructural Pathol. 2024;48(3):172–191. doi:10.1080/01913123.2024.2321144
3. Cavalcanti RR, Almeida FM, Martinez AMB, Freria CM. Neuroinflammation: targeting microglia for neuroprotection and repair after spinal cord injury. Front Immunol. 2025;16:1670650. doi:10.3389/fimmu.2025.1670650
4. Liu Z, Yao X, Jiang W, et al. Advanced oxidation protein products induce microglia-mediated neuroinflammation via MAPKs-NF-κB signaling pathway and pyroptosis after secondary spinal cord injury. J Neuroinflammation. 2020;17(1):90. doi:10.1186/s12974-020-01751-2
5. Zou Y, Xie J, Zheng S, et al. Leveraging diverse cell-death patterns to predict the prognosis and drug sensitivity of triple-negative breast cancer patients after surgery. Int J Surg. 2022;107:106936. doi:10.1016/j.ijsu.2022.106936
6. Xu B, Zhou Z, Fang J, et al. Exosomes derived from schwann cells alleviate mitochondrial dysfunction and necroptosis after spinal cord injury via AMPK signaling pathway-mediated mitophagy. Free Radic Biol Med. 2023;208:319–333. doi:10.1016/j.freeradbiomed.2023.08.026
7. Yao S, Pang M, Wang Y, et al. Mesenchymal stem cell attenuates spinal cord injury by inhibiting mitochondrial quality control-associated neuronal ferroptosis. Redox Biol. 2023;67:102871. doi:10.1016/j.redox.2023.102871
8. Xiong W, Li C, Kong G, et al. Treg cell-derived exosomes miR-709 attenuates microglia pyroptosis and promotes motor function recovery after spinal cord injury. J Nanobiotechnology. 2022;20(1):529. doi:10.1186/s12951-022-01724-y
9. Pandeya A, Kanneganti TD. Therapeutic potential of PANoptosis: innate sensors, inflammasomes, and RIPKs in PANoptosomes. Trends Mol Med. 2024;30(1):74–88. doi:10.1016/j.molmed.2023.10.001
10. Lou J, Mao Y, Jiang W, et al. TRIM56 Modulates YBX1 Degradation to Ameliorate ZBP1-Mediated Neuronal PANoptosis in Spinal Cord Injury. Adv Sci. 2024;11(42):e2407132. doi:10.1002/advs.202407132
11. Li C, Wu Z, Zhou L, et al. Temporal single cell and bulk RNA sequencing data of adult mouse spinal cord after injury. doi:10.6084/m9.figshare.17702045
12. Luo Y, Liu L, Zhang C. Identification and analysis of diverse cell death patterns in diabetic kidney disease using microarray-based transcriptome profiling and single-nucleus RNA sequencing. Comput Biol Med. 2024;169:107780. doi:10.1016/j.compbiomed.2023.107780
13. Wang Y, Kanneganti TD. From pyroptosis, apoptosis and necroptosis to PANoptosis: a mechanistic compendium of programmed cell death pathways. Comput Struct Biotechnol J. 2021;19:4641–4657. doi:10.1016/j.csbj.2021.07.038
14. Wang X, Sun R, Chan S, et al. PANoptosis-based molecular clustering and prognostic signature predicts patient survival and immune landscape in colon cancer. Front Genetics. 2022;13:955355. doi:10.3389/fgene.2022.955355
15. Zhang J. ClusterGVis: one-step to cluster and visualize gene expression matrix. GitHub. Available from: https://github.com/junjunlab/ClusterGVis.
16. Kumar L, Futschik ME. Mfuzz: a software package for soft clustering of microarray data. Bioinformation. 2007;2(1):5–7. doi:10.6026/97320630002005
17. Xu S, Hu E, Cai Y, et al. Using clusterProfiler to characterize multiomics data. Nature Protocols. 2024;19(11):3292–3320. doi:10.1038/s41596-024-01020-z
18. Dallmann-Sauer M, Fava VM, Malherbe ST, et al. Mycobacterium tuberculosis resisters despite HIV exhibit activated T cells and macrophages in their pulmonary alveoli. J Clin Invest. 2025;135(7). doi:10.1172/JCI188016
19. Shi FL, Li Q, Xu R, et al. Blocking reverse electron transfer-mediated mitochondrial DNA oxidation rescues cells from PANoptosis. Acta Pharmacol Sin. 2024;45(3):594–608. doi:10.1038/s41401-023-01182-8
20. D B, T RG. Basic and Clinical Biostatistics.
21. Hu X, Xu W, Ren Y, et al. Spinal cord injury: molecular mechanisms and therapeutic interventions. Signal Transduct Target Ther. 2023;8(1):245. doi:10.1038/s41392-023-01477-6
22. Zrzavy T, Schwaiger C, Wimmer I, et al. Acute and non-resolving inflammation associate with oxidative injury after human spinal cord injury. Brain. 2021;144(1):144–161. doi:10.1093/brain/awaa360
23. Yuan J, Ofengeim D. A guide to cell death pathways. Nat Rev Mol Cell Biol. 2024;25(5):379–395. doi:10.1038/s41580-023-00689-6
24. Grillo-Risco R, Hidalgo MR, Martínez-Rojas B, Moreno-Manzano V, García-García F. A comprehensive transcriptional reference for severity and progression in spinal cord injury reveals novel translational biomarker genes. J Transl Med. 2025;23(1):160. doi:10.1186/s12967-024-06009-6
25. Mutoh T, Kikuchi H, Jitsuishi T, Kitajo K, Yamaguchi A. Spatiotemporal expression patterns of ZBP1 in the brain of mouse experimental stroke model. J Chem Neuroanatomy. 2023;134:102362. doi:10.1016/j.jchemneu.2023.102362
26. Zhou H, Zhou M, Liao X, et al. The innate immune sensor Zbp1 mediates central nervous system inflammation induced by angiostrongylus cantonensis by promoting macrophage inflammatory phenotypes. Adv Sci. 2025;12(11):e2413675. doi:10.1002/advs.202413675
27. Milotay G, Little M, Watson RA, et al. CMV serostatus is associated with improved survival and delayed toxicity onset following anti-PD-1 checkpoint blockade. Nature Med. 2025;31(7):2350–2364. doi:10.1038/s41591-025-03647-1
28. Hao Y, Yang B, Yang J, et al. ZBP1: a powerful innate immune sensor and double-edged sword in host immunity. Int J Mol Sci. 2022;23(18):10224. doi:10.3390/ijms231810224
29. Ahuja CS, Wilson JR, Nori S, et al. Traumatic spinal cord injury. Nature Reviews Disease Primers. 2017;3(1):17018. doi:10.1038/nrdp.2017.18
30. Lloyd AF, Davies CL, Holloway RK, et al. Central nervous system regeneration is driven by microglia necroptosis and repopulation. Nat Neurosci. 2019;22(7):1046–1052. doi:10.1038/s41593-019-0418-z
31. Li Y, Ritzel RM, Khan N, et al. Delayed microglial depletion after spinal cord injury reduces chronic inflammation and neurodegeneration in the brain and improves neurological recovery in male mice. Theranostics. 2020;10(25):11376–11403. doi:10.7150/thno.49199
32. Lv R, Du L, Zhang L, Zhang Z. Polydatin attenuates spinal cord injury in rats by inhibiting oxidative stress and microglia apoptosis via Nrf2/HO-1 pathway. Life Sci. 2019;217:119–127. doi:10.1016/j.lfs.2018.11.053
33. Fan H, Tang HB, Kang J, et al. Involvement of endoplasmic reticulum stress in the necroptosis of microglia/macrophages after spinal cord injury. Neuroscience. 2015;311:362–373. doi:10.1016/j.neuroscience.2015.10.049
34. Xu S, Wang J, Jiang J, et al. TLR4 promotes microglial pyroptosis via lncRNA-F630028O10Rik by activating PI3K/AKT pathway after spinal cord injury. Cell Death Dis. 2020;11(8):693. doi:10.1038/s41419-020-02824-z
35. Wang J, Zhang F, Xu H, et al. TLR4 aggravates microglial pyroptosis by promoting DDX3X-mediated NLRP3 inflammasome activation via JAK2/STAT1 pathway after spinal cord injury. Clin Translat Med. 2022;12(6):e894. doi:10.1002/ctm2.894
36. Newton K, Dixit VM, Kayagaki N. Dying cells fan the flames of inflammation. Science. 2021;374(6571):1076–1080. doi:10.1126/science.abi5934
37. Wu F, Li L, Li Z, et al. Mechanism of Mettl14 regulating AIM2 inflammasome activation and neuronal apoptosis and pyroptosis in spinal cord injury by mediating PPARγ m6A methylation. J Physiol Biochem. 2024;80(4):881–894. doi:10.1007/s13105-024-01047-6
38. Xiao X, Chen XY, Dong YH, et al. Pre-treatment of rapamycin transformed M2 microglia alleviates traumatic cervical spinal cord injury via AIM2 signaling pathway in vitro and in vivo. Int Immunopharmacol. 2023;121:110394. doi:10.1016/j.intimp.2023.110394
39. Wang SN, Guo XY, Tang J, et al. Expression and localization of absent in melanoma 2 in the injured spinal cord. Neural Regenerat Res. 2019;14(3):542–552. doi:10.4103/1673-5374.245481
40. Wang L, Zhu Y, Zhang N, et al. The multiple roles of interferon regulatory factor family in health and disease. Signal transduction and targeted therapy. Signal Transduct Target Ther. 2024;9(1):282. doi:10.1038/s41392-024-01980-4
41. Lin W, Cai Z, Liang J, et al. Heme oxygenase-1 overexpression activates the IRF1/DRP1 signaling pathway to promote M2-Type polarization of spinal cord microglia. Drug Dev Res. 2024;85(8):e70033. doi:10.1002/ddr.70033
42. Yang J, Gong Z, Dong J, et al. lncRNA XIST inhibition promotes M2 polarization of microglial and aggravates the spinal cord injury via regulating miR-124-3p/IRF1 axis. Heliyon. 2023;9(7):e17852. doi:10.1016/j.heliyon.2023.e17852
43. Zhao J, Chen C, Xiao JR, et al. An Up-regulation of IRF-1 after a spinal cord injury: implications for neuronal apoptosis. J Mol Neurosci. 2015;57(4):595–604. doi:10.1007/s12031-015-0642-2
 © 2026 The Author(s). This work is published and licensed by Dove Medical Press Limited. The
full terms of this license are available at https://www.dovepress.com/terms
and incorporate the Creative Commons Attribution
- Non Commercial (unported, 4.0) License.
By accessing the work you hereby accept the Terms. Non-commercial uses of the work are permitted
without any further permission from Dove Medical Press Limited, provided the work is properly
attributed. For permission for commercial use of this work, please see paragraphs 4.2 and 5 of our Terms.
© 2026 The Author(s). This work is published and licensed by Dove Medical Press Limited. The
full terms of this license are available at https://www.dovepress.com/terms
and incorporate the Creative Commons Attribution
- Non Commercial (unported, 4.0) License.
By accessing the work you hereby accept the Terms. Non-commercial uses of the work are permitted
without any further permission from Dove Medical Press Limited, provided the work is properly
attributed. For permission for commercial use of this work, please see paragraphs 4.2 and 5 of our Terms.
Recommended articles
Non-Coding RNAs Regulate Spinal Cord Injury-Related Neuropathic Pain via Neuroinflammation
Zhu J, Huang F, Hu Y, Qiao W, Guan Y, Zhang ZJ, Liu S, Liu Y
Journal of Inflammation Research 2023, 16:2477-2489
Published Date: 13 June 2023
Mesenchymal Stem Cell Transplantation: Neuroprotection and Nerve Regeneration After Spinal Cord Injury
Chen SY, Yang RL, Wu XC, Zhao DZ, Fu SP, Lin FQ, Li LY, Yu LM, Zhang Q, Zhang T
Journal of Inflammation Research 2023, 16:4763-4776
Published Date: 20 October 2023
Unveiling the Temporal Dynamics and Molecular Regulation Profiles of Neutrophil Extracellular Traps Following Spinal Cord Injury

Li J, Chang C, Li Y, Cui S, Bai J, Zhang C, Wang X, Li K, Jian F
Journal of Inflammation Research 2025, 18:10585-10608
Published Date: 6 August 2025
Gut–Spinal Cord Axis in Spinal Cord Injury: Bidirectional Inflammatory Mechanisms and Microbiota-Targeted Therapeutic Strategies
Dong J, Xie T, Shi C, Feng G, Zhang H, Xu Z, Dong L
Journal of Inflammation Research 2025, 18:12549-12573
Published Date: 12 September 2025