Back to Journals » Journal of Inflammation Research » Volume 19
Integrated Machine Learning and Multi-Omics Analysis Identifies Mitophagy-Related Core Genes and Mechanisms in Non-Alcoholic Fatty Liver Disease
Authors Yuan Y, Zhang T, Song C, Lin C, Sun Y, Tang H ![]()
Received 22 October 2025
Accepted for publication 6 March 2026
Published 24 March 2026 Volume 2026:19 575586
DOI https://doi.org/10.2147/JIR.S575586
Checked for plagiarism Yes
Review by Single anonymous peer review
Peer reviewer comments 2
Editor who approved publication: Dr Fatih Türker
Yu Yuan,1,* Tianyu Zhang,1,* Chao Song,1 Chunli Lin,1 Yuewen Sun,2 Hongzhen Tang2
1Department of Acupuncture and Tuina, Guangxi University of Chinese Medicine, Nanning, Guangxi Province, 530000, People’s Republic of China; 2Department of Scientific Research, Ruikang Hospital Affiliated to Guangxi University of Chinese Medicine, Nanning, Guangxi Province, 530000, People’s Republic of China
*These authors contributed equally to this work
Correspondence: Hongzhen Tang, Ruikang Hospital Affiliated to Guangxi University of Chinese Medicine, Nanning, Guangxi Province, 530000, People’s Republic of China, Email [email protected]
Objective: This study aimed to systematically screen for mitophagy-related core genes in Non-alcoholic fatty liver disease (NAFLD), elucidate their specific molecular regulatory network, and investigate their functional mechanisms and roles within the immune microenvironment to provide novel targets for disease diagnosis and therapy.
Methods: Multiple NAFLD transcriptomic datasets and single-cell RNA sequencing data from the GEO database were integrated. Bioinformatics analysis, Weighted Gene Co-expression Network Analysis (WGCNA), and 11 machine learning algorithms were employed for core gene screening. Functional mechanisms and immune microenvironment characteristics were further investigated using SHAP model interpretability analysis, including detailed immune infiltration analysis, PPI network construction, GSEA, single-cell trajectory inference, and cell-cell communication analysis. Reverse network pharmacology and molecular docking predicted potential targeted compounds. In vitro experiments (Western Blot, qRT-PCR, JC-1 staining) validated core gene expression and mitophagy levels.
Results: Five key genes-IGF1, MYH11, HYOU1, SPATA18, and SCD-were identified, demonstrating excellent disease discrimination across multiple cohorts (training set AUC=0.974). These genes were significantly enriched in processes like endoplasmic reticulum stress, mitophagy, and lipid metabolism. Critically, they played crucial roles in reshaping the NAFLD immune microenvironment, characterized by increased macrophage M2 polarization and T cell infiltration, linking mitochondrial dysfunction to inflammatory response. Single-cell analysis revealed their expression heterogeneity across hepatocytes, macrophages, and T cells, along with their involvement in intercellular communication patterns. Experimental validation confirmed aberrant core gene expression and altered mitophagy levels in NAFLD cell models.
Conclusion: This study systematically delineates the regulatory network of mitophagy-related core genes in NAFLD and the resultant inflammatory immune microenvironment, offering novel insights and data support for elucidating disease mechanisms, developing early diagnostic biomarkers, and formulating precise therapeutic strategies.
Keywords: non-alcoholic fatty liver disease, mitophagy, machine learning, bioinformatics
Introduction
Non-alcoholic fatty liver disease (NAFLD) has emerged as the most common chronic liver disease worldwide, with its prevalence rising significantly alongside the epidemics of obesity, type 2 diabetes, and metabolic syndrome.1 The pathological spectrum of NAFLD ranges from simple steatosis to non-alcoholic steatohepatitis (NASH), fibrosis, and potentially cirrhosis and hepatocellular carcinoma, posing a serious threat to human health.2 Although its pathogenesis involves complex interactions among multiple factors and pathways, dysregulated lipid metabolism, oxidative stress, and inflammatory responses are widely recognized as core drivers of NAFLD initiation and progression.3 Unfortunately, specific therapies capable of effectively reversing NAFLD pathology are currently lacking in the clinic, with interventions primarily focusing on complication management and metabolic parameter regulation. There is an urgent need to dissect the molecular pathogenesis in depth to provide a theoretical basis and novel targets for developing targeted therapies.
Within the complex pathogenic network of NAFLD, mitochondrial dysfunction has garnered increasing attention. As the primary site of cellular energy metabolism and reactive oxygen species (ROS) production, mitochondria play a crucial role in maintaining hepatocyte lipid homeostasis.4 Studies indicate that mitochondrial structural and functional damage is closely associated with intrahepatic lipid accumulation, insulin resistance, and inflammation activation. Mitophagy, a highly selective autophagic process responsible for identifying and removing dysfunctional or damaged mitochondria, is a core mechanism for maintaining mitochondrial quality control and cellular homeostasis.5 Impaired mitophagy leads to the accumulation of abnormal mitochondria, resulting in excessive ROS generation, energy metabolism disruption, and exacerbated lipotoxicity, thereby promoting hepatocyte steatosis, inflammatory responses, and fibrogenesis.6 Consequently, restoring or enhancing mitophagy is considered a promising strategy for halting NAFLD progression,7 making the exploration of its regulatory mechanisms highly significant scientifically and clinically.
Although existing research suggests a key role for mitophagy in NAFLD, the related molecular events and their dynamic regulation across different disease stages remain incompletely systematically elucidated. The rapid development of bioinformatics technologies, integrating multi-omics data with artificial intelligence algorithms, offers a novel perspective for mining key disease genes and revealing molecular interaction networks. This study aims to leverage public database resources comprehensively, combining bioinformatics analysis, multiple machine learning models, and reverse network pharmacology approaches to systematically identify mitophagy-related core genes in NAFLD, explore their potential functional mechanisms, and predict corresponding targeted drugs and active compounds. The findings from computational analyses were further validated through in vitro experiments using an NAFLD cell model. The findings are expected to provide new theoretical foundations and data support for understanding disease mechanisms, early diagnosis, and precise treatment of NAFLD.
Furthermore, a critical gap in knowledge lies in the precise mechanism by which defective mitophagy transitions from a cellular metabolic flaw to a driver of systemic inflammation, propelling the progression from benign steatosis (NAFL) to inflammatory steatohepatitis (NASH). It is hypothesized that dysfunctional mitochondria, when not adequately cleared, become a potent source of damage-associated molecular patterns (DAMPs), such as mitochondrial DNA and cardiolipin. These DAMPs activate innate immune sensors (eg., the NLRP3 inflammasome) in hepatocytes and Kupffer cells, triggering the release of pro-inflammatory cytokines (eg., IL-1β, IL-18). This initiates a chemokine gradient that recruits peripheral immune cells, including monocytes and lymphocytes, into the liver parenchyma. Consequently, a self-sustaining cycle of inflammation, cell death, and fibrosis is established. Therefore, identifying the key mitophagy-related genes that malfunction in NAFLD and elucidating their downstream impact on immune cell communication is essential to decode the inflammatory switch in NASH pathogenesis.
Materials and Methods
Data Collection and Preprocessing
Six NAFLD-related datasets were retrieved and downloaded from the GEO database (https://www.ncbi.nlm.nih.gov/geo/), comprising 3 microarray datasets, 2 next-generation sequencing datasets, and 10 single-cell RNA sequencing datasets. Details of the datasets are summarized in Table 1. The microarray datasets GSE63067, GSE89632, and GSE164760 were merged to form the training set. Probe annotation and normalization were performed for each dataset individually before merging. The ComBat algorithm was applied to the merged training set data to correct for batch effects, and the effectiveness of batch effect removal was verified by principal component analysis (PCA). The GSE135251 and GSE61260 datasets served as independent validation sets.
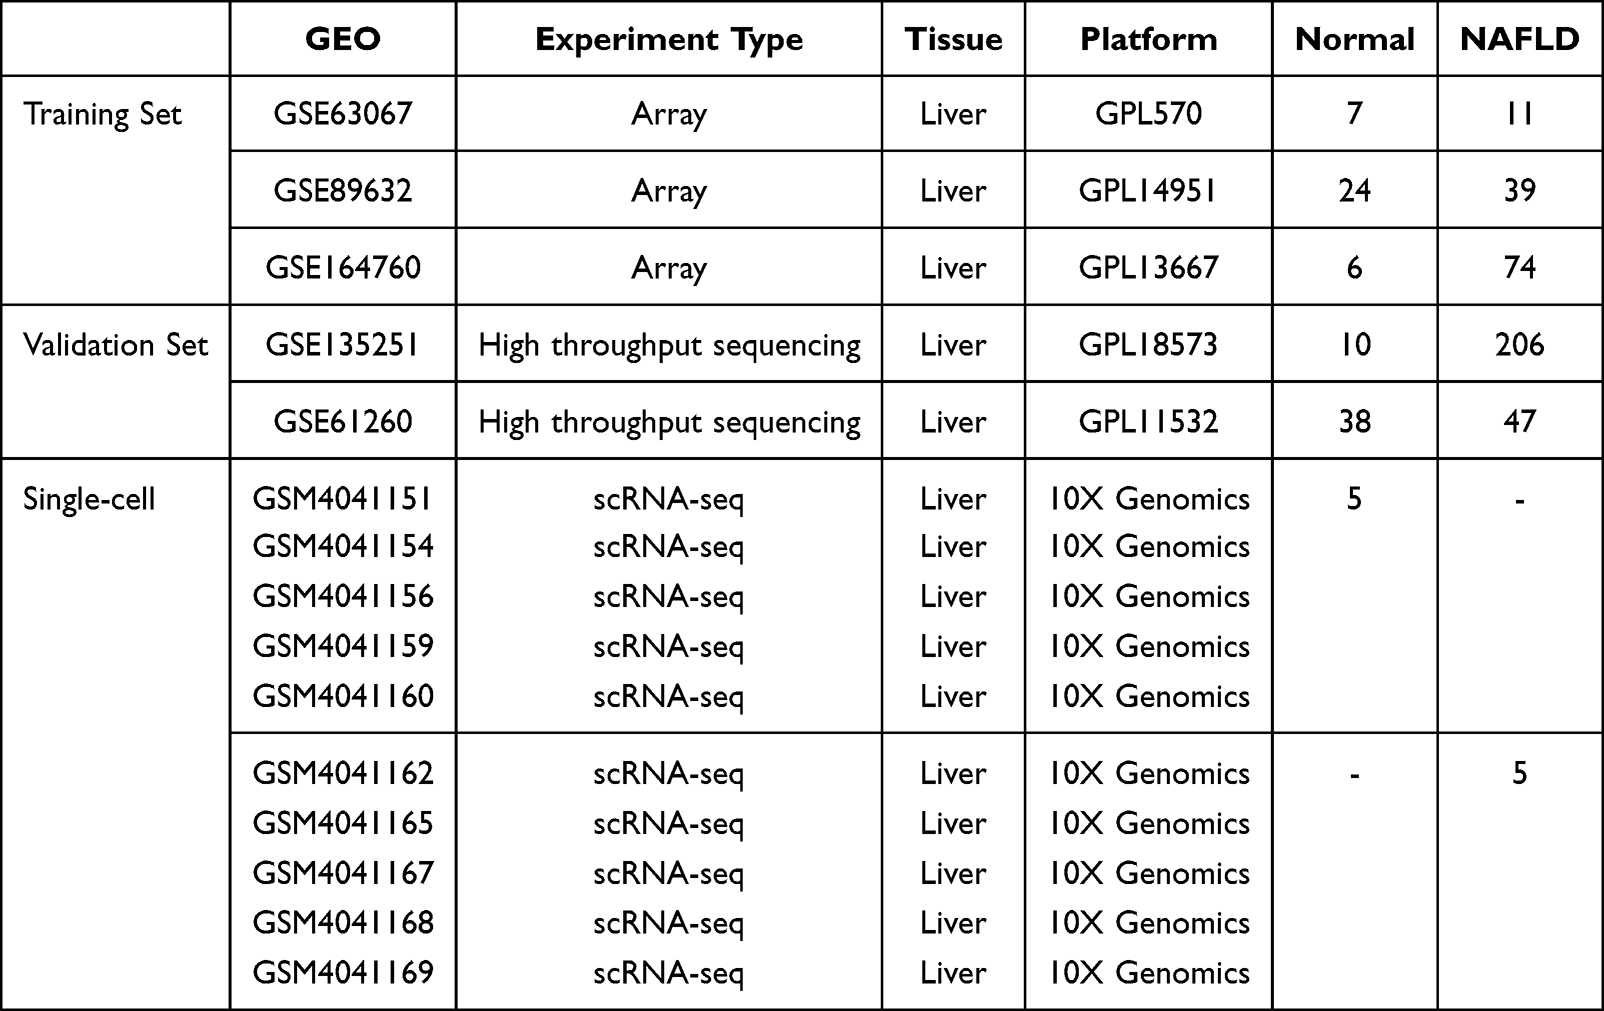 |
Table 1 Overview of Datasets Used in This Study |
Mitophagy-Related Gene Set
Genes associated with the biological process “Mitophagy” were retrieved from the Genecards database (https://www.genecards.org/) using the search term “mitophagy”. To ensure high relevance, only genes with a “relevance score” (an internal metric of Genecards reflecting the strength of association with the query term) greater than 1.0 were selected, resulting in a final set of 1765 mitophagy-related genes for subsequent analysis.
Differential Expression Analysis
Differential expression analysis was performed using the R package limma. A linear model was constructed with sample group (healthy vs. NAFLD) as the core variable in the design matrix. Models were fitted using lmFit and eBayes functions with empirical Bayes moderation. Contrasts between groups were calculated using makeContrasts. Significantly differentially expressed genes (DEGs) were defined as those with |log2 Fold Change| > 0.585 (ie., 1.5-fold change) and an adjusted P-value (FDR) < 0.05.
KEGG Pathway Enrichment Analysis
KEGG pathway enrichment analysis for the identified DEGs was conducted using the clusterProfiler package. Gene symbols were converted to Entrez IDs, and unmatched genes were removed. Enrichment analysis was performed using the enrichKEGG function (parameters: pvalueCutoff=1, qvalueCutoff=1), and significantly enriched pathways were filtered with a threshold of P < 0.05. The top 30 significantly enriched pathways were visualized using bar and dot plots.
Weighted Gene Co-Expression Network Analysis (WGCNA)
WGCNA was used to construct gene co-expression networks. The expression matrix was quality-controlled, filtering out genes with low variance (standard deviation ≤ 0.5). The goodSamplesGenes function checked for and removed samples and genes with excessive missing values. Sample hierarchical clustering was performed to identify and remove outliers. To satisfy the scale-free topology criterion, the pickSoftThreshold function evaluated powers from 1 to 20, selecting the smallest power where the scale-free topology fit index R2 first reached above 0.8 as the soft threshold. Using the chosen soft threshold, co-expression modules were constructed via the blockwiseModules function (minModuleSize = 60). Module eigengenes (MEs), defined as the first principal component of each module representing the gene expression profile, were calculated. The correlation between each ME and the binary disease trait (NAFLD = 1, Healthy = 0) was then computed. The module with the highest absolute correlation coefficient (positive or negative) and a statistically significant P-value (< 0.05) was identified as the key module most associated with the disease trait. Module eigengenes were calculated, and highly similar modules (correlation > 0.75) were merged to obtain the final gene module assignments. Key modules most associated with the disease trait (NAFLD vs. healthy) were identified by calculating module-trait relationships.
Machine Learning for Core Gene Screening
Based on the candidate genes from the above analyses, a comprehensive machine learning strategy was employed. A total of 11 mainstream algorithms, including regularized regression, support vector machines, discriminant analysis, and various ensemble learning models, were used. An “feature selection + modeling” two-step process generated 87 model combinations for evaluation. Hyperparameters for all models were optimized via cross-validation. Model performance was comprehensively assessed using accuracy, sensitivity, specificity, F1-score, and the area under the receiver operating characteristic curve (AUC). Results were visualized using multiple methods.
SHAP Model Interpretability Analysis
To interpret the decision-making mechanism of the best-performing model, SHAP (SHapley Additive exPlanations) analysis was performed. An input set based on the identified key features was constructed, and the kernelshap algorithm was used to compute the contribution value (SHAP value) of each feature to the prediction outcome for individual samples. The shapviz package generated various visualizations, including feature importance ranking plots, SHAP summary (beeswarm) plots, SHAP dependence plots, waterfall plots, and force plots for individual samples, revealing feature contribution patterns and interactions from multiple dimensions.
Protein-Protein Interaction (PPI) Network Construction
Core genes identified by machine learning were submitted to the GeneMANIA database (https://genemania.org/) to construct a PPI network, exploring functional associations and potential interactions among the core targets.
Immune Infiltration Analysis
The CIBERSORT algorithm was used to deconvolute transcriptomic data and quantify the relative proportions of 22 immune cell subtypes. The analysis was run with 1000 permutations for significance assessment, and the expression matrix was quantile-normalized to reduce technical bias. Only samples with significant immune cell proportion estimates (P < 0.05) were retained. Differences in immune cell proportions between the NAFLD group and the healthy control group were compared using the Wilcoxon rank-sum test, and results were displayed using stacked bar plots and box plots. Spearman correlation coefficients among immune cell subtypes were calculated and visualized via heatmap. Furthermore, the linkET package was used to analyze associations between core gene expression and immune cell infiltration levels, visualized using correlation network plots.
Gene Set Enrichment Analysis (GSEA)
Single-gene GSEA for the core genes was performed using the clusterProfiler package. Samples were divided into high- and low-expression groups based on the median expression level of the target gene. Genome-wide expression differences between the two groups were calculated and ranked. Custom KEGG gene sets were used for enrichment analysis, significant pathways (P < 0.05) were identified, and enrichment plots were generated.
Single-Cell RNA Sequencing Data Analysis
Data Preprocessing and Quality Control
Single-cell RNA-seq data from 10 samples (5 Healthy, 5 NAFLD) were processed using Seurat (v5). For each sample, expression matrices were read, Seurat objects were created, and quality control thresholds were applied: genes detected in ≥3 cells, cells with detected gene counts between 500 and 7500, unique molecular identifiers (UMIs) > 1000, mitochondrial gene percentage (<20%), and log10(genes/UMI) > 0.8.
Doublet Detection and Filtration
The scDblFinder package was used for doublet identification. Data were normalized and highly variable genes (2000) were selected before converting Seurat objects to SingleCellExperiment objects for doublet scoring. Cells classified as “singlet” with a doublet score < 0.8 were retained.
Batch Effect Correction and Data Integration
The Harmony algorithm was used to correct batch effects across the 10 samples. Data were merged, normalized, and 2000 highly variable genes were selected. Data scaling regressed out the effects of mitochondrial percentage and cell cycle scores (S.Score, G2M.Score). After PCA dimensionality reduction, Harmony integration was run using the first 30 principal components with sample ID as the grouping variable.
Cell Clustering and Annotation
Based on Harmony-corrected dimensions, a K-nearest neighbor graph was constructed using the first 20 dimensions, and cell clustering was performed using the Louvain algorithm (resolution=0.8). Visualization was done via UMAP. Cell types were annotated based on classical marker genes: Monocytes (CD14, LYZ), B cells (CD79A, MS4A1), Endothelial cells (PECAM1, VWF), NK cells (NKG7, GNLY), T cells (CD3D, CD3E), Hepatocytes (ALB, APOA1), Stellate cells (ACTA2, COL1A1), Macrophages (CD68, CD163), etc. Dot plots, violin plots, and feature plots were used to validate annotations.
Pseudotime Trajectory Analysis
Monocle2 was used for trajectory inference. Macrophage/monocyte and T cell subsets were analyzed separately. Seurat objects were converted to cell_data_set objects. After preprocessing (num_dim=50) and UMAP reduction, cells were clustered, and trajectory graphs were learned. Pseudotime values were calculated using the order_cells function, and expression dynamics of key genes (IGF1, MYH11, HYOU1, SPATA18, SCD) along the trajectory were analyzed.
Cell-Cell Communication Analysis
CellChat (v1.6.1) was used to infer cell-cell interactions. Based on the “Secreted Signaling” database, communication probabilities and signaling pathway activity were computed. Circle plots, hierarchy plots, and heatmaps visualized the communication networks and ligand-receptor interactions. Network centrality analysis identified key signaling roles, and non-negative matrix factorization (NMF) was used to identify communication patterns.
Cell Proportion and Differential Expression Analysis
Proportions of different cell types per sample were calculated. The Wilcoxon rank-sum test compared cell proportions between healthy and NAFLD groups. For each cell type, the FindMarkers function was used for intergroup differential expression analysis (parameters: min.pct=0.1, logfc.threshold=0.25) to identify NAFLD-associated, cell type-specific gene expression changes.
Reverse Network Pharmacology and Molecular Docking
Compound-gene interaction data were retrieved from the Comparative Toxicogenomics Database (CTD, https://ctdbase.org/), which was utilized to identify potential pharmaceutical ingredients targeting core genes. The Traditional Chinese Medicine Systems Pharmacology Database and Analysis Platform (TCMSP) was employed for screening bioactive components, with filtering criteria set as oral bioavailability ≥30% and drug-likeness ≥0.18. Through enrichment analysis of traditional Chinese medicines (TCMs) against the potential pharmaceutical ingredients of core genes, TCMs with statistical significance (P-value < 0.05 and adjusted P-value < 0.05) were selected as candidate herbs targeting the core genes. A “herb-component-target” interaction network was constructed based on the enrichment results, and significant associations were screened using Cytoscape_v3.8.0. Subsequently,
The online molecular docking platform CB-Dock2,8 which employs Curvature-based Cavity Detection (CurPocket) for binding site prediction, was used to perform molecular docking between the proteins encoded by the screened core genes and the candidate pharmaceutical ingredients, thereby evaluating their binding affinity and interaction mechanisms.
Experimental Validation of NAFLD Core Genes
To validate the expression differences of NAFLD core genes, HepG2 cells were used as the control group and an in vitro NAFLD model was established. Western Blot and qRT-PCR were used to detect protein and RNA level differences, respectively, and JC-1 staining was used to assess mitochondrial membrane potential changes indicative of mitophagy.
Materials
HepG2 cells were purchased from the Shanghai Cell Bank of the Chinese Academy of Sciences (Shanghai, China). The cells were cultured in Dulbecco’s Modified Eagle Medium (DMEM) (Gibco, USA) supplemented with 10% fetal bovine serum (FBS; Invitrogen, USA) and 100 μg/mL penicillin-streptomycin (Suzhou New Cellmei Biotechnology Co., Ltd., China).
The primary antibodies used were as follows: Anti-IGF1 Rabbit Polyclonal Antibody (IGF1, Catalog No. A11985; ABclonal Technology, China), Anti-MYH11 Rabbit Monoclonal Antibody (MYH11, Clone EPR5335; Abcam, Cambridge, UK), Anti-HYOU1 Rabbit Polyclonal Antibody (HYOU1, Catalog No. A1042; ABclonal Technology, Wuhan, China), Anti-SPATA18 Rabbit Polyclonal Antibody (SPATA18, Catalog No. A09906-1; ABclonal Technology, Wuhan, China), Anti-SCD (Stearoyl-CoA Desaturase) Rabbit Monoclonal Antibody (SCD, Catalog No. ab236868; Abcam, Cambridge, UK), and Anti-β-Actin Mouse Monoclonal Antibody (β-Actin, Catalog No. AC026; ABclonal Technology, Wuhan, China).Sodium palmitate (PA) and sodium oleate (OA) were obtained as a ready-made mixture (PA 6 mmol/L, OA 12 mmol/L; Catalog No. KC006) from Xi’an Kunchuang Technology Development Co., Ltd. (China).The mitochondrial membrane potential fluorescent probe JC-1 (Catalog No. C2006) was supplied by Beyotime Biotechnology (China). Carbonyl cyanide m-chlorophenyl hydrazone (CCCP; Product No. C2759) was purchased from Sigma-Aldrich (USA).
Cell Culture
HepG2 cells were cultured in DMEM with 10% FBS and 1% penicillin/streptomycin at 37°C with 5% CO2.
NAFLD Model Induction
A free fatty acid (FFA) mixture of OA and PA (2:1 molar ratio) complexed with BSA was prepared. HepG2 cells at ~70-80% confluence were treated with 0.5 mM FFA for 24 hours. Control cells received BSA only. Successful lipid accumulation was confirmed by Oil Red O staining.
qRT-PCR
Total RNA was extracted, reverse-transcribed to cDNA, and qPCR was performed using gene-specific primers (Table 2). Relative mRNA levels were calculated using the 2^(-ΔΔCt) method normalized to GAPDH.
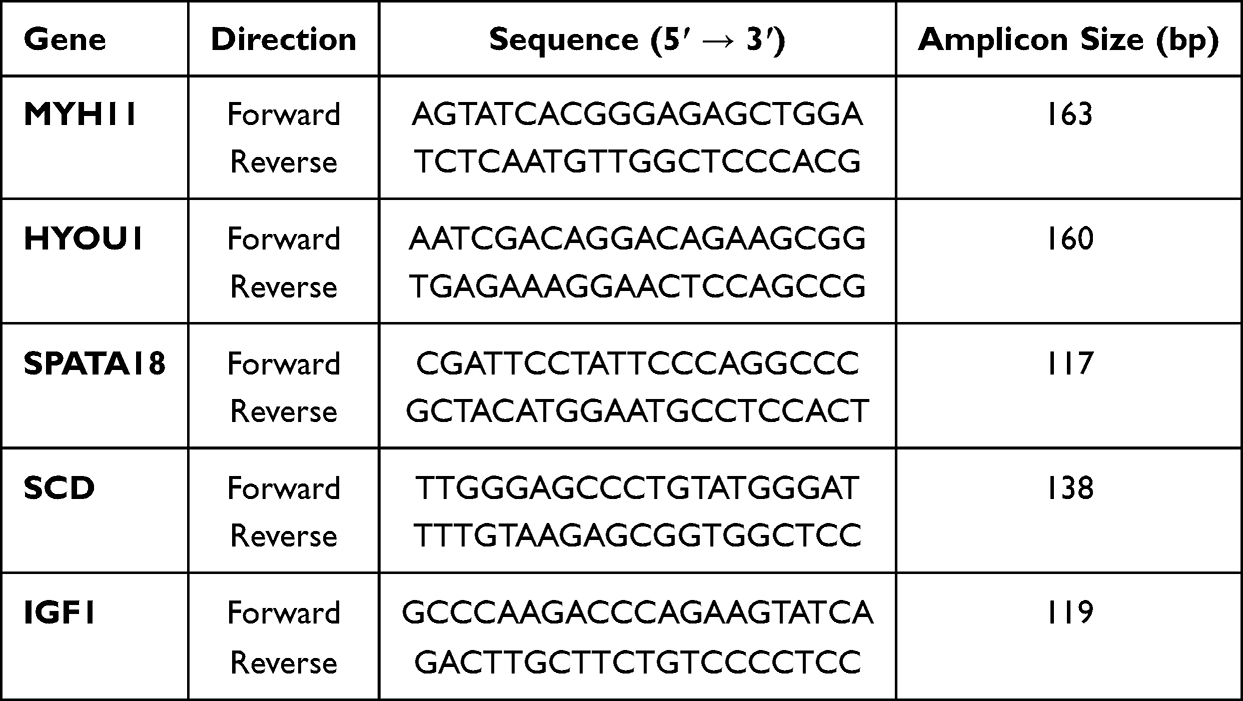 |
Table 2 Primer Sequences for qRT-PCR |
Western Blotting
Cells were lysed, proteins quantified (BCA assay), separated by SDS-PAGE, transferred to PVDF membranes, blocked, and incubated with primary antibodies overnight at 4°C, followed by HRP-conjugated secondary antibodies. Signals were detected using ECL chemiluminescence and analyzed with ImageJ software.
JC-1 Staining
Cells were incubated with JC-1 working solution 5 μM at 37°C for 15–20 min, washed, fixed, and imaged by confocal microscopy. JC-1 aggregates (red, high membrane potential) and monomers (green, low membrane potential) were detected. The red/green fluorescence intensity ratio was calculated to assess mitochondrial membrane potential.
All experiments were conducted with a minimum of three independent biological replicates per experimental condition (Control and NAFLD Model). qRT-PCR, JC-1 staining, and Western blot analyses were carried out on these biological replicates. For each biological replicate, three technical replicates were incorporated to ensure data reliability and reduce technical variability.
Statistical Analysis
All bioinformatics analyses were performed using R software (version 4.5.0). Multiple hypothesis testing was corrected using the False Discovery Rate (FDR) method. Group comparisons used appropriate parametric or non-parametric tests. A significance level of P < 0.05 was set. All analyses ensured statistical power through technical and biological replicates.
Results
Data Integration and Mitophagy-Related Gene Expression
Five NAFLD gene expression datasets were obtained from GEO (Table 1). GSE135251 and GSE61260 were designated as validation sets. GSE63067, GSE89632, and GSE164760 were merged to form the training set. Raw data distribution and PCA before normalization showed batch effects (Figure 1A and 1B). After batch effect removal using ComBat and normalization, the integrated training set data showed significantly reduced batch effects (Figure 1C and D).
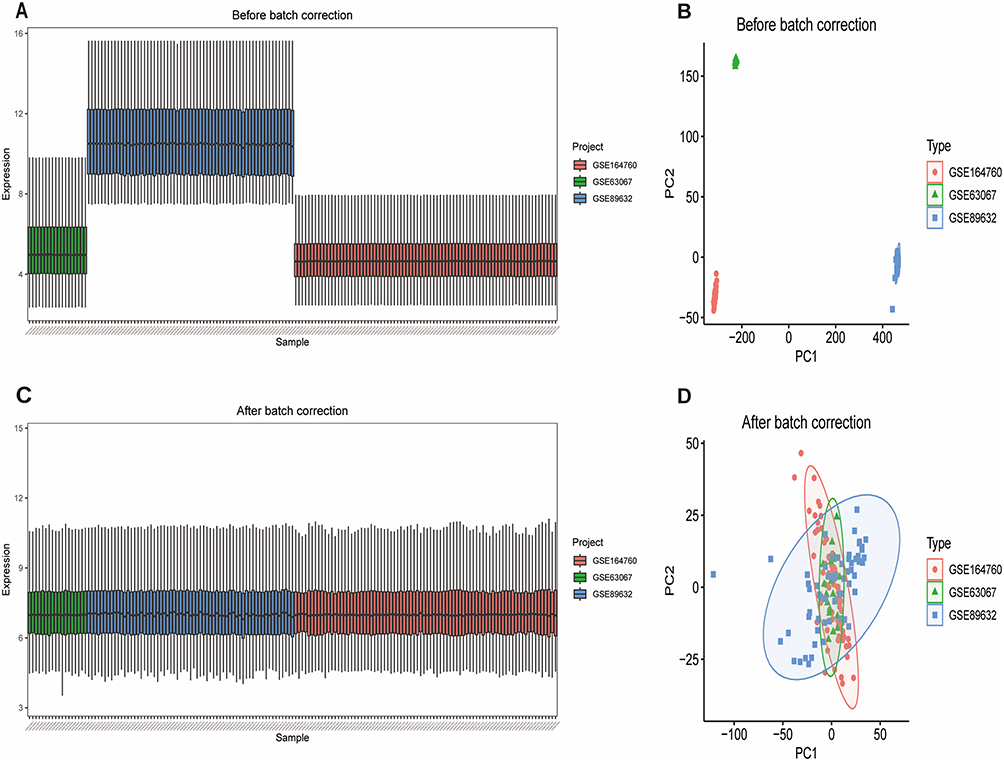 |
Figure 1 (A) Boxplot of raw training set data before normalization. (B) PCA plot before batch effect correction. (C) Boxplot of training set data after batch effect correction and normalization. (D) PCA plot after batch effect correction. |
Differential Expression and WGCNA Analysis
Differential analysis identified 230 significant DEGs between healthy and NAFLD groups (91 up, 139 down) (Figure 2A). A heatmap displayed the expression patterns of the top 50 DEGs (Figure 2B). KEGG enrichment analysis of DEGs revealed involvement in pathways like Cytokine-cytokine receptor interaction, TNF signaling, Lipid and atherosclerosis, MAPK signaling, and IL-17 signaling (Figure 2C). WGCNA analysis selected a soft threshold power of 10, ensuring a biologically relevant and statistically stable co-expression network (Figure 2D). Co-expression modules were identified; the grey module (320 genes, r = −0.61, p = 8e-18) showed the strongest negative correlation with disease status (Figure 2E). The gene clustering dendrogram and module assignment are shown (Figure 2F). Intersection of the WGCNA key module genes (320) with the mitophagy-related gene set (1765) yielded 17 hub genes (Figure 2G), suggesting a close association of this module with mitochondrial function.
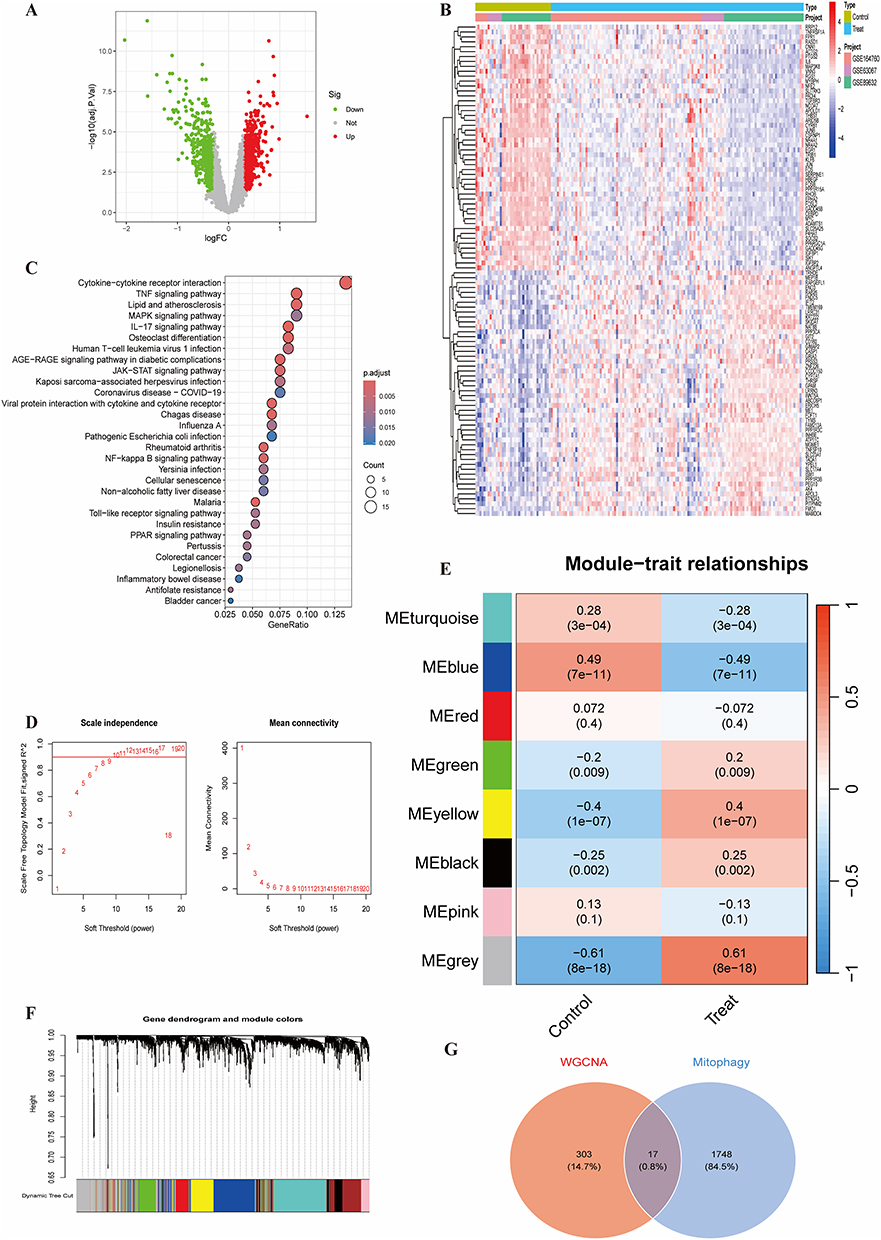 |
Figure 2 (A) Volcano plot of NAFLD DEGs. (B) Heatmap of top 50 DEGs. (C) Bubble plot of KEGG enrichment for DEGs. (D) Scale-free topology model fit and mean connectivity for different soft-thresholding powers in WGCNA. (E) Module-trait relationships heatmap. (F) Gene clustering dendrogram and module colors. (G) Venn diagram showing overlap between WGCNA grey module genes and mitophagy-related genes (17 hub genes). |
Machine Learning Identifies Core Genes
Based on the 17 hub genes, multiple machine learning models were evaluated across three cohorts (training set, GSE135251, GSE61260) (Figure 3A). The glmBoost+GBM combination performed best, identifying 8 key genes: IGF1, MYH11, HYOU1, SPATA18, EPS8L2, SCD, ACACA, FEN1. Among these, IGF1, MYH11, HYOU1, SPATA18, and SCD were also significant DEGs, as marked on the volcano plot (Figure 3B). This model showed excellent diagnostic performance with AUCs of 0.974, 0.951, and 0.756 in the training, GSE135251, and GSE61260 cohorts, respectively. Confusion matrices demonstrated robust performance across cohorts (Figure 3C–E). Analysis of feature selection frequency highlighted MYH11, SCD, and SPATA18 as the most consistently selected genes, indicating their importance in disease discrimination (Figure 3F).
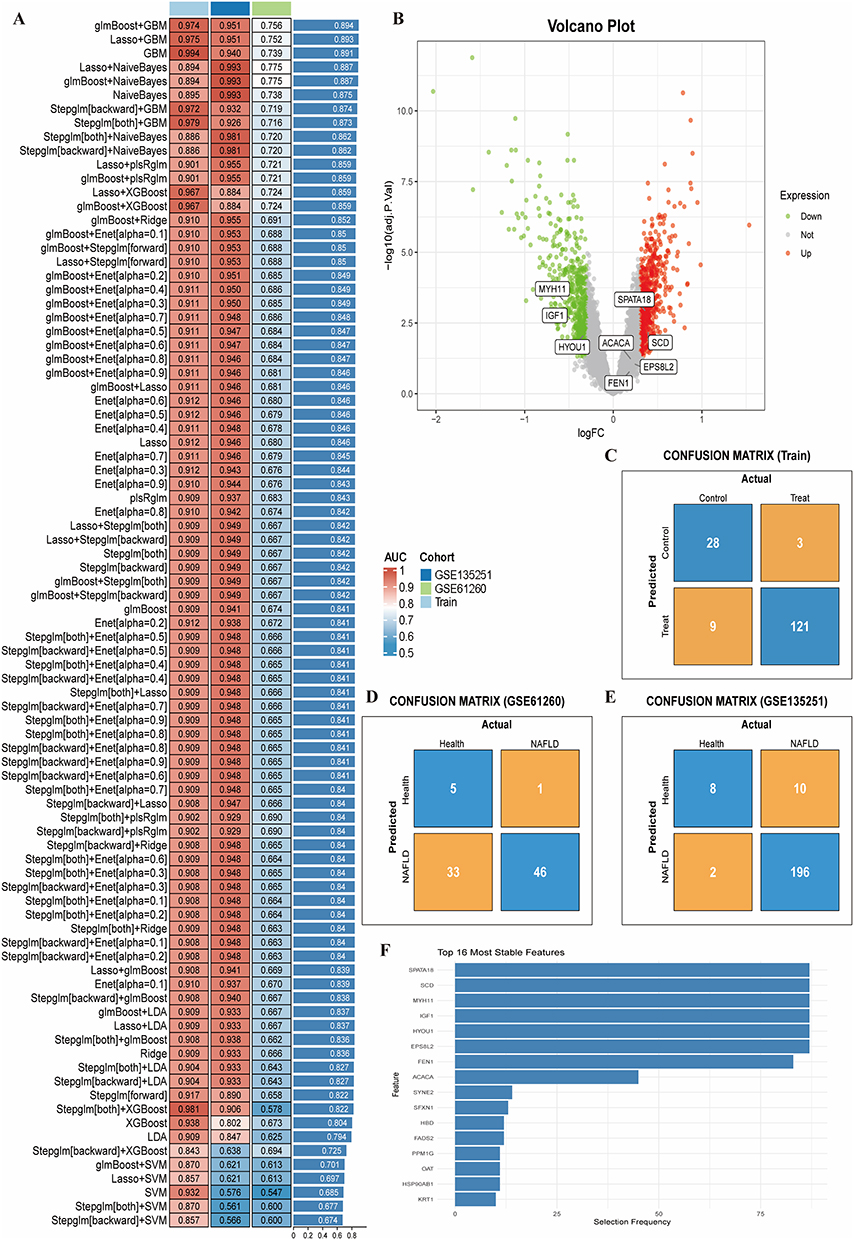 |
Figure 3 (A) AUC performance of various machine learning models across cohorts. (B) Volcano plot highlighting the 8 key genes identified by glmBoost+GBM; IGF1, MYH11, HYOU1, SPATA18, SCD are significant DEGs. (C–E) Confusion matrices for the training set (C), GSE135251 validation set (D), and GSE61260 validation set (E). (F) Bar plot showing the selection frequency of the most stable features during model building. |
SHAP Analysis for Model Interpretation
SHAP analysis revealed that high SHAP values for IGF1 were concentrated, indicating its significant positive influence on model output (predicting NAFLD) (Figure 4A). SPATA18 and HYOU1 showed moderate positive influences, while ACACA and FBN1 had relatively smaller, mainly negative contributions. The mean absolute SHAP value ranking confirmed IGF1 (0.665) as the most important feature, followed by HYOU1 (0.450) and SPATA18 (0.334) (Figure 4B). For an individual NAFLD sample prediction (output value 2.26), IGF1 contributed +0.699, being the most important diagnostic factor (Figure 4C). Conversely, for a healthy sample prediction (output value −0.463), IGF1 was the primary negative contributor (−1.21) (Figure 4D). Bar plots for specific samples further emphasized IGF1’s dominant role (Figure 4E and F). SHAP dependence plots suggested a positive correlation between HYOU1 and IGF1 SHAP values, and a potential interaction between MYH11 and IGF1. An inverse relationship was observed between SPATA18 and SCD (Figure 4G).
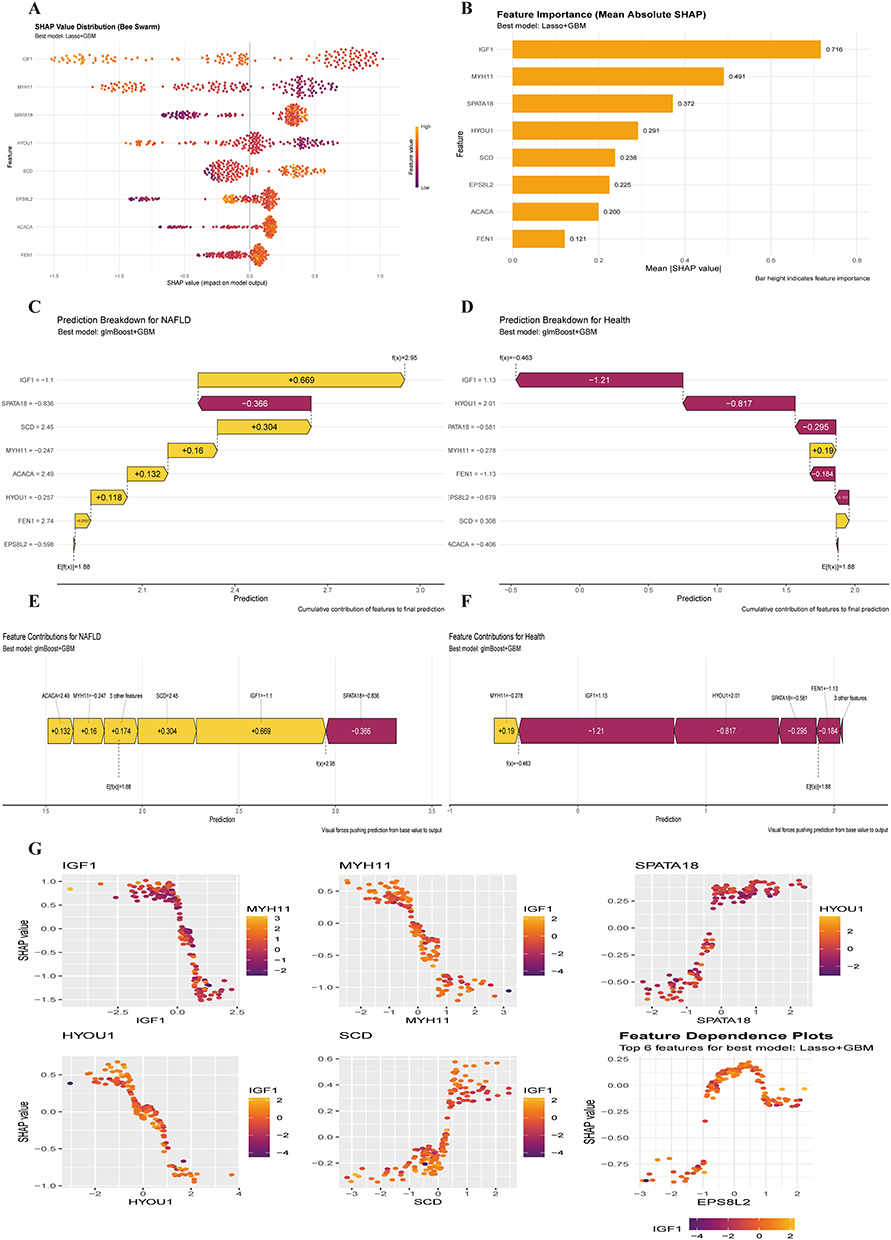 |
Figure 4 SHAP analysis. (A) Bee swarm plot of SHAP values for main features. (B) Feature importance based on mean absolute SHAP values. (C and D) SHAP force plots decomposing predictions for an individual NAFLD sample (C) and a healthy sample (D). (E and F) Bar plots showing feature contributions for specific NAFLD (E) and healthy (F) samples. (G) SHAP dependence plots for key feature pairs. |
Core Gene Relationships and GSEA
The five final core genes—IGF1, MYH11, HYOU1, SPATA18, and SCD—showed significant expression differences between disease and healthy groups. IGF1, MYH11, and HYOU1 were downregulated, while SPATA18 and SCD were upregulated in NAFLD (Figure 5A). Correlation analysis revealed a significant negative correlation between IGF1 and SCD (Figure 5B). PPI network analysis positioned IGF1 centrally, connecting it to processes like IGF-like growth factor signaling, oxygen metabolism, and T-cell proliferation (Figure 5C). GSEA for the five core genes indicated their involvement in metabolic regulation, MAPK signaling, endoplasmic reticulum stress, and fibrosis pathways (Figure 5D).
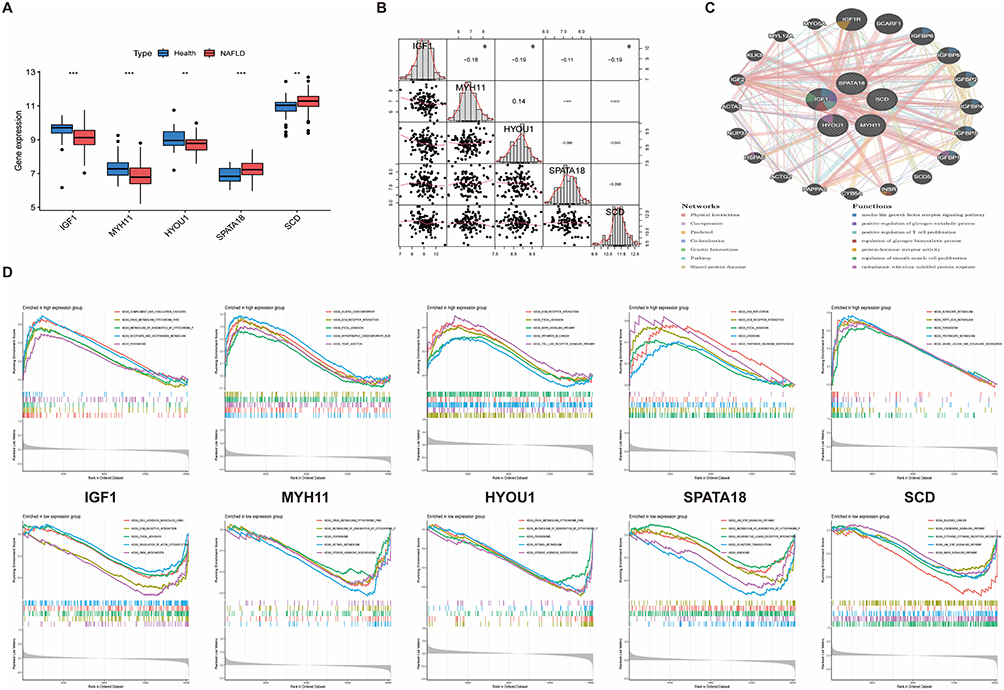 |
Figure 5 (A) Expression differences of core genes between healthy and NAFLD groups (**P < 0.01, ***P < 0.001). (B) Correlation analysis among core genes (*P < 0.05,**P < 0.01, ***P < 0.001). (C) PPI network and functional associations of core genes. (D) GSEA enrichment plots for core genes. |
Immune Infiltration Landscape
Stacked bar plots and box plots showed distinct immune cell composition between groups. The NAFLD group had relatively higher proportions of T cells gamma delta, Monocytes, Macrophages M2, Dendritic cells resting, and Mast cells resting. Notably, T cells CD4 memory activated and Mast cells activated were significantly increased in NAFLD (Figure 6A and B). Correlation heatmap revealed significant positive and negative correlations among various immune cell types (Figure 6C). Core gene expression was correlated with immune cell infiltration levels. For instance, IGF1 negatively correlated with T cells CD4 naive but positively with T cells gamma delta. MYH11 negatively correlated with Macrophages M1. HYOU1 showed negative correlations with T cells CD4 memory activated, T cells gamma delta, and Macrophages M2. SCD negatively correlated with B cells naive and Dendritic cells activated but positively with T cells CD4 naive and Macrophages M2 (Figure 6D).
 |
Figure 6 Immune infiltration analysis. (A) Stacked bar plot of immune cell proportions. (B) Box plots comparing immune cell proportions between groups (*P < 0.05, **P < 0.01, ***P < 0.001). (C) Heatmap of correlations among immune cell types. (D) Network plot showing correlations between core gene expression and immune cell infiltration levels. |
Single-Cell Transcriptomics Reveals Cellular Heterogeneity
UMAP visualization identified 20 distinct cell clusters from the integrated single-cell data (Figure 7A). These were annotated into major liver cell types: T cells, Monocytes, NK cells, Endothelial cells, Macrophages, B cells, and Stellate cells (Figure 7B). Proportion analysis showed a significant increase in T cells and Monocytes, and a decrease in Endothelial cells and B cells in NAFLD (Figure 7C and E). Dot plot of marker gene expression supported the annotation (Figure 7D). Differential expression analysis within each cell type identified numerous NAFLD-associated genes (Figure 7F). Feature plots showed specific expression patterns of the core genes: IGF1 and SCD were concentrated in Macrophages, MYH11 in Stellate cells, SPATA18 in Hepatocytes, and HYOU1 was broadly expressed (Figure 7G).
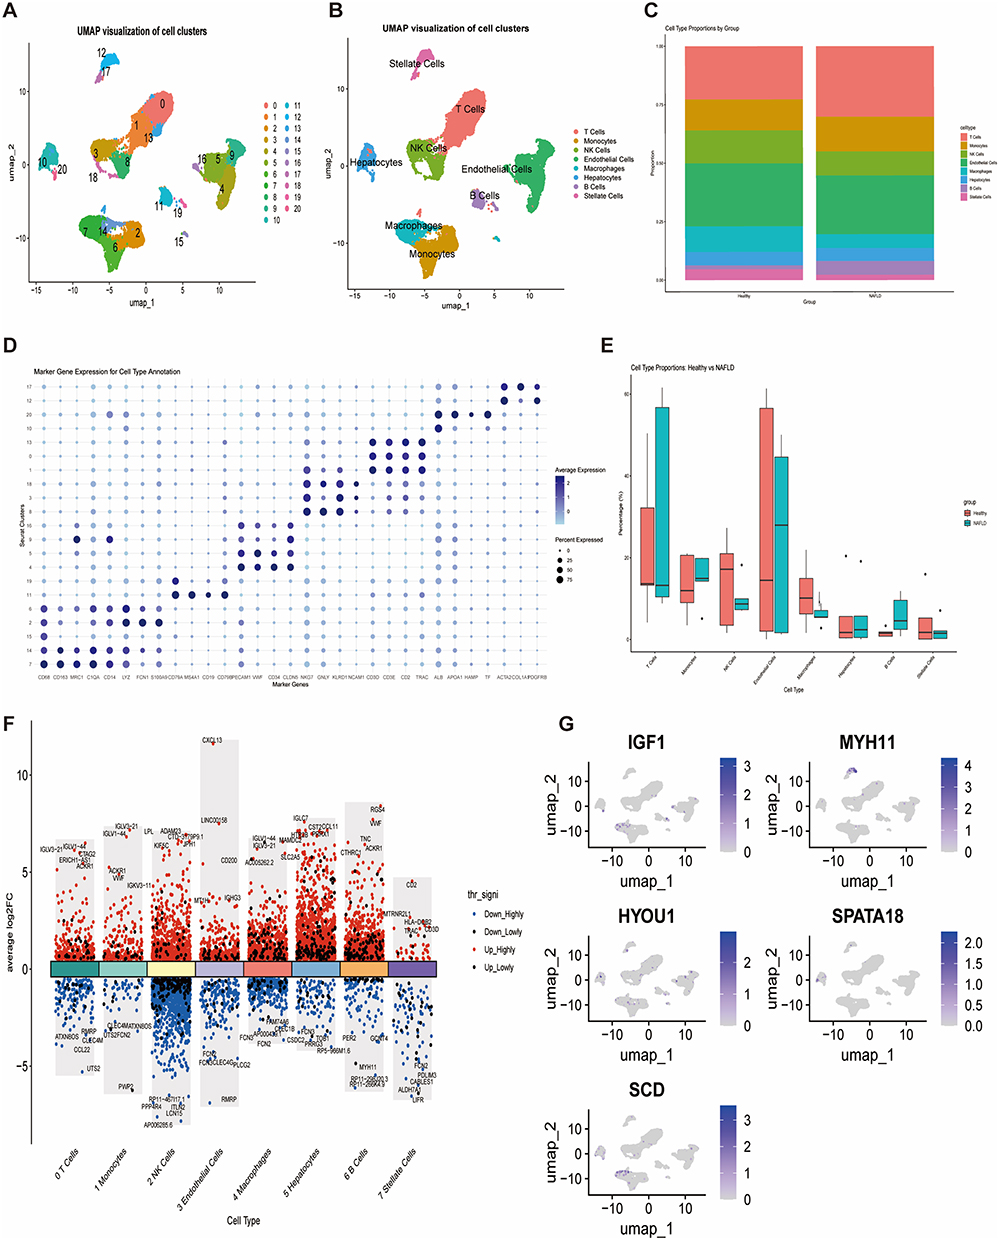 |
Figure 7 Single-cell analysis. (A) UMAP of 20 cell clusters. (B) UMAP annotated by major cell types. (C) Bar plot of cell type proportions per sample/group. (D) Dot plot of marker gene expression for cell type annotation. (E) Box plots comparing cell type proportions between groups. (F) Volcano plots of DEGs for 8 major cell types. (G) UMAP feature plots showing expression distribution of core genes. |
Pseudotime Trajectory Analysis
Monocytes/Macrophages: Trajectory analysis revealed three branches, indicating heterogeneity (Figure 8A and B). Pseudotime analysis showed dynamic changes along the trajectory (Figure 8C). IGF1 and SCD were upregulated during the monocyte-to-macrophage transition (Figure 8D).
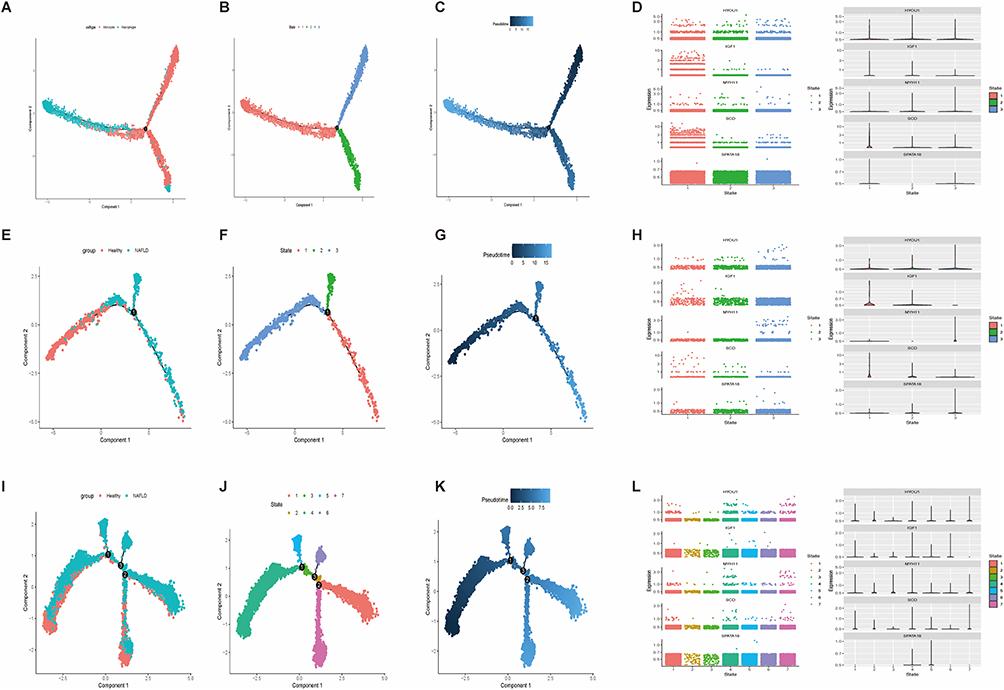 |
Figure 8 Pseudotime analysis. (A–D) Monocytes/Macrophages: (A) UMAP, (B) State classification, (C) Pseudotime trajectory, (D) Marker gene expression. (E–H) Hepatocytes: (E) UMAP by group, (F) State classification, (G) Pseudotime trajectory, (H) Marker gene expression. (I–L) T cells: (I) UMAP by group, (J) State classification, (K) Pseudotime trajectory, (L) Marker gene expression. |
Hepatocytes: Distinct spatial distribution was observed between healthy and NAFLD hepatocytes (Figure 8E). Three hepatocyte subpopulations were identified (Figure 8F). The trajectory depicted a transition from healthy to pathological states (Figure 8G). Core genes showed state-specific expression changes (Figure 8H).
T cells: Distribution differences were noted between healthy and NAFLD T cells (Figure 8I). Multiple T cell states were identified (Figure 8J). The trajectory revealed T cell evolution (Figure 8K). MYH11, HYOU1, and SCD were notably upregulated in activated states (Figure 8L).
Cell-Cell Communication Analysis
The circle plot showed extensive interactions, particularly involving Macrophages, Monocytes, and T cells (Figure 9A). Heatmaps indicated that T cells and Macrophages had strong outgoing and incoming signaling for immune-related pathways (eg., CCL, MIF, VISFATIN). Hepatocytes showed strong outgoing signals for MIF, SPP1 and incoming signals for MK, PTN (Figure 9B). River plots showed specific signal pattern distributions across cell types (Figure 9C and D). The MIF signaling pathway involved extensive communication from Hepatocytes to immune cells (Figure 9E and F). The MK pathway showed signaling from Endothelial cells, Stellate cells, and Hepatocytes to Hepatocytes (Figure 9G and H).
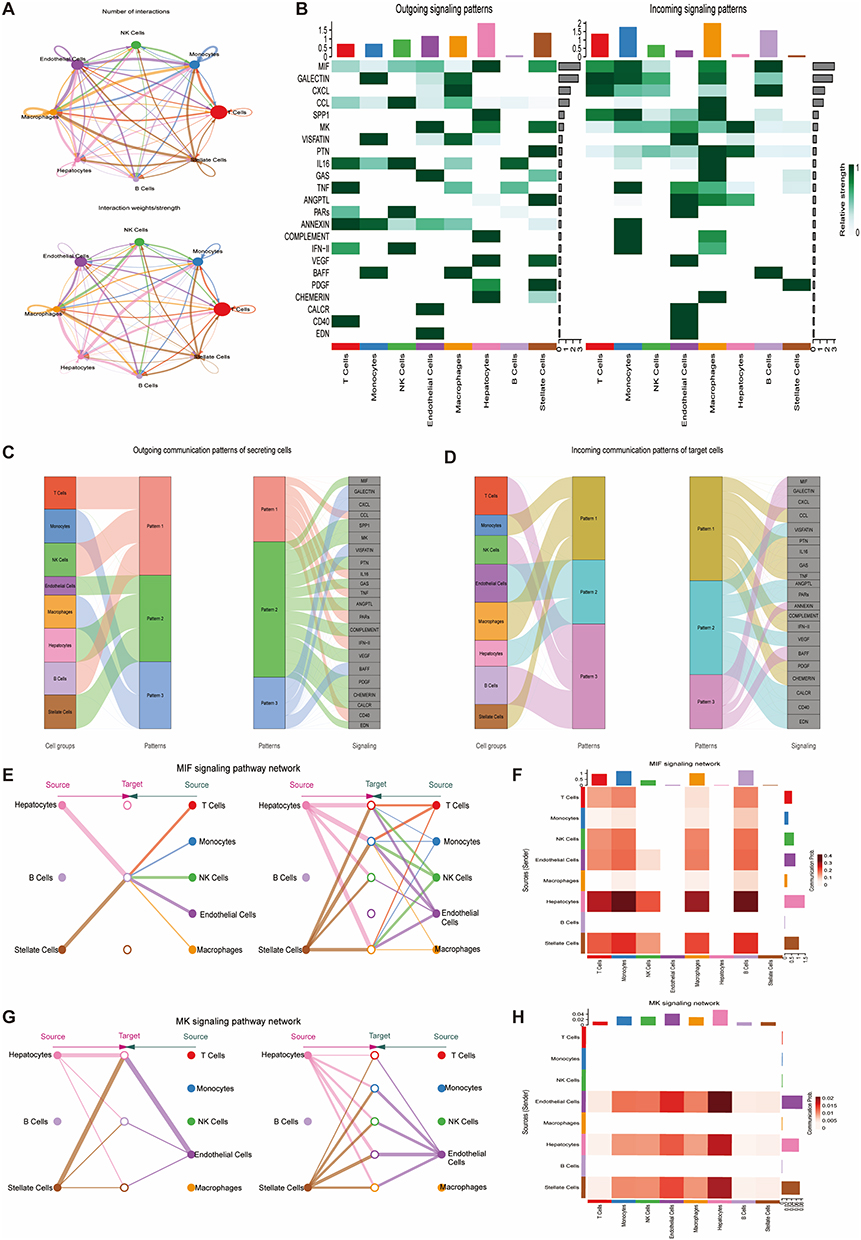 |
Figure 9 Cell-cell communication. (A) Circle plots showing number (top) and strength (bottom) of interactions. (B) Heatmaps of outgoing (left) and incoming (right) signal patterns per cell type. (C and D) River plots for outgoing (C) and incoming (D) signals. (E and F) MIF signaling: chord diagram (E) and heatmap of ligand-receptor pair strengths (F). (G and H) MK signaling: chord diagram (G) and heatmap of ligand-receptor pair strengths (H). |
Reverse Network Pharmacology and Molecular Docking
Drug enrichment analysis constructed a network linking 14 significant herbs, 3 active components, and 2 core targets (IGF1, SCD). Twelve herbs acted on IGF1 via baicalein, Niuhuang acted on IGF1 and SCD via Deoxycholic Acid, and Bajiaolian acted on SCD via deoxypodophyllotoxin (Figure 10A). Molecular docking showed strong binding potential: IGF1-Baicalein (Vina score: −6.1), IGF1-Deoxycholic Acid (−6.4), SCD-Deoxycholic Acid (−7.3), SCD-Deoxypodophyllotoxin (−7.3) (Figure 10B–E).
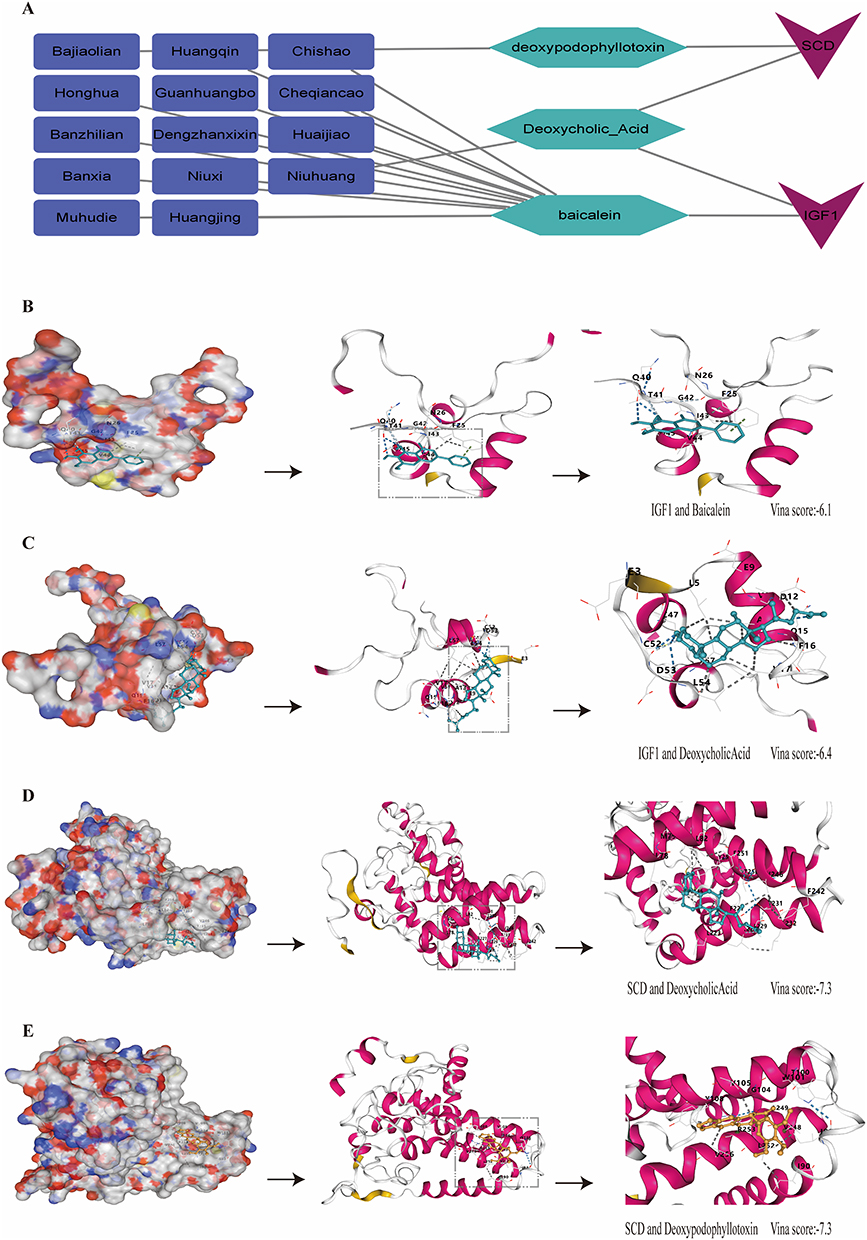 |
Figure 10 (A) Network of herb-component-target interactions. (B–E) Molecular docking results for (B) IGF1 and Baicalein, (C) IGF1 and Deoxycholic Acid, (D) SCD and Deoxycholic Acid, (E) SCD and Deoxypodophyllotoxin. |
Experimental Validation
At the transcriptional level, quantitative real-time polymerase chain reaction (qRT-PCR) analysis (Figure 10B) validated the significant dysregulation of the identified core genes. Consistent with our bioinformatic predictions, IGF1, MYH11, and HYOU1 expression was markedly downregulated, whereas SPATA18 and SCD were upregulated in the FFA-induced NAFLD cell model compared with control groups (P < 0.05 for all comparisons; Figure 11A). These changes were further validated at the protein level through Western Blot analysis, which revealed consistent expression patterns of the core proteins (Figure 11B). The Western Blot bands confirmed that the protein expression levels exhibited concordant trends with the mRNA expression profiles observed in qRT-PCR (Figure 11A), thereby providing robust evidence for the translational regulation of the identified core genes. Oil Red O staining (Figure 11C) revealed that, compared to the control group, cells treated with FFA exhibited significant red staining, indicating intracellular lipid accumulation. JC-1 staining showed high red/green fluorescence ratio (high membrane potential, low mitophagy) in control cells, an increased green fluorescence (decreased membrane potential, increased mitophagy) in some NAFLD cells, and predominant green fluorescence (low membrane potential, high mitophagy) in the CCCP positive control (Figure 11D).
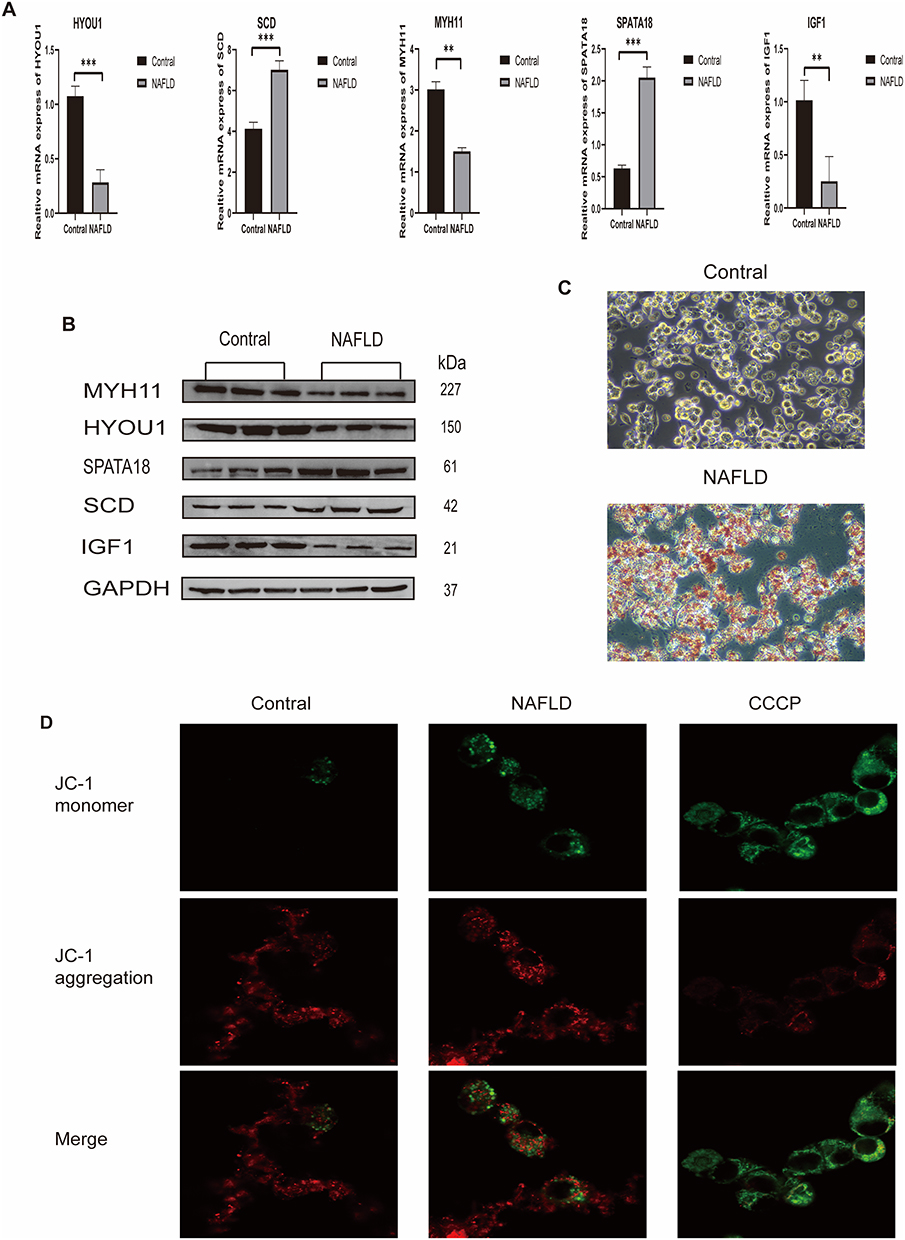 |
Figure 11 Experimental validation. (A) qRT-PCR results for core gene mRNA expression (**P < 0.01, ***P < 0.001). (B) Western Blot bands for core proteins. (C) Oil Red O staining of control and NAFLD model HepG2 cells. (D) JC-1 fluorescence staining (red: aggregates, high potential; green: monomers, low potential). |
Discussion
NAFLD is a chronic liver disease closely associated with metabolic disorders. Its global prevalence is continuously rising, making it a significant public health challenge. The disease spectrum progresses from simple hepatic steatosis to non-alcoholic steatohepatitis (NASH), liver fibrosis, and even cirrhosis and hepatocellular carcinoma, posing a serious threat to human health. Although dysregulated lipid metabolism, oxidative stress, and inflammatory responses are considered key links in the pathogenesis of NAFLD, a systematic analysis of its molecular mechanisms is insufficient, and the regulatory role of mitophagy in the pathological process has not been fully elucidated. This study aims to provide new perspectives for investigating disease mechanisms and developing targeted intervention strategies by integrating multi-omics data, applying machine learning algorithms, and reverse network pharmacology to systematically screen for mitophagy-related core genes in NAFLD.
Through bioinformatic analysis of multiple GEO cohorts, we first identified 230 genes significantly differentially expressed between healthy and NAFLD groups. Further combined with Weighted Gene Co-expression Network Analysis (WGCNA), we screened a gene module significantly associated with disease status, which overlapped with the mitophagy gene set, yielding 17 overlapping genes. Building on this, we employed a comprehensive strategy involving 11 machine learning algorithms for feature selection and ultimately identified five core genes: IGF1, MYH11, HYOU1, SPATA18, and SCD. These genes demonstrated excellent disease discrimination performance across multiple validation cohorts (maximum AUC reaching 0.974). Functional enrichment analysis revealed that these genes were significantly enriched in key biological processes such as the PI3K-Akt signaling pathway, endoplasmic reticulum stress response, mitophagy, and lipid metabolism, suggesting their potential involvement in the pathogenesis of NAFLD by coordinating metabolic homeostasis and cellular quality control mechanisms.
IGF1 is a polypeptide hormone produced primarily by the liver in response to growth hormone (GH) stimulation. It is widely expressed throughout the body and is a core member of the insulin-like growth factor system, exerting potent mitogenic, anti-apoptotic, and metabolic regulatory effects by activating its receptor IGF1R (structurally similar to the insulin receptor).9 Numerous clinical and basic studies10 have shown that circulating and local hepatic IGF1 levels are significantly reduced in NAFLD patients, and the degree of reduction is negatively correlated with the severity of NAFLD, consistent with our finding of significant downregulation of IGF1 in the NAFLD group. The decrease in IGF1 not only aggravates insulin resistance but also promotes impaired fatty acid β-oxidation, leading to lipid droplet accumulation in hepatocytes, forming the molecular basis for NAFLD development.11 Furthermore, the availability of dietary carbohydrate-to-protein calorie ratio affects hepatic fat deposition through the IGF-1/PI3K/Akt signaling pathway.12 Excessive accumulation of free fatty acids, sphingolipids, and lipid peroxidation (lipotoxicity) leads to hepatocyte injury, resulting in the production of damage-associated molecular patterns (DAMPs), which activate hepatic sinusoidal endothelial cells and resident macrophages (Kupffer cells) to promote inflammation and attract immune cells. Additionally, DAMPs and inflammatory cytokines activate hepatic stellate cells (HSCs), leading to remodeling of the local extracellular matrix and deposition of excess collagen and other proteins, causing fibrosis. IGF1, by activating the PI3K-Akt-mTOR signaling pathway, is an important sensor of cellular energy and nutrient status.13 It is well known that mTOR is a key negative regulator of autophagy, including mitophagy.14 Under nutrient-sufficient conditions, the active IGF1-Akt-mTOR pathway suppresses autophagy to facilitate anabolism. However, in the NAFLD state, decreased IGF1 levels may lead to aberrant mTOR activity, which disrupts normal metabolic homeostasis and affects the baseline level of mitophagy.15 Furthermore, IGF-1 prevents the accumulation of autophagic vesicles and increased cell death, as well as promotes the fusion and degradation rates of autophagosomes to lysosomes, thereby contributing to cell survival.16 IGF1 deficiency leads to insulin resistance and lipid overload, subjecting mitochondria to immense β-oxidation pressure and generating excessive ROS. ROS is a major inducer of mitochondrial damage, and mitochondrial damage is a key signal for initiating mitophagy.17 Therefore, IGF1 downregulation, excessive mitochondrial ROS production, and mitochondrial damage should theoretically trigger mitophagy. However, under persistent metabolic stress, this compensatory mitophagy may be insufficient or dysfunctional, failing to effectively clear damaged mitochondria, leading to the accumulation of “zombie” mitochondria, further amplifying oxidative stress and cellular injury, forming a vicious cycle.
MYH11 encodes smooth muscle myosin heavy chain, a core component of the contractile apparatus in vascular and smooth muscle cells.18 It is a marker gene for mature vascular smooth muscle cells (VSMCs), and its expression is crucial for maintaining vascular tension and structure.19 In the liver, MYH11 expression is primarily associated with the vascular system and activated hepatic stellate cells (HSCs).20 During NAFLD/NASH progression, pathological changes occur in the liver microvasculature, a process termed “sinusoidal capillarization”,21 where hepatic sinusoidal endothelial cells lose their fenestrae, form a basement membrane, and cells expressing smooth muscle markers appear. The downregulation of MYH11 may reflect dysfunction and abnormal remodeling of the liver vascular system, affecting hepatic blood supply and oxygenation, and exacerbating hepatocyte hypoxia and injury.22 It is noteworthy, however, that quiescent HSCs do not express MYH11. When the liver is injured, HSCs are activated and transform into myofibroblasts, acquire contractility, begin to express α-SMA (smooth muscle actin) and MYH11, and secrete large amounts of collagen, leading to liver fibrosis.23 Therefore, the detection of MYH11 downregulation in whole liver tissue might imply: 1) The detected signal primarily originates from hepatocytes or vascular cells, rather than activated HSCs; or 2) In late-stage disease, the activation state of HSCs might undergo further changes. The altered expression of MYH11 is more likely a downstream marker of NAFLD-associated vascular pathology and fibrotic progression. Mitophagy dysregulation occurs within hepatocytes as a result of metabolic injury; the downregulation of MYH11 indicates a deteriorating liver microenvironment, indirectly reflecting the stress level endured by mitochondria.
HYOU1, also known as ORP150 or GRP170, is an important molecular chaperone in the endoplasmic reticulum (ER) lumen, belonging to the HSP70 family.24 It plays a key role in protein folding, assembly, and transport, and is strongly induced under stress conditions such as hypoxia and nutrient deprivation, serving as a core response protein for endoplasmic reticulum stress (ERS).25 Persistent ERS is a hallmark of NAFLD. Lipid overload (particularly saturated fatty acids) and oxidative stress disrupt ER homeostasis.26 During the initial stages of stress, HYOU1, as a protective protein, is typically upregulated to assist in the refolding of misfolded proteins, alleviating ERS, and maintaining cell survival.27 The observed downregulation of HYOU1 in the NAFLD group is a critical signal! It indicates that persistent and severe ERS has overwhelmed the cell’s adaptive response mechanisms, and the compensatory capacity of the chaperone system is exhausted. This exhaustion signifies that the unfolded protein response (UPR) shifts from a pro-survival mode to a pro-apoptotic mode, significantly increasing the risk of hepatocyte death.28 The ER and mitochondria are closely connected via mitochondria-associated ER membranes (MAMs). Persistent ERS leads to calcium ion (Ca2⁺) leakage from the ER. Excessive mitochondrial Ca2⁺ uptake causes membrane potential collapse and ROS bursts, severely damaging mitochondria.29 As a key chaperone protein in the MAM region, the downregulation of HYOU1 indicates severe ER insufficiency, unable to effectively manage protein folding and Ca2⁺ homeostasis.30 This exacerbates the mitochondrial damage initiated by ERS. The presence of numerous damaged mitochondria potently activates mitophagy pathways (eg., PINK1-Parkin) in an attempt to clear them.31 Therefore, HYOU1 downregulation does not inhibit autophagy but rather, by exacerbating mitochondrial damage, indirectly increases the burden and necessity of mitophagy. It is an early warning signal of cellular collapse.
SPATA18, also known as Mieap (Mitochondria-eating protein), is a core gene that directly executes mitophagy. Its encoded protein is recruited to the mitochondrial outer membrane in response to mitochondrial damage, promoting the recognition and engulfment of damaged mitochondria by lysosomes.32 In the NAFLD environment, due to factors such as lipotoxicity, ROS, and ERS (as indicated by HYOU1 downregulation), mitochondria suffer extensive damage.33 The upregulation of SPATA18 expression represents an active, compensatory cellular response. The cell attempts to enhance its mitophagic capacity to accelerate the clearance of these dysfunctional mitochondria, thereby maintaining mitochondrial network quality and cell survival. SPATA18/Mieap is a key effector protein in the p53-dependent mitophagy pathway, and its upregulation directly demonstrates the activation of the mitophagy pathway in the NAFLD liver.34 The expression level of SPATA18 can, in a sense, reflect the severity of mitochondrial damage within the cell. Its significant upregulation indicates that the mitochondrial quality control system is under tremendous pressure, engaged in a “clearance battle.”
SCD is a key enzyme in lipid metabolism that catalyzes the desaturation of saturated fatty acids (SFAs) (eg., palmitic acid, stearic acid) to generate monounsaturated fatty acids (MUFAs) (eg., palmitoleic acid, oleic acid). This is a necessary step for the synthesis of triglycerides (TGs), phospholipids, and cholesteryl esters.35 Saturated fatty acids (SFAs) possess strong lipotoxicity and can induce hepatocyte death by activating mitochondrial death pathways and increasing ER stress.36 SCD, by converting SFAs to MUFAs, reduces the cellular lipotoxicity level,37 representing a self-protective mechanism. However, MUFAs are the preferred substrates for triglyceride (TG) synthesis.38 Excessively high SCD activity provides ample raw materials for TG synthesis, conversely promoting lipid accumulation within hepatocytes, ie., exacerbating hepatic steatosis. Therefore, the upregulation of SCD is a “double-edged sword.” By reducing SFA accumulation, SCD upregulation alleviates mitochondrial damage caused by lipotoxicity. SFAs can directly damage mitochondrial membranes and function, whereas MUFAs are less toxic. From this perspective, SCD upregulation, by improving the lipid environment, indirectly reduces the trigger signals for mitophagy. However, the MUFAs produced by SCD can be incorporated into the phospholipids of the mitochondrial membrane itself, altering its fluidity, thereby affecting mitochondrial function (eg., electron transport chain efficiency) and the efficiency of membrane fusion events during mitophagy.39 The upregulation of SCD represents the cell’s effort to cope with lipotoxic stress. By converting harmful SFAs into relatively harmless MUFAs and storing them, it may temporarily alleviate the assault on mitochondria in the short term, but in the long run, it “adds fuel to the fire” of hepatocyte steatosis. Its relationship with mitophagy is one of indirect regulation, primarily achieved by altering the level of lipid stress experienced by the mitochondria.
This study employed an integrative multi-omics and machine learning approach to identify and validate five core genes—IGF1, MYH11, HYOU1, SPATA18, and SCD—intricately linked to mitophagy and NAFLD pathogenesis. Their expression patterns paint a coherent picture of the disease’s molecular landscape. Downregulation of IGF1, a key metabolic and anti-inflammatory hormone, sets the stage for insulin resistance and reduced antioxidant capacity, priming hepatocytes for lipid accumulation and oxidative stress. This metabolic dysregulation, particularly lipotoxicity from saturated fatty acids, induces endoplasmic reticulum stress. The observed downregulation of HYOU1, an ER chaperone, signals the exhaustion of the protective unfolded protein response, pushing cells towards apoptosis and exacerbating mitochondrial damage via ER-mitochondria coupling. This severe mitochondrial injury triggers a compensatory response, evidenced by the upregulation of SPATA18 (Mieap), a direct executor of mitophagy, in an attempt to clear dysfunctional organelles. Concurrently, the upregulation of SCD represents a double-edged sword; it mitigates direct lipotoxicity by converting SFAs to MUFAs but also fuels hepatic steatosis by providing substrates for triglyceride synthesis. Finally, the downregulation of MYH11, a smooth muscle marker, likely reflects pathological vascular remodeling (“sinusoidal capillarization”) and alterations in hepatic stellate cell phenotype, contributing to the progression of fibrosis and microenvironment disruption. This cascade ultimately creates a pro-inflammatory, pro-fibrotic milieu, as reflected in our immune infiltration and single-cell analyses.
Our data reveal a characteristic NAFLD immune signature: a state of chronic, low-grade inflammation and aberrant immune regulation. This is not a robust acute inflammatory response but rather a state of long-term chronic immune dysregulation. The elevated proportions of T cells and decreased proportions of Macrophages in the disease group suggest that the immune system is skewed towards a suppressive, tolerant, or chronic response pattern, which favors disease persistence rather than clearance.
IGF1 is not only a metabolic hormone but also a significant immunomodulatory factor.40 It promotes the proliferation, differentiation, and survival of various immune cells (T cells, B cells, macrophages).41 Importantly, IGF1 signaling possesses anti-inflammatory properties, inhibiting macrophage polarization towards the pro-inflammatory M1 phenotype and enhancing the function of regulatory T cells (Tregs). The deficiency of IGF1 disrupts this immune balance. The attenuation of its anti-inflammatory effect creates conditions conducive to M1 macrophage activation. Concurrently, its inability to adequately support healthy T cell responses may lead to inefficient immune reactions, aligning with the observed state of adaptive immunity in NAFLD.42 The IGF1 signaling pathway is well-characterized for its role in inhibiting macrophage polarization toward the pro-inflammatory M1 phenotype and enhancing the immunosuppressive functions of regulatory T cells.43 Consequently, downregulation of this pathway may directly attenuate the suppression of M1 polarization and impair immunoregulatory mechanisms, collectively fostering a pro-inflammatory microenvironment.
Although MYH11 itself is not an immune molecule, its downregulation, as a marker of vascular smooth muscle, indicates pathological remodeling of the liver’s vascular system (sinusoids), specifically “sinusoidal capillarization.” This alters the hepatic microcirculation, affecting the infiltration and trafficking of immune cells. Sinusoidal structural abnormalities can lead to hypoxia and accumulation of cellular debris; these “danger signals” can, in fact, recruit and activate pro-inflammatory M1 macrophages.44 Functional vasculature is essential for dendritic cell (DC) migration. Disordered vascular structure may impede DC activation and migration (manifested as reduced activated DCs), weakening antigen presentation and the initiation of adaptive immunity.45 Whole-organ transcriptome sequencing captures the average transcriptional profile across all constituent cells. The observed downregulation of MYH11 may suggest that vascular-derived signals—originating from portal or central venous smooth muscle cells—are diluted by transcriptional contributions from highly proliferating hepatocytes, immune cells, or steatotic hepatocytes. MYH11 expression may exhibit dynamic variation across different stages of fibrotic activation. The study cohort likely includes a substantial proportion of patients with early-stage steatosis, in which hepatic stellate cells (HSCs) may not yet be fully activated into the high-MYH11-expressing myofibroblast state.46 Alternatively, in advanced disease, persistent inflammatory milieus could lead to dysregulation of vascular smooth muscle cells and loss of characteristic markers.47 Activated HSCs (myofibroblasts) may undergo further differentiation into alternative states, contributing to the downregulation of MYH11. This pattern may reflect a phenotypic transition from a contractile (high MYH11) to a pro-inflammatory and pro-fibrotic (potentially low MYH11) state.48
HYOU1 is a guardian against endoplasmic reticulum stress (ERS). ERS is a potent immune modulator. Unresolved ERS can induce apoptosis and inflammatory responses through UPR signaling.49 Severe ERS can directly suppress T cell activation and function, even inducing T cell apoptosis,50 which explains the weakened effector T cell response.
SPATA18-mediated mitophagy is a process for clearing intracellular “debris.” However, when this process becomes overactivated, it can be associated with immunogenic cell death (ICD).51 ICD releases damage-associated molecular patterns (DAMPs), such as ATP and mitochondrial DNA, which can activate the innate immune system and recruit antigen-presenting cells. The increase in SPATA18 is a direct response to severe mitochondrial damage. It may indirectly contribute to the infiltration and activation of innate immune cells, such as the observed elevation in Monocytes and M2 macrophages, by promoting ICD and DAMP release. These cells are recruited to clear dead cell debris, but their persistent presence leads to chronic inflammation and fibrosis.52
SCD alters the lipid composition, and specific lipids are potent immune signaling molecules.53 SCD converts saturated fatty acids (SFAs) into monounsaturated fatty acids (MUFAs). SFAs (eg., palmitic acid) can activate the NLRP3 inflammasome and promote M1 polarization,54 whereas MUFAs are considered more likely to promote M2 polarization and are less inflammatory. SCD is a central executor of lipid-mediated immune regulation. Its upregulation directly shapes an anti-inflammatory/pro-fibrotic (M2-type) immune microenvironment by altering lipid metabolites, which is a core mechanism for NAFLD persistence. From a therapeutic perspective, these genes provide multiple targets: supplementing IGF1 or enhancing its signaling could simultaneously improve metabolic and immune status. Inhibiting SCD might disrupt pro-fibrotic M2 polarization, but caution is needed to avoid exacerbating lipotoxicity. Alleviating ERS could reduce cellular stress and the consequent inflammatory signaling. Briefly, the upregulation of SCD alters the lipid composition by elevating the proportion of monounsaturated fatty acids, exemplified by oleic acid.55 These lipid metabolites may serve as ligands for peroxisome proliferator-activated receptors (PPARs).56 Specifically, the PPAR-γ signaling pathway acts as a critical regulator driving macrophage polarization toward the anti-inflammatory M2 phenotype.57 This establishes a plausible mechanistic connection to the observed increase in M2 macrophages.
Traditional bioinformatics analyses often focus on single-factor exploration and struggle to integrate multi-dimensional omics data. Machine learning models, particularly multi-model ensemble and cross-validation techniques, can effectively enhance the accuracy of feature selection and model generalizability. This study, by combining 11 mainstream machine learning methods through a “feature selection + model fusion” pipeline, obtained a stable combination with excellent diagnostic performance. SHAP interpretability analysis not only revealed the contribution of individual core genes to the model but also intuitively demonstrated the mechanism by which multiple features synergistically influence disease discrimination. This approach breaks through the limitations of single biomarkers, enabling multi-level and multi-angle disease prediction, and provides a new tool for clinical risk stratification and individualized intervention.
The application of multiple machine learning algorithms provided a robust framework for feature selection, minimizing bias and identifying the most stable and informative gene signatures. The high AUC values across independent validation cohorts underscore the diagnostic potential of this gene panel. The SHAP analysis further enhanced the interpretability of the model, clearly delineating the individual contributions of each gene and revealing potential synergistic or antagonistic interactions, such as the inverse relationship between SPATA18 and SCD.
The single-cell and cell communication analyses provided unprecedented resolution, localizing core gene expression to specific cell types (eg., SPATA18 in hepatocytes, IGF1/SCD in macrophages) and revealing dynamic changes along cellular trajectories. This highlights the cell-type-specific roles of these genes and the complex intercellular crosstalk, such as hepatocyte-derived MIF signaling, that orchestrates the NAFLD microenvironment.
Finally, the reverse network pharmacology and molecular docking suggest promising repurposing opportunities for traditional medicine. The interactions of baicalein, deoxycholic acid, and deoxypodophyllotoxin with IGF1 and SCD support investigating them as potential therapies for identified pathways. Computational docking predicted favorable binding and affinity, indicating promise for drug development. However, these in silico projections require experimental validation via in vitro assays and functional analyses to confirm efficacy.
Limitations and Future Directions
This study is subject to several limitations. First, the in vitro validation was conducted using the HepG2 hepatoma cell line. Although HepG2 cells are widely employed in modeling NAFLD, they exhibit inherent metabolic disparities compared to primary human hepatocytes, which may affect the biological relevance and translational potential of the observed molecular alterations. Future investigations should utilize primary hepatocytes or more physiologically representative in vitro models, such as hepatocyte spheroids or co-culture systems, to reinforce these findings. Additionally, the reliance on publicly available databases introduces potential batch effects and population heterogeneity; thus, prospective validation utilizing multi-center cohorts is required. The correlations identified between core genes and immune infiltration are derived solely from transcriptomic data and necessitate confirmation at the protein level, complemented by functional assays. Moreover, the predicted drug–target interactions require experimental validation through both in vitro and in vivo studies. Although the machine learning models exhibited strong predictive accuracy, their generalizability must be assessed in larger and more diverse populations. Finally, the intricate mechanisms through which these core genes regulate mitophagy merit further detailed molecular investigation.
Future work should focus on: 1) Collecting large-scale, multi-omics clinical cohorts; 2) Integrating proteomic and metabolomic data for a systems-level understanding; 3) Employing spatial transcriptomics to resolve cellular interactions; 4) Conducting high-throughput drug screens and functional validation of predicted compounds; 5) Developing clinically applicable diagnostic tools based on the core gene panel; and 6) Elucidating the precise molecular mechanisms by which these core genes regulate mitophagy and immune cell function.
Conclusion
In conclusion, this multi-omics study identifies IGF1, MYH11, HYOU1, SPATA18, and SCD as central regulators linking mitophagy deficiency to the inflammatory immune microenvironment in NAFLD. Our work not only provides a novel diagnostic gene signature but also illuminates specific molecular pathways and candidate compounds that could be targeted to disrupt the vicious cycle of metabolic stress, inflammation, and fibrosis in NASH.
Data Sharing Statement
All data from this study is available from the corresponding authors upon reasonable request.
Ethical Approval
This study utilized previously generated and publicly available transcriptomic data from the Gene Expression Omnibus (GEO) database, and experiments involving the established commercial human hepatoma cell line (HepG2), which was procured from the Shanghai Cell Bank of the Chinese Academy of Sciences. No new human participants were recruited, and no primary human tissues or specimens were collected for this research. According to the Measures for Ethical Review of Life Science and Medical Research Involving Human Subjects (issued on February 18, 2023, China), this study qualifies for exemption from ethical review. Specifically, it falls under the following categories stated in Article 32:1.Research involving the use of legally obtained and publicly available data or information. 2.Research using anonymized human biospecimens or data collected from previous legal activities, where it is impossible to locate the subjects and their guardians, and the research does not cause serious harm or risk to the subjects. Therefore, this research did not require separate approval from an Institutional Review Board (IRB). The Institutional Review Board of Ruikang Hospital Affiliated to Guangxi University of Chinese Medicine has also confirmed the exemption status of this study.
Author Contributions
Yu Yuan (Y.Y.): Conceptualization, Methodology, Formal Analysis, Writing – Original Draft. Tianyu Zhang (T.Y.Z.): Conceptualization, Software, Data Curation, Writing – Original Draft. Chao Song (C.S.): Investigation, Visualization, Writing – Original Draft. Chunli Lin (C.L.L.): Methodology, Resources, Formal Analysis, Writing – Review & Editing. Yuewen Sun (Y.W.S.): Validation, Writing – Review & Editing, Data Interpretation. Hongzhen Tang (H.Z.T.): Conceptualization, Methodology, Supervision, Project Administration, Funding Acquisition, Writing – Review & Editing. All authors gave final approval of the version to be published; have agreed on the journal to which the article has been submitted; and agree to be accountable for all aspects of the work.
Funding
This study was supported by 1. Capacity Enhancement of Guangxi Zhuang and Yao Medicine Engineering Technology Research Center (Guangxi Science and Technology Department - ZY24212016); 2. Research and Promotion of Acupuncture and Massage Techniques for Treating Obesity (Guangxi Administration of Traditional Chinese Medicine - GZSY2025035); 3. Sino-Western Medicine Collaborative Clinical Research Project (China National Center for the Development of Traditional Chinese Medicine - CXZH2025008).
Disclosure
The authors declare that they have no known competing financial interests or personal relationships that could have appeared to influence the work reported in this paper.
References
1. Tao G, Zhang G, Chen W. et al. Randomized, Placebo-Controlled Clinical Trial of Hydrogen/Oxygen Inhalation for Non-Alcoholic Fatty Liver Disease. J Cell Mol Med. 2022;26(14):4113–27. doi:10.1111/jcmm.17456
2. Lim Y, Jeong S, Hong M, Han HW. Non-Alcoholic Fatty Liver Disease, Atherosclerosis, and Cardiovascular Disease in Asia. Rev Cardiovasc Med. 2023;24(6):173. doi:10.31083/j.rcm2406173
3. Zhu L, Wang N, Guo G, Fan Z, Shi X, Ji X. Male Zooid Extracts of Antheraea Pernyi Ameliorates Non-Alcoholic Fatty Liver Disease and Intestinal Dysbacteriosis in Mice Induced by a High-Fat Diet. Front Cell Infect Microbiol. 2022;12:1059647. doi:10.3389/fcimb.2022.1059647
4. Mercurio G, Giacco A, Scopigno N, et al. Mitochondria at the Crossroads: linking the Mediterranean Diet to Metabolic Health and Non-Pharmacological Approaches to NAFLD. Nutrients. 2025;17(7):1214. doi:10.3390/nu17071214
5. D’Arcy MS. Mitophagy in Health and Disease. Molecular Mechanisms, Regulatory Pathways, and Therapeutic Implications. Apoptosis: Int. J. Program. Cell Death. 2024;29(9–10):1415–1428. doi:10.1007/s10495-024-01977-y
6. Cavaliere G, Catapano A, Trinchese G, et al. Crosstalk between Adipose Tissue and Hepatic Mitochondria in the Development of the Inflammation and Liver Injury during Ageing in High-Fat Diet Fed Rats. Int. J. Mol. Sci. 2023;24(3):2967. doi:10.3390/ijms24032967
7. Chou A-H, Lee H-C, Liao -C-C, Yu H-P, Liu F-C. ERK/NF-kB/COX-2 Signaling Pathway Plays a Key Role in Curcumin Protection against Acetaminophen-Induced Liver Injury. Life. 2023;13(11):2150. doi:10.3390/life13112150
8. Liu Y, Yang X, Gan J, Chen S, Xiao Z-X, Cao Y. CB-Dock2: improved Protein-Ligand Blind Docking by Integrating Cavity Detection, Docking and Homologous Template Fitting. Nucleic Acids Res. 2022;50(W1):W159–W164. doi:10.1093/nar/gkac394
9. Werner H. The IGF1 Signaling Pathway: from Basic Concepts to Therapeutic Opportunities. Int. J. Mol. Sci. 2023;24(19):14882. doi:10.3390/ijms241914882
10. Yu Y, Zhu G, Zhang Z, et al. Exercise Ameliorates Nonalcoholic Fatty Liver Disease by Reducing the IGFBP5 to IGF1 Ratio to Activate AMPK Pathway. Sci. Rep. 2025;15(1):23083. doi:10.1038/s41598-025-07857-y
11. Dichtel LE, Cordoba-Chacon J, Kineman RD. Growth Hormone and Insulin-Like Growth Factor 1 Regulation of Nonalcoholic Fatty Liver Disease. The Journal of Clinical Endocrinology & Metabolism. 2022;107(7):1812–1824. doi:10.1210/clinem/dgac088
12. Wang Z, Wang L, Hou Y, et al. Dietary Carbohydrate-to-Protein Caloric Ratio Availability Affects Hepatic Fat Deposition via the IGF-1/PI3K/Akt Signaling Pathway. Food Res. Int. 2025;219:117035. doi:10.1016/j.foodres.2025.117035
13. Glenny EM, Coleman MF, Giles ED, Wellberg EA, Hursting SD. Designing Relevant Preclinical Rodent Models for Studying Links between Nutrition, Obesity, Metabolism, and Cancer. Annu. Rev. Nutr. 2021;41(1):253–282. doi:10.1146/annurev-nutr-120420-032437
14. Chen T, Zheng L, Luo P, et al. Crosstalk between m6A Modification and Autophagy in Cancer. Cell Biosci. 2024;14(1):44. doi:10.1186/s13578-024-01225-5
15. Ortega MA, Fraile-Martinez O, De leon-oliva D, et al. Autophagy in Its (Proper) Context: molecular Basis, Biological Relevance, Pharmacological Modulation, and Lifestyle Medicine. Int. J. Biol. Sci. 2024;20(7):2532–2554. doi:10.7150/ijbs.95122
16. Liu Q, Guan J-Z, Sun Y, et al. Insulin-like Growth Factor 1 Receptor-Mediated Cell Survival in Hypoxia Depends on the Promotion of Autophagy via Suppression of the PI3K/Akt/mTOR Signaling Pathway. Mol. Med. Rep. 2017;15(4):2136–2142. doi:10.3892/mmr.2017.6265
17. Xiao S, Rao L, Yan C, et al. Aptamer Functionalized Liposomes Co-Loaded with Exenatide-4 and Coenzyme Q10 Ameliorate Type 2 Diabetes Mellitus by Improving Pancreatic β Cell Function. Int. J. Nanomed. 2025;20:3363–3378. doi:10.2147/IJN.S510240
18. Zhou Z, Hughes K, Saif N, et al. MYH11 Rare Variant Augments Aortic Growth and Induces Cardiac Hypertrophy and Heart Failure with Pressure Overload. PLOS Genet. 2025;21(7):e1011394. doi:10.1371/journal.pgen.1011394
19. Yu X, Li L, Cai B, et al. Single-Cell Analysis Reveals Alterations in Cellular Composition and Cell-Cell Communication Associated with Airway Inflammation and Remodeling in Asthma. Respir. Res. 2024;25(1):76. doi:10.1186/s12931-024-02706-4
20. Li Z, Zhang H, Li Q, et al. GepLiver: an Integrative Liver Expression Atlas Spanning Developmental Stages and Liver Disease Phases. Sci. Data. 2023;10(1):376. doi:10.1038/s41597-023-02257-1
21. Gheorghe Constantinescu EC, Ionescu M, Pirici D, et al. Correlation of Angiogenesis and Inflammation with Post-Operative Complications in Patients with Fatty Liver Disease Undergoing Liver Resection. Curr. Health Sci. J. 2021;47(4):529–538. doi:10.12865/CHSJ.47.04.08
22. Li L, Liao B, Cai H, et al. Quantitative Assessment of Inflammation and Evaluation of Spatial Heterogeneity for Non-Alcoholic Fatty Liver Disease in Mice Based on Iron-Adjustive T1. Quant. Imaging Med. Surg. 2024;14(1):219–230. doi:10.21037/qims-23-782
23. Wang Y, Huang Y, Guan F, et al. Hypoxia-Inducible Factor-1alpha and MAPK Co-Regulate Activation of Hepatic Stellate Cells upon Hypoxia Stimulation. PLoS One. 2013;8(9):e74051. doi:10.1371/journal.pone.0074051
24. Jayathirtha M, Jayaweera T, Whitham D, Petre BA, Neagu A-N, Darie CC. Two-Dimensional Polyacrylamide Gel Electrophoresis Coupled with Nanoliquid Chromatography-Tandem Mass Spectrometry-Based Identification of Differentially Expressed Proteins and Tumorigenic Pathways in the MCF7 Breast Cancer Cell Line Transfected for Jumping Translocation Breakpoint Protein Overexpression. Int. J. Mol. Sci. 2023;24(19):14714. doi:10.3390/ijms241914714
25. Otlu Ö, Erdem M, Kıran TR, et al. Oxygen Regulated Protein 150 Can Be Considered as a Severity Indicator in Obstructive Sleep Apnea. Sci. Rep. 2025;15(1):26107. doi:10.1038/s41598-025-99987-6
26. Kido H, Mizukoshi E, Yanagi M, et al. Abnormalities of Intracellular Organelles in Metabolic Dysfunction-Associated Steatotic Disease. J. Gastroenterol. 2025;60(8):990–999. doi:10.1007/s00535-025-02257-5
27. Li C-L, Yao Z-Y, Zhang Y-F, et al. Bisphenols Exposure and Non-Alcoholic Fatty Liver Disease: from Environmental Trigger to Molecular Pathogenesis. Front. Endocrinol. 2025;16:1606654. doi:10.3389/fendo.2025.1606654
28. Pratelli G, Di Liberto D, Carlisi D, et al. Hypertrophy and ER Stress Induced by Palmitate Are Counteracted by Mango Peel and Seed Extracts in 3T3-L1 Adipocytes. Int. J. Mol. Sci. 2023;24(6):5419. doi:10.3390/ijms24065419
29. Patel A, Simkulet M, Maity S, et al. The Mitochondrial Ca2+ Uniporter Channel Synergizes with Fluid Shear Stress to Induce Mitochondrial Ca2+ Oscillations. Sci. Rep. 2022;12(1):21161. doi:10.1038/s41598-022-25583-7
30. Deng K, Pei M, Li B, et al. Signal Pathways Involved in Contrast-Induced Acute Kidney Injury. Front. Physiol. 2024;15:1490725. doi:10.3389/fphys.2024.1490725
31. Yu X, Luo Y, Yang L, Chen P, Duan X. P‑hydroxybenzyl Alcohol Ameliorates Neuronal Cerebral Ischemia‑reperfusion Injury by Activating Mitochondrial Autophagy through SIRT1. Mol. Med. Rep. 2023;27(3):68. doi:10.3892/mmr.2023.12955
32. Tian Y, Babaylova ES, Gopanenko AV, et al. Changes in the Transcriptome Caused by Mutations in the Ribosomal Protein uS10 Associated with a Predisposition to Colorectal Cancer. Int. J. Mol. Sci. 2022;23(11):6174. doi:10.3390/ijms23116174
33. Al Jadani JM, Albadr NA, Alshammari GM, Almasri SA, Alfayez FF, Yahya MA. Esculeogenin a, a Glycan from Tomato, Alleviates Nonalcoholic Fatty Liver Disease in Rats through Hypolipidemic, Antioxidant, and Anti-Inflammatory Effects. Nutrients. 2023;15(22):4755. doi:10.3390/nu15224755
34. Miyamoto T, Kitamura N, Ono M, et al. Identification of 14-3-3γ as a Mieap-Interacting Protein and Its Role in Mitochondrial Quality Control. Sci. Rep. 2012;2(1):379. doi:10.1038/srep00379
35. Shi B, Zhang Z, Lv X, An K, Li L, Xia Z. Screening of Genes Related to Fat Deposition of Pekin Ducks Based on Transcriptome Analysis. Anim.: Open Access J. MDPI. 2024;14:268. doi:10.3390/ani14020268
36. Yin K, Wang D, Zhang Y, Lu H, Wang Y, Xing M. Dose-Effect of Polystyrene Microplastics on Digestive Toxicity in Chickens (Gallus Gallus): multi-Omics Reveals Critical Role of Gut-Liver Axis. J. Adv. Res. 2023;52:3–18. doi:10.1016/j.jare.2022.10.015
37. Balatskyi VV, Dobrzyn P. Role of Stearoyl-CoA Desaturase 1 in Cardiovascular Physiology. Int. J. Mol. Sci. 2023;24(6):5531. doi:10.3390/ijms24065531
38. Jeyakumar SM, Vajreswari A. Stearoyl-CoA Desaturase 1: a Potential Target for Non-Alcoholic Fatty Liver Disease?-Perspective on Emerging Experimental Evidence. World J. Hepatol. 2022;14(1):168–179. doi:10.4254/wjh.v14.i1.168
39. Paradies G, Petrosillo G, Paradies V, Ruggiero FM. Role of Cardiolipin Peroxidation and Ca2+ in Mitochondrial Dysfunction and Disease. Cell Calcium. 2009;45(6):643–650. doi:10.1016/j.ceca.2009.03.012
40. Kiernan K, Alwarawrah Y, Nichols AG, Danzaki K, MacIver NJ. Insulin and IGF-1 Have Both Overlapping and Distinct Effects on CD4+ T Cell Mitochondria, Metabolism, and Function. Sci. Rep. 2024;14(1):4331. doi:10.1038/s41598-024-54836-w
41. Smith TJ. Insulin-like Growth Factor-I Regulation of Immune Function: a Potential Therapeutic Target in Autoimmune Diseases? Pharmacol. Rev. 2010;62(2):199–236. doi:10.1124/pr.109.002469
42. Sutti S, Albano E. Adaptive Immunity: an Emerging Player in the Progression of NAFLD. Nat. Rev. Gastroenterol. Hepatol. 2020;17(2):81–92. doi:10.1038/s41575-019-0210-2
43. Nandakumar AM, Barberis A, Kim J, et al. IGF-1 Regulates Cancer Cell Immune Evasion in Prostate Cancer. Sci. Rep. 2025;15(1):38422. doi:10.1038/s41598-025-22288-5
44. Salybekov AA, Hassanpour M, Kobayashi S, Asahara T. Therapeutic Application of Regeneration-Associated Cells: a Novel Source of Regenerative Medicine. Stem Cell Res. Ther. 2023;14(1):191. doi:10.1186/s13287-023-03428-y
45. Barranco-Fragoso B, Pal SC, Díaz-Orozco LE, Dorantes-Heredia R, Qi X, Méndez-Sánchez N. Identification of Hepatic Dendritic Cells in Liver Biopsies in Patients with Metabolic Dysfunction-Associated Fatty Liver Diseas (MAFLD) and Obesity. Med. Sci. Monit.: Int. Med. J. Exp. Clin. Res. 2022;28:
46. Nakhaei-Rad S, Pudewell S, Mirzaiebadizi A, et al. From Quiescence to Activation: the Reciprocal Regulation of Ras and Rho Signaling in Hepatic Stellate Cells. Cells. 2025;14(9):674. doi:10.3390/cells14090674
47. Tanaka H, Xu B, Xuan H, et al. Recombinant Interleukin-19 Suppresses the Formation and Progression of Experimental Abdominal Aortic Aneurysms. J. Am. Heart Assoc. 2021;10(17):e022207. doi:10.1161/JAHA.121.022207
48. Bachmann JC, Baumgart SJ, Uryga AK, et al. Fibrotic Signaling in Cardiac Fibroblasts and Vascular Smooth Muscle Cells: the Dual Roles of Fibrosis in HFpEF and CAD. Cells. 2022;11(10):1657. doi:10.3390/cells11101657
49. Shenderov K, Riteau N, Yip R, et al. Cutting Edge: endoplasmic Reticulum Stress Licenses Macrophages to Produce Mature IL-1β in Response to TLR4 Stimulation through a Caspase-8- and TRIF-Dependent Pathway. J Immunol. 2014;192(5):2029–2033. doi:10.4049/jimmunol.1302549
50. Wang L, Yang S, Zhu G, et al. Immunopeptidome Mining Reveals a Novel ERS-Induced Target in T1D. Cell. Mol. Immunol. 2024;21(6):604–619. doi:10.1038/s41423-024-01150-0
51. Zhang S, Huang Y, Pi S, et al. Autophagy-Amplifying Nanoparticles Evoke Immunogenic Cell Death Combined with Anti-PD-1/PD-L1 for Residual Tumors Immunotherapy after RFA. J. Nanobiotechnol. 2023;21(1):360. doi:10.1186/s12951-023-02067-y
52. Muñoz-Durango N, Arrese M, Hernández A, Jara E, Kalergis AM, Cabrera D. A Mineralocorticoid Receptor Deficiency in Myeloid Cells Reduces Liver Steatosis by Impairing Activation of CD8+ T Cells in a Nonalcoholic Steatohepatitis Mouse Model. Front. Immunol. 2020;11:563434. doi:10.3389/fimmu.2020.563434
53. Sinton MC, Kajimura S. From Fat Storage to Immune Hubs: the Emerging Role of Adipocytes in Coordinating the Immune Response to Infection. FEBS J. 2025;292(8):1868–1883. doi:10.1111/febs.17302
54. Liu Q, Gu X, Liu X, et al. Long-Chain Fatty Acids - the Turning Point between “mild” and “Severe” Acute Pancreatitis. Heliyon. 2024;10(11):e31296. doi:10.1016/j.heliyon.2024.e31296
55. Kovács D, Camera E, Póliska S, et al. Linoleic Acid Induced Changes in SZ95 Sebocytes-Comparison with Palmitic Acid and Arachidonic Acid. Nutrients. 2023;15(15):3315. doi:10.3390/nu15153315
56. Schmitt LO, Blanco A, Lima SV, et al. Palmitate Compromises C6 Astrocytic Cell Viability and Mitochondrial Function. Metabolites. 2024;14(3):161. doi:10.3390/metabo14030161
57. Jiang X, Shen C, Li X, Xia X, Xu S, Zhang H. Electroacupuncture Posttreatment Attenuates the Inflammatory Injury in Rats after MIRI through PPARγ/NF-Κb Pathway. Front. Cardiovasc. Med. 2025;12:1562285. doi:10.3389/fcvm.2025.1562285
 © 2026 The Author(s). This work is published and licensed by Dove Medical Press Limited. The
full terms of this license are available at https://www.dovepress.com/terms
and incorporate the Creative Commons Attribution
- Non Commercial (unported, 4.0) License.
By accessing the work you hereby accept the Terms. Non-commercial uses of the work are permitted
without any further permission from Dove Medical Press Limited, provided the work is properly
attributed. For permission for commercial use of this work, please see paragraphs 4.2 and 5 of our Terms.
© 2026 The Author(s). This work is published and licensed by Dove Medical Press Limited. The
full terms of this license are available at https://www.dovepress.com/terms
and incorporate the Creative Commons Attribution
- Non Commercial (unported, 4.0) License.
By accessing the work you hereby accept the Terms. Non-commercial uses of the work are permitted
without any further permission from Dove Medical Press Limited, provided the work is properly
attributed. For permission for commercial use of this work, please see paragraphs 4.2 and 5 of our Terms.
Recommended articles
Identification of Critical Biomarkers and Mechanisms of Fructus Ligustri Lucidi on Vitiligo Using Integrated Bioinformatics Analysis

Liang TS, Tang N, Xian MH, Wen WL, Huang CJ, Cai LH, Li QL, Wu YH
Clinical, Cosmetic and Investigational Dermatology 2023, 16:2061-2071
Published Date: 7 August 2023
Integration of RNA-Seq and Machine Learning Identifies Hub Genes for Empagliflozin Benefitable Heart Failure with Reduced Ejection Fraction
Yang Q, Gao J, Wang TY, Ding JC, Hu PF
Journal of Inflammation Research 2023, 16:4733-4749
Published Date: 18 October 2023
Identifying and Validating GSTM5 as an Immunogenic Gene in Diabetic Foot Ulcer Using Bioinformatics and Machine Learning
Shi H, Yuan X, Liu G, Fan W
Journal of Inflammation Research 2023, 16:6241-6256
Published Date: 20 December 2023
Integrated Analysis of Ferroptosis and Immune Infiltration in Ulcerative Colitis Based on Bioinformatics
Cai D, Hu W, Cai Y, Fang T, Chen X
Journal of Inflammation Research 2025, 18:3535-3549
Published Date: 10 March 2025
Exploring the Toxicological Effects of Acetyl Tributyl Citrate Exposure on Osteoarthritis Based on Machine Learning, Network Toxicology and Molecular Docking Analysis
Zhu Y, Deng L, Xia J, Yang J, Zhao D, Li M
Open Access Rheumatology: Research and Reviews 2026, 18:560636
Published Date: 2 February 2026