Back to Journals » Journal of Inflammation Research » Volume 16
Integrated Analysis of Non-Coding RNA and mRNA Expression Profiles in Exosomes from Lung Tissue with Sepsis-Induced Acute Lung Injury
Authors Deng W ![]() , Lu Y, Hu P, Zhang Q, Li S, Yang D, Zhao N, Qian K, Liu F
, Lu Y, Hu P, Zhang Q, Li S, Yang D, Zhao N, Qian K, Liu F
Received 1 May 2023
Accepted for publication 19 August 2023
Published 1 September 2023 Volume 2023:16 Pages 3879—3895
DOI https://doi.org/10.2147/JIR.S419491
Checked for plagiarism Yes
Review by Single anonymous peer review
Peer reviewer comments 2
Editor who approved publication: Professor Ning Quan
Wei Deng,1,2 Yanhua Lu,1,2 Ping Hu,1,2 Qingqing Zhang,1,2 Shuangyan Li,1,2 Dong Yang,1,2 Ning Zhao,1,2 Kejian Qian,1,2 Fen Liu1,2
1Department of Critical Medicine, The First Affiliated Hospital of Nanchang University, Nanchang, People’s Republic of China; 2Medical Innovation Center, First Affiliated Hospital of Nanchang University, Nanchang, People’s Republic of China
Correspondence: Fen Liu, Email [email protected]
Background: Acute lung injury (ALI) is associated with a high mortality rate; however, the underlying molecular mechanisms are poorly understood. The purpose of this study was to investigate the expression profile and related networks of long noncoding RNAs (lncRNAs), microRNAs (miRNAs), and mRNAs in lung tissue exosomes obtained from sepsis-induced ALI.
Methods: A mouse model of sepsis was established using the cecal ligation and puncture method. RNA sequencing was performed using lung tissue exosomes obtained from mice in the sham and CLP groups. Hematoxylin-eosin staining, Western blotting, immunofluorescence, quantitative real-time polymerase chain reaction, and nanoparticle tracking analysis were performed to identify relevant phenotypes, and bioinformatic algorithms were used to evaluate competitive endogenous RNA (ceRNA) networks.
Results: Thirty lncRNA-miRNA-mRNA interactions were identified, including two upregulated lncRNAs, 30 upregulated miRNAs, and two downregulated miRNAs. Based on the expression levels of differentially expressed mRNAs(DEmRNAs), differentially expressed LncRNAs(DELncRNAs), and differentially expressed miRNAs(DEmiRNAs), 30 ceRNA networks were constructed.
Conclusion: Our study revealed, for the first time, the expression profiles of lncRNA, miRNA, and mRNA in exosomes isolated from the lungs of mice with sepsis-induced ALI, and the exosome co-expression network and ceRNA network related to ALI in sepsis.
Keywords: sepsis, acute lung injury, inflammation, lung tissue exosomes, ceRNA networks
Introduction
Acute lung injury (ALI) is a devastating condition with a high morbidity rate among critically ill patients.1 Although there have been significant advances in the treatment of ALI in recent years, it remains a life-threatening disease with a high mortality rate (30–45%).2–4 Histologically, ALI is characterized by acute pulmonary inflammation, which severely impairs lung function.5 Evidence suggests that overactivation of inflammatory cells, such as macrophage, may lead to adverse pulmonary inflammation, and subsequently, to ALI.6,7 Macrophages are important effector cells for host defense against foreign stimuli and are important in the pathogenesis of pulmonary inflammation and ALI.8,9 Once activated, M1 macrophages release inflammatory cytokines and regulate the influx of leukocyte chemokines.10
Noncoding RNA in exosomes is involved in ALI related to systemic inflammation, and macrophages are receptor cells of exosomes.6,11 Exosomes are extracellular vesicles (EVs) with a diameter of 30–150 nm12 that transfer proteins, genetic material (including mRNA, microRNA [miRNA], and long noncoding RNA [lncRNA]) to target cells, and play key roles in cell-cell communication.13 Noncoding RNAs (ncRNAs) include miRNA, lncRNA, and circular RNA, and are key regulators of gene expression.14 The theory of competing endogenous RNA (ceRNA) suggests that RNAs can regulate each other through competing miRNA-response elements.15,16 For example, lncRNANLRP3 combines with miR-138-5p to promote inflammation triggered by NLR family pyrin domain containing 3 (NLRP3) through the lncRNA-NLRP3/miR-138-5p/NLRP3-ceRNA network, thereby contributing to ALI.17 Thus, lncRNA-miRNA-mRNA ceRNA pairs are constructed. Different lncRNA-miRNA-mRNA ceRNA interactions can evolve a ceRNA regulatory network to regulate disease pathogenesis, including ALI, cancer, and cardiovascular disease.18–20 The ceRNA network has emerged as a valuable tool in the investigation of disease pathogenesis and identification of therapeutic targets. Although previous studies have successfully identified the lncRNA-miRNA-mRNA ceRNA network within cellular contexts,21–23 there is a scarcity of research focusing on the ceRNA network within tissue-derived extracellular vesicles (EVs). Particularly, the involvement of the lncRNA-miRNA-mRNA ceRNA network in acute lung injury (ALI) associated with systemic inflammation in lung EVs remains largely unexplored.
In this study, we employed RNA sequencing to comprehensively analyze the expression profiles of lncRNA, miRNA, and mRNA within exosomes derived from lung tissue subjected to sepsis-induced injury. Through our analysis, we successfully identified a potential central gene and novel ceRNA regulatory network specific to exosome-mediated processes during sepsis-induced lung injury. These findings hold significant promise in the identification of potential prognostic biomarkers and prospective therapeutic targets for this condition.
Materials and Methods
Mice
C57BL/6J mice (male, 6–8-weeks old) were purchased from Zhejiang Weitong Lihua Experimental Animal Co. Ltd. (Zhejiang, China). Mice were housed under conditions of constant temperature (23–24°C), humidity (55 ± 5%), and light (12 h light-dark cycle). All protocols involving animals were approved by the Animal Ethics Committee of the First Affiliated Hospital of Nanchang University and were performed performed adherence to the principles and procedures of the National Institutes of Health (NIH) Guide for the Care and Use of Laboratory Animals and the Guidelines for Chinese Regulation for the Use and Care of Laboratory Animals Computer-generated random numbers were used for random grouping.
Mouse Model of Cecal Ligation and Puncture (CLP)-Induced ALI
A CLP model of sepsis was established to induce ALI, as previously described.24 Briefly, mice were anesthetized with 0.3% pentobarbital sodium (30 mg/kg) (Rui Tai, China), the abdomen was shaved and disinfected with hair cream and povidone iodine, and a 1.0–2.0-cm midline incision was made under the diaphragm to expose the cecum. After 50% ligation (moderate CLP), the cecum was punctured twice with an 18-gauge needle (Jiangxi Sanxin Medical Technology Co., LTD., China) and gently pressed to release a small amount of fecal material. The cecum was then ligated and returned to the abdomen, and the muscle and skin incisions were closed using a 4–0 silk thread (Jiangxi Sanxin Medical Technology Co., LTD., China). Animals in the sham operation group were subjected to the same treatment as those in the control group, but without the CLP procedure. After operation, the mice were resuscitated by subcutaneous injection of 1 mL preheated (37°C) phosphate-buffered saline. Lung tissues were collected 24 h after CLP for further analysis.
Lung Histological Analysis
Lung tissues were excised and fixed for 24 h in formalin for subsequent histological analyses. Tissues were then embedded in paraffin, sliced to a thickness of 4 μm, and stained with hematoxylin and eosin.
Myeloperoxidase (MPO) Evaluation
MPO activity was determined to evaluate the infiltration of inflammatory cells into the lung tissues. Lung tissue were homogenized in reaction buffer (1/9 w/v), and MPO activity was analyzed using a commercial MPO test kit (WuHan Elabscience Biotechnology Co., Ltd, China), in accordance with the manufacturer’s instructions.
RNA Extraction and qPCR Analysis
Total RNA was extracted using the TRIzol reagent (Invitrogen, USA). Reverse transcription PCR was performed in a 20 μL reaction system according to the manufacturer’s instructions. First, qPCR was conducted using the SYBR Green Master Mix on a StepOne Plus Real-Time PCR System (Applied Biosystems, USA). The relative expression levels of miRNAs or mRNAs were normalized using the 2–ΔΔCt comparative method, with U6 small nuclear RNA (snRNA) or GAPDH as the reference. The primer details can be found in Supplementary Table S1.
Immunofluorescence Staining
The cells or excised tissues were fixed in formalin, permeabilized in 0.1% Triton X-100, and blocked with 10% BSA. Samples were incubated with primary antibodies overnight at 4°C, followed by incubation at 25°C for 1 h with fluorescently labeled secondary antibodies. Nuclei were visualized by staining for 10 min with DAPI. Fluorescent microscopy (Leica, Wetzlar, Germany) was used to capture six images from each animal. The following antibodies were used: anti-CD68 (28058-1-AP, 1:100; Proteintech), anti-iNOS (18985-1-AP, 1:100; Proteintech), and anti-Arg-1(16001-1-AP, 1:100; Proteintech).
Separation of EVs from Lung Tissue
To isolate exosomes, lung tissue from animals in the CLP and sham groups were gently separated into small pieces (~2 × 2×2 mm) and preserved at −80°C, as described previously15 with minor modifications.25 The mixture was dissociated using the Miltenyi human tumor dissociation kit (Miltenyi Biotec, cat. no. 130–095-929). Resuspension enzymes H, R, and A were used according to the manufacturer’s instructions. A mixture containing 2.2 mL of RPMI, 100 μL of enzyme H, 50 μL of enzyme R and 12.5 μL of enzyme A was prepared immediately before use. Next, approximately 200 mg of tissue was sliced briefly on dry ice and then incubated in the dissociation mixture at 37°C for 10–15 min. The separated tissue was passed through a 70 μM filter twice to remove residual tissue. After 10 min of spinning at 4°C, 300× g of the suspension was spun for 10 min and then transferred to a fresh tube and spun for 10 min at 4°C and 2000 × g. Cell-free supernatant was slowly passed through a 0.22 μm filter to remove cell debris and then centrifuged at 10,000 × g for 30 min at 4°C (Optima XPN-100, 5 mL Beckman ultra-clear tube). The collected suspension was then passed 150,000× g at 4°C × G ultracentrifugation (UC) for 2 h. The pellet was resuspended in 1 mL PBS, and Exosupur was used for purification by column chromatography (Echobiotech, China). Fractions were concentrated to 200 μL by 100 kDa molecular weight cut-off Amicon® Ultra spin filters (Merck, Germany).
Nanoparticle Tracking Analysis (NTA)
ZetaView PMX 110 (Particle Metrix, Meerbusch, Germany) equipped with a 405 nm laser was used to determine the size and quantity of particles in vesicle suspensions. Particle movement was analyzed via NTA software (ZetaView 8.02.28) using a video of 60s with 30 fps.
Transmission Electron Microscopy (TEM)
The exosome solution was placed on a copper mesh and incubated for 1 min at ambient temperature. Next, exosomes were washed in sterile distilled water and contrasted with uranyl acetate solution for 1 min. The sample was then dried under incandescent light for 2 min. Transmission electron microscopy (TEM; H-7650, Hitachi Ltd., Tokyo, Japan) was used to visualize and photograph the copper mesh.
Western Blot Analysis
The exosome supernatant was set at 5 × denaturation in sodium dodecyl sulfonate (SDS) buffer, and Western blot analysis (10% SDS polyacrylamide gel electrophoresis; 50 µg protein/lane) was performed to assess the presence of exosomal markers using rabbit polyclonal antibodies against CD63 (sc-5275, Santa Cruz, CA, USA), CD9 (sc-13118, Santa Cruz, CA, USA), and TSG101 (sc-7964, Santa Cruz, CA, USA).
RNA Isolation, Library Preparation, and RNA Sequencing
Exosomes for RNA sequencing were obtained from sham and CLP groups. The miRNeasy Serum/Plasma Advanced Kit (Qiagen, cat. No. 217204) was used to extract and purify total RNA from lung tissue exosomes, following the manufacturer’s instructions. RNA concentration and purity were evaluated using the RNA Nano 6000 assay kit with the Agilent Bioanalyzer 2100 System (Agilent Technologies, CA, USA). The SMARTer Stranded total RNA-Seq Kit V2 (Takara Bio USA, Inc.) was used to construct a sequencing library with 4.5 ng RNA from each sample as the input material. The index codes were then added to the attribute sequences of each sample. For the small RNA libraries, the amount of total RNA in each sample was 3 ng, which was used as the input material to prepare RNA samples. The QIAseq miRNA library kit (Qiagen, Frederick, MD) was used to generate the sequencing library, and index codes were added to the attribute sequences of each sample. Reverse transcription primers with a unique molecular index were used to quantify miRNA expression during cDNA synthesis and PCR amplification. Finally, library quality was evaluated using the Agilent Bioanalyzer 2100 and qPCR. TruSeq PE Cluster Kitv3-cBot-HS (Illumina, San Diego, CA, USA) was used to cluster the index-coding samples on the acBot cluster generation system according to the manufacturer’s instructions. After cluster generation, the library preparations were sequenced on the Illumina NovaSeq 6000 platform, and paired-end reads were generated by EchoBiotech Co., Ltd. of the People’s Republic of China.
mRNA Analysis
Raw sequence data were processed using in-house Perl scripts. Clean data (clean reads) were obtained by removing reads containing adapters or poly-N, and low-quality reads from raw data. The Q20, Q30, GC content, and sequence duplication level of clean data were calculated. No contamination was found in the downstream analyses, and all data were clean and of high quality. TopHat2/Bowtie2 was used to align the clean paired-end reads with the reference genome GRCm38. Mapped reads were used to quantify gene expression levels and for differential expression analysis. The Fragments Per Kilobase of exon model per Million mapped fragments (FPKMs) of coding genes in each sample were calculated using Stringtie. The FPKM of each gene was computed by adding the FPKMs from each group of transcripts. FPKM refers to fragments per kilobase of exons per million fragments mapped based on fragment length and read count mapped to these fragments. EdgeR was used to analyze the differential expression between the two groups, with a cut-off of P<0.05, and |log2FC| ≥ 0.584.26
miRNA Analysis
Bowtie software was used to align the Clean Reads with the Silva, GtRNAdb, Rfam, and Repbase databases. Repeats and ncRNAs, such as ribosomal RNA (rRNA), transfer RNA (tRNA), small nuclear RNA (snRNA), and small nucleolar RNA (snoRNA), were filtered. Using the remaining reads, the miRNAs were detected and predicted by comparing them with known miRNAs derived from miRbase and Genome (ftp://ftp.ensembl.org/pub/release-101/fasta/mus_musculus/dna), respectively. The expression matrix of the quantitative unique molecular index count of miRNA was normalized to transcript per million and calculated as relative logarithmic expression using the EdgeR package.
LncRNA Analysis
Identification of lncRNA
The transcriptome was assembled using Stringtie and scriptures, based on reads mapped to the reference genome. Cuffcompare from the Cufflinks package was used to annotate the assembled transcripts. Unknown transcripts were screened to identify the putative lncRNAs. Four computational approaches were combined to separate putative protein-coding RNAs in transcripts, including CPC, CNCI, CPAT, and Pfam. Minimum exon number and length thresholds were used to eliminate potential protein-coding RNAs. LncRNA candidates exceeding 200 nucleotides in length and having more than two exons were selected and screened using CPC/CNCI/CPAT/Pfam, a tool used to distinguish protein-coding from non-coding genes. Cuffcompare was used to select lncRNAs, including lncRNAs, intronic lncRNAs, and antisense lncRNAs.
Quantification and Differential Expression Analysis of lncRNA
The FPKM for each sample was calculated using Stringtie. Gene FPKM was calculated by summing the FPKM values across transcription groups. When computing FPKM, both the fragment length and number of reads mapped to the fragment should be considered, which determines how many fragments of an exon can be mapped per million fragments. EdgeR was used to analyze the differential expression between the two groups, with a cut-off of P < 0.05, and |log2FC| ≥ 0.584.
GO and KEGG Pathway Enrichment Analysis
The top GO R software package enabled Gene Ontology (GO) enrichment analysis of differentially expressed mRNA target genes. The Kyoto Encyclopedia of Genes and Genomes (KEGG) database can support our understanding of how biological systems function at a high level.27 Large-scale molecular datasets are generated from molecular-level information, especially genome sequencing and other high-throughput experimental technologies, such as cells, organisms, and ecosystems (http://www.genome.jp/kegg/). In this study, KOBAS software was used to determine whether differentially expressed genes (DEGs) were statistically enriched within KEGG pathways.28
Gene Set Enrichment Analysis (GSEA)
GSEA was used to study differences in biological processes between groups based on the gene expression profiles. GSEA is used to determine whether there is a statistical difference between two biological states for a specific gene set. It is often used to estimate changes in pathways and biological processes in datasets.
GSEA was conducted using the clusterProfiler R package, which belongs to the third-party data package and integrates GO and KEGG enrichment analyses. Simultaneously, this package integrates gene ID transformation and visualization of enrichment results, such as bubble charts and histograms. The Enrichplot and ggplot2 R packages selected the top five to generate images. The threshold for statistical significance was calculated by considering the absolute value of the normalized enrichment score (NES) >1 and the nominal P-value <0.05.
Analysis of Weighted Gene Co-Expression Networks (WGCNA)
For WGCNA, abnormal samples were deleted to ensure reliable network construction. First, a soft threshold was selected to construct the network. The adjacency matrix was set as continuous from 0 to 1, so the constructed network conforms to a power-law distribution and is therefore closer to the actual biological network. A scale-free network was constructed using block modules, followed by module partition analysis to identify co-expression modules, which could be used to group genes with similar expression patterns. A dynamic tree-cutting algorithm was used to determine the modules by cutting the clustering tree into branches and assigning colors to them. Gene expression levels associated with all modules were summarized using module eigengenes (ME). Module characteristic genes are the most important components of each module and are calculated as synthetic genes representing the expression profile of all genes in a given module.
Protein-Protein Interaction (PPI) Network Construction and Analysis
A PPI network with an interaction score >0.4 was constructed using the Search Tool for the Retrieval of Interacting Genes/Proteins (STRING) database (https://string-db.org/, v11.5). The PPI network was visualized using Cytoscape v3.9.1. Next, we analyzed the network using Cytoscape software and selected hub genes using cytoHubba.
Analysis of the miRNA-mRNA-lncRNA Regulatory Network
First, miRanda and RNA hybrid were used to predict the miRNA target gene, and the results predicted by the two software programs were selected as miRNA-mRNA pairs. Then, miRanda and RNAhybrid were used to predict the targeting relationship of miRNA-lncRNA, and the result predicted by the two software programs simultaneously was selected as the miRNA-lncRNA relationship pair. Second, to identify candidate genes and co expression pairs of lncRNAs, Pearson’s correlation coefficient was calculated based on the normalization intensity between all differentially expressed lncRNAs and mRNA. Genes with a Pearson’s correlation coefficient value of 0.9 and a P value <0.01, were selected as the trans target genes for lncRNA. Third, based on the positional relationship between lncRNA and mRNA, adjacent genes within 100 kb of lncRNA were selected as the target genes. Finally, based on the above results, a co-expression network was constructed and a ceRNA network map was generated using Cytoscape software (V3.9.1).
Cell Culture
The mouse RAW264.7 macrophages were obtained from National Collection of Authenticated Cell Cultures. The cell culture medium was supplemented with 10% Fetal Bovine Serum in DMEM (Invitrogen, Carlsbad, CA, USA). In a humidified atmosphere at 5% CO2, 37°C, and kept in a humidified atmosphere with penicillin (50 U/mL) and streptomycin (50 μg/mL).
Statistical Analysis
All values were expressed as means ± standard error of the mean (SEM). Statistical analysis was performed using a two-tailed Student’s t-test to compare two groups, and one-way ANOVA followed by Dunnett’s multiple comparison test for comparing three groups. A p-value < 0.05 was considered statistically significant for all analyses.
Results
Activated Macrophages in Lung Tissue from ALI Mice
Hematoxylin-eosin staining was performed to confirm the successful development of sepsis-induced ALI in mice. Compared with the sham group, lung tissue collected from mice in the CLP group presented marked pathological changes, including interstitial edema, alveolar congestion, and inflammatory cell infiltration (Figure 1A). MPO is an indicator of inflammatory cell aggregation, and the MPO results confirmed the severity of pulmonary inflammation (Figure 1B). In addition, expression of the proinflammatory cytokines interleukin (IL)-6 and tumor necrosis factor alpha (TNF-α) was observed after the induction of ALI, as shown by qPCR (Figure 1B). Macrophages are important effector cells for host defense against external stimuli, and their activation promotes lung inflammation in ALI. Therefore, we measured the expression of the macrophage marker CD68 and found a significant increase in the number of macrophages following CLP (Figure 1C and Figure S1). The macrophage phenotype was analyzed based on the expression of inducible nitric oxide synthase (iNOS) (M1) and Arg1 (M2). Based on immunofluorescence, the fluorescence intensity of proinflammatory M1 macrophages increased slightly in the CLP group, while that of the anti-inflammatory M2 macrophages decreased (Figure 1D, Figures S2 and S3).
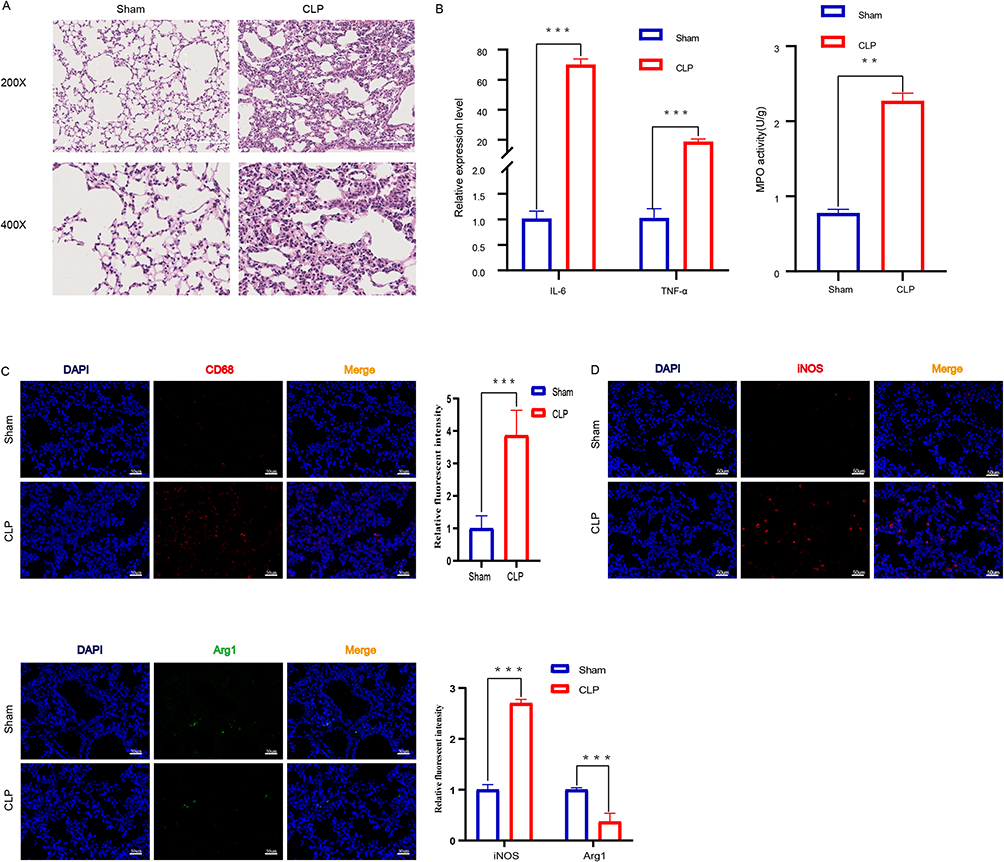 |
Figure 1 Macrophages Were Activated in the Lung Tissues of ALI Mice. (A) Histopathological analysis of lung tissues. After CLP modeling for 24 hours, H&E staining was used to evaluate the degree of lung inflammation in mice (n=6 per group), The images taken at 200X magnification correspond to a scale of 100 μm, while the images captured at 400X magnification correspond to a scale of 50 μm. (B) The pro-inflammatory cytokines IL-6 and TNF-α were detected by qPCR (n = 6 per group).The infiltration of inflammatory cells in lung tissue was measured by MPO activity (n=6 per group),**p<0.01, ***p<0.001. (C) After sectioning, the number of macrophages in lung tissue was detected by anti-CD68 antibody staining (n=6 per group). Intensity of immunofluorescence in lung tissues of CD68. (D)Intensity of immunofluorescence in lung tissues of M1 macrophages, (n =6 per group). iNOS (M1, green). Intensity of immunofluorescence in lung tissues of M2 macrophages, (n =6 per group). Arg1 (M2, red). |
Isolation and Characterization of Lung EVs
The typical morphology of EVs obtained from the sham and CLP groups was determined using TEM (Figure 2A). NTA was performed using a ZetaView nanoparticle tracking analyzer. As shown in Figure 2B, the concentration of exosomes in the CLP group increased significantly, indicating that exosome secretion increased under inflammatory conditions but did not significantly regulate the size of EVs. As shown in Figure 2C, typical exosome markers, including CD9, CD63, and TSG101, were observed in the sham and CLP groups.
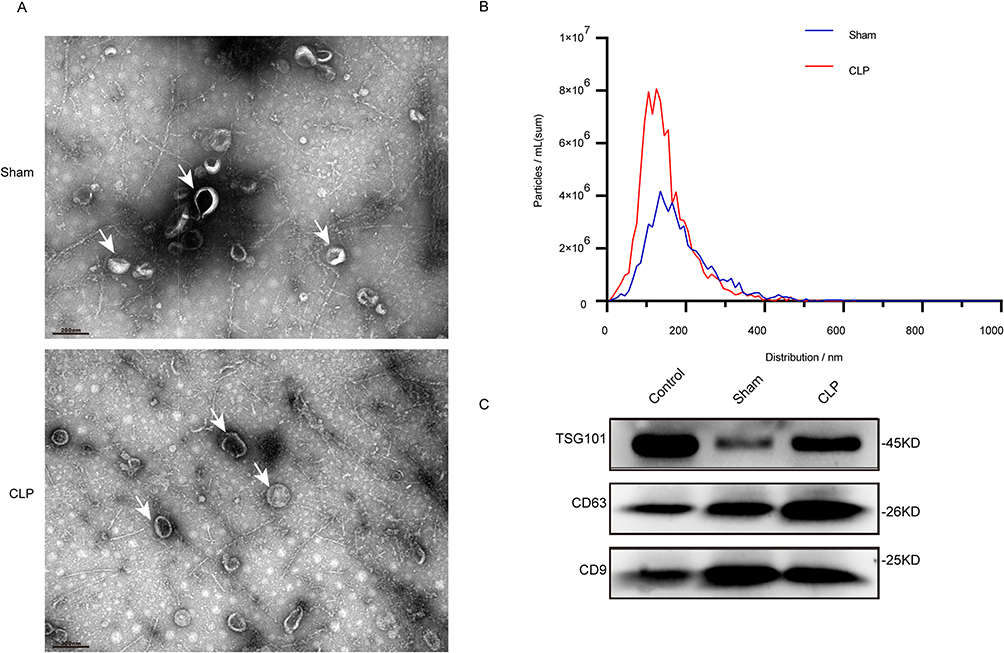 |
Figure 2 Isolation and identification of Lung Tissue exosomes. (A) Transmission electron micrographs of lung tissue exo-somes isolated from sham and ALI mice. Scale bar, 200 nm, The white arrows in (A) represent exosome particles. (B) NTA shows the concentration and size distribution of lung tissue exosomes isolated from the sham group and CLP mice (n=6 in each group). (C) Western blot analysis of the lung tissue exosomal markers TSG101, CD63 and CD9. |
Differential Expression of LncRNA, miRNA, and mRNA in Exosomes in the Sham and CLP Groups
With a cut-off fold change of ≥1.5, and a P value <0.05, a total of 569 DEmRNAs (446 upregulated, 123 downregulated), 44 DEmiRNAs (36 upregulated and eight downregulated), and 174 DELncRNAs (136 up and 38 downregulated) were identified between the sham and CLP groups. Heat maps and volcano plots were generated to present the distribution of the DELncRNAs (Figure 3A and D), DEmiRNAs (Figure 3B and E), and DEmRNAs (Figure 3C and F).
 |
Figure 3 Differentially expressed lung tissue exosomal lncRNAs, miRNAs and mRNAs in sepsis-induced acute lung Inflammation. (A–C) Heatmaps of lncRNA, miRNA and mRNA according to the value of |logFC|, in the Sham and CLP group. (D–F) Volcano maps of differentially expressed lung tissue exosomal lncRNAs, miRNAs and mRNAs (DEGs). Blue pixels indicate decreased gene levels in the indicated sample, whereas red pixels indicate increased abundance. S2, S3 and S4 are three biological duplicate samples of Sham group, and C1, C2 and C3 are three biological duplicate samples of CLP group. |
Functional Enrichment Analysis of Differentially Expressed mRNAs
GO and KEGG pathway enrichment analyses were performed through R software to investigate the different functions of specific DEGs. The main biological processes (BP) related to significant enrichment of all DEGs included lipopolysaccharide (LPS) response, inflammatory response, neutral chemotaxis, and chemokine-mediated signaling pathway (Figure 4A). The main cell components (CC) were related to the external side of the plasma membrane, extracellular space, Bcl3/NF−kappaB2 complex, and cells (Figure 4B). The main molecular functions (MF) were related to chemokine activity, CXCR3 chemokine receptor binding, cytotoxic receiver activity, and CCR2 chemokine receptor binding (Figure 4C). The top 20 KEGG pathways that were significantly enriched included cytokine-cytokine receiver interaction, TNF signaling pathway, NOD-like receiver signaling pathway, and Janus tyrosine kinase (JAK)- signal transducer and activator of transcription (STAT) signaling pathway (P < 0.05) (Figure 4D). The GO and KEGG analyses revealed that the differentially expressed mRNAs were related to lung inflammation.
 |
Figure 4 Functional enrichment analysis of differentially expressed mRNAs. (A–C) The top 20 GO terms in the enrichment analysis of dysregulated mRNAs between Sham and CLP groups. (D) The top 20 KEGG pathways in the enrichment analysis of dysregulated mRNAs between Sham and CLP groups. An enrichment factor is calculated by dividing the number of differentially expressed genes by the total number of genes annotated in this pathway. Number of genes is represented by bubble scale, and P value is represented by bubble color depth. Abbreviations: GO, Gene ontology; KEGG, Kyoto Encyclopedia of Genes and Genomes. |
GSEA Enrichment of mRNAs in Sham and CLP Mice
To avoid unilateralism caused by the use of cross gene enrichment, GSEA was performed on all genes in the sham and CLP groups. GSEA was used for gene analysis and enrichment of BP, CC, MF, and KEGG for the top five upregulated genes as shown in Figure 5A–D. The chemokine-mediated signal pathway in BP, endothelial vessel, extracellular space, organizational membrane, cytokine activity in MF, and cytokine receptor interaction in KEGG were similar to those in DEGs analysis and were related to inflammation. The BP, CC, MF, and KEGG of the top five downregulated genes are shown in Figure 5E–H.
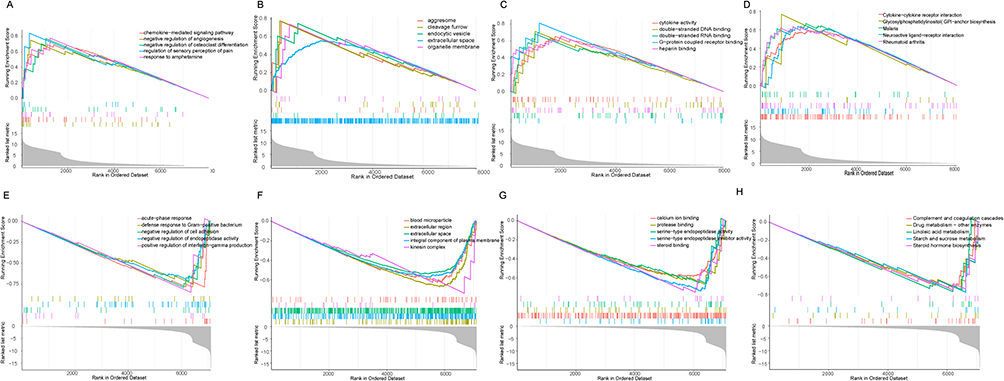 |
Figure 5 Functional enrichment analysis of mRNAs. (A–D) Between Sham group and CLP group, the first five up-regulated GO biological processes and the first five up-regulated KEGG pathway mRNAs enrichment.(E–H) Between Sham group and CLP group, the first five down-regulated GO biological processes and the first five down-regulated KEGG pathway mRNAs enrichment. Abbreviations: GO, Gene ontology; KEGG, Kyoto Encyclopedia of Genes. and Genomes. |
Wgcna
WGCNA was performed to identify potentially crucial mRNA modules. Overall, 9043 mRNA (1399 of which were newly predicted) were analyzed. The expression matrix was converted into an adjacency matrix and then into a topological matrix, and the similarity of expression patterns between genes was determined using topological overlap. DISTOM measures the degree of dissimilarity between genes in order to build a hierarchical clustering tree. Then, according to the standards of the hybrid dynamic cutting tree, the minimum number of genes in each gene network module was set to 30 to determine the gene module and calculate the characteristic gene value (ME) of each module. The parameters were as follows: MEDissThres=0.13, deepSplit=2, and minModuleSize=30, and 20 modules were obtained (Figure 6A). The Sham and CLP groups were subjected to cluster analysis of the gene expression profiles (Figure 6B). The average linkage hierarchical clustering method was used to cluster genes to analyze gene correlations (Figure 6C). At the same time, the correlation between gene module MEs and clinical characteristics, and P value, were determined to identify the module related to CLP lung injury. The module with a high correlation with CLP-induced ALI was pink (r=0.87, P=0.02) (Figure 6D). The significance of genes in the pink module and septicemia genes was cor=0.75, P<1e-200 (Figure 6E). Hub genes in the pink module were screened. The screening standard was | kME | ≥ 0.7. A total of 1420 Hub genes were screened, and relevant GO and KEGG enrichment analyses were conducted (Figure 7A–D), In BP, these mainly involved the positive regulation of cell migration and protein autophosphorylation. CC mainly involved extracellular exosomes and acute plasma membranes. In MF, these were mainly related to protein phosphate and ATP binding. KEGG was mainly related to the Notch and HIF-1 signaling pathways. The above factors are all related to inflammation.
 |
Figure 6 Construction and module analysis of weighted gene co-expression network analysis (WGCNA).(A) Based on topological overlap and assigned module colors, clustering dendrogram of dissimilar genes. (B) Cluster analysis based on gene expression profile. (C) Clustering of genes using the average linkage hierarchical clustering method. (D) A module-trait association consists of a single row for each eigengene and a single column for each trait. (E) Scatterplot of gene significance related to module membership in the pink co-expression modules. |
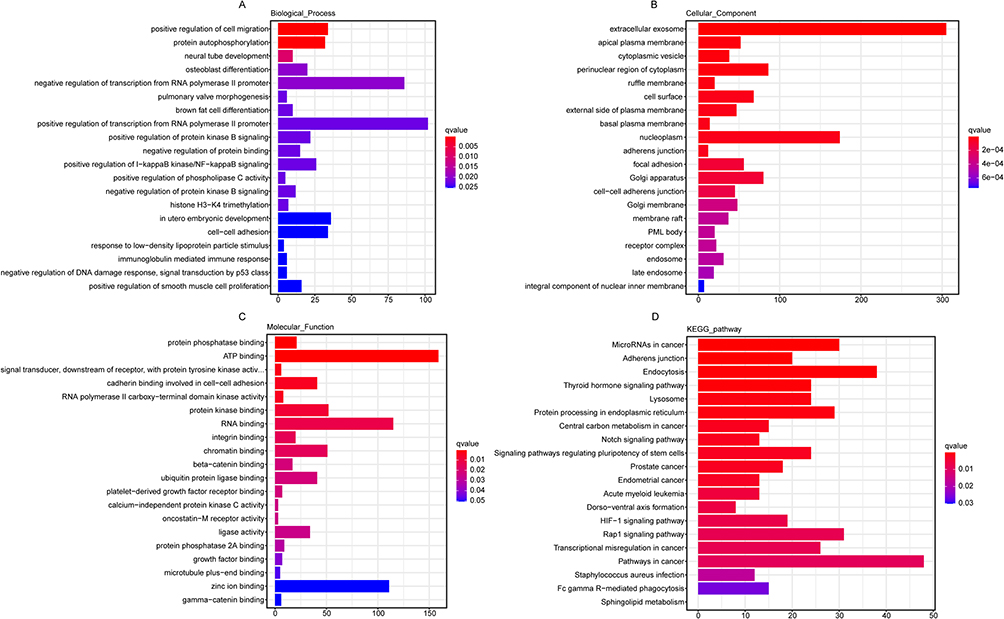 |
Figure 7 Functional enrichment analysis of differentially expressed Hub gene in the pink. (A–C) GO classification of differentially expressed genes in biological processes, cellular components and molecular functions. (D) The KEGG pathways in the enrichment analysis of differentially expressed Hub genes. Number of genes is represented by bubble scale, and P value is represented by bubble color depth. Abbreviations: GO, Gene ontology; KEGG, Kyoto Encyclopedia of Genes and Genomes. |
Network Visualization of Protein-Protein Interaction (PPI)
A total of 569 differentially expressed mRNAs were introduced into the STRING online tool to remove proteins that did not interact with other proteins to obtain the final protein interaction diagram (Figure 8A). A total of 317 nodes and 143 edges were selected to map the PPI network, which consisted of 297 up- and nine down-regulated genes, and 30 hub genes with ≥20 DEGs were screened (Table 1). Using the MCODE plug-in, the most important first three subnets were analyzed (Figure 8B–D). Subsequently, the Hub gene Jak3 was obtained from the intersection of 1420 hub genes screened by the pink module in WGCNA, 30 hub genes screened by PPI, and genes in ceRNA (Figure 8E).
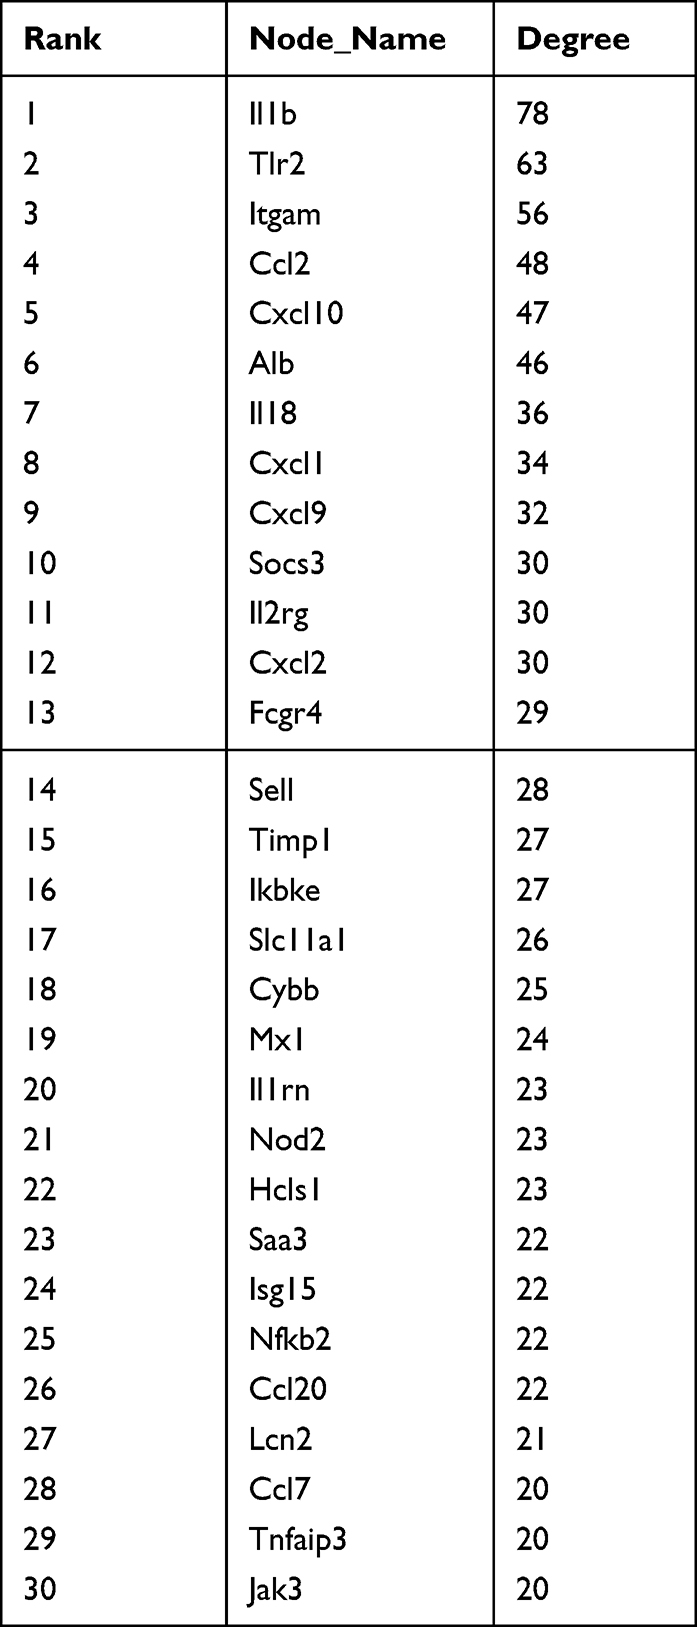 |
Table 1 The Hub Nodes in the Protein-Protein Interaction Network |
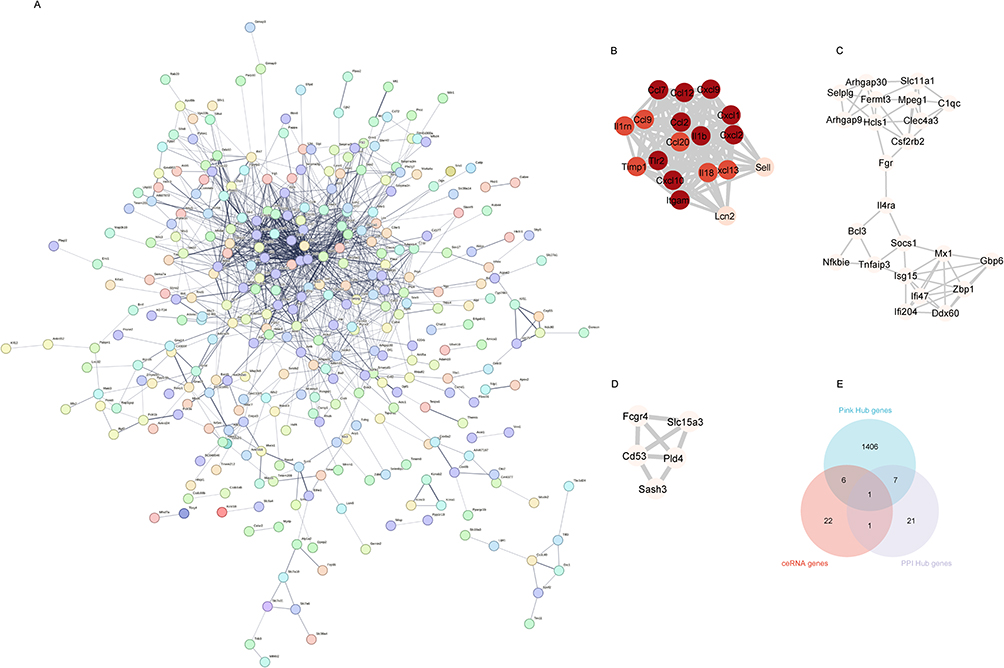 |
Figure 8 Protein-protein interaction (PPI) network of differentially expressed mRNAs (A), the PPI network consists of 317 nodes and 143 edges. (B–D) The top three clusters of PPIs. (E) The intersection gene of the pink module Hub gene, PPI Hub gene and ceRNA gene. Abbreviation: PPI, protein-protein interaction network. |
Network Construction of lncRNA-miRNA-mRNA Interaction
Based on the above data, the lncRNA-miRNA-mRNA ceRNA network was established and mapped using Cytoscape software (V3.9.1). In general, 30 lncRNA-miRNA-mRNA interactions (Figure 9A and B) included two upregulated lncRNAs, 30 upregulated miRNAs, and two downregulated miRNAs. Based on the expression levels of DEmRNAs, DELncRNAs, and DEmiRNAs, 30 ceRNA networks were constructed (Figure 9A and B). The expression of Gm4673, MSTRG.41696, mmu-miR-671-5p, mmu-miR-122-5p, Jak3 and Rab20, were detected randomly to test and verify the results of analysis (Figure 9C–E). At the same time, the extracted exosomes were co-incubated with macrophages for 24 hours, and the expression levels of inflammatory cytokines IL-6, TNF-a, iNOS and CD80 increased, while the expression levels of CD206 decreased (Figure 9F and G, Figure S4). Cellular immunofluorescence revealed a significant increase in the number of pulmonary macrophages in the CLP group, and the intensity of M1 macrophages was significantly higher than that of M2 macrophages(Figures S5–S7).Moreover, we performed qPCR analysis of the pri-mmu-miR-671-5p in macrophages (Figure S8) and found no difference in its expression level. We upregulated and downregulated Gm4673 in extracellular vesicles and observed the corresponding changes in mmu-miR-671-5p and Jak3 (Figure S9A and B). We also overexpressed and silenced mmu-miR-671-5p and observed the changes in Gm4673 and Jak3 (Figure S9C and D).
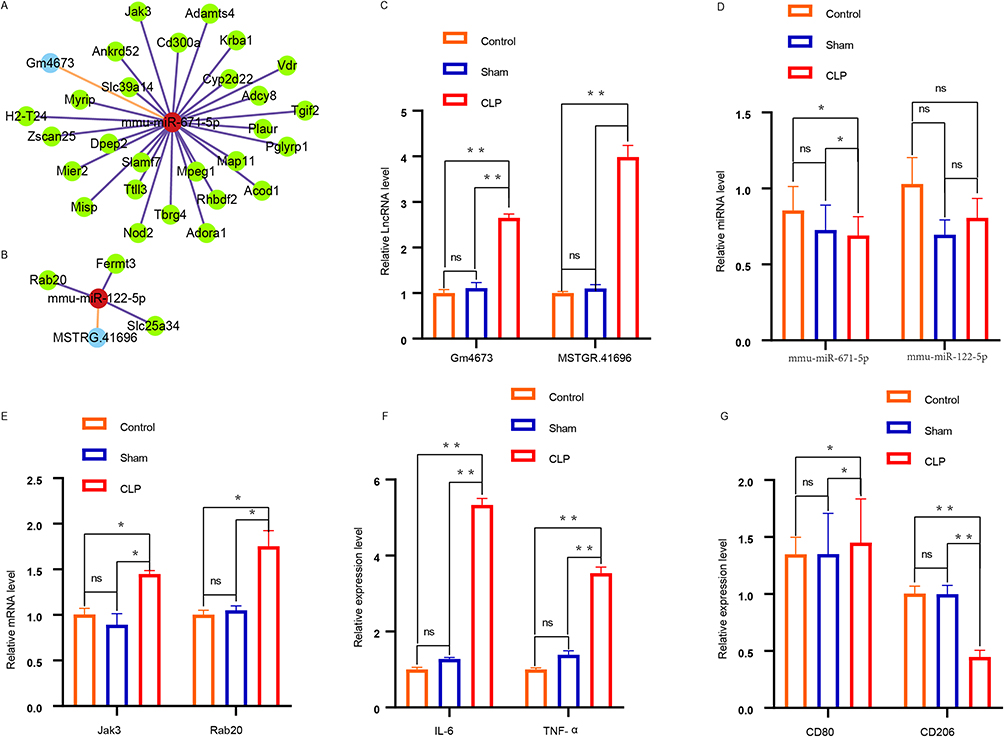 |
Figure 9 lncRNA- miRNA - mRNA ceRNA network. (A and B) lncRNA–miRNA–mRNA co-expression network. Light blue, red and green are representative of lncRNAs, miRNAs, and mRNAs, respectively. (C–E) Detection of LncRNA, miRNA, mRNA expression in ceRNA using qpcr. (F) The pro-inflammatory cytokines IL-6 and TNF-α were detected by qpcr. (G)The expression of CD206 and CD80 was measured using quantitative qpcr. *p<0.05,**p<0.01, ns p>0.05. |
Discussion
Tissue-isolated EVs provide comprehensive biological information because the cells they extract maintain the communication network in the tissue microenvironment.29 Owing to the complexity of tissues and organs, effective methods to isolate EVs from tissues are still lacking.30 Here, we established an effective method for enriching high-quality EVs from lung tissue. For the first time, we used RNA sequencing to determine lncRNAs, miRNAs, and mRNAs from lung tissue EVs obtained from mice with sepsis-induced ALI and identified 30 ceRNA networks. We comprehensively analyzed mouse lung EVs using a variety of methods, including hematoxylin-eosin, Western blotting, immunofluorescence, qPCR, TEM, and NTA. Some studies have shown that the ceRNA network may have a role in the treatment of ALI by regulating the inflammatory response via macrophages.31,32 The results of our study revealed that the ceRNA network participates in the pathophysiological process of ALI.
In this study, functional enrichment analysis revealed that differentially expressed mRNAs in the lungs of mice with sepsis-induced ALI were mainly related to the LPS response, inflammatory response, chemokine-mediated signaling pathway, and JAK-STAT signaling pathway. Studies have shown that LPS induces inflammation leading to lung injury, and alveolar macrophages have important roles in the occurrence and development of LPS-induced ALI.33,34 Furthermore, JAK-STAT signaling plays a key role in sepsis-induced ALI.35 JAK-STAT is activated following stimulation by a variety of inflammatory factors and therefore plays a role in signal transduction and transcriptional regulation, affecting M1 differentiation and inflammation.35–37 The results of this study were similar to those described above. To avoid unilateralism caused by the use of only differential gene enrichment, GSEA enrichment analysis was performed for the two groups of genes. Screening of the top five results revealed that CLP-induced ALI was mainly related to cytokine activity, chemokine-mediated signaling pathways, and cytokine-receptor interactions. Macrophages are the main cells that secrete proinflammatory cytokines during the early stage of ALI, and cytokines and their receptors play important roles in ALI.38–40 IL-6 is the most important factor involved in cytokine storms, and its secretion triggers a series of amplified inflammatory reactions.40 Several studies have shown that IL-6 binds to cell membrane receptors through the JAK-STAT pathway, activates Janus kinase, and phosphorylates downstream STAT3, thus initiating the transcription of STAT3 target genes.40,41 In addition, studies have reported that chemokine-mediated signal pathways play a key role in the pathogenesis of ALI.42–44 The above information supports our analysis of the biological information.
In our study, WGCNA was used to analyze 9043 mRNA gene modules, and the pink module was found be highly correlated with CLP-induced ALI. The hub gene of the pink module was subsequently analyzed for functional enrichment and was found to be related to extracellular exosomes, protein autophosphorylation, and the Notch pathway. Studies have shown that extracellular exosomes are closely related to M1-induced ALI,8 and protein autophosphorylation is related to LPS-induced inflammation.45 Moreover, abnormal Notch regulation is associated with various lung diseases.46,47 Activation of the Notch signaling pathway induces the activation of M1 macrophages to promote inflammation.48 Studies have shown that inhibiting the Notch signaling pathway can reduce the activation of M1 macrophages, thereby inhibiting the inflammatory response during sepsis.49
PPI analysis of differentially expressed mRNAs identified the three most important hub genes of the three subnetworks and 30 hub genes, including Cxcl1, Cxcl2, Nfkb2, and Jak3, suggesting that they may play important roles in the pathogenesis of sepsis-induced ALI.50–53 Finally, we screened the hub gene from the pink gene module, selected the top 30 hub genes from PPI, and found the Jak3 gene through gene intersection in the ceRNA network. We established a ceRNA network and found that the expression of genes, such as lncRNAGm4673, lncRNAMSTRG.41696, Jak3, Fermt3, was upregulated, while that of mmu-miR-122-5p and mmu-miR-671-5p was downregulated. Overexpression of mmu-miR-671-5p in the ceRNA network has been shown to inhibit the inflammatory mediators IL-1 β, TNFα, and IL-6,50,54 and mmu-miR-122-5p has been demonstrated to originate from the exosomes of lung tissue.55 Overexpression of mmu-miR-122-5p can induce severe lung injury, inflammation, and oxidative stress.55,56 Jak3 is a member of the JAK family of tyrosine kinases involved in cytokine receptor-mediated intracellular signal transduction. Inhibition of JAK3 leads to NF, and negative regulation of the B-signaling pathway can reduce the overproduction of cytokines/chemokines.57–59 In the verification of the results of bioinformatics, we found that Gm4673, mmu-miR-671-5p, and Jak3 may have a regulatory relationship, and the specific mechanism needs further proof from subsequent experiments. In this experiment, macrophages were co-cultured with tissue exosomes, and qpcr showed that the expression of inflammatory factors increased, as did the expression of M1-polarized CD80, which indirectly reflected that the ceRNA network in this experiment may regulate M1-polarized ALI. Of course, more evidence needs to be found in subsequent experiments.
Our study has certain limitations. First, the sample size was small, and the results of the WGCNA analysis were limited. Secondly, this study is based on bioinformatics prediction algorithms without deeper mechanistic studies, and inevitably has certain limitations and shortcomings, the limitation of the analysis of extracellular vesicles (rather than cellular RNA) would still limit the relevance of the findings. Finally, some competitive binding reactions between lncRNAs reported in this study have not been previously reported in sepsis, ALI, or other diseases; therefore, further verification of these is needed.
Conclusion
Our study revealed, for the first time, the expression profiles of lncRNA, miRNA, and mRNA in exosomes isolated from the lungs of mice with sepsis-induced ALI, and the exosome co-expression network and ceRNA network related to ALI in sepsis. We proposed a novel method for recognizing exocrine RNA biomarkers and ceRNA panels. Our research shows that exosomes from sepsis-induced ALI may play a role in the ALI microenvironment by transferring competitive endogenous RNAs, thereby promoting or inhibiting sepsis-induced ALI.
Data Sharing Statement
The original contributions presented in the study are included in the article and Supplementary Material. Further inquiries can be directed to the corresponding author.
Acknowledgments
This is a short text to acknowledge the contributions of specific colleagues, institutions, or agencies that aided the efforts of the authors.
Author Contributions
All authors made a significant contribution to the work reported, whether that is in the conception, study design, execution, acquisition of data, analysis and interpretation, or in all these areas; took part in drafting, revising or critically reviewing the article; gave final approval of the version to be published; have agreed on the journal to which the article has been submitted; and agree to be accountable for all aspects of the work.
Funding
This work was supported by the National Natural Science Foundation of China (82160363 and 81871548).
Disclosure
The authors declare that the research was conducted in the absence of any commercial or financial relationships that could be construed as a potential conflict of interest.
References
1. Sevransky JE, Martin GS, Shanholtz C, et al. Mortality in sepsis versus non-sepsis induced acute lung injury. Crit Care. 2009;13(5):R150. doi:10.1186/cc8048
2. Killien EY, Huijsmans RLN, Ticknor IL, et al. Acute respiratory distress syndrome following pediatric trauma: application of pediatric acute lung injury consensus conference criteria. Crit Care Med. 2020;48(1):e26–e33. doi:10.1097/CCM.0000000000004075
3. Fleischmann C, Scherag A, Adhikari NK, et al. International forum of acute care T: assessment of global incidence and mortality of hospital-treated sepsis. Current estimates and limitations. Am J Respir Crit Care Med. 2016;193(3):259–272. doi:10.1164/rccm.201504-0781OC
4. Singer M, Deutschman CS, Seymour CW, et al. The third international consensus definitions for sepsis and septic shock (Sepsis-3). JAMA. 2016;315(8):801–810. doi:10.1001/jama.2016.0287
5. Li Y, Cao Y, Xiao J, et al. Inhibitor of apoptosis-stimulating protein of p53 inhibits ferroptosis and alleviates intestinal ischemia/reperfusion-induced acute lung injury. Cell Death Differ. 2020;27(9):2635–2650. doi:10.1038/s41418-020-0528-x
6. Jiang K, Yang J, Guo S, Zhao G, Wu H, Deng G. Peripheral circulating exosome-mediated delivery of miR-155 as a novel mechanism for acute lung inflammation. Mol Ther. 2019;27(10):1758–1771. doi:10.1016/j.ymthe.2019.07.003
7. Hu Q, Lyon CJ, Fletcher JK, Tang W, Wan M, Hu TY. Extracellular vesicle activities regulating macrophage- and tissue-mediated injury and repair responses. Acta Pharm Sin B. 2021;11(6):1493–1512. doi:10.1016/j.apsb.2020.12.014
8. Zhang D, Lee H, Wang X, Groot M, Sharma L, Dela Cruz CS. Jin Y: a potential role of microvesicle-containing miR-223/142 in lung inflammation. Thorax. 2019;74(9):865–874. doi:10.1136/thoraxjnl-2018-212994
9. Wang S, Zhou H, Zheng L, et al. Global trends in research of macrophages associated with acute lung injury over past 10 years: a bibliometric analysis. Front Immunol. 2021;12:669539. doi:10.3389/fimmu.2021.669539
10. Wang L, Zhang H, Sun L, et al. Manipulation of macrophage polarization by peptide-coated gold nanoparticles and its protective effects on acute lung injury. J Nanobiotechnology. 2020;18(1):38. doi:10.1186/s12951-020-00593-7
11. Xiao K, He W, Guan W, et al. Mesenchymal stem cells reverse EMT process through blocking the activation of NF-kappaB and Hedgehog pathways in LPS-induced acute lung injury. Cell Death Dis. 2020;11(10):863. doi:10.1038/s41419-020-03034-3
12. Yang D, Zhang W, Zhang H, et al. Progress, opportunity, and perspective on exosome isolation - efforts for efficient exosome-based theranostics. Theranostics. 2020;10(8):3684–3707. doi:10.7150/thno.41580
13. Zhang Y, Bi J, Huang J, Tang Y, Du S, Li P. Exosome: a review of its classification, isolation techniques, storage, diagnostic and targeted therapy applications. Int J Nanomedicine. 2020;15:6917–6934. doi:10.2147/IJN.S264498
14. Fabbri M, Girnita L, Varani G, Calin GA. Decrypting noncoding RNA interactions, structures, and functional networks. Genome Res. 2019;29(9):1377–1388. doi:10.1101/gr.247239.118
15. Tang X, Ren H, Guo M, Qian J, Yang Y, Gu C. Review on circular RNAs and new insights into their roles in cancer. Comput Struct Biotechnol J. 2021;19:910–928. doi:10.1016/j.csbj.2021.01.018
16. Wu J, Huang H, Huang W, Wang L, Xia X, Fang X. Analysis of exosomal lncRNA, miRNA and mRNA expression profiles and ceRNA network construction in endometriosis. Epigenomics. 2020;12(14):1193–1213. doi:10.2217/epi-2020-0084
17. Luo D, Dai W, Feng X, et al. Suppression of lncRNA NLRP3 inhibits NLRP3-triggered inflammatory responses in early acute lung injury. Cell Death Dis. 2021;12(10):898. doi:10.1038/s41419-021-04180-y
18. Fowler AA, Truwit JD, Hite RD, et al. Effect of Vitamin C infusion on organ failure and biomarkers of inflammation and vascular injury in patients with sepsis and severe acute respiratory failure: the CITRIS-ALI randomized clinical trial. JAMA. 2019;322(13):1261–1270. doi:10.1001/jama.2019.11825
19. Li X, Ding J, Wang X, Cheng Z, Zhu Q. NUDT21 regulates circRNA cyclization and ceRNA crosstalk in hepatocellular carcinoma. Oncogene. 2020;39(4):891–904. doi:10.1038/s41388-019-1030-0
20. Yu XH, Deng WY, Chen JJ, et al. LncRNA kcnq1ot1 promotes lipid accumulation and accelerates atherosclerosis via functioning as a ceRNA through the miR-452-3p/HDAC3/ABCA1 axis. Cell Death Dis. 2020;11(12):1043. doi:10.1038/s41419-020-03263-6
21. Wang J, Zhao X, Wang Y, et al. circRNA-002178 act as a ceRNA to promote PDL1/PD1 expression in lung adenocarcinoma. Cell Death Dis. 2020;11(1):32. doi:10.1038/s41419-020-2230-9
22. Hu G, Ma J, Zhang J, et al. Hypoxia-induced lncHILAR promotes renal cancer metastasis via ceRNA for the miR-613/206/ 1-1-3p/Jagged-1/Notch/CXCR4 signaling pathway. Mol Ther. 2021;29(10):2979–2994. doi:10.1016/j.ymthe.2021.05.020
23. Guo Z, Wang X, Yang Y, et al. Hypoxic tumor-derived exosomal long noncoding RNA UCA1 promotes angiogenesis via miR-96-5p/AMOTL2 in pancreatic cancer. Mol Ther Nucleic Acids. 2020;22:179–195. doi:10.1016/j.omtn.2020.08.021
24. Rittirsch D, Huber-Lang MS, Flierl MA, Ward PA. Immunodesign of experimental sepsis by cecal ligation and puncture. Nat Protoc. 2009;4(1):31–36. doi:10.1038/nprot.2008.214
25. Vella LJ, Scicluna BJ, Cheng L, et al. A rigorous method to enrich for exosomes from brain tissue. J Extracell Vesicles. 2017;6(1):1348885. doi:10.1080/20013078.2017.1348885
26. Robinson MD, McCarthy DJ, Smyth GK. edgeR: a Bioconductor package for differential expression analysis of digital gene expression data. Bioinformatics. 2010;26(1):139–140. doi:10.1093/bioinformatics/btp616
27. Kanehisa M, Goto S, Kawashima S, Okuno Y, Hattori M. The KEGG resource for deciphering the genome. Nucleic Acids Res. 2004;32:D277–80. doi:10.1093/nar/gkh063
28. Mao X, Cai T, Olyarchuk JG, Wei L. Automated genome annotation and pathway identification using the KEGG Orthology (KO) as a controlled vocabulary. Bioinformatics. 2005;21(19):3787–3793. doi:10.1093/bioinformatics/bti430
29. Crescitelli R, Lasser C, Lotvall J. Isolation and characterization of extracellular vesicle subpopulations from tissues. Nat Protoc. 2021;16(3):1548–1580. doi:10.1038/s41596-020-00466-1
30. Liu B, Jin Y, Yang J, et al. Extracellular vesicles from lung tissue drive bone marrow neutrophil recruitment in inflammation. J Extracell Vesicles. 2022;11(5):e12223. doi:10.1002/jev2.12223
31. Hu C, Li J, Tan Y, et al. Tanreqing injection attenuates macrophage activation and the inflammatory response via the lncRNA-SNHG1/HMGB1 axis in lipopolysaccharide-induced acute lung injury. Front Immunol. 2022;13:820718. doi:10.3389/fimmu.2022.820718
32. Zhao Q, Sheng MF, Wang YY, et al. LncRNA Gm26917 regulates inflammatory response in macrophages by enhancing Annexin A1 ubiquitination in LPS-induced acute liver injury. Front Pharmacol. 2022;13:975250. doi:10.3389/fphar.2022.975250
33. Orecchioni M, Ghosheh Y, Pramod AB, Ley K. Macrophage Polarization: different Gene Signatures in M1(LPS+) vs Classically and M2(LPS-) vs Alternatively Activated Macrophages. Front Immunol. 2019;10:1084. doi:10.3389/fimmu.2019.01084
34. Jiang L, Guo P, Ju J, Zhu X, Wu S, Dai J. Inhalation of L-arginine-modified liposomes targeting M1 macrophages to enhance curcumin therapeutic efficacy in ALI. Eur J Pharm Biopharm. 2022;182:21–31. doi:10.1016/j.ejpb.2022.11.017
35. Zhao J, Yu H, Liu Y, et al. Protective effect of suppressing STAT3 activity in LPS-induced acute lung injury. Am J Physiol Lung Cell Mol Physiol. 2016;311(5):L868–L880. doi:10.1152/ajplung.00281.2016
36. Severgnini M, Takahashi S, Rozo LM, et al. Activation of the STAT pathway in acute lung injury. Am J Physiol Lung Cell Mol Physiol. 2004;286(6):L1282–1292. doi:10.1152/ajplung.00349.2003
37. Wang F, Zhang S, Jeon R, et al. Interferon gamma induces reversible metabolic reprogramming of M1 macrophages to sustain cell viability and pro-inflammatory activity. EBioMedicine. 2018;30:303–316. doi:10.1016/j.ebiom.2018.02.009
38. Ye C, Li H, Bao M, Zhuo R, Jiang G, Wang W. Alveolar macrophage - derived exosomes modulate severity and outcome of acute lung injury. Aging. 2020;12(7):6120–6128. doi:10.18632/aging.103010
39. Zhao R, Wang L, Wang T, Xian P, Wang H, Long Q. Inhalation of MSC-EVs is a noninvasive strategy for ameliorating acute lung injury. J Control Release. 2022;345:214–230. doi:10.1016/j.jconrel.2022.03.025
40. Root-Bernstein R. Innate receptor activation patterns involving TLR and NLR Synergisms in COVID-19, ALI/ARDS and sepsis cytokine storms: a review and model making novel predictions and therapeutic suggestions. Int J Mol Sci. 2021;22(4):2108. doi:10.3390/ijms22042108
41. Billing U, Jetka T, Nortmann L, et al. Robustness and Information Transfer within IL-6-induced JAK/STAT Signalling. Commun Biol. 2019;2:27. doi:10.1038/s42003-018-0259-4
42. Schaper F, Rose-John S. Interleukin-6: biology, signaling and strategies of blockade. Cytokine Growth Factor Rev. 2015;26(5):475–487. doi:10.1016/j.cytogfr.2015.07.004
43. Grommes J, Alard JE, Drechsler M, et al. Disruption of platelet-derived chemokine heteromers prevents neutrophil extravasation in acute lung injury. Am J Respir Crit Care Med. 2012;185(6):628–636. doi:10.1164/rccm.201108-1533OC
44. Bhatia M, Zemans RL, Jeyaseelan S. Role of chemokines in the pathogenesis of acute lung injury. Am J Respir Cell Mol Biol. 2012;46(5):566–572. doi:10.1165/rcmb.2011-0392TR
45. Zarbock A, Allegretti M, Ley K. Therapeutic inhibition of CXCR2 by Reparixin attenuates acute lung injury in mice. Br J Pharmacol. 2008;155(3):357–364. doi:10.1038/bjp.2008.270
46. Grishin AV, Wang J, Potoka DA, et al. Lipopolysaccharide induces cyclooxygenase-2 in intestinal epithelium via a noncanonical p38 MAPK pathway. J Immunol. 2006;176(1):580–588. doi:10.4049/jimmunol.176.1.580
47. Sahoo S, Li Y, de Jesus D, et al. Notch2 suppression mimicking changes in human pulmonary hypertension modulates Notch1 and promotes endothelial cell proliferation. Am J Physiol Heart Circ Physiol. 2021;321(3):H542–H557. doi:10.1152/ajpheart.00125.2021
48. Kiyokawa H, Morimoto M. Notch signaling in the mammalian respiratory system, specifically the trachea and lungs, in development, homeostasis, regeneration, and disease. Dev Growth Differ. 2020;62(1):67–79. doi:10.1111/dgd.12628
49. Chen W, Liu Y, Chen J, et al. The Notch signaling pathway regulates macrophage polarization in liver diseases. Int Immunopharmacol. 2021;99:107938. doi:10.1016/j.intimp.2021.107938
50. Bai X, Li J, Li L, et al. extracellular vesicles from adipose tissue-derived stem cells affect notch-miR148a-3p axis to regulate polarization of macrophages and alleviate sepsis in mice. Front Immunol. 2020;11:1391. doi:10.3389/fimmu.2020.01391
51. Yang Y, Lin S, Yang Z, Huang Y, Zhan F. Circ_0001947 promotes cell proliferation, invasion, migration and inflammation and inhibits apoptosis in human rheumatoid arthritis fibroblast-like synoviocytes through miR-671-5p/STAT3 axis. J Orthop Surg Res. 2022;17(1):54. doi:10.1186/s13018-022-02939-3
52. Zhang HW, Wang Q, Mei HX, et al. RvD1 ameliorates LPS-induced acute lung injury via the suppression of neutrophil infiltration by reducing CXCL2 expression and release from resident alveolar macrophages. Int Immunopharmacol. 2019;76:105877. doi:10.1016/j.intimp.2019.105877
53. Xu Q, Wang M, Guo H, et al. Emodin alleviates severe acute pancreatitis-associated acute lung injury by inhibiting the cold-inducible RNA-binding protein (CIRP)-mediated activation of the NLRP3/IL-1beta/CXCL1 Signaling. Front Pharmacol. 2021;12:655372. doi:10.3389/fphar.2021.655372
54. Cao F, Wang C, Long D, Deng Y, Mao K, Zhong H. Network-based integrated analysis of transcriptomic studies in dissecting gene signatures for LPS-induced acute lung injury. Inflammation. 2021;44(6):2486–2498. doi:10.1007/s10753-021-01518-8
55. Wu X, Yin S, Yan L, Liu Y, Shang L, Liu J. lncRNA DLEU1 modulates proliferation, inflammation, and extracellular matrix degradation of chondrocytes through regulating miR-671-5p. J Immunol Res. 2022;2022:1816217. doi:10.1155/2022/1816217
56. Kaur G, Maremanda KP, Campos M, et al. Distinct Exosomal miRNA Profiles from BALF and Lung Tissue of COPD and IPF Patients. Int J Mol Sci. 2021;22(21):11830. doi:10.3390/ijms222111830
57. Lu Z, Feng H, Shen X, et al. MiR-122-5p protects against acute lung injury via regulation of DUSP4/ERK signaling in pulmonary microvascular endothelial cells. Life Sci. 2020;256:117851. doi:10.1016/j.lfs.2020.117851
58. Xu W, Chen M, Ge N, Xu J. Hemagglutinin from the H5N1 virus activates Janus kinase 3 to dysregulate innate immunity. PLoS One. 2012;7(2):e31721. doi:10.1371/journal.pone.0031721
59. Cao K, Chen M, Jie X, Wang Y, Li Q, Xu J. H5N1 virus hemagglutinin inhibition of cAMP-Dependent CFTR via TLR4-Mediated janus tyrosine kinase 3 activation exacerbates lung inflammation. Mol Med. 2015;21(1):134–142. doi:10.2119/molmed.2014.00189
 © 2023 The Author(s). This work is published and licensed by Dove Medical Press Limited. The
full terms of this license are available at https://www.dovepress.com/terms
and incorporate the Creative Commons Attribution
- Non Commercial (unported, 3.0) License.
By accessing the work you hereby accept the Terms. Non-commercial uses of the work are permitted
without any further permission from Dove Medical Press Limited, provided the work is properly
attributed. For permission for commercial use of this work, please see paragraphs 4.2 and 5 of our Terms.
© 2023 The Author(s). This work is published and licensed by Dove Medical Press Limited. The
full terms of this license are available at https://www.dovepress.com/terms
and incorporate the Creative Commons Attribution
- Non Commercial (unported, 3.0) License.
By accessing the work you hereby accept the Terms. Non-commercial uses of the work are permitted
without any further permission from Dove Medical Press Limited, provided the work is properly
attributed. For permission for commercial use of this work, please see paragraphs 4.2 and 5 of our Terms.