Back to Journals » Drug Design, Development and Therapy » Volume 17
Insight into Nephrotoxicity and Processing Mechanism of Arisaema erubescens (Wall.) Schott by Metabolomics and Network Analysis
Authors Wang M, Yang N, Wu X, Zou T, Zheng J, Zhu H, Zhao C, Wang J
Received 31 January 2023
Accepted for publication 9 June 2023
Published 19 June 2023 Volume 2023:17 Pages 1831—1846
DOI https://doi.org/10.2147/DDDT.S406551
Checked for plagiarism Yes
Review by Single anonymous peer review
Peer reviewer comments 2
Editor who approved publication: Dr Tuo Deng
Min Wang,1,2,* Na Yang,1,2,* Xu Wu,3 Ting Zou,3 Jiahui Zheng,3 Huaijun Zhu,1 Chongbo Zhao,3 Jing Wang3
1Department of Pharmacy, Nanjing Drum Tower Hospital, The Affiliated Hospital of Nanjing University Medical School, Nanjing, People’s Republic of China; 2China Pharmaceutical University Nanjing Drum Tower Hospital, Nanjing, People’s Republic of China; 3College of Pharmacy, Shaanxi University of Chinese Medicine, Xianyang, People’s Republic of China
*These authors contributed equally to this work
Correspondence: Chongbo Zhao; Jing Wang, College of Pharmacy, Shaanxi University of Chinese Medicine, Xianyang, People’s Republic of China, Email [email protected]; [email protected]
Background: Arisaematis Rhizome (AR) has been used as a damp-drying, phlegm-resolving, wind-expelling, pain-alleviating, and swelling-relieving drug for thousands of years. However, the toxicity limits its clinical applications. Therefore, AR is usually processed (Paozhi in Chinese) prior to clinical use. In this study, the integration of ultra-high performance liquid chromatography-quadrupole/ time-of-flight mass spectrometry-based metabolomics and network analysis was adopted to investigate the metabolic shifts induced by AR and explore the processing mechanism.
Materials and Methods: Extracts of crude and processed AR products (1g/kg) were intragastrically administered to rats once daily for four consecutive weeks. The renal function was evaluated by blood urea nitrogen, creatinine, interleukin-1 beta (IL-1β) and tumor necrosis factor-alpha (TNF-α), malondialdehyde (MDA), super oxide dismutase (SOD), the ratio of glutathione/glutathione disulfide (GSH/GSSH), glutathione peroxidase (GSH-Px) and histopathological examination. Furthermore, the chemical composition of AR was clarified by ultra-high performance liquid chromatography-quadrupole/ time-of-flight mass spectrometry, after which the integration of metabolomics and network analysis was adopted to investigate the metabolic shifts induced by AR and explore the processing mechanism.
Results: Crude AR caused renal damage by stimulating inflammation and oxidative stress, as confirmed by the increased production of IL-1β, TNF-α and MDA, and decreased levels of SOD, GSH/GSSH and GSH-Px. Processing with ginger juice, alumen and bile juice alleviated the damage to kidney. Metabolomics results showed that a total of 35 potential biomarkers enriched in amino acid metabolism, glycerophospholipid metabolism, fatty acid-related pathways, etc. were deduced to be responsible for the nephrotoxicity of AR and the toxicity-reducing effect of processing.
Conclusion: This work provided theoretical and data support for the in-depth study of the processing mechanism, showing that processing reduces AR nephrotoxicity through multiple metabolic pathways.
Keywords: Arisaematis rhizome, nephrotoxicity, processing, UPLC-Q/TOF-MS, metabolomics
Graphical Abstract:

Introduction
Arisaematis Rhizome (AR), first recorded in Shen Nong Ben Cao Jing (Shennong’s Herbal Classic), is prescribed as dried roots and rhizomes of Arisaema erubescens (Wall.) Schott, Arisaema heterophyllum Bl. or Arisaema amurense Maxim in Chinese Pharmacopoeia (2020 edition). AR has been used as a damp-drying, phlegm-resolving, wind-expelling, pain-alleviating, and swelling-relieving drug for thousands of years.1 Nowadays, modern pharmacological investigations have proven that AR is effective in management of many diseases, such as cervical carcinoma, lung cancer, rheumatoid arthritis, epilepsy and so on.2–4
Despite its potentially clinical efficacy, AR is recorded as a toxic herbal medicine with strong irritant toxicity to mouth, throat and mucous membranes.5 It has been reported that calcium oxalate crystals, lectins and Pinellia ternata agglutinin and trypsin inhibitor like proteins are the main contributors to AR irritant toxicity.1,5,6 Furthermore, a previous study has proven that oral administration of AR ethanol extract worsened renal function with a significant increase in blood urea nitrogen.7 Meanwhile, Ge et al found that AR could induce light vacuolization of glomerular matrix and edema of renal tubular epithelial cells.8 Since kidney is the central organ responsible for eliminating toxic compounds and maintaining body homeostasis, attention to renal function is indispensable for the research concerning AR toxicity and detoxification.
Processing (Paozhi in Chinese) is a unique practice in traditional Chinese medicine (TCM), which could reduce toxicity and/or enhance efficacy to fulfill the requirement of therapies.9 Prior to clinical use, crude AR (CAR) is usually processed with ginger juice and alumen to produce Arisaematis Rhizome Praeparatum (ARP) or with bile juice to produce Arisaema Cum Bile (ACB).10 It is universally acknowledged that processing-induced variation in structure and content of calcium oxalate crystals is the underlying toxicity-reducing mechanism.11 However, TCM exerts its effects, including therapeutic efficiency and toxicity, through multi-components on multi-targets.12 Therefore, up to now, the toxicity-reducing mechanism of processing is uncertain.
Metabolomics, aiming at comprehensively analyzing endogenous metabolites in biological system, is a promising tool to elucidate the toxic mechanism and processing theory of TCM.1,13 H NMR based metabolomics research exhibited metabolic variations following AR administration.8 To date, nuclear magnetic resonance (NMR) and mass spectrometry (MS) are the two most powerful technologies in metabolomics area. Generally, MS, especially connected with ultra-high performance liquid chromatography (UPLC) system, has a higher sensitivity, resolution and specificity than NMR.14 Furthermore, the metabolomic data regarding AR processing are limited, and further studies are urgently needed to clarify the processing mechanism.
Therefore, in the present study, a comprehensive ultra-high performance liquid chromatography-quadrupole/ time-of-flight mass spectrometry (UPLC-Q/TOF-MS)-based metabolomics, integrated with network analysis, was adopted to explore the nephrotoxicity of CAR and the toxicity-reducing mechanism of processing.
Materials and Methods
Chemicals and Herbal Preparation
AR herb (Figure 1A) was obtained from Hebei Anguo Medicinal Materials Market and authenticated in accordance with Chinese Pharmacopoeia (2020 edition) by Prof. Changli Wang (College of Pharmacy, Shaanxi University of Chinese Medicine) as Arisaema erubescens (Wall.) Schott. Voucher specimens of CAR (Figure 1B), ARP (Figure 1C) and ACB (Figure 1D) were deposited at Shaanxi University of Chinese Medicine, Xianyang, People’s Republic of China.
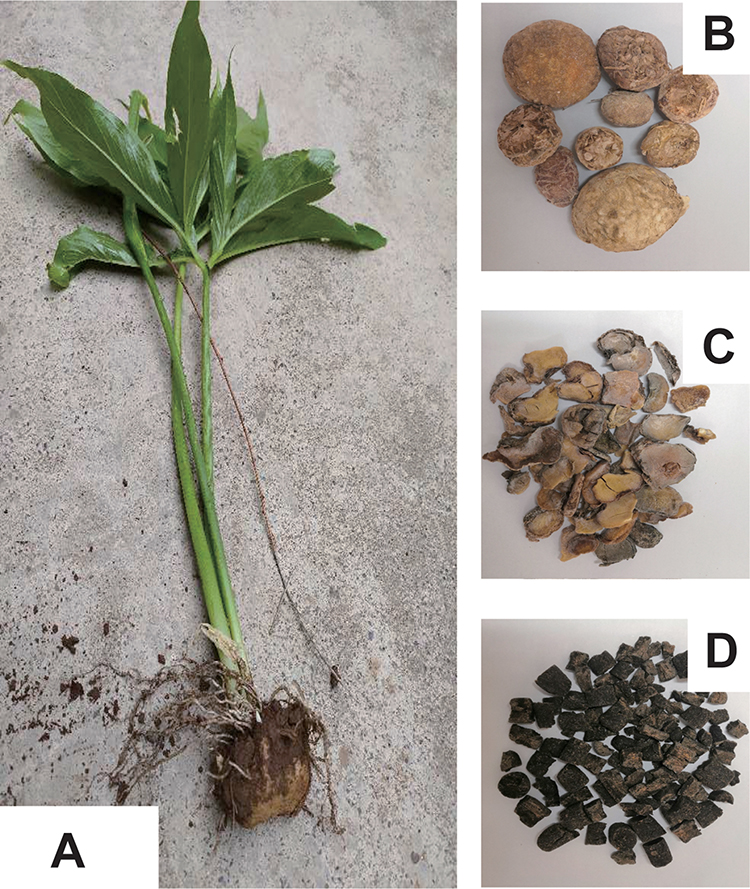 |
Figure 1 Pictures of AR plant (A), CAR (B), ARP (C) and ACB (D). |
ARP preparation: CAR was soaked in several changes of water until the foam was visualized. After soaked with alum for one day, CAR was decocted with sliced ginger and alum to get ARP.
ACB preparation: CAR was fermented with bovine bile at a constant temperature (37°C) and humidity (70%) for 15 days to prepare ACB.
Preparation of AR suspensions: crude and processed AR products were pulverized to powder and extracted twice with water (1:10, w/v) at 60°C for 1 h. The decoction was filtered and concentrated with a rotary evaporator to yield 0.1 g/mL AR suspensions.
Animal Experiments and Sample Collection
Male Sprague-Dawley rats (eight to ten weeks) were obtained from the Fourth Military Medical University Animal Center (Certification No. SCXK (Shaanxi) 2014–003) and acclimatized at a controlled temperature (22–25°C) and humidity (45–55%) with a 12/12 h light/dark cycle. After one-week acclimatization, rats were randomly divided into control group (N), CAR treated group, ARP treated group and ACB treated group with six rats in each group. The herb treated groups were intragastrically administered with their corresponding herb extract at a dosage of 1.0 g/kg per day for four weeks, while the control group (n = 6) was administered the same volume of distilled water. This dosage was made according to our pre-experiment and existing literature.8
Being exposed to crude or processed AR extract for four weeks, all rats were fasted overnight following orbital venous blood and kidney tissue sample collection. Blood samples were centrifuged at 3000 rpm for 10 min at 4°C and then divided into two parts: one part was used for biochemical parameter detection; another was stored at −80°C for metabolomic analysis. Kidney samples were removed, weighed, and fixed in 10% neutral-buffered formalin for hematoxylin and eosin (H&E) staining. The animal experiment was carried out in accordance with the recommendations of the Guide for the Care and Use of Laboratory Animals of the National Institutes of Health, with the approval of Animal Care and Use Committee of Shaanxi University of Chinese Medicine.
Biochemical Parameters and Histopathology
Routine renal function indicators including blood urea nitrogen (BUN) and creatinine (CREA) were measured by commercial kits in accordance with the manufacturer’s instructions (Jiancheng Bioengineering Institute, China). Serum levels of inflammatory cytokines such as interleukin-1 beta (IL-1β) and tumor necrosis factor-alpha (TNF-α) were determined using ELISA kits according to the manufacturer’s instructions (BD OptEIA). Oxidative stress indicators in kidney, ie, malondialdehyde (MDA), super oxide dismutase (SOD), the ratio of glutathione (GSH)/glutathione disulfide (GSSG) and glutathione peroxidase (GSH-Px) were assayed in kidney homogenates according to the manufacturer’s instructions (Raybiotech, USA). What is more, kidney sections were stained with H&E for histopathological examination after fixation overnight in 10% neutral-buffered formalin and embedment in paraffin.
Instrument Analysis for Metabolomics
Non-targeted metabolomics was performed on a quadrupole/time-of-flight mass spectrometer (TripleTOF® 5600+, AB SCIEX LLC., Redwood City, CA, USA) integrated with an Exion LC AD System (AB SCIEX LLC., Redwood City, CA, USA). Phenomenex Kinetex C18 column (100×2.1 mm, 2.6 μm; Phenomenex, Torrance, CA, USA) equipped with a guard column, SecurityGuard ULTRA cartridge UHPLC C18 for 2.1 mm ID column (Phenomenex, Torrance, CA, USA) was used to separate serum metabolites at a constant temperature of 40°C. The mobile phase consisted of acetonitrile (mobile phase A) and 0.1% formic acid in water (mobile phase B) with a gradient elution at 0.4 mL/min. The gradient elution program was as follows: from 0 min to 1 min, the mobile phase changed from 10% A/90% B to 30% A/70% B, then increased to 95% A/5% B for the next 18 min and maintained at 95% A/5% B for 1 min. The untargeted mass spectrometry acquisition was carried out in both positive and negative electrospray ionization mode by using DuoSpray ion source. Data with a mass range of mass-to-charge ratio (m/z) 60–1000 were acquired in a full scan mode and triggered to acquire information-dependent MS/MS spectra. The ion spray voltage floating was 5500 V for positive mode and −4500 V for negative mode. The pressure of nebulizer gas, heater gas and curtain gas were set to 55 psi, 55 psi and 35 psi, respectively. The turbo spray temperature was 550°C and declustering potential was ± 80 V. The tandem mass spectrometry data was acquired under the collision energy of 35 V with a collision energy spread of 15 V. The automated calibration delivery system was adopted to deliver external calibration reference solution to automatically regulate m/z of MS and MS/MS data.
Instrument Analysis for AR Constituents Characterization
AR constituents characterization was performed on a quadrupole/time-of-flight mass spectrometer (TripleTOF® 5600+, AB SCIEX LLC., Redwood City, CA, USA) integrated with an Exion LC AD System (AB SCIEX LLC., Redwood City, CA, USA). The MS parameters were same to ones described before. Chromatographic separation was separated on a Waters ACQUITY UPLC HSS T3 column (2.1 x100 mm, 1.8 μm) eluted with acetonitrile (A) −0.1% formic acid aqueous solution (B) in a gradient program: 0.0–1.5 min: 5% A, 1.5–10.0 min: 5–50% A, 10.0–23.0 min: 50–85% A, 23.0–28.0 min, 85%A-95% A; 28.0–30.0 min: 95%A, then back to initial composition in 1 min and held another 4 min for column re-equilibration.
Multivariate Statistical Analysis
Raw data files generated from the UPLC-Q/TOF-MS analysis were converted to the mzXML format by the software of ProteoWizard, and processed by the online platform XCMS for retention time calibration, peak alignment, peak recognition and signal intensity extraction. Then, a three-dimensional data matrix containing retention time, mass-to-charge ratio value and peak area was generated. After filtering, only metabolic features with detection frequency, as calculated for all test samples, more than 80%, and a RSD, as calculated for the QC samples, lower than 30%, were retained for further principal component analysis (PCA) and orthogonal partial least squares discriminant analysis (OPLS-DA) by SIMCA-P version 14.1 (Umetrics, Sweden). The 200-iteration permutation test was constructed to check whether its corresponding OPLS-DA model was over-fitting. Afterwards, a variable importance in the projection in OPLS-DA model >1, a 1.2 fold change cutoff and a p-value in nonparametric test (Wilcoxon Mann–Whitney test with Benjamini-Hochberg false discovery rate correction) were set as thresholds to screen out differentially expressed ions between groups.15,16
The differentially expressed ions were putatively annotated based on online databases, ie, the Human Metabolome Database (http://www.hmdb.ca), the Metlin database (http://metlin.scripps.edu), and the Kyoto Encyclopedia of Genes and Genomes (KEGG) pathway database (http://www.genome.jp/kegg/), and confirmed by comparing chromatographic retention time and mass spectrum information with standards available in our lab.17
Pathway Analysis and Network Construction
The differential metabolites were imported into the free web-based platform Metaboanalyst 5.0 (www.metaboanalyst.ca) for pathway analysis. Furthermore, since endogenous metabolites actively modulate biological processes and phenotypes by interacting with genome, transcriptome and proteome, we constructed metabolite-enzyme-reaction-gene network with the aid of Metscape, a plugin for Cytoscape (http://www.cytoscape.org).18 The network node centralities (ie, degree, betweenness, and centroid value) were calculated by CentiScaPe, another Cytoscape plugin, to extract the core subnetwork. Then, the structures of targets and chemical compounds in AR extract were acquired from PDB database and Pubchem database, respectively. SYBYL-X 2.0 software was utilized to perform molecular docking. Generally, a total docking score above 5 indicates a strong interaction between the chemical compounds and the corresponding protein target.
Results
Main Compounds in AR Extract
The base peak chromatograms of crude and processed AR extracts are depicted in Figure 2. A total of 15 compounds were identified and the detailed information is shown in Table S1.
 |
Figure 2 The base peak chromatograms of CAR (A), ARP (B) and ACB (C) in positive mode; the base peak chromatograms of CAR (D), ARP (E) and ACB (F) in negative mode. 1. Alanine; 2. Phenylalanine; 3. Gingerol; 4. Glycocholic acid; 5. Apigenin; 6. Ursodeoxycholic acid; 7. Cholic Acid; 8. Glycolithocholic acid; 9. Chenodeoxycholic acid; 10. Deoxycholic acid; 11, LysoPC(14:0); 12, LysoPC(16:0); 13. LysoPE(18:1); 14. Linolenic acid; 15. Linoleic acid. |
Kidney Function Associated with AR Exposure
As shown in Figure 3, the serum levels of routine renal function indicators including BUN and CREA increased significantly in rats exposed to CAR (87.19% and 50.72%, respectively) compared with exposed to water. Furthermore, CAR treatment significantly raised the level of inflammatory cytokines IL-1β and TNF-α. Meanwhile, a significant increase in MDA and a decrease in SOD, GSH/GSSG ratio and GSH-Px, all of which were oxidative stress indicators,19 were observed in CAR group when compared with N group. Our study demonstrated that CAR induced kidney dysfunction accompanied by activating the oxidative and inflammatory pathways.
 |
Figure 3 Effect of crude and processed AR on the levels of BUN (A), CREA (B), IL-1β (C), TNF-α (D), MDA (E), SOD (F), GSH/GSSG (G) and GSH-Px (H). Data were expressed as mean ±SD, *P <0.05 vs N group, #P <0.05 vs CAR group. |
In addition, we found that, compared with CAR group, rats in ARP group had significant changes in the levels of BUN, CREA, IL-1β, TNFα, SOD and GSH/GSSG ratio (p < 0.05) and obvious change in GSH-Px without significance (p > 0.05), while rats in ACB group had significant changes in all the monitoring indicators (p < 0.05) (Figure 3). Moreover, renal histopathology (Figure 4) also revealed that vacuolar degeneration in renal tubular epithelial (RTE) cells, detachment of RTE cell and destructed renal tubule induced by CAR treatment. These histopathological damages were relatively mild in ARP and ACB groups. The two processing methods restored biochemical parameters to normal or near-normal levels at different degree and alleviated damage to kidney, indicating that processing could reduce the nephrotoxicity of CAR.
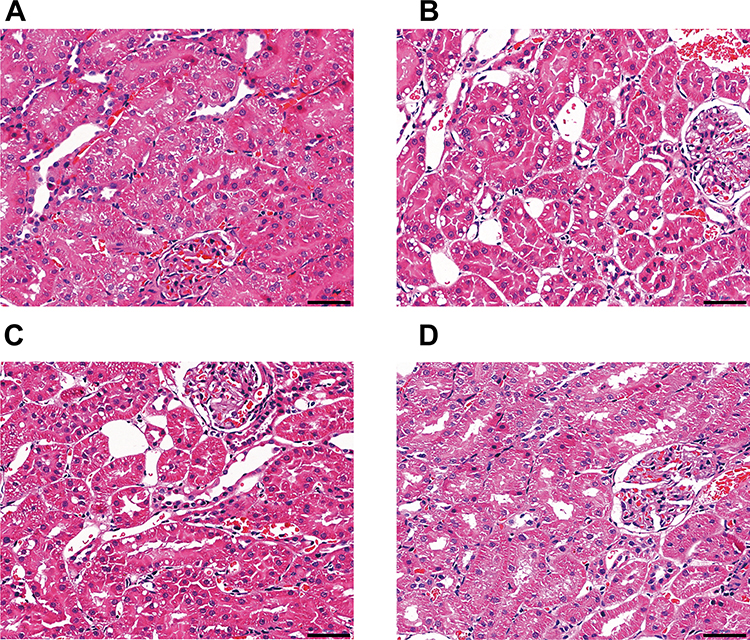 |
Figure 4 Renal histopathology of rats exposed to different AR products as observed by H&E staining. (A) N group, (B) CAR group, (C) ARP group, (D) ACB group. Scale bar: 50μm. |
Metabolomics Results
Data Quality Assurance
Data quality is paramount to monitor the analytical process and ensure the data quality of non-targeted metabolomics. QC samples, prepared by pooling aliquots of the test samples, were used to assess data quality. QC samples were injected ten times at the beginning of the run to condition analytical system and every four samples throughout the batch to assess system suitability.20 As shown in the overlaid total ion chromatograms (Figure S1), there was little variation in retention time and peak shape of the inserted QC samples, which provided an initial demonstration of the system reproducibility.21 Furthermore, QC samples together with test samples were employed to construct PCA. PCA score plot (Figure 5A and B) exhibited a tight clustering of QC samples, which reassure the data quality of non-targeted metabolomics.
 |
Figure 5 Score plots from PCA and OPLS-DA analysis. (A) PCA score plot in positive mode; (B) PCA score plot in negative mode; (C) OPLS-DA score plot for N vs CAR in positive mode; (D) OPLS-DA score plot for N vs CAR in negative mode; (E) OPLS-DA score plot for N vs ARP in positive mode; (F) OPLS-DA score plot for N vs ARP in negative mode; (G) OPLS-DA score plot for N vs ACB in positive mode; (H) OPLS-DA score plot for N vs ACB in negative mode. Black circles: QC; red squares, N group; green triangles, CAR group; Orange diamonds, ARP group; blue pentagons, ACB group. |
Multivariate Data Analysis
The study aimed to illustrate the processing mechanism from the perspective of metabolomic perturbations induced by different AR products. The typical chromatographs of positive and negative ionization mode were acquired and depicted in Figure S2. To clearly understand the metabolomic permutations, multivariate analysis, including unsupervised PCA and supervised OPLS-DA, was conducted. PCA gave an initial visualization of classification trends among samples. As shown in Figure 5A and B, a certain separation degree of different groups was observed.
To maximize the separation and deeply dig out the differences existing between vehicle- and AR-treated rats, supervised OPLS-DA was applied. A clear separation of metabolomic profiles for N vs CAR, N vs ARP and N vs ACB are displayed in Figure 5C–H. The OPLS-DA parameters of R2Y and Q2 for each comparison were as follows: N vs CAR (R2Y = 0.906, Q2 = 0.679 in positive ion mode; R2Y = 0.844, Q2 = 0.694 in negative ion mode), N vs ARP (R2Y = 0.967, Q2 = 0.881 in positive ion mode; R2Y = 0.819, Q2 = 0.575 in negative ion mode) and N vs ACB (R2Y = 0.987, Q2 = 0.888 in positive ion mode; R2Y = 0.980, Q2 = 0.929 in negative ion mode), suggesting a good fit and predictability of these models.22 Furthermore, cross-validated analysis of variance (CV-ANOVA) and permutation test of 200 iterations were further performed to assess the validity of the corresponding OPLS-DA model. Significant CV-ANOVA p-values (p < 0.05) were obtained for each OPLS-DA model. Moreover, the permutations plots (Figure S3) showed that the permuted R2 (in green) and Q2 (in blue) values were lower than the original ones, and Q2 regression line intersected the vertical axis below zero, indicating all the OPLS-DA models were valid.23,24
Metabolomic Perturbations Induced by AR
The combination of variable importance in the projection in OPLS-DA model >1, fold change >1.2 or <1.2−1, and p value <0.05 was adopted to filter metabolomic perturbations induced by CAR, ARP and ACB. We found 67 differential metabolites, ie, 26 for N vs CAR; 26 for N vs ARP and 39 for N vs ACB. Furthermore, Spearman correlation analysis was applied to identify potential biomarkers’ correlations related to abnormal kidney functions. Thirty-two differential metabolites were removed because of the weak correlation (−0.3 < Spearman correlation coefficients < 0.3) with all biochemical parameters (Figure S4).25 Finally, a total of 35 potential biomarkers, ie, 22 for CAR, 17 for ARP and 11 for ACB (Figure 6A), were retained for pathway analysis. The potential biomarkers’ information including retention time, molecular formula, mass-charge ratio, fragment masses and metabolite name is shown in Table 1. These 35 potential biomarkers annotated six main classes, including ten long-chain fatty acids (FAs), seven bile acids, eight glycerophospholipids, four amino acids and six others. The variation trend of potential biomarkers was visualized in heat-map (Figure 6B).
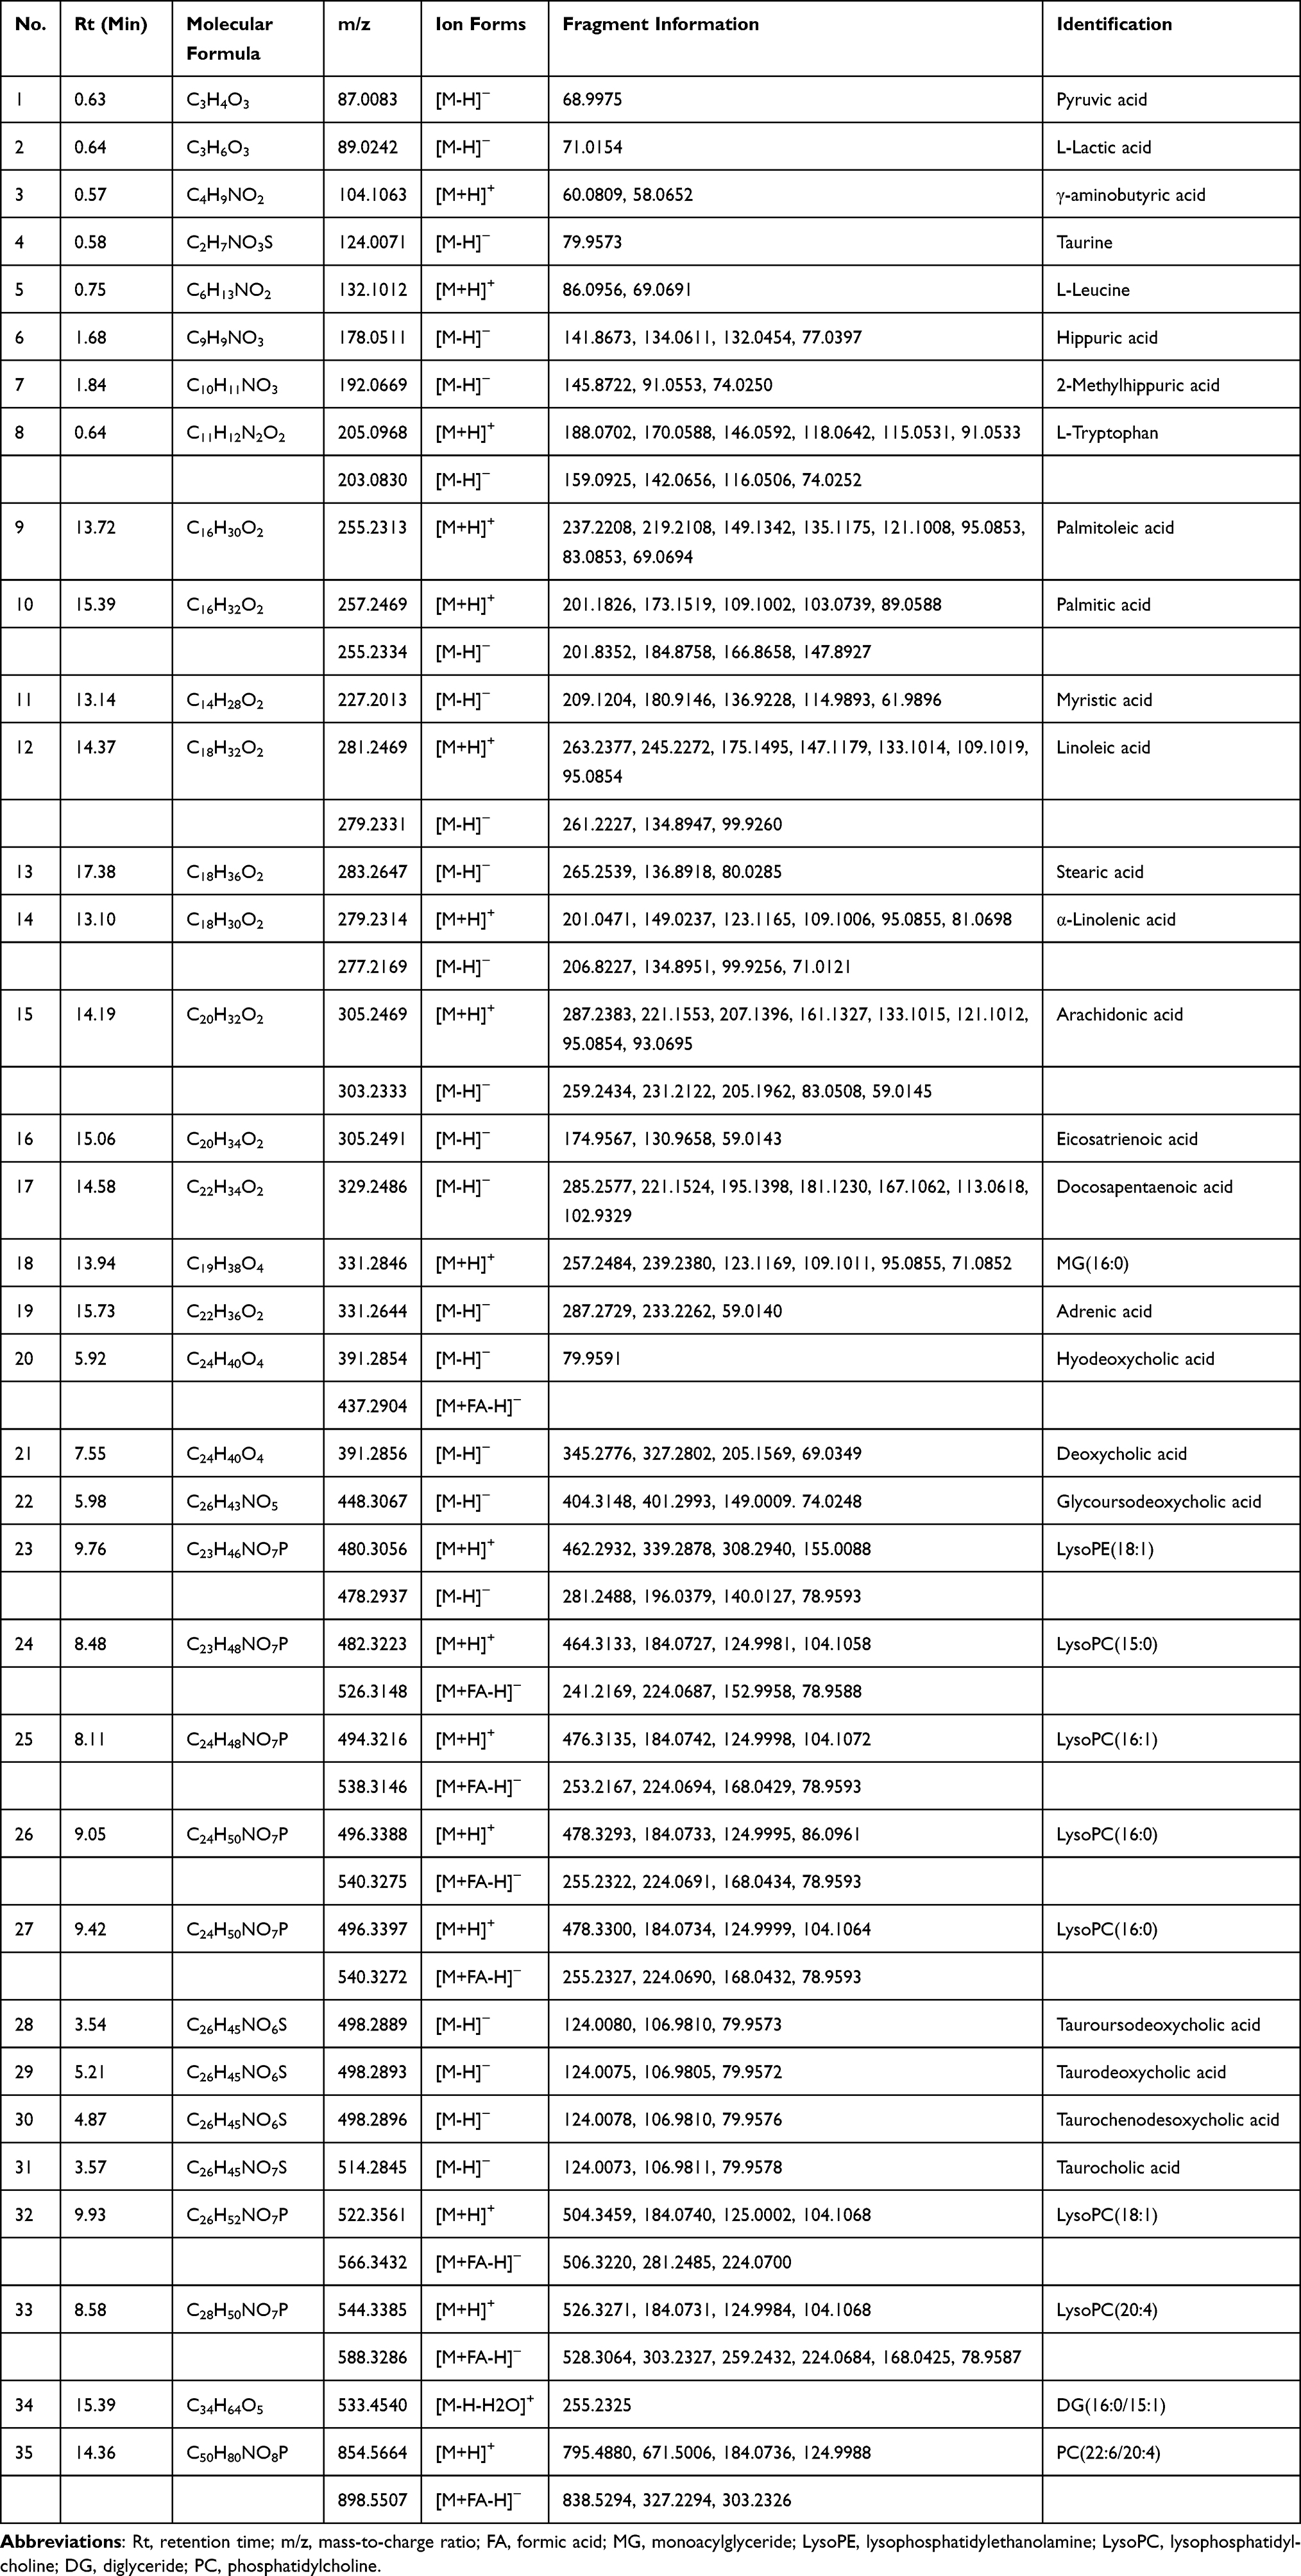 |
Table 1 The Information of Potential Biomarkers |
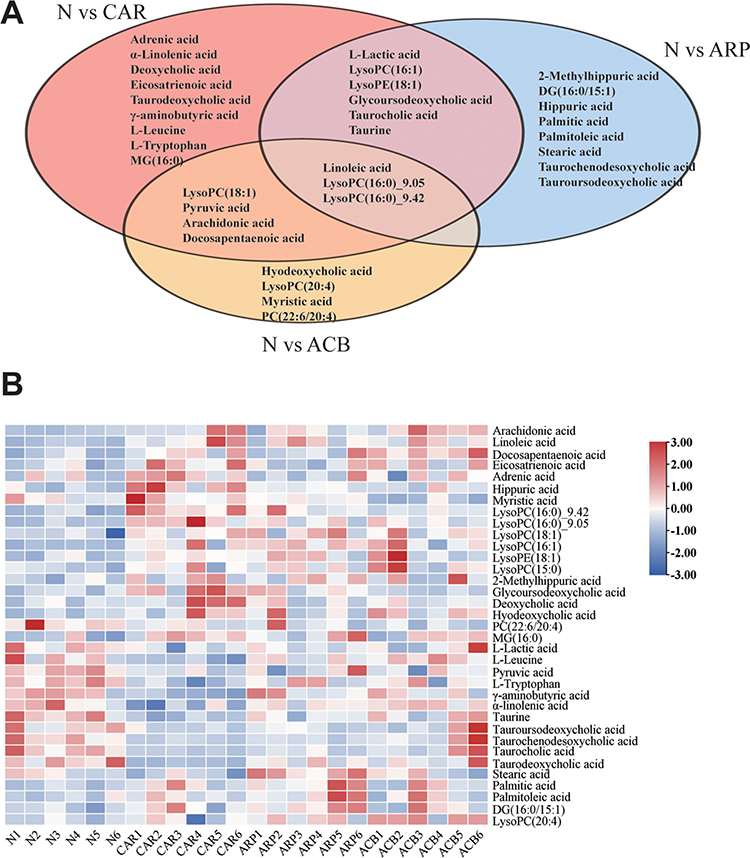 |
Figure 6 Potential biomarkers in different AR-treated groups. (A) Veen diagram showing the unique and common biomarkers among the groups intervened by different AR product. (B) Heat map demonstrating the content changes of potential biomarkers. |
Pathway Analysis
The potential biomarkers for different AR products were, respectively, imported into the pathway analysis module of MetaboAnalyst 5.0 to uncover the possible metabolic pathways correlated with AR exposure. As shown in Figure 7A–C, the main pathways involved in CAR exposure were taurine and hypotaurine metabolism, biosynthesis of unsaturated fatty acids, glycolysis/gluconeogenesis, alanine, aspartate and glutamate metabolism, and pyruvate metabolism, whereas those involved in processed AR were linoleic acid metabolism, biosynthesis of unsaturated fatty acids, glycerophospholipid metabolism, taurine and hypotaurine metabolism, primary bile acid biosynthesis and arachidonic acid metabolism. To clearly elucidate the metabolomic perturbations induced by AR, a hypothetical metabolic network was reconstructed by using these potential biomarkers (Figure 7D).
 |
Figure 7 The altered metabolomic pathways associated with potential biomarkers for CAR- (A), APR-(B), ACB-(C) treatment using MetaboAnalyst 5.0, and schematic overview of metabolic pathways interrupted by AR treatment (D). Metabolites with name shown in blue, green and Orange were significantly altered only in CAR-, ARP- and ACB-treated group, respectively. |
Furthermore, potential biomarkers related to AR nephrotoxicity were imported into Cytoscape to figure out the potential metabolite-reaction-enzyme-gene network. Based on the node centrality indexes (ie, degree, betweenness, and centroid value) of metabolite-reaction-enzyme-gene network (Figure S5), the core subnetwork was extracted. As shown in Figure 8, the potential biomarkers were enriched in bile acid biosynthesis, amino acid metabolism, glycolysis/gluconeogenesis, glycerophospholipid metabolism and fatty acid related pathways, indicating the main pathways involved in AR-induced nephrotoxicity. In addition, the possibility of interaction between lysoPC(16:0), a differential compound in vitro and in vivo, and potential key targets was explored by molecular docking. LysoPC(16:0) formed hydrogen bonds with PLA2G4A residues ARF59, ARG61 and ASP99 (Figure S6A), and with FASN residues TYP2343 and ILE2250 (Figure S6B). The total docking scores were 6.63 and 6.03, respectively.
 |
Figure 8 The core metabolite-reaction-enzyme-gene subnetwork constructed utilizing Cytoscape software. Red hexagons: input metabolites; green squares: enzyme; grey diamonds: reaction; purple circle: target; pink hexagon: related metabolites. |
Discussion
Processing is a unique practice aiming to reduce toxicity and/or enhancing efficacy in TCM.26 Since first recorded in Shen Nong Ben Cao Jing at Hou-Han Dynasty (AD 25–220), AR was accepted as a typical toxic TCM and usually processed before clinical application. However, the underlying toxicity-reducing mechanism of processing was unclear. Thus, metabolomics, integrated with network pharmacology, was conducted to explore the nephrotoxicity of CAR and toxicity-reducing mechanism involved in processing.
In this study, renal histopathology and biomedical indexes showed that CAR exerted nephrotoxic effects, which was significantly attenuated after processing. A total of 35 potential biomarkers, ie, 22 for CAR, 17 for ARP and 11 for ACB, were screened out and grouped into long-chain FAs, bile acids, glycerophospholipids, amino acids and others.
Accumulating evidence has demonstrated that FAs play an important role in many biological functions, including inflammatory processes and their resolution.27 In this study, polyunsaturated FAs (eg, α-linolenic acid, eicosatrienoic acid and adrenic acid) were only altered significantly in CAR group. Interestingly, α-linolenic acid was down-regulated; meanwhile, the other two were up-regulated. Based on their chemical structure, α-linolenic acid, eicosatrienoic acid and adrenic acid could be classified into omega-3 (n-3) and omega-6 (n-6) polyunsaturated FAs, respectively. Previous studies have demonstrated that n-3 and n-6 polyunsaturated FAs exert opposite effects to human health.28 The alteration of α-linolenic acid in CAR treated-rats was in line with the published studies, where a significant decrease in α-linolenic acid was found to be associated with kidney dysfunction.29,30 Meanwhile, α-linolenic acid supplementation ameliorated the kidney damage by reducing inflammation and oxidative stress markers.31,32 Our study demonstrated that α-linolenic acid correlated negatively with IL-1β, TNF-α and MDA, but positively with SOD, GSH/GSSH and GSH-Px. In contrast, n-6 polyunsaturated FAs trigger pro-inflammatory response.33 Since the contents of total n-3 and n-6 polyunsaturated FAs were unknown, their overall effects were still unclear, which needs to be explored in future studies.
Amino acids serve as building blocks of protein, precursors for proteins and nucleotides, source of energy, so they play an important role in maintaining human health. Studies have shown that renal damage is often accompanied by amino acid disorders. In this experiment, CAR administration caused a significant decrease in L-tryptophan and L-leucine, while this effect was moderated after processing. The decrease in L-tryptophan and L-leucine has been proven to be associated with abnormal kidney function.34,35 In addition, pre-administration of L-tryptophan was effective in suppressing adriamycin-induced renal failure.36 As essential amino acids, L-tryptophan and L-leucine participate in a variety of biological functions, such as oxidative stress, inflammatory responses, and immune responses.
What is more, we found specific bile acid species expressed differentially in CAR-, ARP- and ACB-treated groups. Simply put, levels of glycoursodeoxycholic acid, deoxycholic acid and hyodeoxycholic acid obviously increased, while tauroursodeoxycholic acid, taurochenodesoxycholic acid, taurocholic acid, tauro-alpha-muricholic acid and taurodeoxycholic acid clearly decreased after CAR exposure. Compared with CAR, ARP and ACB exerted less effect on bile acids. Over the last few decades, bile acids have attracted increasing attention for their effect on renal function.37,38 Renal damage is often accompanied by inverse change trends of specific bile acid species, due to their different pathophysiological effects.34,39,40 For instance, tauroursodeoxycholic acid protected against glycochenodeoxycholic acid-induced apoptosis by activation of p38, ERK MAPK, and PI3K pathways.41 Ursodeoxycholic acid ameliorates gentamicin-induced kidney injury via inhibition of oxidative stress, inflammation and apoptosis.42 In agreement with previous literature, we found that CAR-induced nephrotoxicity was accompanied by abnormal bile acid metabolism. Nevertheless, owing to the inconsistent change direction of specific bile acid species, it is necessary to conduct further research to elucidate the role of specific bile acid species in CAR-induced renal damage.
Among the 35 potential biomarkers, only lysoPC(16:0) significantly increased in all three treated groups. As a differential compound in vitro and in vivo, LysoPC(16:0) showed a high affinity to PLA2G4A, a phospholipase enzyme that hydrolyzes glycerophospholipid to release arachidonic acid and then produce prostaglandins and leukotrienes. Therefore, LysoPCs are widely regarded as deleterious mediators to kidney.34,43–45 Here, we found that lysoPC(16:0) was negatively associated with IL-1β, TNF-α and MDA, but positively with SOD, GSH/GSSH and GSH-Px. What is more, LysoPC(16:0) significantly increased in all three treated groups, and the fold change for CAR vs N was greater than that for ARP vs N and CAB vs N, indicating that the elevated lysoPC(16:0) might partly contribute to AR-induced nephrotoxicity and toxicity-reducing effect of processing.
Conclusion
In this study, we found CAR caused renal damage by stimulating inflammation and oxidative stress, as confirmed by the increased production of IL-1β, TNF-α and MDA, and decreased levels of SOD, GSH/GSSH and GSH-Px. Processing with ginger juice, alumen and bile juice alleviated the damage to kidney. Metabolomics results indicated perturbation of metabolic signature, including long-chain fatty acids, bile acids, glycerophospholipids and amino acids might contribute to CAR-induced nephrotoxicity and be related to toxicity-reducing mechanism of processing. Our study provides theoretical and data support for the in-depth study of the processing mechanism, showing that processing reduces AR nephrotoxicity through multiple metabolic pathways. However, there are some limitations in this study. The role of the potential biomarker in the progression of AR nephrotoxicity, and the exact links between chemical components and endogenous metabolites still require further experiments.
Funding
This work was supported by the National Natural Science Foundation of China (No. 82204846, 81803732, and 81903892), Science and technology program in Shaanxi Province of China (No. 2021SF-385), Clinical Trials from the Affiliated Drum Tower Hospital, Medical School of Nanjing University (No. 2022-LCYJ-PY-14).
Disclosure
The authors report no conflicts of interest in this work.
References
1. Qi CY, Wang J, Wu X, et al. Botanical, traditional use, phytochemical, and toxicological of Arisaematis rhizoma. Evid Based Complement Alternat Med. 2021;2021:9055574. doi:10.1155/2021/9055574
2. Qiu LM, Jiang S. Combined influence of Arisaematis Rhizoma polysaccharide with cisplatin on the proliferation, apoptosis and epithelial mesenchymal transition of breast carcinoma MDA-MB-231 cells. J Chin Med Mater. 2016;39(3):630–633. doi:10.13863/j.issn1001-4454.2016.03.040
3. Zhao CB, Li XY, Wu N, Peng W, Liu YJ, Wu CJ. Effect of Arisaema erubescens (Wall) Schott rhizome extract on rheumatoid arthritis. Trop J Pharm Res. 2016;15(4):805–813. doi:10.4314/tjpr.v15i4.20
4. Sun N, Liu JY, Yu WY, et al. Research progress on chemical constituents and biological activities of Arisaematis Rhizoma. China J Chin Mater Med. 2021;46(20):5194–5200. doi:10.19540/j.cnki.cjcmm.20210513.601
5. Su F, Sun Y, Zhu W, et al. A comprehensive review of research progress on the genus Arisaema: botany, uses, phytochemistry, pharmacology, toxicity and pharmacokinetics. J Ethnopharmacol. 2022;285:114798. doi:10.1016/j.jep.2021.114798
6. Wang C, Bi Q, Huang D, et al. Identification of Pinelliae Rhizoma and its counterfeit species based on enzymatic signature peptides from toxic proteins. Phytomedicine. 2022;107:154451. doi:10.1016/j.phymed.2022.154451
7. Dong W. Study on Toxicity of Rhizoma Arisaema. Heilongjiang University of traditional Chinese medicine; 2011.
8. Dong G, Wang J, Guo P, Wei D, Yang M, Kong L. Toxicity assessment of Arisaematis Rhizoma in rats by a H-1 NMR-based metabolomics approach. Mol Biosyst. 2015;11(2):407–417. doi:10.1039/c4mb00583j
9. Chen W, Luo H, Zhong Z, Wei J, Wang Y. The safety of Chinese medicine: a systematic review of endogenous substances and exogenous residues. Phytomedicine. 2023;108:154534. doi:10.1016/j.phymed.2022.154534
10. Huang CF, Yang RS, Liu SH, Hsieh PC, Lin-Shiau SY. Evidence for improved neuropharmacological efficacy and decreased neurotoxicity in mice with traditional processing of Rhizoma Arisaematis. Am J Chin Med. 2011;39(5):981–998. doi:10.1142/s0192415x11009354
11. Wu H, Zhong LY. Study on irritation of calcium oxalate crystal in Araceae plants. China J Chin Mater Med. 2008;33:380–384.
12. Wang K, Li K, Chen Y, et al. Computational network pharmacology-based strategy to capture key functional components and decode the mechanism of Chai-Hu-Shu-Gan-San in treating depression. Front Pharmacol. 2021;12:782060. doi:10.3389/fphar.2021.782060
13. Cao YJ, Li HZ, Sun YM, et al. Integration of multi-omics in investigations on the mechanisms of action of Chinese herbal medicine interventions in metabolic diseases. Tradit Med Res. 2022;7(4):31. doi:10.53388/tmr20220117001
14. Zhang XW, Li QH, Xu ZD, Dou JJ. Mass spectrometry-based metabolomics in health and medical science: a systematic review. Rsc Adv. 2020;10(6):3092–3104. doi:10.1039/c9ra08985c
15. Licari C, Tenori L, Giusti B, et al. Analysis of metabolite and lipid association networks reveals molecular mechanisms associated with 3-month mortality and poor functional outcomes in patients with acute ischemic stroke after thrombolytic treatment with recombinant tissue plasminogen activator. J Proteome Res. 2021;20(10):4758–4770. doi:10.1021/acs.jproteome.1c00406
16. Cai Y, Rattray N, Zhang Q, et al. Tumor tissue-specific biomarkers of colorectal cancer by anatomic location and stage. Metabolites. 2020;10(6):257. doi:10.3390/metabo10060257
17. Wang M, Xu J, Yang N, Zhang T, Zhu H, Wang J. Insight into the metabolomic characteristics of post-transplant diabetes mellitus by the integrated LC-MS and GC-MS approach- preliminary study. Front Endocrinol. 2022;12:807318. doi:10.3389/fendo.2021.807318
18. Xu W, Qin X, Liu Y. Network pharmacology research of Astragali Radix in treating chronic atrophic gastritis rats based on mitochondrial metabonomics. J Chromatogr B Analyt Technol Biomed Life Sci. 2020;1145:122109. doi:10.1016/j.jchromb.2020.122109
19. Chen Z, Zheng P, Han S, et al. Tissue-specific oxidative stress and element distribution after oral exposure to titanium dioxide nanoparticles in rats. Nanoscale. 2020;12(38):20033–20046. doi:10.1039/d0nr05591c
20. Wilson ID, Theodoridis G, Virgiliou C. A perspective on the standards describing mass spectrometry-based metabolic phenotyping (metabolomics/metabonomics) studies in publications. J Chromatogr B Analyt Technol Biomed Life Sci. 2021;1164:122515. doi:10.1016/j.jchromb.2020.122515
21. Zhang K, Liu W, Song Q, et al. Integrated strategy drives direct infusion-tandem mass spectrometry as an eligible tool for shotgun pseudo-targeted metabolomics of medicinal plants. Anal Chem. 2021;93(4):2541–2550. doi:10.1021/acs.analchem.0c04602
22. Gandhi S, Chinnadurai V, Bhadra K, et al. Urinary metabolic modulation in human participants residing in Siachen: a 1H NMR metabolomics approach. Sci Rep. 2022;12(1):9070. doi:10.1038/s41598-022-13031-5
23. Yuan ZY, Li J, Zhou XJ, et al. HS-GC-IMS-based metabonomics study of Baihe Jizihuang Tang in a rat model of chronic unpredictable mild stress. J Chromatogr B Analyt Technol Biomed Life Sci. 2020;1148:122143. doi:10.1016/j.jchromb.2020.122143
24. Yan R, Jiang H, Gu S, et al. Fecal metabolites were altered, identified as biomarkers and correlated with disease activity in patients with systemic Lupus Erythematosus in a GC-MS-based metabolomics study. Front Immunol. 2020;11:2138. doi:10.3389/fimmu.2020.02138
25. He J, Chan T, Hong X, et al. Microbiome and metabolome analyses reveal the disruption of lipid metabolism in systemic lupus erythematosus. Front Immunol. 2020;11:1703. doi:10.3389/fimmu.2020.01703
26. Fan Y, Li ZM, Xi J. Recent developments in detoxication techniques for aristolochic acid-containing traditional Chinese medicines. Rsc Adv. 2020;10(3):1410–1425. doi:10.1039/c9ra08327h
27. Saresella M, Marventano I, Barone M, et al. Alterations in circulating fatty acid are associated with gut microbiota dysbiosis and inflammation in multiple sclerosis. Front Immunol. 2020;11:1390. doi:10.3389/fimmu.2020.01390
28. Saini RK, Keum YS. Omega-3 and omega-6 polyunsaturated fatty acids: dietary sources, metabolism, and significance - A review. Life Sci. 2018;203:255–567. doi:10.1016/j.lfs.2018.04.049
29. Pal S, Rendedula D, Nagendla NK, Kaliyaperumal M, Mudiam MKR, Ansari KM. Serum and urine metabolomics analysis reveals the role of altered metabolites in patulin-induced nephrotoxicity. Food Res Int. 2022;156:111177. doi:10.1016/j.foodres.2022.111177
30. Han KH, Kim B, Ji SC, et al. Mechanism of chronic kidney disease progression and novel biomarkers: a metabolomic analysis of experimental glomerulonephritis. Metabolites. 2020;10(4):169. doi:10.3390/metabo10040169
31. Su H, Liu R, Chang M, Huang J, Jin Q, Wang X. Effect of dietary alpha-linolenic acid on blood inflammatory markers: a systematic review and meta-analysis of randomized controlled trials. Eur J Nutr. 2018;57(3):877–891. doi:10.1007/s00394-017-1386-2
32. Istifli ES, Demir E, Kaplan HM, Ateş KE, Doran F. Alpha-linolenic acid confers protection on mice renal cells against cisplatin-induced nephrotoxicity. Cytotechnology. 2019;71(5):905–914. doi:10.1007/s10616-019-00333-2
33. Innes JK, Calder PC. Omega-6 fatty acids and inflammation. Prostaglandins Leukot Essent Fatty Acids. 2018;132:41–48. doi:10.1016/j.plefa.2018.03.004
34. Luo H, Gu C, Liu C, Wang Y, Wang H, Li Y. Plasma metabolic profiling analysis of Strychnos nux-vomica Linn. and Tripterygium wilfordii Hook F-induced renal toxicity using metabolomics coupled with UPLC/Q-TOF-MS. Toxicol Res. 2018;7(6):1153–1163. doi:10.1039/c8tx00115d
35. Mahmod I, Ismail IS, Alitheen NB, et al. NMR and LCMS analytical platforms exhibited the nephroprotective effect of Clinacanthus nutans in cisplatin-induced nephrotoxicity in the in vitro condition. BMC Complement Med Ther. 2020;20(1):320. doi:10.1186/s12906-020-03067-3
36. Arioka Y, Yamamoto Y, Hoshi M, et al. Pre-administration of L-tryptophan improved ADR-induced early renal failure in mice. Life Sci. 2012;91(3–4):100–106. doi:10.1016/j.lfs.2012.06.018
37. Li S, Li C, Wang W. Bile acid signaling in renal water regulation. Am J Physiol Renal Physiol. 2019;317(1):F73–F76. doi:10.1152/ajprenal.00563.2018
38. Wang YN, Hu HH, Zhang DD, et al. The Dysregulation of eicosanoids and bile acids correlates with impaired kidney function and renal fibrosis in chronic renal failure. Metabolites. 2021;11(2):127. doi:10.3390/metabo11020127
39. Liu Y, Chen X, Liu Y, et al. Metabolomic study of the protective effect of Gandi capsule for diabetic nephropathy. Chem Biol Interact. 2019;314:108815. doi:10.1016/j.cbi.2019.108815
40. Xu L, Zhang Y, Zhang P, et al. Integrated metabolomics and network pharmacology strategy driven active traditional Chinese medicine ingredients discovery for the alleviation of cisplatin nephrotoxicity. Chem Res Toxicol. 2019;32(12):2411–2421. doi:10.1021/acs.chemrestox.9b00180
41. Schoemaker MH, Conde de la Rosa L, Buist-Homan M, et al. Tauroursodeoxycholic acid protects rat hepatocytes from bile acid-induced apoptosis via activation of survival pathways. Hepatology. 2004;39(6):1563–1573. doi:10.1002/hep.20246
42. Abd-Elhamid TH, Elgamal DA, Ali SS, et al. Reno-protective effects of ursodeoxycholic acid against gentamicin-induced nephrotoxicity through modulation of NF-kappa B, eNOS and caspase-3 expressions. Cell Tissue Res. 2018;374(2):367–387. doi:10.1007/s00441-018-2886-y
43. He T, Liu J, Wang X, Duan C, Li X, Zhang J. Analysis of cantharidin-induced nephrotoxicity in HK-2 cells using untargeted metabolomics and an integrative network pharmacology analysis. Food Chem Toxicol. 2020;146:111845. doi:10.1016/j.fct.2020.111845
44. Guan T, Xin Y, Zheng K, et al. Metabolomics analysis of the effects of quercetin on renal toxicity induced by cadmium exposure in rats. Biometals. 2021;34(1):33–48. doi:10.1007/s10534-020-00260-2
45. Qu X, Gao H, Sun J, et al. Identification of key metabolites during cisplatin-induced acute kidney injury using an HPLC-TOF/MS-based non-targeted urine and kidney metabolomics approach in rats. Toxicology. 2020;431:152366. doi:10.1016/j.tox.2020.152366
 © 2023 The Author(s). This work is published and licensed by Dove Medical Press Limited. The
full terms of this license are available at https://www.dovepress.com/terms
and incorporate the Creative Commons Attribution
- Non Commercial (unported, 3.0) License.
By accessing the work you hereby accept the Terms. Non-commercial uses of the work are permitted
without any further permission from Dove Medical Press Limited, provided the work is properly
attributed. For permission for commercial use of this work, please see paragraphs 4.2 and 5 of our Terms.
© 2023 The Author(s). This work is published and licensed by Dove Medical Press Limited. The
full terms of this license are available at https://www.dovepress.com/terms
and incorporate the Creative Commons Attribution
- Non Commercial (unported, 3.0) License.
By accessing the work you hereby accept the Terms. Non-commercial uses of the work are permitted
without any further permission from Dove Medical Press Limited, provided the work is properly
attributed. For permission for commercial use of this work, please see paragraphs 4.2 and 5 of our Terms.