
Back to Journals » Nature and Science of Sleep » Volume 17

Impaired Topological Architecture of Structural Brain Networks in Obstructive Sleep Apnea: A DTI Study
Authors Zhao Y, Shi X, Shen G, Zhang H, Xu Y, Gao J, Zhao Z, Chen M, Zhang W, Huang G, Yao Z, Zhao L 
Received 22 May 2025
Accepted for publication 13 October 2025
Published 20 November 2025 Volume 2025:17 Pages 3003—3014
DOI https://doi.org/10.2147/NSS.S542235
Checked for plagiarism Yes
Review by Single anonymous peer review
Peer reviewer comments 3
Editor who approved publication: Dr Marco Veneruso
Yiwei Zhao,1,2,* Xuerong Shi,3,* Guo Shen,2,4,* Huiyan Zhang,2,4 Yanan Xu,1,2 Jing Gao,1,2 Ziyang Zhao,3 Miao Chen,3 Wenwen Zhang,2 Gang Huang,2 Zhijun Yao,3 Lianping Zhao2
1The First Clinical Medical College, Gansu University of Traditional Chinese Medicine (Gansu Provincial Hospital), Lanzhou, 730000, People’s Republic of China; 2Department of Radiology, Gansu Provincial Hospital, Lanzhou, 730000, People’s Republic of China; 3Gansu Provincial Key Laboratory of Wearable Computing, School of Information Science and Engineering, Lanzhou University, Lanzhou, 730000, People’s Republic of China; 4School of Clinical Medicine, Ningxia Medical University, Yinchuan, 750000, People’s Republic of China
*These authors contributed equally to this work
Correspondence: Lianping Zhao, Department of Radiology, Gansu Provincial Hospital, Lanzhou, 730000, People’s Republic of China, Email [email protected] Zhijun Yao, Gansu Provincial Key Laboratory of Wearable Computing, School of Information Science and Engineering, Lanzhou University, Lanzhou, 730000, People’s Republic of China, Email [email protected]
Objective: Obstructive sleep apnea (OSA) has been associated with alterations in white-matter integrity. However, few studies have examined topological alterations of white-matter structural networks in OSA. We aimed to investigate alterations in brain structural networks in patients with OSA using diffusion tensor imaging (DTI) combined with the network-based statistic (NBS).
Methods: Clinical, neuropsychological, and DTI data were collected from 77 patients with OSA and 83 healthy controls (HCs). DTI-based structural networks were established based on whole-brain probabilistic tractography. The inter-group difference in topological properties was compared. NBS analysis was performed to assess changes in network connectivity, and the correlation between topological properties and clinical variables was evaluated.
Results: Graph theory analysis showed reduced betweenness centrality (BC) in the left dorsolateral superior frontal gyrus (SFGdor.L) and supplementary motor area (SMA.L) and reduced nodal efficiency (NE) of the SFGdor.L in patients with OSA. NBS analysis revealed abnormalities in a sub-network with 14 nodes, where positive connectivity was observed between individual nodes in patients with OSA. Pearson correlation analysis indicated that the BC of SMA.L was positively correlated with anxious (r = 0.242, P = 0.034) and cognitive (r = 0.252, P = 0.027) scores. Compared with HCs, Patients with OSA exhibited lower cognitive scores and higher levels of depression and anxiety.
Conclusion: Our findings show alterations in BC and NE of the SFGdor.L and BC of the SMA.L that may reflect neurobiological features of white-matter network disruption in OSA and could represent potential imaging biomarkers of early cerebral involvement. These results are correlational and longitudinal studies are needed to determine temporal relationships and causal effects.
Keywords: obstructive sleep apnea, cognitive function, diffusion tensor imaging, network-based statistic, graph theory analysis, structural brain networks
Introduction
Obstructive sleep apnea (OSA) is a prevalent sleep disorder characterized by partial or complete collapse of the upper airway, leading to reduced airflow, intermittent hypoxia, sleep fragmentation, and daytime sleepiness.1 The prevalence of OSA in adults ranges from 9% to 38%, with an increased likelihood among older individuals.2 Long-term OSA is associated with various complications, including hypertension, diabetes, metabolic syndrome, and cardiovascular diseases.3,4 Furthermore, it poses an elevated risk for cognitive impairments, primarily manifesting as memory loss, diminished executive function, and inattention, which are significant risk factors for Alzheimer’s disease.5 Therefore, it is highly significant to investigate the potential neuropathological mechanisms of OSA and to identify potential biomarkers associated with early cognitive impairment related to OSA.
Recent studies have also highlighted the impact of OSA on the brain structure. Previous neuroimaging studies have shown that structural alterations in the brainstem and frontotemporal lobes disrupt neural function, thereby aggravating cognitive impairment in patients with OSA.6,7 In addition, compared with healthy volunteers, patients with OSA exhibit hippocampal atrophy and a reduction in gray-matter volume within the hippocampus and parahippocampal gyrus.8 These findings suggest that microstructural brain impairments may affect neural activity across the central autonomic functional network. Accumulating neuroimaging evidence indicates that microstructural brain alterations associated with OSA are linked to deficits in cognitive performance, depressive symptoms, and memory.9–11However, the specific changes in brain structural networks remain elusive.
Diffusion tensor imaging (DTI) is a relatively new magnetic resonance (MR) technology that allows for non-invasive examination of the microstructure, morphology, and function of white matter fibers at cellular and molecular levels. It measures the diffusion of water molecules to reflect changes in the microstructure of local white matter.12,13 Previous DTI studies have demonstrated significant changes in white matter integrity in patients with OSA, particularly in the cingulate gyrus, temporal lobe, parietal lobe, corona radiata, corpus callosum, and internal capsule. These microstructural abnormalities show significant associations with disease severity, neuroinflammatory indices, and performance on cognitive tests of memory and executive function.14–16Our previous study found that integrated DTI with resting-state functional MRI have assessed the coupling between structural and functional connectivity in patients with OSA, demonstrating that the SC-FC bandwidth is diminished within the default mode network, visual network, and sensorimotor network.17 However, these studies primarily focused on abnormalities in the white matter integrity. At present, it remains unclear whether there are abnormalities in the brain structural network of patients with OSA.
DTI is a widely used technique for reconstructing the main white matter tracts in the brain, allowing for the assessment of the structural brain network. To further delineate the topological attributes of these structural networks, we subsequently applied graph-theoretical network analysis. Graph-theoretical network analysis can quantify brain network integration, segregation, and hub organization in OSA. These metrics reveal distributed dysfunction that regional analyses miss and provide a better understanding of brain functions and internal information transmission mechanisms.18 Prior research has identified disease-specific network signatures in conditions such as Alzheimer’s disease, epilepsy, and schizophrenia, which may manifest prior to observable structural degeneration. Applying this methodology to OSA may reveal potential alterations in network information-transfer efficiency and compensatory mechanisms that conventional structural metrics fail to capture. Graph-theoretical network analysis offers the possibility of identifying biomarkers for early detection, monitoring treatment efficacy, and conducting systems-level evaluations of brain dysfunction.19–21 Previous studies have utilized graph theory analysis to examine the functional brain networks of patients with OSA and found that patients with OSA exhibited highly efficient “small world” network properties, but the integration efficiency of the entire brain functional network was markedly diminished.22,23 Currently, there is a dearth of studies utilizing graph theory analysis to investigate the brain structural connectivity of patients with OSA.
Therefore, we constructed brain structural networks in two groups using graph theory analysis and then compared their differences in topological properties. Network-based statistic (NBS) was used to assess alterations in structural connectivity in patients with OSA. We hypothesized that (1) Patients with OSA would exhibit abnormal topological properties and structural connectivity; (2) these alterations are associated with clinical variables or neuropsychological scores.
Methods
Subjects
A total of 86 patients with untreated OSA who were diagnosed at the Sleep Medicine Center of Gansu Provincial Hospital were recruited. Meanwhile, 88 healthy controls (HCs) were recruited through advertisements, matching their gender, age, and education level with the patients with OSA. Neuropsychological scale scores were assessed for all participants, including the Epworth Sleepiness Scale (ESS), Insomnia Severity Index (ISI), Pittsburgh Sleep Quality Assessment (PSQI), Montreal Cognitive Assessment Scale (MoCA), Hamilton Anxiety Scale (HAMA), and Hamilton Rating Scale for Depression (HRSD). These assessments were conducted by clinicians with specialty training in the neuropsychological scale assessment. The study protocol was reviewed and approved by the ethics committee of Gansu Provincial Hospital (2017–319). In, addition, all participants willingly participated in the study and signed an informed consent form. This study was conducted in accordance with the Declaration of Helsinki.
The inclusion criteria for the OSA group were consistent with the diagnostic criterion for OSA based on the American Academy of Sleep Medicine [Manual for the Scoring of Sleep and Associated Events: Rules, Terminology and Technical Specifications: version 2.3 (2017 Edition)], with apnea hypoventilation index>5 breaths/h. The inclusion criteria for the HCs group were: participants needed to have no chronic sleep snoring and no significant daytime sleepiness, as verified by a family member or partner, with scores of ESS < 7, PSQI < 6, ISI < 8, MoCA ≥ 26, HAMA < 7, and HAMD-24 < 7; All participants in both groups were Han Chinese, right-handed, with at least an elementary school education, and aged between 18 and 70 years.
Exclusion factors included a combination of other sleep disorders, heart disease, mental illness, being left-handed, brain trauma, a history of alcohol, drug, and psychotropic substance abuse, the presence of organic cranial lesions, and contraindications to MR imaging scans. The exclusion criteria for HCs were similar to those for the OSA group.
The OSA group was instructed to abstain from consuming any sleep-disrupting beverages, such as tea, coffee, or alcohol, for 24 hours before undergoing sleep monitoring. The total duration of monitoring was at least 8 hours. The measurement started at a time determined based on the subject’s sleep habits. In addition, the patients with OSA have received full-night polysomnography (PSG) (Australian Compumedics-greal), and all the collected data were interpreted by a qualified physician.
MR Data Acquisition
The images were obtained using a 3.0T superconducting MR machine (MAGNETOM Skyra, Siemens Healthcare, Erlangen, Germany) and a 32-channel phased array surface head coil. During scanning, participants were instructed to lie as relaxed and flat as possible to minimize thinking activities, and a sponge pad was used to reduce head movement. DTI data were acquired using a spin-echo echo planar imaging sequence with the following parameters: repetition time = 11300 ms; echo time = 85 ms; slice thickness = 3.5 mm; matrix size = 224 × 224; field-of-view = 224×224 mm2; voxel size = 2 × 2×2.5mm3; 65 gradient encoding directions; and two b values (b=0/1000 s/mm2).
MR Data Preprocessing
DTI data were processed using the PANDA toolbox with default parameters (http://www.nitrc.org/projects/panda).24 The following steps were taken: first, brain masks were created from the b0 image without diffusion weighting using the Oxford FMRIB Software Library (FSL) Brain Extraction Tool; second, each diffusion-weighted image was registered to the b0 image using an affine transformation to correct the eddy current-induced distortions and simple head-motion artifacts, and then diffusion-weighted images were co-registered to T1-weighted images; third, the diffusion tensor model was fitted to each voxel. The voxel-wise maps of the tensor matrix and the DTI metrics were calculated. The fractional anisotropy (FA) image for each local space was then nonlinearly aligned. Finally, the resulting warping transform was applied to resample the FA image into the Montreal Neurological Institute (MNI) space.
Structural Network Construction
A probabilistic fiber-tracing approach was used to construct structural networks. The entire gray matter was divided into 90 regions of interest (ROIs), based on the automated anatomical labeling (AAL) atlas. FSL-based probabilistic tractography was employed to calculate the probabilistic fiber tracking between each pair of ROIs. This was done by seeding from all voxels of each brain ROI. Two-way calculations were performed, from region j to region i and from i to j, and the mean of the two calculations was considered as the connection strength for each pair of ROIs. Subsequently, a whole-brain network was constructed for all participants.
Threshold Selection
The network sparsity for each subject was calculated without threshold treatment (actual network edges/all possible edges). To address false-positive connections in the structural connection matrix, we applied a proportional threshold treatment.25 This treatment assumed that any observed differences between groups were attributable to variations in the topology of edges rather than variations in the number of edges. We examined whether there were overall structural connectivity differences between the two groups. However, different thresholds may produce differences between OSA and HCS groups; thus, the minimum value of network cost for all subjects was chosen as the upper limit (Tmax) for the proportional thresholding process.26 Therefore, the sparsity of the network in this study ranged from 0.05 to 0.09 with a step size of 0.01.
Network Properties
In graph theory analysis, the brain is represented as a network of vertices (nodes or brain regions) and edges (connections between regions), which can measure different aspects of global and local network indicators. Low characteristic path length (Lp) represents high network integration.27 Global efficiency and local efficiency are used to measure the effectiveness of network information transmission.28 Betweenness centrality (BC) is used to measure the ability of a node to connect different nodes within a network. High BC plays a crucial role in the overall connectivity of the network.29 Nodal efficiency (NE) and nodal local efficiency (NLE) refer to the efficiency of a node’s parallel information transmission capability within the network. Degree centrality (DC) is used to quantify the level of connection and influence of a node in a network. The topological parameters of the structural network were calculated using the GRETNA toolbox (https://www.nitrc.org/projects/gretna).30 The global metrics included small-world parameters: small-worldness (σ), clustering coefficient (Cp), and Lp, and network efficiency parameters: global efficiency and local efficiency.31 Nodal metrics, such as NE, BC, DC, and NLE, were employed to evaluate the communication capability of individual brain nodes within the network. The precise definitions of these metrics can be found in the comprehensive work of Rubinov and Sporns.31
Statistical Analysis
Hypothesis tests were conducted on structural connectivity networks using the NBS method described by Zalesky et al32 which was implemented in the NBS Toolbox for MATLAB R2018. The NBS method is commonly used to test differences in brain network connections. Firstly, a two-sample t-test was performed on each connection in the network, resulting in a matrix of test statistics. Secondly, a threshold of 2.35 was set, and connections above this threshold were retained. Breadth-first search was then used to identify the connected components and the number of edges in each component was calculated. The degrees of freedom for this study were 158. Thirdly, to obtain an empirical estimate of the null distribution of the size of the largest connected components, the permutation test method was used to recalculate the test statistic of each connection and the size of the largest connected components. This process was repeated 10,000 times. Finally, the P-value of each connected component was corrected using the null distribution. A P-value of less than 0.05 denoted a significant between-group difference. Statistical analyses were performed using IBM SPSS statistical software. A chi-square test was performed to compare gender differences between the two groups. Two-sample t-tests were used to analyze between-group differences in age, education, HAMA, HRSD, ESS, PSQI, ISI, and MoCA scores, and AHI values, and P values less than 0.05 were considered statistically significant. Pearson correlation analysis was employed to assess the relationship between node pairs with altered connectivity in the NBS analysis32 and HRSD, HAMA, MoCA, and sleep-related scale scores in patients with OSA. Additionally, within the OSA group, associations between PSG indices and nodal network metrics were examined using two-tailed Spearman’s rank correlation (rho).
Results
Demographic Data, Clinical Characteristics, and Neuropsychological Tests
Five patients with OSA and 3 HCs were excluded due to pretreatment failure, and an additional 4 patients with OSA and 2 HCs were excluded due to incomplete data. A total of 160 subjects were included in the final analysis, with 77 subjects in the OSA group and 83 in the HCs group. No significant statistical differences were found between the two groups in terms of sex, age, and years of education. MoCA scores were lower and the HRSD and HAMA scores were higher in the OSA group compared with the HCs group. Additionally, sleep-related scores such as ESS, PSQI, and ISI were higher in the OSA group compared with the HCs group (Table 1).
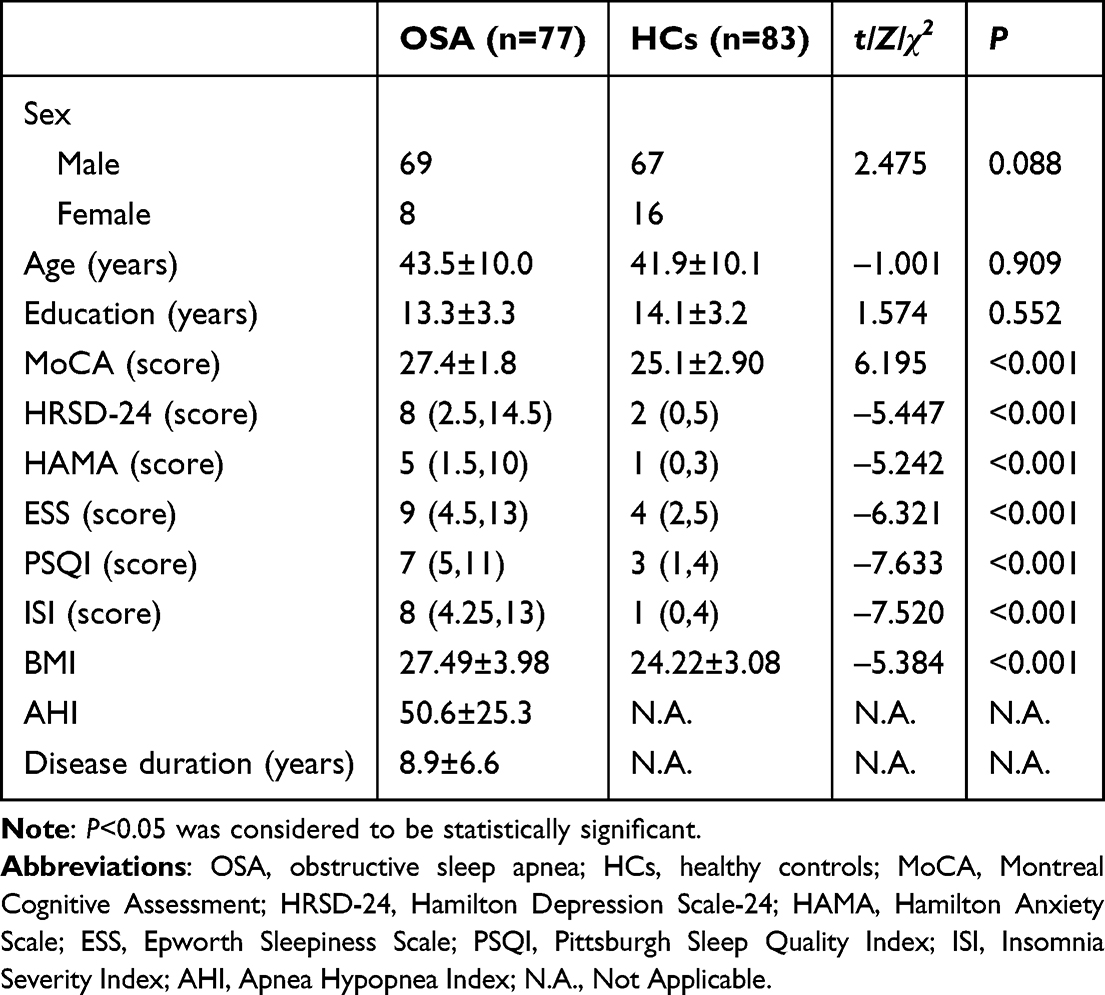 |
Table 1 Demographic Data, Clinical Characteristics, and Neuropsychological Tests Scores of OSA and HCs Groups |
Global and Local Graph Metrics Analysis
Two-sample t-tests were conducted to identify significant differences between the two groups in the global parameters of the whole-brain anatomical networks. It was found that both groups exhibited small-world properties (σ>1). However, the differences in the global network properties were not statistically significant in two groups (P = 0.630 for normalized average Cp, P = 0.645 for normalized Lp, P = 0.366 for small-worldness, P = 0.769 for global efficiency, P = 0.676 for local efficiency). Network nodal metrics revealed reduced BC in the left dorsolateral superior frontal gyrus (SFGdor.L) and left supplementary motor area (SMA.L) and reduced NE in the SFGdor.L in the OSA group compared with the HCs group (Figure 1). To further analyze the regional differences in network topology between patients with OSA and HCs, we compared the network nodal metrics at a sparsity threshold of 0.05–0.09. The results showed that the DC of the right angular gyrus, right cuneate lobe, and left superior occipital gyrus increased and the DC of SFGdor.L and SMA.L decreased in OSA patients. Moreover, patients with OSA exhibited reduced NE in several brain regions, including the right anterior cingulate gyrus, paracingulate gyrus, left orbitofrontal inferior gyrus, right middle frontal gyrus, bilateral SFGdor, and SMA.L. However, the NE of the right angular gyrus increased. Additionally, the NLE of the right calcarine gyrus was also found to be increased in Patients with OSA (Figures 2–4).
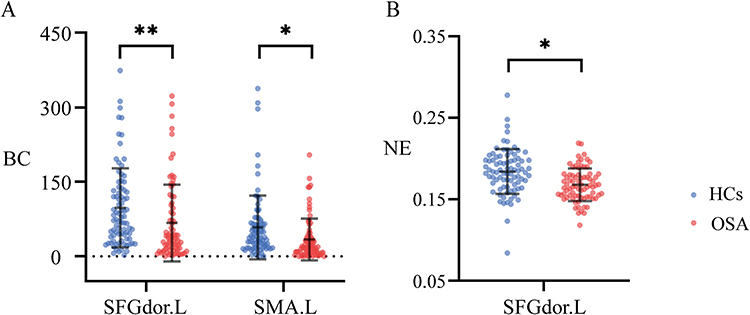 |
Figure 1 Comparison of unthresholded connectivity networks in whole brain structural connectivity of OSA and HCs groups. (A). The BC of SFGdor.L and SMA.L decreased in OSA group. (B). The NE of SFGdor.L decreased in OSA group. Abbreviations: OSA, Obstructive sleep apnea; HCs, healthy controls; BC, betweenness centrality; NE, nodal efficiency; SFGdor.L, left dorsolateral superior frontal gyrus; SMA.L, left of supplementary motor area. Notes: *Means significant level P<0.05; **means significant level P<0.001. |
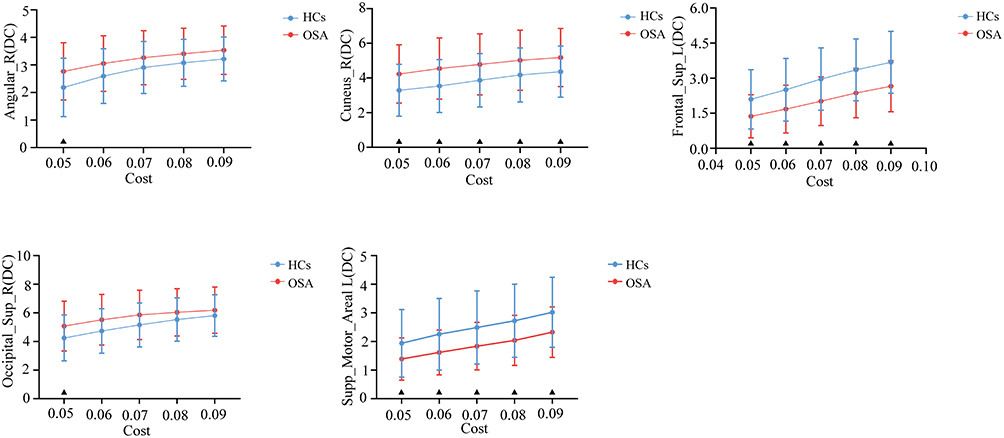 |
Figure 2 At a sparsity threshold of 0.05–0.09, comparison of DC in OSA and HCs groups. Abbreviations: OSA, Obstructive sleep apnea; HCs, healthy controls; DC, degree centrality; ANG.R, right angular gyrus; CUN.R, right cuneus; SFGdor.L, left superior frontal gyrus, dorsolateral; SOG.R, right superior occipital gyrus; SMA.L, left supplementary motor area. Note: ▲means significant level P<0.05. |
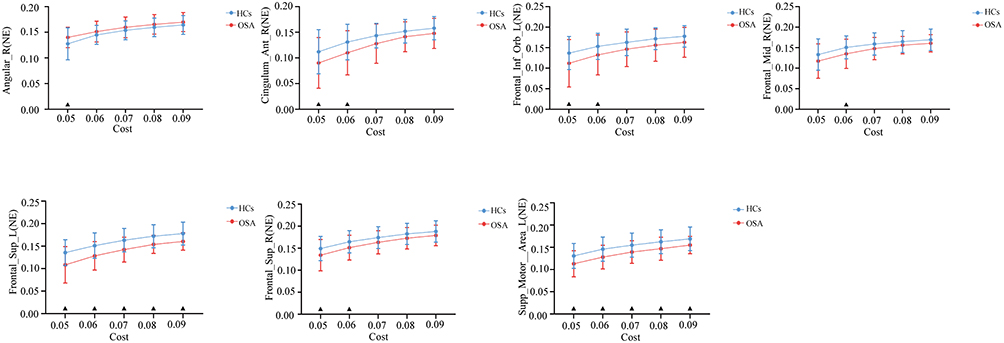 |
Figure 3 At a sparsity threshold of 0.05–0.09, comparison of NE in OSA and HCs groups. Abbreviations: OSA, Obstructive sleep apnea; HCs, healthy controls; NE, nodal efficiency; ANG.R, right angular gyrus; ACG.R, right anterior cingulate and paracingulate gyrus; ORBinf.L, left inferior frontal gyrus, orbital part; MFG.R, right middle frontal gyrus; SFGdor.L, left superior frontal gyrus, dorsolateral; SFGdor.R, right superior frontal gyrus, dorsolateral; SMA.L, left supplementary motor area. Note: ▲means significant level P<0.05. |
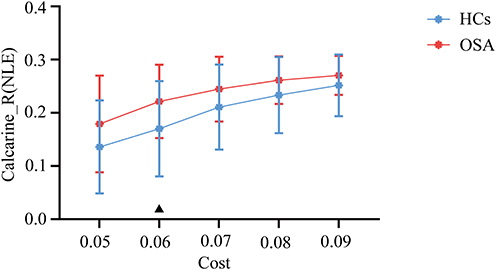 |
Figure 4 At a sparsity threshold of 0.05–0.09, comparison of NLE in OSA and HCs groups. Abbreviations: OSA, Obstructive sleep apnea; HCs, healthy controls; NLE, nodal local efficiency; CAL.R, right calcarine. Note: ▲means significant level P<0.05. |
OSA-Related Alteration in Network Connectivity
Based on the NBS, a sub-network containing 14 nodes and 15 connections was identified (Figure 5). These nodes were distributed in the bilateral precentral gyrus, bilateral dorsolateral superior frontal gyrus, left orbital superior frontal gyrus, bilateral middle frontal gyrus, left opercular inferior frontal gyrus, left orbital inferior frontal gyrus, left olfactory, right medial superior frontal gyrus, left caudate nucleus, left postcentral gyrus, right anterior cingulate and paracingulate gyrus, and each node was positively concentrated.
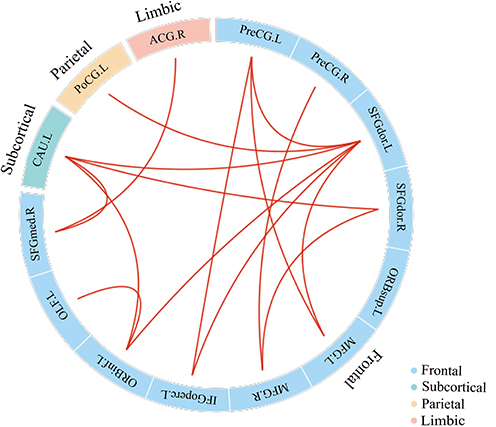 |
Figure 5 Network-based statistics analysis finds a sub-network containing 14 nodes and 15 increased connections in OSA groups compared to HCs. Abbreviations: OSA, Obstructive sleep apnea; HCs, healthy controls; PreCG.L, left precentral gyrus; PreCG.R, right precentral gyrus; SFGdor.L, left dorsolateral superior frontal gyrus; SFGdor.R, right dorsolateral superior frontal gyrus; ORBsup.L, orbital superior frontal gyrus; MFG.L, left middle frontal gyrus; MFG.R, right middle frontal gyrus; IFGoperc.L, left opercular inferior frontal gyrus; ORBinf.L, left orbital inferior frontal gyrus; OLF.L, left olfactory; SFGmed.R, right medial superior frontal gyrus; CAU.L, left caudate nucleus; PoCG.L, left postcentral gyrus; ACG.R, right anterior cingulate and paracingulate. |
Relationships Between Network Metrics and Cognitive and Clinical Variables
Furthermore, we explored the relationship between brain network nodal metrics and cognitive and clinical variables. The results revealed a positive correlation between the BC of SMA.L and MoCA and HAMA scores (r = 0.252, FDR-corrected P = 0.027; r = 0.242, FDR-corrected P = 0.034) (Figure 6). However, no correlation was found between other brain network indicators and cognitive scores or clinical variables. Additionally, within the OSA group, no significant associations were observed between PSG indices and nodal network metrics after FDR correction. P-values for all metrics were corrected using the Benjamini–Hochberg procedure for controlling the false discovery rate.
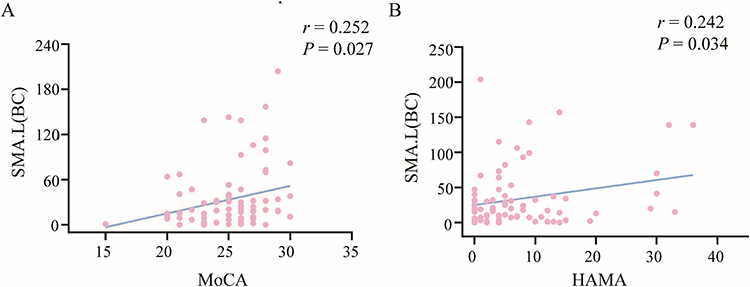 |
Figure 6 Correlations between network metrics and cognitive and clinical variables. (A). The BC of SMA.L was positively correlated with MoCA in OSA group. (B). The BC of SMA.L was positively correlated with HAMA in OSA group. Abbreviations: OSA, Obstructive sleep apnea; BC, betweenness centrality; SMA.L, left supplementary motor area; MoCA, Montreal Cognitive Assessment Scale; HAMA, Hamilton Anxiety Rating Scale. |
Discussion
The current study applied graph theory analysis methods combined with NBS to investigate the topological properties of structural brain networks in patients with OSA. The three main findings were as follows: (1) The BC and NE of SFGdor.L and the BC of SMA.L were significantly decreased, and the BC of SMA.L was significantly positively correlated with cognitive and anxious scores. (2) NBS analysis showed abnormalities in the sub-network regional connectivity of 14 specific brain regions. (3) Patients with OSA exhibited lower cognitive scores and higher depressive and anxious scores.
The present study found significant differences in some network nodal metrics between patients with OSA and HCs. Specifically, differences were detected in the SFGdor.L and SMA.L regions. These topological distinctions remained consistent even when analyzing the thresholdless network and accounting for overall connectivity. Therefore, differences in brain structural connectivity in patients with OSA were not solely due to proportional thresholds. The SFGdor.L region located in the superior prefrontal cortex and part of the frontoparietal network plays a crucial role in emotional regulation and cognitive functions.33,34 Our findings showed that patients with OSA exhibited decreased BC and NE in the SFGdor.L, suggesting a weakened connection between this brain area and other regions, as well as a reduction in information transmission ability. A previous study used graph theory analysis method to investigate the characteristic decentralization of the SFGdor.L in patients with depression34 and found that this decentralization was linked to impaired function of the frontoparietal cortex network and reduced ability for emotional and cognitive regulation. However, our study found no correlations between abnormal network indicators of SFGdor.L and clinical variables or neuropsychological scales, and thus large sample size is needed to further validate these results.
Interestingly, we observed a reduction in the BC of the SMA.L in OSA patients in the current study. The SMA is in the front of the cerebral cortex adjacent to the motor cortex and motor execution area. It can be divided into the posterior area, which serves motor-related functions, and the anterior area, which is involved in higher-order cognitive control mechanisms.35 The SMA serves as the central component of the sensorimotor network in the brain.36 We observed a reduction in the BC of the SMA.L in patients with OSA. This suggested a decreased connectivity of this region within the sensorimotor network, leading to impaired motor and cognitive function. Previous studies also reported a decrease in the regional homogeneity of the SMA in patients with OSA, indicating abnormal spontaneous brain activity in this specific brain region, which supports the results of the present study. Relevant studies had shown that structural abnormalities in the SMA may be linked to the progression of OSA. These abnormalities can induce atonia of the genioglossus and other upper-airway dilator muscles, thereby exacerbating airway collapse and worsening OSA severity.37,38 Furthermore, our study revealed a positive correlation between the BC of SMA.L in OSA patients and both HAMA and MoCA scores. A clinical study showed that motor cortex are affected even in the initial stages of Alzheimer’s disease. 39 For example, one study reported that individuals with mild cognitive impairment and Alzheimer’s disease experienced significant disruptions in fine motor skills compared to those without dementia.40 In conclusion, motor cortical impairment is an important neuropathological feature of neurodegenerative conditions such as Alzheimer’s disease and mild cognitive impairment. Our findings suggest that SMA.L plays a significant role in the emotional and cognitive function of patients with OSA, offering a potential neuropathophysiological mechanism for brain injury in this population. In addition, the observed network-level alterations may serve as candidate imaging markers for risk stratification, enabling the identification of the patient with OSA who is at high risk of cognitive impairment and informing individualized assessment and rehabilitation strategies, although their clinical utility requires validation in prospective studies. Despite known links between intermittent hypoxemia and neural function, no PSG–network associations survived FDR correction. Several factors may account for these null findings: restricted between-subject variability of PSG indices in our sample, the relatively small sample size, and the possibility that graph metrics index trait-like network reorganization that is not fully captured by a single-night PSG assessment.
NBS was employed to study differences in structural connectivity between two groups and the results showed increased connections between certain subregions, especially in the default network. The default network refers to a network of brain regions that continues to perform specific functional activities during the resting state of the human brain. It is associated with monitoring the internal and external environment, processing emotions, situational memory, and cognition.41–43 Previous studies found that patients with OSA exhibited reduced functional connectivity in the default network.44 Furthermore, abnormalities in the topological properties of the default network, such as Cp, local efficiency, and node centralities, have also been reported.22,44 The current study showed that patients with OSA exhibited an enhanced structural connectivity between subregions of the default network, which might serve as a compensatory adaptation. Such strengthened within‑DMN coupling may support internally oriented cognition and memory processes when frontal hub efficiency is reduced. Nevertheless, greater within‑DMN integration can bias network dynamics toward internal processing at the cost of flexible frontoparietal contro, potentially contributing to anxiety and subtle cognitive inefficiencies in OSA.42,43 These results indicated that there was a reorganization and readjustment of brain networks in patients with OSA. However, the exact mechanism underlying these compensatory changes remains unclear. Further research should prioritize investigating the alterations in the brain network of patients with OSA to gain a better understanding of the underlying mechanism of brain damage in this population.
The assessment of the demographic and clinical variables of all participants revealed significant findings. Patients with OSA exhibited varying degrees of cognitive decline and were at risk of depression and anxiety compared with HCs. According to a recent comprehensive analysis, approximately 35% of patients with OSA experienced symptoms of depression, while about 32% exhibited symptoms of anxiety.45 These symptoms may be attributed to various factors, including daytime sleepiness, sleep quality, intermittent hypoxia, and structural damage to the hippocampus.46,47 Previous research has indicated that approximately 27% of patients with OSA have mild cognitive impairment.48 Sleep plays a crucial role in neurogenesis, synapse formation, and memory consolidation and formation, with various aspects such as sleep continuity, slow wave sleep, rapid eye movement sleep, and sleep spindles contributing to these processes.49 Hence, long-term OSA characterized by intermittent hypoxia and changes in the sleep structure can lead to neurodegeneration in the brain and subsequent cognitive decline. Intermittent hypoxemia, which was believed to contribute to cognitive impairment in patients with OSA,50,51 may be associated with oxidative stresses, such as increased production of reactive oxygen species and angiogenesis, activation of sympathetic nerves, and systemic and vascular inflammation, and may further precipitate neuroinflammation and hypoxia‑induced remodeling of the neurovascular unit and white matter.52–54
However, this study has some limitations. Firstly, the findings may have limited generalizability due to the cross-sectional design of the study. Thus, future studies should include longitudinal designs to observe changes in brain structural connectivity before and after treatment. Secondly, the healthy volunteers did not undergo sleep monitoring. There is no assurance that the healthy controls were completely free of mild OSA, despite the implementation of strict inclusion and exclusion criteria. Finally, due to the limited number of subjects, subgroup studies could not be conducted, which warrants further exploration with large sample sizes.
Conclusion
Using DTI-based structural networks with graph theory analysis and NBS, we found selective disruption of frontal hub properties in OSA—reduced BC in SFGdor.L and SMA.L and reduced NE in SFGdor.L—together with an NBS-identified subnetwork of strengthened fronto–sensorimotor/default network connections, while global small‑world properties and network efficiency were preserved; within OSA, SMA.L BC correlated positively with MoCA and HAMA, whereas no associations between PSG indices and nodal metrics survived FDR. These results indicate focal hub vulnerability with network‑level reorganization and identify candidate early imaging biomarkers that may support risk stratification for cognitive decline and complement clinical/neuropsychological assessments; however, given the cross‑sectional design, sample size, and single‑night PSG, validation in longitudinal and interventional cohorts with external replication is required to establish temporal and causal relationships and evaluate clinical utility.
Data Sharing Statement
The data are available from the corresponding authors upon reasonable request.
Ethics Approval and Informed Consent
The study protocol was reviewed and approved by the ethics committee of Gansu Provincial Hospital (2017-319). In addition, all participants willingly participated in the study and signed an informed consent form. This study was conducted in accordance with the Declaration of Helsinki. Registered in the Chinese Clinical Trial Registry titled Neuroimaging Changes and Mechanisms of Sleep Disorders (ChiCTR1900021346). URL: https://www.chictr.org.cn/showproj.html?proj=35241
Acknowledgments
The authors are grateful to all the volunteers who participated in this study. The authors also greatly appreciate the support to this study of the Sleep Medicine Center and Radiology of Gansu Provincial Hospital. In addition, the authors thank the tutor and every member of the research team for their suggestions and support.
Author Contributions
Guo Shen: Investigation; Data curation; Writing – original draft; Xuerong Shi: Software; Formal analysis; Writing – original draft; Yiwei Zhao: Investigation; Data curation; Writing – review & editing; Huiyan Zhang: Investigation; Resources; Data curation; Writing – original draft; Yanan Xu: Investigation; Resources; Data curation; Writing – original draft; Jing Gao: Investigation; Resources; Data curation; Writing – original draft; Ziyang Zhao: Software; Formal analysis; Writing – original draft; Miao Chen: Software; Formal analysis; Writing – review & editing; Wenwen Zhang: Investigation; Resources; Data curation; Writing – review & editing; Gang Huang: Resources; Project administration; Supervision; Writing – review & editing; Lianping Zhao: Conceptualization; Supervision; Writing – review & editing; Project administration; Funding acquisition; Zhijun Yao: Methodology; Formal analysis; Supervision; Writing – review & editing.
All authors have read and approved this paper. All authors gave final approval of the version to be published; have agreed on the journal to which the article has been submitted; and agree to be accountable for all aspects of the work.
Funding
This work was supported by the National Natural Science Foundation of China (82360343), the “Young Scholars in Western China” project of the Chinese Academy of Sciences(21JR7RA593), key research and development program of Gansu province(23YFFA0048), Project of Gansu administration of traditional Chinese medicine (GZKP-2020-36).
Disclosure
The authors report no conflicts of interest.
References
1. Liguori C, Maestri M, Spanetta M, et al. Sleep-disordered breathing and the risk of Alzheimer’s disease. Sleep Med Rev. 2021;55:101375. doi:10.1016/j.smrv.2020.101375
2. Senaratna CV, Perret JL, Lodge CJ, et al. Prevalence of obstructive sleep apnea in the general population: a systematic review. Sleep Med Rev. 2017;34:70–81. doi:10.1016/j.smrv.2016.07.002
3. Yeghiazarians Y, Jneid H, Tietjens JR, et al. Obstructive sleep apnea and cardiovascular disease: a scientific statement from the American Heart Association. Circulation. 2021;144(3):e56–e67. doi:10.1161/cir.0000000000000988
4. Gaines J, Vgontzas AN, Fernandez-Mendoza J, Bixler EO. Obstructive sleep apnea and the metabolic syndrome: the road to clinically-meaningful phenotyping, improved prognosis, and personalized treatment. Sleep Med Rev. 2018;42:211–219. doi:10.1016/j.smrv.2018.08.009
5. Shu Y, Chen L, Li K, et al. Abnormal cerebellar-prefrontal cortical pathways in obstructive sleep apnea with/without mild cognitive impairment. Front Neurosci. 2022;16:1002184. doi:10.3389/fnins.2022.1002184
6. Koo DL, Cabeen RP, Yook SH, Cen SY, Joo EY, Kim H. More extensive white matter disruptions present in untreated obstructive sleep apnea than we thought: a large sample diffusion imaging study. Human Brain Mapp. 2023;44(8):3045–3056. doi:10.1002/hbm.26261
7. Gao J, Cao J, Chen J, et al. Brain morphology and functional connectivity alterations in patients with severe obstructive sleep apnea. Sleep Medicine. 2023;111:62–69. doi:10.1016/j.sleep.2023.08.032
8. Joo EY, Tae WS, Lee MJ, et al. Reduced brain gray matter concentration in patients with obstructive sleep apnea syndrome. Sleep. 2010;33(2):235–241. doi:10.1093/sleep/33.2.235
9. Huang Y, Shen C, Zhao W, et al. Genes associated with altered brain structure and function in obstructive sleep apnea. Biomedicines. 12(1). doi:10.3390/biomedicines12010015
10. Kerner NA, Roose SP. Obstructive sleep apnea is linked to depression and cognitive impairment: evidence and potential mechanisms. Am J Geriatr Psychiatry. 2016;24(6):496–508. doi:10.1016/j.jagp.2016.01.134
11. Wu K, Gan Q, Pi Y, et al. Obstructive sleep apnea and structural and functional brain alterations: a brain-wide investigation from clinical association to genetic causality. BMC Med. 2025;23(1):42. doi:10.1186/s12916-025-03876-8
12. Waller R, Dotterer HL, Murray L, Maxwell AM, Hyde LW. White-matter tract abnormalities and antisocial behavior: a systematic review of diffusion tensor imaging studies across development. NeuroImage Clin. 2017;14:201–215. doi:10.1016/j.nicl.2017.01.014
13. Baril AA, Gagnon K, Descoteaux M, et al. Cerebral white matter diffusion properties and free-water with obstructive sleep apnea severity in older adults. Human Brain Mapp. 2020;41(10):2686–2701. doi:10.1002/hbm.24971
14. Chen HL, Huang CC, Lin HC, et al. White matter alteration and autonomic impairment in obstructive sleep apnea. J Clin Sleep Med. 2020;16(2):293–302. doi:10.5664/jcsm.8186
15. Chen HL, Lu CH, Lin HC, et al. White matter damage and systemic inflammation in obstructive sleep apnea. Sleep. 2015;38(3):361–370. doi:10.5665/sleep.4490
16. Salsone M, Caligiuri ME, Castronovo V, et al. Microstructural changes in normal-appearing white matter in male sleep apnea patients are reversible after treatment: a pilot study. J Neurosci Res. 2021;99(10):2646–2656. doi:10.1002/jnr.24858
17. Shi X, Shen G, Zhao Z, et al. Decreased structural pathways mediating functional connectivity in obstructive sleep apnea. Sleep Med. 2024;116:96–104. doi:10.1016/j.sleep.2024.02.013
18. Lee MH, Yun CH, Min A, et al. Altered structural brain network resulting from white matter injury in obstructive sleep apnea. Sleep. 2019;42(9). doi:10.1093/sleep/zsz120
19. Behfar Q, Behfar SK, von Reutern B, et al. Graph theory analysis reveals resting-state compensatory mechanisms in healthy aging and prodromal alzheimer’s disease. Front Aging Neurosci. 2020;12:576627. doi:10.3389/fnagi.2020.576627
20. Falsaperla R, Vitaliti G, Marino SD, et al. Graph theory in paediatric epilepsy: a systematic review. Dialogues Clin Neurosci. 2021;23(1):3–13. doi:10.1080/19585969.2022.2043128
21. Filippi M, van den Heuvel MP, Fornito A, et al. Assessment of system dysfunction in the brain through MRI-based connectomics. Lancet Neurol. 2013;12(12):1189–1199. doi:10.1016/s1474-4422(13)70144-3
22. Chen LT, Fan XL, Li HJ, et al. Aberrant brain functional connectome in patients with obstructive sleep apnea. Neuropsychiatric Dis Treatment. 2018;14:1059–1070. doi:10.2147/ndt.S161085
23. Park B, Palomares JA, Woo MA, et al. Disrupted functional brain network organization in patients with obstructive sleep apnea. Brain and Behavior. 2016;6(3):e00441. doi:10.1002/brb3.441
24. Cui Z, Zhong S, Xu P, He Y, Gong G. PANDA: a pipeline toolbox for analyzing brain diffusion images. Front Human Neurosci. 2013;7:42. doi:10.3389/fnhum.2013.00042
25. van den Heuvel MP, de Lange SC, Zalesky A, et al. Proportional thresholding in resting-state fMRI functional connectivity networks and consequences for patient-control connectome studies: issues and recommendations. NeuroImage. 2017;152:437–449. doi:10.1016/j.neuroimage.2017.02.005
26. Disselhoff V, Jakab A, Schnider B, Latal B, Wehrle FM, Hagmann CF. Inhibition is associated with whole-brain structural brain connectivity on network level in school-aged children born very preterm and at term. NeuroImage. 2020;218:116937. doi:10.1016/j.neuroimage.2020.116937
27. Watson CG, DeMaster D, Ewing-Cobbs L. Graph theory analysis of DTI tractography in children with traumatic injury. NeuroImage Clin. 2019;21:101673. doi:10.1016/j.nicl.2019.101673
28. Yun JY, Kim YK. Graph theory approach for the structural-functional brain connectome of depression. Prog Neuro Psychopharmacol Biol Psychiatry. 2021;111:110401. doi:10.1016/j.pnpbp.2021.110401
29. Lee MH, Sin S, Lee S, et al. Altered cortical structure network in children with obstructive sleep apnea. Sleep. 45(5). doi:10.1093/sleep/zsac030
30. Wang J, Wang X, Xia M, Liao X, Evans A, He Y. GRETNA: a graph theoretical network analysis toolbox for imaging connectomics. Front Human Neurosci. 2015;9:386. doi:10.3389/fnhum.2015.00386
31. Rubinov M, Sporns O. Complex network measures of brain connectivity: uses and interpretations. NeuroImage. 2010;52(3):1059–1069. doi:10.1016/j.neuroimage.2009.10.003
32. Zalesky A, Fornito A, Bullmore ET. Network-based statistic: identifying differences in brain networks. NeuroImage. 2010;53(4):1197–1207. doi:10.1016/j.neuroimage.2010.06.041
33. Marek S, Dosenbach NUF. The frontoparietal network: function, electrophysiology, and importance of individual precision mapping. Dialogues Clin Neurosci. 2018;20(2):133–140. doi:10.31887/DCNS.2018.20.2/smarek
34. Hou Z, Wang Z, Jiang W, et al. Divergent topological architecture of the default mode network as a pretreatment predictor of early antidepressant response in major depressive disorder. Sci Rep. 2016;6:39243. doi:10.1038/srep39243
35. Hertrich I, Dietrich S, Ackermann H. The role of the supplementary motor area for speech and language processing. Neurosci Biobehav Rev. 2016;68:602–610. doi:10.1016/j.neubiorev.2016.06.030
36. Liang L, Hu R, Luo X, Feng B, Long W, Song R. Reduced complexity in stroke with motor deficits: a resting-state fmri study. Neuroscience. 2020;434:35–43. doi:10.1016/j.neuroscience.2020.03.020
37. Zhou L, Shan X, Peng Y, et al. Reduced regional homogeneity and neurocognitive impairment in patients with moderate-to-severe obstructive sleep apnea. Sleep Medicine. 2020;75:418–427. doi:10.1016/j.sleep.2020.09.009
38. Li H, Li L, Kong L, et al. Frequency‑specific regional homogeneity alterations and cognitive function in obstructive sleep apnea before and after short-term continuous positive airway pressure treatment. Nature and Science of Sleep. 2021;13:2221–2238. doi:10.2147/nss.S344842
39. Vidoni ED, Thomas GP, Honea RA, Loskutova N, Burns JM. Evidence of altered corticomotor system connectivity in early-stage Alzheimer’s disease. J Neurol Phys Ther. 2012;36(1):8–16. doi:10.1097/NPT.0b013e3182462ea6
40. Yan JH, Rountree S, Massman P, Doody RS, Li H. Alzheimer’s disease and mild cognitive impairment deteriorate fine movement control. J Psychiatr Res. 2008;42(14):1203–1212. doi:10.1016/j.jpsychires.2008.01.006
41. Smallwood J, Bernhardt BC, Leech R, Bzdok D, Jefferies E, Margulies DS. The default mode network in cognition: a topographical perspective. Nat Rev Neurosci. 2021;22(8):503–513. doi:10.1038/s41583-021-00474-4
42. Kaefer K, Stella F, McNaughton BL, Battaglia FP. Replay, the default mode network and the cascaded memory systems model. Nat Rev Neurosci. 2022;23(10):628–640. doi:10.1038/s41583-022-00620-6
43. Yeshurun Y, Nguyen M, Hasson U. The default mode network: where the idiosyncratic self meets the shared social world. Nat Rev Neurosci. 2021;22(3):181–192. doi:10.1038/s41583-020-00420-w
44. Chen L, Fan X, Li H, et al. Topological reorganization of the default mode network in severe male obstructive sleep apnea. Front Neurol. 2018;9:363. doi:10.3389/fneur.2018.00363
45. Garbarino S, Bardwell WA, Guglielmi O, Chiorri C, Bonanni E, Magnavita N. Association of anxiety and depression in obstructive sleep apnea patients: a systematic review and meta-analysis. Behav. Sleep Med. 2020;18(1):35–57. doi:10.1080/15402002.2018.1545649
46. Mok Y, Melehan KL, Phillips CL, et al. Does CPAP treat depressive symptoms in individuals with OSA? An analysis of two 12-week randomized sham CPAP-controlled trials. Sleep Medicine. 2020;73:11–14. doi:10.1016/j.sleep.2020.04.021
47. Bjorvatn B, Rajakulendren N, Lehmann S, Pallesen S. Increased severity of obstructive sleep apnea is associated with less anxiety and depression. Journal of Sleep Research. 2018;27(6):e12647. doi:10.1111/jsr.12647
48. Mubashir T, Abrahamyan L, Niazi A, et al. The prevalence of obstructive sleep apnea in mild cognitive impairment: a systematic review. BMC Neurol. 2019;19(1):195. doi:10.1186/s12883-019-1422-3
49. Gosselin N, Baril AA, Osorio RS, Kaminska M, Carrier J. Obstructive sleep apnea and the risk of cognitive decline in older adults. Am J Respir Crit Care Med. 2019;199(2):142–148. doi:10.1164/rccm.201801-0204PP
50. Ravindran S, Kurian GA. Addressing the alterations in cerebral ischemia-reperfusion injury on the brain mitochondrial activity: a possible link to cognitive decline. Biochem. Biophys. Res. Commun. 2019;518(1):100–106. doi:10.1016/j.bbrc.2019.08.014
51. Dewan NA, Nieto FJ, Somers VK. Intermittent hypoxemia and OSA: implications for comorbidities. Chest. 2015;147(1):266–274. doi:10.1378/chest.14-0500
52. Lv R, Liu X, Zhang Y, et al. Pathophysiological mechanisms and therapeutic approaches in obstructive sleep apnea syndrome. Signal Transduct Targeted Ther. 2023;8(1):218. doi:10.1038/s41392-023-01496-3
53. Redline S, Azarbarzin A, Peker Y. Obstructive sleep apnoea heterogeneity and cardiovascular disease. Nat Rev Cardiol. 2023;20:560–573. doi:10.1038/s41569-023-00846-6
54. Gong LJ, Wang XY, Gu WY, Wu X. Pinocembrin ameliorates intermittent hypoxia-induced neuroinflammation through BNIP3-dependent mitophagy in a murine model of sleep apnea. J Neuroinflammation. 2020;17(1):337. doi:10.1186/s12974-020-02014-w
 © 2025 The Author(s). This work is published and licensed by Dove Medical Press Limited. The
full terms of this license are available at https://www.dovepress.com/terms
and incorporate the Creative Commons Attribution
- Non Commercial (unported, 4.0) License.
By accessing the work you hereby accept the Terms. Non-commercial uses of the work are permitted
without any further permission from Dove Medical Press Limited, provided the work is properly
attributed. For permission for commercial use of this work, please see paragraphs 4.2 and 5 of our Terms.
© 2025 The Author(s). This work is published and licensed by Dove Medical Press Limited. The
full terms of this license are available at https://www.dovepress.com/terms
and incorporate the Creative Commons Attribution
- Non Commercial (unported, 4.0) License.
By accessing the work you hereby accept the Terms. Non-commercial uses of the work are permitted
without any further permission from Dove Medical Press Limited, provided the work is properly
attributed. For permission for commercial use of this work, please see paragraphs 4.2 and 5 of our Terms.
Recommended articles

Association Between Fractional Exhaled Nitric Oxide (FeNO) and Cognitive Function in Patients with Obstructive Sleep Apnea
Zhu Q, Huang L, Zhu L, Zhang X, Ji H, Niu D, Ji W, Ma Q, Chen R, Shi H, Wang Y, Xu L
Nature and Science of Sleep 2025, 17:1603-1614
Published Date: 12 July 2025
Acupuncture for Mild Cognitive Impairment in Vascular Parkinsonism: A Prospective, Randomized, Controlled Trial Protocol
Yu Z, Wang Y, Wang X, Xie Y, Wang Y, Li L, Qin W, Kong Q, Zhang P, Xu J
Neuropsychiatric Disease and Treatment 2026, 22:585695
Published Date: 27 February 2026