
Back to Journals » International Journal of General Medicine » Volume 19
IL18 Works Like a Two-Side Coin in Acute Pancreatitis
Authors Zhou K  , Liu L, Bao J, Wang C, Wang X , Jiang W, Wan R
Received 2 March 2026
Accepted for publication 17 May 2026
Published 25 May 2026 Volume 2026:19 606433
DOI https://doi.org/10.2147/IJGM.S606433
Checked for plagiarism Yes
Review by Single anonymous peer review
Peer reviewer comments 2
Editor who approved publication: Prof. Dr. Gopal Krishna Dhali
Kena Zhou,1,2,* Leheng Liu,1,2,* Jingpiao Bao,1,2 Chuanyang Wang,1,2 Xingpeng Wang,1,2 Weiliang Jiang,1,2 Rong Wan1,2
1Department of Gastroenterology, Shanghai General Hospital, Shanghai Jiao Tong University School of Medicine, Shanghai, 200080, People’s Republic of China; 2Shanghai Key Laboratory of Pancreatic Disease, Institute of Pancreatic Disease, Shanghai Jiao Tong University School of Medicine, Shanghai, 201620, People’s Republic of China
*These authors contributed equally to this work
Correspondence: Xingpeng Wang, Department of Gastroenterology, Shanghai General Hospital, Shanghai Jiao Tong University School of Medicine, Shanghai, People’s Republic of China, Email [email protected] Rong Wan, Department of Gastroenterology, Shanghai General Hospital, Shanghai Jiao Tong University School of Medicine, Shanghai, People’s Republic of China, Email [email protected]
Purpose: Acute pancreatitis is a common disease with limited supportive treatments. Finding effective biomarkers is of great significance for early diagnosis and therapy, as well as to achieve better prognosis.
Materials and Methods: The core genes of AP were identified through bioinformatics and machine learning. The expression, clinical features, biological function and immunological effects of the characteristic gene were also evaluated. AP murine models were constructed to verify the results in vivo. Finally, Mendelian randomization studies were performed to determine the causal relationship between IL-18 and AP through genome-wide association studies.
Results: A total of 100 core genes were obtained, and IL18 was identified as the characteristic gene for AP. The expression of IL18 was increased in AP (p< 0.001) with an AUC value of 0.917. And some immune responses were inhibited when IL18 is highly expressed. In addition, the OR for IL18 and AP was 0.908 (95% CI = 0.843– 0.978, p=0.011) via inverse variance weighting (IVW).
Conclusion: Elevated IL18 can be used to predict the clinical prognosis and immune responses in AP. Meanwhile, MR suggests that an increase in IL18 indicates a low risk of AP, implying that the course of AP often presents a self-limiting feature in clinic.
Keywords: IL18, acute pancreatitis, bioinformatics, machine learning, immune responses
Introduction
Acute Pancreatitis (AP) is a common acute non-infectious inflammatory disease of the pancreas in clinic. The diagnostic criteria for AP need to consider comprehensively by combining serum amylase, lipase, imaging tests, and clinical symptoms. The causes of AP mainly include biliary calculi, hyperlipidemia, drug-induced, procedural, and non-specific, etc.1 The incidence of AP worldwide is 34 cases per 100,000 person-years, and it is on the rise globally,2 causing a huge burden on medical resources and social economy.3 In addition, about 18% of patients with AP will have a recurrence, and 8% of patients will develop chronic pancreatitis, even periampullary cancers.4 Both of these conditions will bring additional economic burdens to the healthcare system and long-term troubles to patients’ lives and work.5,6
In AP, multiple mechanisms (such as pancreatic duct obstruction, direct alcohol toxicity) disrupt the calcium homeostasis within the acinar cells, leading to premature activation of trypsinogen, destruction of the function of the secretory cells, release of inflammatory and cytokines, triggering a cascading molecular interaction network, and digestion of the pancreas and surrounding tissues.7 The main cellular events include calcium ion overload, mitochondrial dysfunction, endoplasmic reticulum stress (ERS), impaired unfolded protein response (UPR), and impaired autophagy, etc.8,9
Acute pancreatitis (AP) is a clinically common inflammatory disease that is mild in most situations.10 About 35% of AP patients will progress to moderate severe acute pancreatitis (MSAP) or severe acute pancreatitis (SAP), conditions with poor prognosis and life-threatening.11 AP is mostly self-limiting in the early stage of the disease, thus early identification contributes to timely treatment with good prognosis.12 With the development of genomics in the last decade, our understanding of the pathophysiological mechanism of AP has gradually shifted from traditional clinical indicators to the gene era.13–15
High-throughput profiling methods have accelerated basic research and made deep molecular characterization of patient samples routine.16 Machine learning is superior to traditional statistical models and can build informative and predictive models of the underlying biological process.17–19 It is becoming an integral part of modern data mining and clinical diagnosis.20–22 Eolving diagnostic tools (including novel biomarkers and imaging modalities) and innovative therapies (from precision medicines to immunotherapies) are improving survival and quality of life.23 And it is the computational advancement that brings in a new era of personal health-based therapy.24
Interleukin-18 (IL-18) is a cytokine that shares structural features with the interleukin-1 (IL-1) family.25 As a unique cytokine, it is involved in the activation and differentiation of multiple T cell groups.26 IL-18 expression was increased in AP at an early stage and was proved to be correlated with disease severity.27–29 At present, the mainstream view is that IL-18 is involved in the deterioration of AP.27,30 However, some scholars believe that IL-18 seems to have a protective effect on AP.31
Mendelian randomization (MR) uses genetic variation “single nucleotide polymorphisms (SNPs)” as an instrumental variable (IV) to determine whether observed associations between risk factors and outcomes are consistent with causal effects.32 Since these genetic variants are not usually associated with confounders, differences in outcomes between those who carry the variant and those who do not can be attributed to differences in risk factors.
In this study, we used high-throughput sequences via machine learning to find the characteristic gene of AP. Then the expression level, clinical correlation, biological function and immune infiltration of IL18 in AP were analyzed comprehensively. In addition, we established murine models to validate the relative mRNA and protein expression of IL18 in experimental AP. Through MR study, we initially explored and speculated that there might be a connection between IL18 and the self-limiting course of AP.
Materials and Methods
Datasets and Mice Models
The series matrix file GSE194331 of AP patients was obtained from GEO database, downloaded from https://www.ncbi.nlm.nih.gov/geo/. The dataset was derived from whole blood samples, including 87 AP patients and 32 healthy controls (total=119). GTEx data is downloaded from UCSC (https://xena.ucsc.edu/). The GEO and GTEx databases are publicly available, which does not require institutional review board approval and informed consent. According to the Measures for Ethical Review of Life Science and Medical Research Involving Human Subjects (China, February 18, 2023), Article 32, items 1 and 2, research using publicly available, anonymized data that does not involve personal privacy or re-identification is exempt from IRB approval.
Male C57BL/6J mice weighing 20.76–22.12 g were purchased from SLAC Animal Corporation (Shanghai, China). The mice were raised in an animal laboratory with suitable humidity and temperature, adequate water resources and feed. Ten male C57BL/6J mice were randomly divided into two groups, the wild type group and the caerulein-induced AP group (5 mice per group). The AP induction protocol was 100ug/kg of caerulein injected intraperitoneally every 1 hour, repeated for 10 times. The control group was given the same amount of normal saline intraperitoneal injection for the same time period. Mice were sacrificed under pentobarbital sodium after 3 hours of the last injection of caerulein, and pancreas were collected for subsequent analysis. All animal experiments were performed in accordance with the ARRIVE guidelines and the National Institutes of Health Guide for the Care and Use of Laboratory Animals (8th edition). All procedures performed have been approved by the Experimental Animal Ethics Committee of Shanghai First Hospital Affiliated to Shanghai Jiao Tong University (IACUC: 2023AWS208).
Differentially Expressed Genes and Protein-Protein-Interaction (PPI)
R-package of “edgeR” was used to analyze differentially expressed genes in whole blood between normal controls and AP patients. We took mRNA expression LogFC absolute value >1 and false discovery rate (FDR) <0.05 as the threshold points of differential genes. PPI analysis was performed in the STRING database (https://www.string-db.org/). The connectivity diagram is drawn in R language, and the core gene is defined according to the connectivity ≥5. The threshold of 5 was chosen based on the distribution of interaction counts in the PPI network; the top 10% of genes by degree centrality had ≥5 interactions. This is a commonly used cut-off in protein-protein interaction network analyses to identify hub genes. Cytoscape presented the core genes and their interactions.
Biological Role and Disease Analysis
The R packages of “clusterProfiler”, “enrichplot”, “org.Hs.egdb”, “ggplot2”, “GSEABase” and “DOSE” was applied to analyze the function, pathway and disease of core genes. Gene Ontology (GO) functional enrichment was used to analyze the biological significance of core genes, including Biological Process (BP), Cellular Components (CC) and Molecular Function (MF). Kyoto Encyclopedia of Genes and Genomes (KEGG) enrichment was used to analyze the pathways of core genes. Disease Ontology (DO) enrichment analyzed main diseases of core gene.33,34 The above results were considered statistically significant with p<0.05 and p<0.05 after adjustment (Benjamini–Hochberg false discovery rate). The visualization of DO is achieved through the R package of “GOplot”.35
Machine Learning
In order to reduce bias, we use three different machine learning algorithms to screen potential characteristic genes. The R packages of “glmnet”, “e1071” and “randomForest” completed the Least Absolute Shrinkage and Selection Operator (LASSO) logistic regression, Support Vector Machine Recursive Feature Elimination (SVM_RFE) and Random Forest (RF) respectively. Finally, the venn diagram shows the overlapping characteristic gene in AP after performing three algorithms.
Expression of the Characteristic Gene in Human Tissues
The expression levels of the characteristic gene in human organs were extracted from GTEx database. Then R packages of “dplyr” and “ggpubr” were used to graph the expression of the characteristic gene in various tissues of human body. Moreover, the mRNA expression of the characteristic gene in AP tissues and normal controls was also mapped.
Clinical Value and ROC Curve
We explored the clinical relevance and diagnostic sensitivity of the characteristic gene. The R-package of “ggpubr” compared the expression level of the characteristic gene under different clinical condition. The R package of “pROC” generated the receiver operating characteristic curve (ROC) and calculated the area under the curve (AUC) value to assess the specificity and sensitivity of the characteristic gene to predict AP.
Function and Pathway Analysis of Co-Expressed Genes
We look for correlated genes that are associated with the characteristic gene in R software. The threshold value of correlated genes was set as |Pearson correlation coefficient| p>0.60 and p<0.001. The R packages of “igraph” and “reshape2” were used to visualize all co-expressed results. R packages of “clusterProfiler”, “org.Hs.egdb”, “DOSE”, “ggplot2”, “GOplot”, “R.Utls” and “pathview” were used for GO and KEGG analyses.
Immune Infiltration and Principal Component Analysis (PCA)
The CIBERSORT algorithm can show the relationship between the expression level of the characteristic gene and 22 types of immune cells. Boxplot exhibited the situation of immune cells in AP and normal controls. PCA maps were used for dimensionality reduction to evaluate the feasibility of distinguishing AP among immune cells. Bar charts visualized the correlation between characteristic gene and immune cells. The ssGSEA algorithm is based on 29 immune gene sets (infiltration scores of 16 immune cells and activity of 13 immune-related pathways) to comprehensively quantify the relative abundance of immune cell types, pathways, functions, and checkpoints in each patient. GSVA R package was used to analyze the differences in immune function between AP patients with low- and high-expression of the characteristic gene. The R packages of “limma”, “preprocessCore”, “GSVA”, “GSEABase”, “reshape2”, “corrplot”, “ggpubr”, and “ggplot2” were used to complete the above tasks.
Two-Sample Mendelian Randomization (MR) Analysis
Two-sample MR was used to investigate the causal relationship between the characteristic gene and the risk of AP, and SNP was defined as IVs. The characteristic gene information was acquired from the Genome-Wide Association Study (GWAS). We performed MR analysis of IL18 and AP. The GWAS ID was ebi-a-GCST90010141 for IL-18 (individuals of European ancestry from the UK Biobank and deCODE cohorts), and finn-b-K11_ACUTPAN for AP. MR Analysis was performed based on the R package of “TwoSampleMR” and the relationship between IL18 and AP was evaluated using inverse variance weighting (IVW). Additional sensitivity analysis was performed by MR-Egger.36
Biological Experiments
Total RNA and protein from murine pancreas were extracted using TRIzol and RIPA according to the instructions. Reverse transcription and SYBR kits were used for RT-qPCR (EnzyArtisan). CT values (2−ΔΔCT) were calculated to determine the relative expression level of IL18 referred to mouse Rplp0. The primer sequences were as follows: IL18, forward: 5’-AACTTTGGCCGACTTCACTGTA-3’, reverse: 5’-TATCAGTCATATCCTCGAACACAGG-3’; Rplp0, forward: 5’-TTATAACCCTGAAGTGCTCGAC-3’, reverse: 5’-CGCTTGTACCCATTGATGATG-3’. Western blotting was performed using IL18 (Proteintech, Cat No. 10663-1-AP) and β-actin (Proteintech, Cat No. 66009-1-Ig,) primary antibodies incubated at 4°C overnight. The secondary antibody of the corresponding species (Boster, Cat. No. BA1054; Cat No. BA1050) was incubated for 60 min the next day. The ECL photograph shows the WB results.
Pancreatic tissue was fixed, embedded and sliced to 4 mm. Sections were dewaxed, hydrated and incubated with citrate antigen retrieval solution (Beyotime Biotechnology, Shanghai, China) for 1 hour. The slides were then incubated overnight with primary antibodies against IL18 (Proteintech, Cat No. 10663-1-AP). Fluorescent secondary antibody (Servicebio, GB25303) combined with DAPI (Servicebio, G1127) was added the next day for tissue immunofluorescence analysis. Half of the slides were incubated for 1 hour with a biotinylated secondary antibody (Servicebio, G1213) for immunohistochemistry (IHC) staining using a microscope (Leica, IL, USA, DFC550).
Statistics
The t-test is used to analyze differences between groups for variables with a normal distribution. Otherwise, the Mann–Whitney U-test is applied. Chi-square tests are used to compare quantities. The Pearson correlation method was used to analyze the correlation between two different genes. All statistical analyses were performed by R software version 4.3.1 (https://www.r-project.org/). p<0.05 was considered statistically significant. We have marked * in the results, where * means p<0.05, ** means p<0.01, and *** means p<0.001.
In order to ensure the stability of the results, the following methods were performed: (i) performance metrics (AUC, accuracy, sensitivity, specificity) are reported in Results, (ii) parameter tuning for the LASSO and random forest models (alpha = 1 for LASSO, ntree = 500 for RF), (iii) we used feature selection within cross-validation loops to prevent data leakage, and (iv) the 10-fold cross-validation strategy with 5 repeats, (v) all three machine learning algorithms were performed 30 repeats.
Results
Differentially Expressed Genes and Function of Core Gene
The transcriptome of whole blood samples from patients with AP and normal controls was analyzed. A total of 1356 differential genes were obtained according to the threshold value (Table S1). The PPI interaction network of 1356 differential genes was constructed via STRING online database (http-string-db.org) to better understand the interactions between these differential genes. And number of interactions ≥5 is considered as the threshold for core genes (Figure S1). The cytoHubba module of Cytoscape software computed and visualized these 100 core genes (Figure 1A).
 |
Figure 1 Core genes and related functions, pathways and diseases in AP. (A) Visualize the core genes using Cytohubba plugin in Cytoscape software. (B) The circular scatter plot of GO enrichment to exhibit the biological process. (C) The circular scatter plot of KEGG enrichment. (D) Circos plot illustrates the relationship between core genes and the top 6 kinds of diseases with DO enrichment. Genes are involved in connection with the DO term through colored connecting lines. The outer ring color represents logFC. |
To explore the role of these core genes in the AP process, we focused on function, pathway and disease analysis of them. The results of GO analysis are mainly positive regulation of cytokine production, defense response to bacterium and regulation of inflammatory response. This suggests that a variety of cytokines and inflammatory responses take part in the process of AP (Figure 1B). The pathways of core genes are mainly enriched in Tuberculosis, Inflammatory bowel disease and Staphylococcus aureus infection (Figure 1C). DO analysis showed that the onset of AP may be associated with diseases such as periodontal disease, arteriosclerosis, bacterial infectious disease, etc. The circle graph presented the six diseases corresponding to core genes (Figure 1D).
Machine Learning
Three machine learning methods, namely LASSO regression, SVM-RFE and RF, were used to learn core genes in AP (Table S2). LASSO regression obtained 17 core genes in AP (Figure 2A). The SVM-REF algorithm got 13 core genes in AP (Figure 2B). The RF algorithm gained 8 core genes in AP (Figure 2C). A Venn diagram was drawn to indicate the intersection of gene subsets from three machine learning algorithms. Finally, IL18 was identified as the characteristic gene for pancreatitis (Figure 2D).
 |
Figure 2 Identification of potential biomarkers in AP based on machine learning. (A) The best Lambda value in LASSO algorithm corresponds to 17 genes. (B) Root mean square error (RSME) curve of 100 core genes in SVM-RFE algorithm. The blue dots represent the lowest error rate and correspond to 13 genes. (C) Screening diagnostic genes for AP by random forest algorithm. (D) Venn diagram intersects the characteristic gene in AP after LASSO, SVM-REF and RF algorithms. |
Expression Levels and Clinical Value of IL18
Expression level of IL18 in all organs was depicted based on the GTEx database. The red box suggested the expression of IL18 in the pancreas (Figure 3A). According to GSE194331, we compared the expression level of IL18 in whole blood samples in AP and control group (Figure 3B). The ROC curve indicated that IL18 could predict AP with good ability, with an AUC value of 0.917 (95% CI=0.859–0.961) (Figure 3C). The whole blood expression of IL18 in all pathological types of AP was higher than that in normal controls (p<0.001, Figure 3D).
 |
Figure 3 Expression and clinical value of IL18. (A) Expression of IL18 in various organs of normal human body. The red box illustrated the pancreas. (B) Violin plot of IL18 mRNA expression in the GEO dataset (GSE194331). (C) ROC curve to evaluate the diagnostic value of IL18 in GEO cohort. (D) Expression of IL18 in different pathological states of AP. **p<0.01, ***p<0.001. Abbreviation: ns, no significance. |
Meanwhile, we conducted AP model in mice, HE staining showed that AP animal models were constructed successfully (Figure 4A). The relative protein and mRNA expression level of IL18 in AP was significantly increased than that in wild type controls based on WB, IHC, PCR and IF (Figure 4B–E).
 |
Figure 4 Experimental results indicating the expression of IL18 in normal wild type and AP murine model. (A) HE staining of pancreas in mice models. (B) WB result of relative protein expression of IL18 in normal controls (n=5) and AP mice (n=5). (C) IHC staining result of expression of IL18 in normal controls and AP mice. (D) PCR result of relative expression of IL18 in normal controls (n=5) and AP mice (n=5). (E) IF result of expression of IL18 in normal controls and AP mice (IL18 in red). **p<0.01. |
Correlation and Function of IL18
Genes with a correlation coefficient over 0.6 are considered as IL18 related genes. A total of 964 associated genes are listed in Table S3. The corNetwork showed the correlation among the 12 genes with the largest correlation coefficient with IL18 (Figure 5A). GO analysis suggested that BP mainly involves activation of immune response, immune response-regulating signaling pathway and immune response-activating signaling pathway. CC is mainly secretory granule membrane, secretory granule lumen and cytoplasmic vesicle lumen. MF is mainly immune receptor activity, phosphortyrosine residue binding and oxidoreductase activity, acting on a sulfur group of donors (Figure 5C, details in Table S4). KEGG showed that IL18 was mainly associated with Salmonella infection, Osteoclast differentiation, NF-kappa B signaling pathway, Th1 and Th2 cell differentiation and T cell receptor signaling pathway (Figure 5E, details in Table S4). All these indicated that IL18 was closely related to immune response and status in AP. The pathway map exhibited the correlated genes with altered expression in the pathways of NF-kappa B, Th1 and Th2 cell differentiation, and T cell receptor (Figure 5B, D and F).
 |
Figure 5 Function and pathway of co-expressed genes of IL18. (A) The corNetwork diagram of IL18. (B) Expression of IL18 and co-expressed genes in NF−kappa B signaling pathway. (C) Bubble map of GO enrichment analysis for IL18 co-expression genes. (D) Expression of IL18 and co-expressed genes in Th1 and Th2 cell differentiation signaling pathway. (E) Bubble map of KEGG enrichment analysis for IL18 co-expression genes. (F) Expression of IL18 and co-expressed genes in T cell receptor signaling pathway. Red represents positive regulation, while green represents negative regulation. |
Immune Infiltration
We used the CIBERSORT method to measure the status of 22 types of immune cells in normal controls and AP (Figure 6A). Differences existed with regard to 12 kinds of immune cells such as B cells naive, Macrophages, T cells CD8 and T cells CD4 memory resting. PCA results showed that AP and controls could be well distinguished based on immune cells (Figure 6B). IL18 was positively associated with 6 types of immune cells and negatively correlated to 4 types of immune cells (Figure 6C). Except Macrophages, Neutrophils and Treg cells, the other immune pathways were downregulated when the expression of IL18 was high, which were assessed via ssGSEA. This might because the data of the AP group covered all stages of mild to severe conditions, and the characteristics of macrophages and neutrophils undergo dynamic changes at different disease progression stages. Overall, most of immune cells and signaling pathways were inhibited under the condition of high expression of IL18 (Figure 6D). Hence we propose that IL18 works like a coin which has two sides, affecting immune cells and immune pathways in different ways.
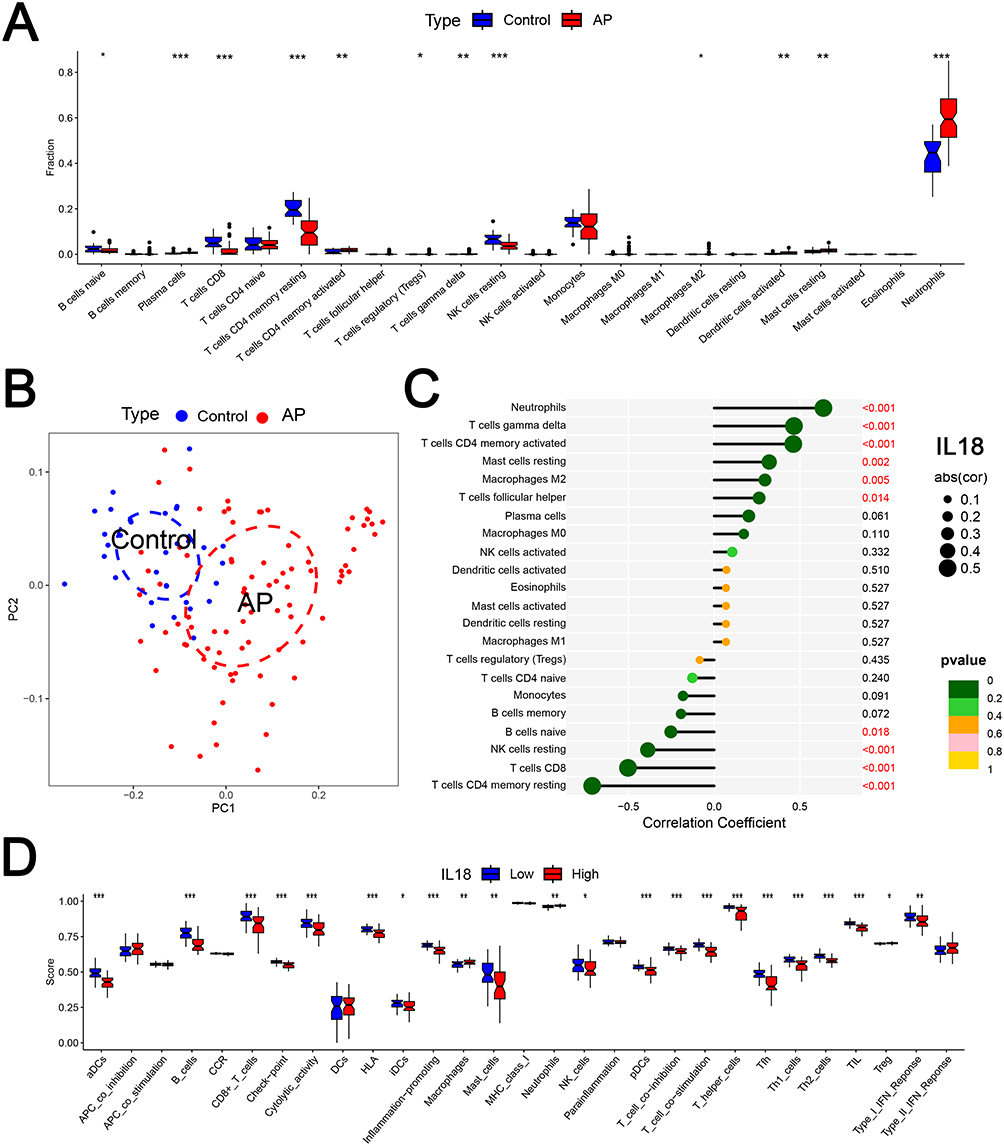 |
Figure 6 Analyses of the association between immune cells and IL18 in normal controls and AP. (A) 22 kinds of immune cells status in normal controls and AP (Blue represents controls, while red represents AP samples). (B) PCA of 22 types of immune cells, revealing differences of immune-phenotype in normal controls and AP. (C) Lollipop diagram of correlation between IL18 and 22 kinds of immune cells. (D) Comparison of ssGSEA scores between low- and high-expression levels of IL18. *p<0.05, **p<0.01, and ***p<0.001. |
MR Result
Last but not least, we estimated the causal relationship between IL-18 level and AP. Scatter plots showed the causal effect of SNP on AP: the higher IL18 level was, the lower risk for AP became (Figure 7A). The forest map reflects the results of every SNP via wald ratio method, while the bottom red line reflects the IVW result (Figure 7B). We found that IL18 level was associated with the risk of AP by IVW approach, with an OR of 0.908 (95% CI = 0.843–0.978, p = 0.011) (Five MR methods employed along with sensitivity analyses to comprehensively evaluate the causal relationship between IL18 and AP were displayed in Table S6). The IVW heterogeneity test indicated that heterogeneity did not exist (p=0.777). The causal effects of the funnel plot are roughly symmetrical (Figure 7C). Horizontal pleiotropy showed no confounding factors (p=0.514), suggesting that IL18level was reliable to predict the risk of AP. Leave-one-out sensitivity analysis showed that there was no dominant SNP of IL18 level in AP (Figure 7D), demonstrating significant causal association between all the calculated results of SNPs.
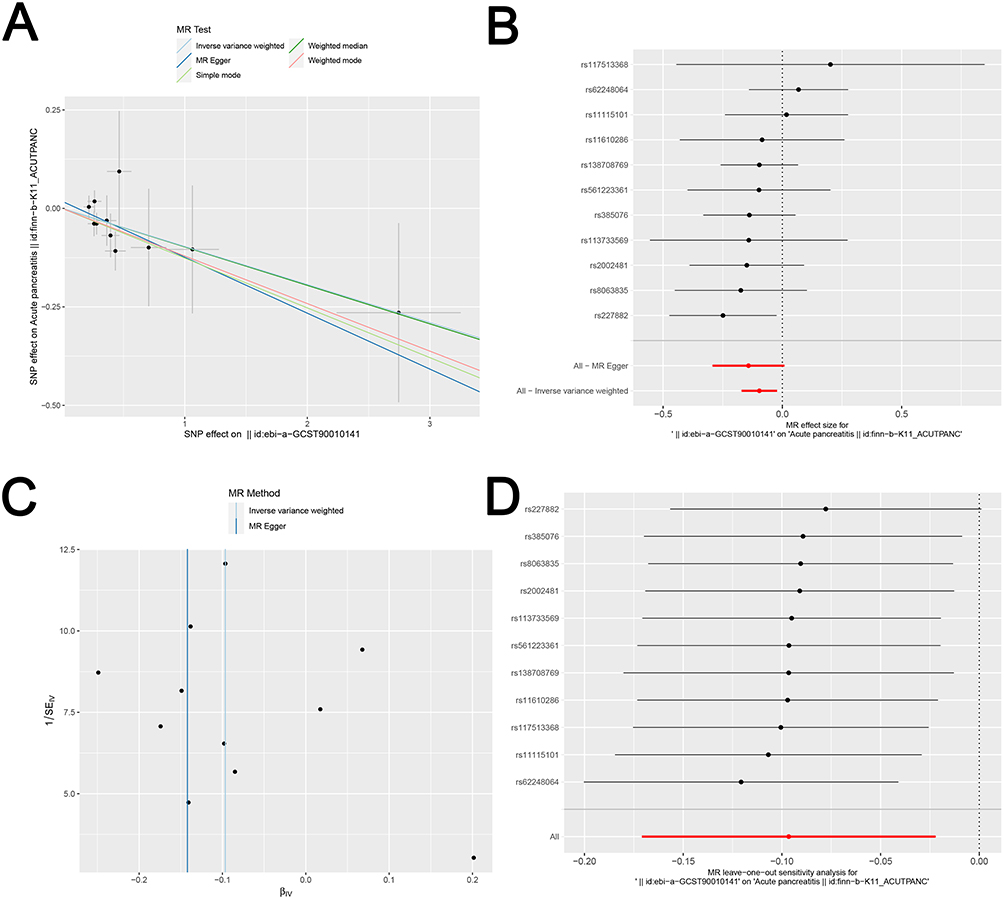 |
Figure 7 Mendelian randomization study on IL18 and AP. (A) Scatter plot showing the causal effect of IL18 on the risk of AP. (B) Forest plot showing the causal effect of each SNP on the risk of AP. (C) Funnel plots to visualize overall heterogeneity of MR estimates for the effect of IL18 on AP. (D) Leave-one-out plot to visualize causal effect of IL18 on AP when leaving one SNP out. |
Discussion
AP is an inflammatory disease caused by the activation of intracellular trypsinogen due to various reasons.37,38 In 2022, Maryam Nesvaderani provided the first high-throughput sequencing data of blood samples in AP patients.39 This raw dataset is remarkable for researchers to probe for machine learning of novel markers in AP.40,41 With the help of this dataset, we integrated bioinformatics analysis and machine learning to explore meaningful biomarkers in AP. And IL18 was identified to be the characteristic gene of AP. The expression of IL18 increased significantly in AP compared to normal controls, and murine model confirmed the result. ROC curve illustrated that IL18 was a good indicator for clinical diagnosis of AP. Intriguingly, MR analysis suggested that high serum levels of IL18 could be causally associated with a reduced risk of AP.
Although the triggers for AP may vary, the immune response to cell damage is similar.42 IL18 was a member of the cytokine IL-1 family and was recognized as an important regulator of inflammation, immune response, and tissue damage.32,43 On one hand, IL-18 has been shown to induce the production of cytokines and chemokines by neutrophils.44 Neutrophil infiltration in the SAP-damaged pancreas was significantly reduced when IL-18 was knocked out, along with reduced T cell activation.45 On the other hand, IL18 is involved in Th1 and Th2 immune responses and activation of M2 macrophages.26,46 Ueno et al reported that compared with AP wild-type mice, serum amylase, lipase and the numbers of acinar cells with parenchyma vacuolization were significantly increased in AP mice with IL18 knockout, and the above parameters could be improved after pretreatment with recombinant mouse IL-18. Therefore, they believe that IL18 has a protective effect in AP.31 Based on the results in our study, IL18 serves as an indicator for predicting and reflecting the course of AP; and from the perspective of genetic predisposition, the high expression level of IL18 is a protective factor for the occurrence of AP in human. Therefore, the bidirectionality of the research results obtained by previous studies is reasonable. Because the intervention of genes in the modeling process is equivalent to a genetic change. At the same time, we also speculate that after IL18 increases, there may be a similar protective mechanism similar to genetic predisposition.
In summary, the level of IL-18 (p<0.05) was correlated positively with the psoriasis area and severity index at an early immunosuppressive state.47 Since functions of cell immunity and humoral immunity in primary nephrotic syndrome (PNS) patients remain untreated were suppressed and disordered, researchers found that IL-18 increased, while IL-10 and Foxp3+Treg cells decreased.48 Similarly, in metastatic colorectal cancer, PBMCs exhibited significantly lower production of IL-18 cytokines and lower auto-MLR responses, whereas Treg frequency, IL-10 cytokines were increased compared to healthy donors.49
Although our study find IL18 is vital in AP, and performed animal experiments to verify our results, there are still some limitations. In the future, we plan to recruit more real-world human samples in our clinical work and use detection methods such as ELISA to further validate the diagnostic efficacy of IL18 in AP. Additionally, we will collect more detailed information about AP patient, aiming to analyze whether IL18 is associated with the scores in the assessment of AP severity. Furthermore, larger-scale animal study including male and female models with more inflammatory markers (IL-1β, IL-6, TNF-α, and pancreatic histology scoring) needs to be done to further elucidate the mechanism of IL18 in AP.
Conclusions
Our study suggests that IL18 promoted several immune cells at the same time suppressed some immune cells and pathways. But there are too many confounding factors. Therefore, we also conducted a two-sample MR Analysis of GWAS data to explore the association between IL18 and the risk of AP.50 The results showed that there was a causal relationship between increased IL18 level and reduced risk of AP. In conclusion, IL-18 is like a coin with two sides: genetic speaking, IL18 can reduce the risk of AP; while during the course of AP, IL18 can serve as a biomarker. We hypothesize that the elevated level of IL18 induced by AP inflammation might also have a protective effect similar to genetics at a certain stage, that’s perhaps why we could see AP is a self-limiting disease in its early stage in clinic.
Data Sharing Statement
Gene expression data are in Tables S1–S5 and have been deposited in the Gene Expression Omnibus of the National Center for Biotechnology Information (GSE194331). The data supporting the findings of this study are available from the corresponding authors upon reasonable request.
Ethics Approval
This project was approved by the Experimental Animal Ethics Committee of Shanghai First Hospital Affiliated to Shanghai Jiao Tong University (IACUC: 2023AWS208).
Acknowledgments
We are very grateful to the GEO and GTEx databases for providing gene expression information for our study. Moreover, we appreciate all the mice sacrificed in the experiment. This paper has been uploaded to ResearchSquare as a preprint: https://www.researchsquare.com/article/rs-3965868/v1.
Author Contributions
All authors made a significant contribution to the work reported, whether that is in the conception, study design, execution, acquisition of data, analysis and interpretation, or in all these areas; took part in drafting, revising or critically reviewing the article; gave final approval of the version to be published; have agreed on the journal to which the article has been submitted; and agree to be accountable for all aspects of the work.
Funding
This work was supported by National Natural Science Foundation of China [Grant numbers 82170653, 82370656 and 82470676] and National Natural Science Foundation of Shanghai [Grant number 23ZR1450900].
Disclosure
The authors report no conflicts of interest in this work.
References
1. Rosales-Muñoz GJ, Souza-Arroyo V, Bucio-Ortiz L, Miranda-Labra RU, Gomez-Quiroz LE, Gutiérrez-Ruiz MC. Acute pancreatitis experimental models, advantages and disadvantages. J Physiol Biochem. 2025;81(3):539–15. doi:10.1007/s13105-025-01091-w
2. Petrov MS, Yadav D. Global epidemiology and holistic prevention of pancreatitis. Nat Rev Gastroenterol Hepatol. 2019;16(3):175–184. doi:10.1038/s41575-018-0087-5
3. De-madaria E, Buxbaum JL. Advances in the management of acute pancreatitis. Nat Rev Gastroenterol Hepatol. 2023;20(11):691–692. doi:10.1038/s41575-023-00808-w
4. Adam IM, Abdelrahim EY, Doush WMA. Surgical management and histopathological patterns of periampullary cancers in Sudanese patients: a single-center prospective study. Med Adv. 2024;2(3):302–311. doi:10.1002/med4.71
5. Vipperla K, Papachristou GI, Easler J, et al. Risk of and factors associated with readmission after a sentinel attack of acute pancreatitis. Clin Gastroenterol Hepatol. 2014;12(11):1911–1919. doi:10.1016/j.cgh.2014.04.035
6. Ahmed Ali U, Issa Y, Hagenaars JC, et al. Risk of recurrent pancreatitis and progression to chronic pancreatitis after a first episode of acute pancreatitis. Clin Gastroenterol Hepatol. 2016;14(5):738–746. doi:10.1016/j.cgh.2015.12.040
7. Li Y, Li G, Suo L, Zhang J. Recent advances in studies of molecular hydrogen in the treatment of pancreatitis. Life Sci. 2021;264:118641. doi:10.1016/j.lfs.2020.118641
8. Vervliet T, Yule DI, Bultynck G. Carbohydrate Loading to Combat Acute Pancreatitis. Trends Biochem Sci. 2018;43(10):741–744. doi:10.1016/j.tibs.2018.08.001
9. Li H, Wen W, Luo J. Targeting endoplasmic reticulum stress as an effective treatment for alcoholic pancreatitis. Biomedicines. 2022;10(1). doi:10.3390/biomedicines10010108
10. Gardner TB. Acute pancreatitis. Ann Internal Med. 2021;174(2):Itc17–Itc32. doi:10.7326/aitc202102160
11. Sternby H, Bolado F, Canaval-Zuleta HJ, et al. Determinants of severity in acute pancreatitis: a nation-wide multicenter prospective cohort study. Ann Surg. 2019;270(2):348–355. doi:10.1097/sla.0000000000002766
12. Mederos MA, Reber HA, Girgis MD. Acute pancreatitis: a review. JAMA. 2021;325(4):382–390. doi:10.1001/jama.2020.20317
13. Lee PJ, Papachristou GI. New insights into acute pancreatitis. Nat Rev Gastroenterol Hepatol. 2019;16(8):479–496. doi:10.1038/s41575-019-0158-2
14. Huang H, Swidnicka-Siergiejko AK, Daniluk J, et al. Transgenic expression of PRSS1(R122H) sensitizes mice to pancreatitis. Gastroenterology. 2020;158(4):1072–1082.e7. doi:10.1053/j.gastro.2019.08.016
15. Frossard JL, Rubbia-Brandt L, Wallig MA, et al. Severe acute pancreatitis and reduced acinar cell apoptosis in the exocrine pancreas of mice deficient for the Cx32 gene. Gastroenterology. 2003;124(2):481–493. doi:10.1053/gast.2003.50052
16. Banerjee J, Taroni JN, Allaway RJ, Prasad DV, Guinney J, Greene C. Machine learning in rare disease. Nature Methods. 2023;20(6):803–814. doi:10.1038/s41592-023-01886-z
17. Van Calster B, Wynants L. Machine learning in medicine. New Engl J Med. 2019;380(26):2588. doi:10.1056/NEJMc1906060
18. Camacho DM, Collins KM, Powers RK, Costello JC, Collins JJ. Next-generation machine learning for biological networks. Cell. 2018;173(7):1581–1592. doi:10.1016/j.cell.2018.05.015
19. Greener JG, Kandathil SM, Moffat L, Jones DT. A guide to machine learning for biologists. Nat Rev Mol Cell Biol. 2022;23(1):40–55. doi:10.1038/s41580-021-00407-0
20. Swanson K, Wu E, Zhang A, Alizadeh AA, Zou J. From patterns to patients: advances in clinical machine learning for cancer diagnosis, prognosis, and treatment. Cell. 2023;186(8):1772–1791. doi:10.1016/j.cell.2023.01.035
21. Kadirvelu B, Gavriel C, Nageshwaran S, et al. A wearable motion capture suit and machine learning predict disease progression in Friedreich’s ataxia. Nature Med. 2023;29(1):86–94. doi:10.1038/s41591-022-02159-6
22. Saberi-Karimian M, Khorasanchi Z, Ghazizadeh H, et al. Potential value and impact of data mining and machine learning in clinical diagnostics. Crit Rev Clin Lab Sci. 2021;58(4):275–296. doi:10.1080/10408363.2020.1857681
23. Sun P, Wan Z, Liu Y. Towards comprehensive chronic disease control: prevention, early detection, and integrated management. Med Bull. 2026;2(1):20–33. doi:10.1002/mdb2.70020
24. Li M-Y, Wu G-F, Lu F, et al. Food and medicine homology focus in 2026. Food Med Homol. 2026;3(2):9420133. doi:10.26599/FMH.2026.9420133
25. Ghayur T, Banerjee S, Hugunin M, et al. Caspase-1 processes IFN-gamma-inducing factor and regulates LPS-induced IFN-gamma production. Nature. 1997;386(6625):619–623. doi:10.1038/386619a0
26. Nakanishi K, Yoshimoto T, Tsutsui H, Okamura H. Interleukin-18 regulates both Th1 and Th2 responses. Ann Rev Immunol. 2001;19:423–474. doi:10.1146/annurev.immunol.19.1.423
27. Rau B, Baumgart K, Paszkowski AS, Mayer JM, Beger HG. Clinical relevance of caspase-1 activated cytokines in acute pancreatitis: high correlation of serum interleukin-18 with pancreatic necrosis and systemic complications. Crit Care Med. 2001;29(8):1556–1562. doi:10.1097/00003246-200108000-00010
28. Wereszczynska-Siemiatkowska U, Mroczko B, Siemiatkowski A. Serum profiles of interleukin-18 in different severity forms of human acute pancreatitis. Scand J Gastroenterol. 2002;37(9):1097–1102. doi:10.1080/003655202320378310
29. Martín MA, Saracíbar E, Santamaría A, et al. Interleucina-18 (IL-18) y otros parámetros inmunológicos como marcadores de gravedad en la pancreatitis aguda [Interleukin 18 (IL-18) and other immunological parameters as markers of severity in acute pancreatitis]. Rev Esp Enferm Dig. 2008;100(12):768–773. doi:10.4321/s1130-01082008001200006
30. Wereszczynska-Siemiatkowska U, Mroczko B, Siemiatkowski A, Szmitkowski M, Borawska M, Kosel J. The importance of interleukin 18, glutathione peroxidase, and selenium concentration changes in acute pancreatitis. Dig Dis Sci. 2004;49(4):642–650. doi:10.1023/b:ddas.0000026312.47460.a3
31. Ueno N, Kashiwamura S, Ueda H, et al. Role of interleukin 18 in nitric oxide production and pancreatic damage during acute pancreatitis. Shock. 2005;24(6):564–570. doi:10.1097/01.shk.0000184285.57375.bc
32. Ueda T, Takeyama Y, Yasuda T, et al. Significant elevation of serum interleukin-18 levels in patients with acute pancreatitis. J Gastroenterol. 2006;41(2):158–165. doi:10.1007/s00535-005-1735-4
33. Yu G, Wang LG, Han Y, He QY. clusterProfiler: an R package for comparing biological themes among gene clusters. Omics. 2012;16(5):284–287. doi:10.1089/omi.2011.0118
34. Yu G, Wang LG, Yan GR, He QY. DOSE: an R/Bioconductor package for disease ontology semantic and enrichment analysis. Bioinformatics. 2015;31(4):608–609. doi:10.1093/bioinformatics/btu684
35. Walter W, Sánchez-Cabo F, Ricote M. GOplot: an R package for visually combining expression data with functional analysis. Bioinformatics. 2015;31(17):2912–2914. doi:10.1093/bioinformatics/btv300
36. Dudbridge F. Polygenic Mendelian Randomization. Cold Spring Harbor Perspect Med. 2021;11(2). doi:10.1101/cshperspect.a039586
37. Chanda D, Thoudam T, Sinam IS, et al. Upregulation of the ERRγ-VDAC1 axis underlies the molecular pathogenesis of pancreatitis. Proc Natl Acad Sci USA. 2023;120(20):e2219644120. doi:10.1073/pnas.2219644120
38. Huang W, Booth DM, Cane MC, et al. Fatty acid ethyl ester synthase inhibition ameliorates ethanol-induced Ca2+-dependent mitochondrial dysfunction and acute pancreatitis. Gut. 2014;63(8):1313–1324. doi:10.1136/gutjnl-2012-304058
39. Nesvaderani M, Dhillon BK, Chew T, et al. Gene expression profiling: identification of novel pathways and potential biomarkers in severe acute pancreatitis. J Am Coll Surg. 2022;234(5):803–815. doi:10.1097/xcs.0000000000000115
40. Zhou K, Cai C, He Y, Chen Z. Potential prognostic biomarkers of sudden cardiac death discovered by machine learning. Comput Biol Med. 2022;150:106154. doi:10.1016/j.compbiomed.2022.106154
41. Zhou K, Cai C, He Y, Chen Z. Using machine learning to find genes associated with sudden death. Front cardiovasc med. 2022;9:1042842. doi:10.3389/fcvm.2022.1042842
42. Glaubitz J, Asgarbeik S, Lange R, et al. Immune response mechanisms in acute and chronic pancreatitis: strategies for therapeutic intervention. Front Immunol. 2023;14:1279539. doi:10.3389/fimmu.2023.1279539
43. Dinarello CA. IL-18: a TH1-inducing, proinflammatory cytokine and new member of the IL-1 family. J Allergy Clin Immunol. 1999;103(1 Pt 1):11–24. doi:10.1016/s0091-6749(99)70518-x
44. Leung BP, Culshaw S, Gracie JA, et al. A role for IL-18 in neutrophil activation. J Iimmunol. 2001;167(5):2879–2886. doi:10.4049/jimmunol.167.5.2879
45. Sendler M, van den Brandt C, Glaubitz J, et al. NLRP3 inflammasome regulates development of systemic inflammatory response and compensatory anti-inflammatory response syndromes in mice with acute pancreatitis. Gastroenterology. 2020;158(1):253–269.e14. doi:10.1053/j.gastro.2019.09.040
46. Kobori T, Hamasaki S, Kitaura A, et al. Interleukin-18 amplifies macrophage polarization and morphological alteration, leading to excessive angiogenesis. Front Immunol. 2018;9:334. doi:10.3389/fimmu.2018.00334
47. Abuzeid AMI, Hefni MM, Huang Y, He L, Zhuang T, Li G. Immune pathogenesis in pigeons during experimental prohemistomum vivax infection. Front Veter Sci. 2022;9:974698. doi:10.3389/fvets.2022.974698
48. Zhou P, Xiao Q, Chen L, et al. Effects of huaiqihuang granules adjuvant therapy in children with primary nephrotic syndrome. Open Life Sci. 2019;14:519–527. doi:10.1515/biol-2019-0058
49. Xynos ID, Karadima ML, Voutsas IF, et al. Chemotherapy ± cetuximab modulates peripheral immune responses in metastatic colorectal cancer. Oncology. 2013;84(5):273–283. doi:10.1159/000343282
50. Kena Z, Leheng L, Chuanyang W, et al. IL18 in acute pancreatitis: machine learning and two-sample Mendelian randomization study. Preprint Res Square. 2024. doi:10.21203/rs.3.rs-3965868/v1
 © 2026 The Author(s). This work is published and licensed by Dove Medical Press Limited. The
full terms of this license are available at https://www.dovepress.com/terms
and incorporate the Creative Commons Attribution
- Non Commercial (unported, 4.0) License.
By accessing the work you hereby accept the Terms. Non-commercial uses of the work are permitted
without any further permission from Dove Medical Press Limited, provided the work is properly
attributed. For permission for commercial use of this work, please see paragraphs 4.2 and 5 of our Terms.
© 2026 The Author(s). This work is published and licensed by Dove Medical Press Limited. The
full terms of this license are available at https://www.dovepress.com/terms
and incorporate the Creative Commons Attribution
- Non Commercial (unported, 4.0) License.
By accessing the work you hereby accept the Terms. Non-commercial uses of the work are permitted
without any further permission from Dove Medical Press Limited, provided the work is properly
attributed. For permission for commercial use of this work, please see paragraphs 4.2 and 5 of our Terms.
Recommended articles

Integration of RNA-Seq and Machine Learning Identifies Hub Genes for Empagliflozin Benefitable Heart Failure with Reduced Ejection Fraction
Yang Q, Gao J, Wang TY, Ding JC, Hu PF
Journal of Inflammation Research 2023, 16:4733-4749
Published Date: 18 October 2023
Identifying and Validating GSTM5 as an Immunogenic Gene in Diabetic Foot Ulcer Using Bioinformatics and Machine Learning
Shi H, Yuan X, Liu G, Fan W
Journal of Inflammation Research 2023, 16:6241-6256
Published Date: 20 December 2023
Machine Learning Predictive Model for Septic Shock in Acute Pancreatitis with Sepsis
Xia Y, Long H, Lai Q, Zhou Y
Journal of Inflammation Research 2024, 17:1443-1452
Published Date: 5 March 2024
Comprehensive Analysis of Programmed Cell Death-Related Genes in Diagnosis and Synovitis During Osteoarthritis Development: Based on Bulk and Single-Cell RNA Sequencing Data
Zhou J, Jiao S, Huang J, Dai T, Xu Y, Xia D, Feng Z, Chen J, Li Z, Hu L, Meng Q
Journal of Inflammation Research 2025, 18:751-778
Published Date: 17 January 2025
Integrated Analysis of Ferroptosis and Immune Infiltration in Ulcerative Colitis Based on Bioinformatics
Cai D, Hu W, Cai Y, Fang T, Chen X
Journal of Inflammation Research 2025, 18:3535-3549
Published Date: 10 March 2025