")
Back to Journals » Journal of Inflammation Research » Volume 15
IFN-γ and LPS Induce Synergistic Expression of CCL2 in Monocytic Cells via H3K27 Acetylation
Authors Akhter N, Kochumon S, Hasan A , Wilson A, Nizam R, Al Madhoun A , Al-Rashed F , Arefanian H , Alzaid F, Sindhu S , Al-Mulla F , Ahmad R
Received 28 March 2022
Accepted for publication 2 July 2022
Published 27 July 2022 Volume 2022:15 Pages 4291—4302
DOI https://doi.org/10.2147/JIR.S368352
Checked for plagiarism Yes
Review by Single anonymous peer review
Peer reviewer comments 2
Editor who approved publication: Dr Adam D Bachstetter
Nadeem Akhter,1 Shihab Kochumon,1 Amal Hasan,1 Ajit Wilson,1 Rasheeba Nizam,2 Ashraf Al Madhoun,2,3 Fatema Al-Rashed,1 Hossein Arefanian,1 Fawaz Alzaid,2,4 Sardar Sindhu,1,3 Fahd Al-Mulla,1 Rasheed Ahmad1
1Immunology & Microbiology Department, Dasman Diabetes Institute, Kuwait City, Kuwait; 2Genetics & Bioinformatics, Dasman Diabetes Institute, Kuwait City, Kuwait; 3Animal and Imaging Core Facility, Dasman Diabetes Institute, Kuwait City, Kuwait; 4Institut Necker Enfants Malades (INEM), French Institute of Health and Medical Research (INSERM), Immunity & Metabolism of Diabetes (IMMEDIAB), Université de Paris Cité, Paris, France
Correspondence: Rasheed Ahmad, Immunology & Microbiology Department, Dasman Diabetes Institute, Kuwait City, Kuwait, Tel +965 2224 2999 Ext. 4311, Email [email protected]
Background: Overexpression of CCL2 (MCP-1) has been implicated in pathogenesis of metabolic conditions, such as obesity and T2D. However, the mechanisms leading to increased CCL2 expression in obesity are not fully understood. Since both IFN-γ and LPS levels are found to be elevated in obesity and shown to be involved in the regulation of metabolic inflammation and insulin resistance, we investigated whether these two agents could synergistically trigger the expression of CCL2 in obesity.
Methods: Monocytes (Human monocytic THP-1 cells) were stimulated with IFN-γ and LPS. CCL2 gene expression was determined by real-time RT-PCR. CCL2 protein was determined by ELISA. Signaling pathways were identified by using epigenetic inhibitors and STAT1 siRNA. Acetylation of H3K27 was analyzed by Western blotting. The acetylation level of histone H3K27 in the transcriptional initiation region of CCL2 gene was determined by ChIP-qPCR.
Results: Our results show that the co-incubation of THP-1 monocytes with IFN-γ and LPS significantly enhanced the expression of CCL2, compared to treatment with IFN-γ or LPS alone. Similar results were obtained using primary monocytes and macrophages. Interestingly, IFN-γ priming was found to be more effective than LPS priming in inducing synergistic expression of CCL2. Moreover, STAT1 deficiency significantly suppressed this synergy for CCL2 expression. Mechanistically, we showed that IFN-γ priming induced acetylation of lysine 27 on histone 3 (H3K27ac) in THP-1 cells. Chromatin immunoprecipitation (ChIP) assay followed by qRT-PCR revealed increased H3K27ac at the CCL2 promoter proximal region, resulting in stabilized gene expression. Furthermore, inhibition of histone acetylation with anacardic acid suppressed this synergistic response, whereas trichostatin A (TSA) could substitute IFN-γ in this synergy.
Conclusion: Our findings suggest that IFN-γ, in combination with LPS, has the potential to augment inflammation via the H3K27ac-mediated induction of CCL2 in monocytic cells in the setting of obesity.
Keywords: CCL2, monocytes/macrophages, LPS, IFN-γ, H3K27 ac, inflammation
Introduction
Obesity has spread by epidemic proportions, affecting a large number of people globally and placing them at high risk of developing several chronic metabolic diseases including type 2 diabetes (T2D), metabolic syndrome, cardiovascular disease and fatty liver.1–3 Chronic low-grade inflammation is a hallmark of obesity, resulting from continuous production of inflammatory cytokines and chemokines by the expanding adipose tissue under the state of overnutrition.4–7 Adipose inflammation plays a central role in the development of numerous obesity-related metabolic disorders.8–10 It has been well documented that there is an increase in macrophage accumulation in white adipose tissue of obese mice and humans, and these macrophages predominantly contribute to induction of local and systemic inflammation and insulin resistance.11–15
Chemokines are small chemoattractant proteins that impact the trafficking of immune cells to the sites of inflammation. C-C chemokine ligand (CCL)-2, also called macrophage chemoattractant protein (MCP)-1, plays a key role in recruiting monocytes, the precursors to macrophages that accumulate in adipose tissue during obesity.11,16,17 Functionally, CCL2 interacts with chemokine receptor 2 (CCR2) on the surface of monocytes and initiates their tissue infiltration.18 Following this monocytic extravasation into the adipose tissue and differentiation into resident M1-like inflammatory macrophages, CCL2 production further increases in both plasma and adipose tissue of obese mice and humans.11,19–21 However, the underlying mechanism of CCL2 overproduction in obesity remains unclear. Although there exists some conflicting data on levels of proinflammatory cytokines expressed in human obesity,22,23 the levels of both LPS and IFN-γ have often been found to be increased in obese individuals,24–27 but whether or not they inter-play to regulate the expression of CCL2 in monocytic cells remains to be investigated.
IFN-γ is known to prime cells and potentiate the effects of LPS stimulation.28 Regarding the intracellular events, IFN-γ binds to a hetero-oligomeric (IFNGR1/IFNGR2), class II cytokine receptor and activates a Jak-Stat signaling pathway implicating the Janus family kinases (Jak1 and Jak2) and the transcription factor called signal transducer and activator of transcription 1 (STAT1). In this complex, Jak1/Jak2 transactivates each other and phosphorylate IFNGR1, forming a paired set of STAT1 docking sites on the ligand-activated IFN-γ receptor. STAT1 molecules are associated with the paired docking sites, being in close proximity to activated Jaks1/2 and are activated by phosphorylation on a single tyrosine residue (Y701). Tyrosine-phosphorylated STAT1 molecules dissociate from the receptor complex and undergo SH2 domain-mediated dimerization. Activated STAT1 translocates to the nucleus and binds to its cognate promoter DNA at the gamma interferon-activated site (GAS).29,30
Chronic upregulation of CCL2 is often mediated by epigenetic mechanisms consisting of histone modification, and nucleosome positioning. In particular, histone acetylation has been shown to play important roles in upregulating CCL2 expression in inflammatory cells.31–33 Regarding IFN-γ and LPS stimulation, IFN-γ stably marks gene promoters by enhancing histone acetylation and initiates priming-mediated chromatin remodeling prior to LPS stimulation. It was shown that IFN-γ primes the regulatory elements via recruitment of STAT1 and the HATs that promote histone acetylation.34
The aim of this study was to investigate cooperativity between IFN-γ and LPS for augmenting CCL2 expression in monocytic cells/macrophages and to identify the underlying signaling mechanism involved. Herein, we present the data, suggesting that IFN-γ/LPS co-stimulation has the potential to augment inflammation via the increased CCL2 production by monocytic cells in metabolic condition, such as obesity.
Materials and Methods
Cell Cultures and Stimulation
Human monocytic leukemia THP-1 cell line was purchased from American Type Culture Collection (ATCC) and propagated in RPMI-1640 culture medium (Gibco, Life Technologies, Grand Island, USA), containing 10% fetal bovine serum (FBS; Gibco, Life Technologies, Grand Island, NY, USA), 2 mM glutamine (Gibco, Invitrogen, Grand Island, NY, USA), 1 mM sodium pyruvate, 10 mM HEPES, 50 U/mL penicillin and 50 μg/mL streptomycin (Gibco, Invitrogen, Grand Island, NY, USA). Human primary monocytes were isolated from peripheral blood samples collected from healthy individuals after their written informed consent, and the study was approved (Protocol #: RA-2010-003) by ethics committee of Dasman Diabetes Institute, Kuwait. Peripheral blood mononuclear cells (PBMCs) were isolated using HistoPaque density gradient method as described.35 PBMCs were seeded in 6-well plates (Costar, Corning Incorporated) at a cell density of 3 × 10⁶ cells per well and cultured in a starvation (serum-free) medium at 37°C for 3 h. Non-adherent cells were removed by gentle repeated washing with a serum-free culture medium and then adherent monocytic cells were removed and incubated for 24 h in RPMI medium containing 2% FBS. Cells were incubated in RPMI medium containing 10%-FBS in a humidified incubator at 37°C and 5% CO2. Cells were stimulated with IFN-γ (10 ng/mL) and/or LPS (10 ng/mL), for 24 h at 37°C. Priming set was harvested by incubating monocyte cells with LPS (10 ng/mL) for 5 hrs, washed and followed by incubation with IFN-γ (10 ng/mL) for 24 hrs. Alternatively, monocytic cells were primed by incubation with IFN-γ (10 ng/mL), washed and incubated with LPS (10 ng/mL) for 24 hrs. Wells for single or combined treatments were also incubated for 24 hrs simultaneously, with untreated well serving as control.
Macrophage Differentiation
THP-1 cells were differentiated into macrophages as previously described.36,37 In brief, THP-1 cells were treated with 10 ng/mL PMA (Phorbol 12-myristate 13-acetate) for three days in RPMI media supplemented with 10% fetal bovine serum (Gibco, Life Technologies, Grand Island, NY, USA), 2 mM glutamine (Gibco, Invitrogen, Grand Island, NY, USA), 1 mM sodium pyruvate, 10 mM HEPES, 100 ug/mL Normocin, 50 U/mL penicillin, and 50 μg/mL streptomycin (Gibco, Invitrogen, Grand Island, NY, USA). Adherent cells were then washed and incubated in serum-free RPMI media for further three days before they were considered ready for treatment.
Real-Time Reverse-Transcription Polymerase Chain Reaction (RT-PCR)
Total RNA was purified from cells lysed in RLT buffer, using RNeasy kit and following the manufacturer’s instructions (Qiagen, Valencia, CA; USA). Integrity/quality of isolated RNA was checked before gene expression analysis by running the aliquots of RNA samples on a denaturing agarose gel stained with ethidium bromide, which yielded 2:1 ratio of the 28S and 18S rRNA bands, respectively (data not shown). The quantity of isolated RNA was determined by using Epoch™ Spectrophotometer System (BioTek, Winooski, USA). RNA samples (1 μg each) were reverse transcribed into cDNA by using random hexamer primers and TaqMan reverse transcription reagents (High-Capacity cDNA Reverse Transcription Kit; 4368814, Applied Biosystems, CA, USA). For real-time RT-PCR, cDNA (50 ng/μL) was amplified using TaqMan® Gene Expression Master Mix 4369016 (Applied Biosystems, CA, USA) and target gene-specific TaqMan Gene Expression Assays (Applied Biosystems, CA, USA) containing forward and reverse primers and a target-specific TaqMan® minor groove binder (MGB) probe labeled with 6-fluorescein amidite (FAM) dye at 5’ end and non-fluorescent quencher (NFQ)-MGB at 3’ end of the probe, with 40 cycles of PCR amplification using 7500 Fast Real-Time PCR System (Applied Biosystems, CA, USA). Each cycle comprised the denaturation (95°C for 15 sec), annealing/extension (60°C for 1 min) following uracil DNA glycosylase activation (50°C for 2 min), and AmpliTaq Gold enzyme activation (95°C for 10 min). Glyceraldehyde 3-phosphate dehydrogenase (GAPDH) expression was used as internal control to normalize the differences in individual samples. For real-time PCR, each cDNA sample (50 ng/μL) was amplified using Inventoried TaqMan Gene Expression Assay products including, GAPDH: Hs03929097_g1; CCL2: Hs00234140_m1, and STAT1: Hs01013996_m1 containing two gene-specific primers and one TaqMan MGB probe (6-FAM dye-labeled) using a TaqMan® Gene Expression Master Mix (Applied Biosystems, Foster City, CA, USA) in Quant Fast Real-Time PCR System (Applied Biosystems, Foster City, CA, USA). Target mRNA levels were normalized against GAPDH mRNA and gene expression relative to control was calculated using 2−ΔΔCT method. Relative mRNA expression was expressed as fold expression over average of control gene expression.
ELISA
CCL2-secreted protein levels were measured in the supernatants of THP-1 cells stimulated with IFN-γ (10 ng/mL), LPS (10 ng/mL), alone or in combination, using human CCL2 DuoSet ELISA kit and following the manufacturer’s instructions (Cat. # DY 279, R&D Systems Inc.). Briefly, 96-well microplates were prepared by coating overnight with diluted capture antibody (100 μL/well). After three washes, plates were blocked by adding 300 μL of Reagent Diluent to each well and incubating at room temperature for 1 h. After three washes as before, appropriately diluted standards, controls, and samples were added to duplicate wells (100 μL/well), and plates were incubated at room temperature for 2 h. After three washes, Streptavidin-HRP was added (100 μL/well) and incubated at room temperature for 20 min in the dark. After washing thrice, substrate solution was added (100 μL/well) and plates were again incubated at room temperature for 20 min in the dark. Eventually, 50 μL of stop solution was added to each well, and the plates were gently tapped to ensure thorough mixing. The optical density (O.D.) was read using a microplate reader at 450 nm, with wavelength correction set to 540 nm or 570 nm. To measure CCL2 concentrations, averages of duplicate readings for each standard, control, and sample were calculated, and the average zero standard O.D. was subtracted from each value. A standard curve was generated by plotting the mean absorbance for each standard on the Y-axis against the concentration on the X-axis to draw a best fit curve through the points on the graph. In order to calculate the final concentrations of CCL2 (pg/mL), concentrations read from the standard curve were multiplied by the dilution factor as required.
Western Blotting
For acetylation, THP-1 monocytic cells in triplicate wells of 6-well plates (1x10⁶ cells/mL per well) cultured in RPMI-1640 complete medium were treated with IFN-γ (10 ng/mL), LPS (10 ng/mL) alone, or in combination for 4 h, in a humidified incubator (5% CO2) and mock-treated cells served as experimental control. Harvested cells were processed for lysate preparation using a cell lysis buffer. The lysates were clarified by centrifugation at 14,000 ×g for 10 min and supernatants were collected. Protein concentration was measured using QuickStart Bradford Dye (Bio-Rad Laboratories). Samples were resolved using 12% SDS-PAGE. The blots were probed with rabbit anti-human antibody against H3K27, Histone H3, p-STAT1 or STAT1 in 1:1000 dilution at 4°C overnight. The antibodies were purchased from Cell Signaling (Cell Signaling Technology, Inc.). The blots were then washed three times with TBS and incubated for 2 h with HRP-conjugated secondary antibody (Promega, Madison, WI, USA) in 1:2500 dilution. Immunoreactive bands were developed using an Amer sham ECL Plus Western Blotting Detection System (GE Health Care, Buckinghamshire, UK) and visualized by ChemiDoc™ MP Imaging Systems (Bio-Rad Laboratories, Hercules, CA, USA).
siRNA-Mediated Genetic Suppression of STAT1
Gene silencing was performed using transient transfection method with an Amaxa Cell Line Nucleofector Kit V (Lonza) and Amaxa Electroporation System (Lonza), following the manufacturers’ instructions. For transient transfection, THP-1 cells (1 × 10⁶) were resuspended in Nucleofector solution and transfected separately using 30 nM STAT1 siRNA and scrambled negative control siRNA. After 40 hrs, transfected cells were treated with IFN-γ (10 ng/mL) and LPS (10 ng/mL) for 24 hrs. Cells were harvested for RNA isolation, and conditioned media were collected to measure CCL2 production in supernatants. Real-time RT-PCR was also performed to assess the effective suppression of constitutive STAT1 in THP-1 cells transfected with STAT1 siRNA and scrambled negative-control siRNAs.
Chromatin Immunoprecipitation (ChIP) Assay
ChIP was performed using the Simple ChIP Enzymatic Chromatin Immunoprecipitation Kit (Cell Signaling Technology, Inc), according to the manufacturer’s instructions. Briefly, THP1 cells stimulated with IFN-γ (10 ng/mL) and/or LPS (10 ng/mL) were crosslinked with formaldehyde and digested with micrococcal Nuclease followed by sonication to yield fragments ranging from 200 to 800 bp. The digested chromatin fragments were subjected to immunoprecipitation using primary antibodies specific to H3K27 (Cell Signaling Technology, Inc), Histone H3 (Positive IP control; Cell Signaling Technology, Inc.) and Normal Rabbit IgG (Negative IP control, Cell Signaling Technology, Inc), for overnight at 4°C. The chromatin was reverse crosslinked and DNA from the ChIP fraction was purified using the spin column method. The DNA was then analyzed by qPCR to check the H3K27 acetylation level using Epitect qPCR primers (Table S1) specific to the different regions close to the transcription start site of CCL2 proximal promotor region (Figure S1).
Statistical Analysis
Statistical analysis was performed using GraphPad Prism software (version 6.07, La Jolla, CA, USA). Data are shown as mean ± standard error of the mean (SEM), unless otherwise indicated. Student’s t-test was used to determine if the means of the two data sets differed significantly from each other, and the one-way ANOVA followed by post-hoc Tukey’s test were used to compare the means of more than two groups, with one categorical independent variable and one quantitative dependent variable. Tukey’s test yielded pairwise comparisons among each of the groups using a conservative error estimate to find the groups that differed significantly from one another. For all analyses, data from a minimum of three sample sets were used for statistical calculation. All p-values <0.05 were considered significant (ns, non-significant, *p < 0.05, **p < 0.01, ***p < 0.001, and ****p < 0.0001).
Results
IFN-γ and LPS Synergistically Induce CCL2 in Monocytic Cells
To test whether IFN-γ and LPS could synergistically induce the expression of CCL2, THP-1 monocytic cells were exposed to IFN-γ and LPS, alone or in combination, the treatment with the vehicle served as control. Treatments with IFN-γ or LPS alone induced CCL2 gene expression and protein release. Combined exposure to IFN-γ/LPS resulted in a further increase in CCL2 gene expression and protein release (Figure 1A and B). Similar results were obtained using primary human monocytes (Figure 1C). Since macrophages play a key role in adipose tissue inflammation, next we treated the THP-1-derived macrophages with IFN-γ and/or LPS. As expected, we found a synergic upregulation of CCL2 protein expression in macrophages, following co-stimulation with IFN-γ and LPS (Figure 1D and E). These results show the synergistic effect of IFN-γ/LPS co-stimulation on the production of CCL2 by monocytic cells and macrophages. Next, we investigated the priming effect of one treatment on the stimulatory response to the other. In this regard, we found that priming effect of IFN-γ followed by LPS stimulation was significantly more robust, than other way around, in driving CCL2 gene and protein expression in monocytic cells (Figure 1F and G)
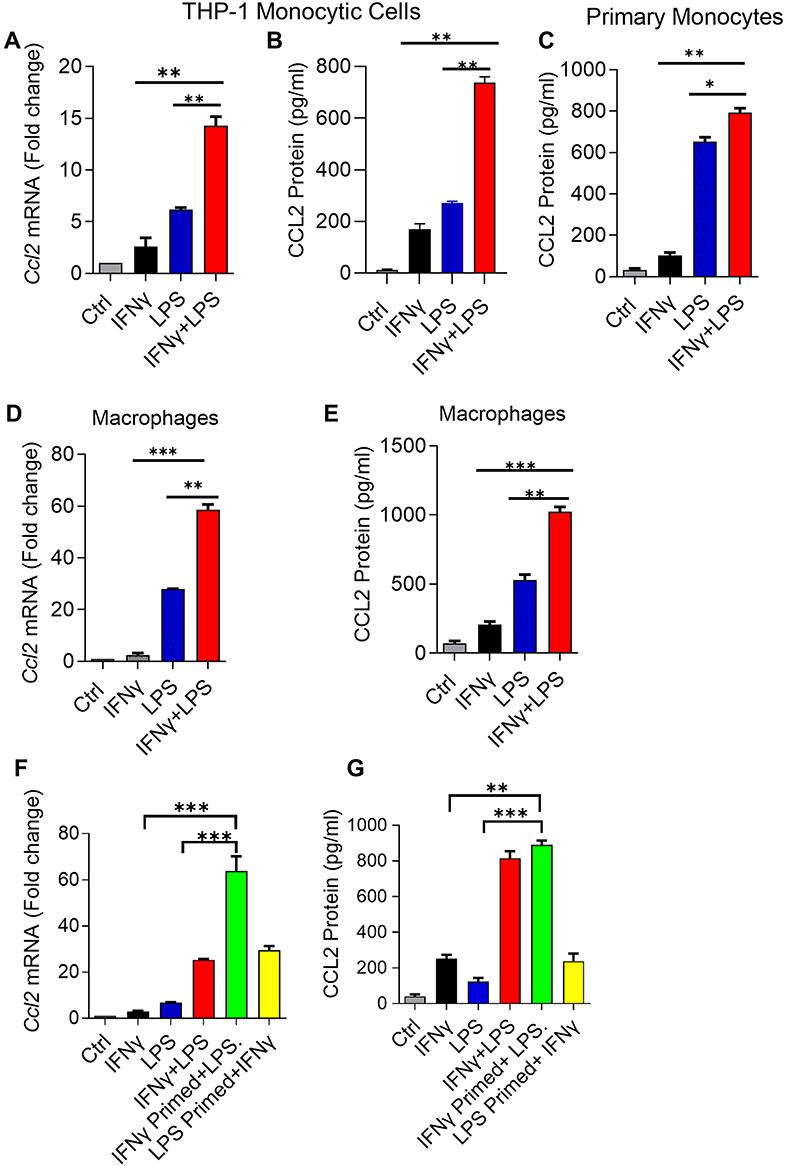 |
Figure 1 IFN-γ and LPS cooperatively induce CCL2 in monocytic cells/macrophages. THP-1 monocytic cells, primary monocytes, and THP-1-derived macrophages were treated for 24h with IFN-γ (10 ng/mL) alone or in combination with LPS (10 ng/mL). Total RNA was extracted and Ccl2 mRNA expression was quantified by real-time RT-PCR. CCL2 protein was measured in cell supernatants using commercial ELISA kit. All data are expressed as mean ± SEM (n ≥ 3). Group means between two data sets were compared using Student’s t-test and those of more than two data sets were compared using one-way ANOVA with post-hoc Tukey’s test. All p-values < 0.05 were considered significant (ns, non-significant, *p< 0.05, **p< 0.01, and ***p< 0.001). Elevated CCL2 gene (A) and secreted protein (B) expression is shown in THP-1 monocytic cells co-stimulated with IFN-γ and LPS compared to cells treated with IFN-γ and LPS alone. Primary monocytes (C) also show increased CCL2 secreted protein expression after co-stimulation with IFN-γ and LPS compared to stimulation with either IFN-γ or LPS. In addition to monocytic cells and primary monocytes, THP-1-derived macrophages co-stimulated with IFN-γ and LPS also display elevated expression of CCL2 transcripts (D) and secreted protein (E). (F and G) THP-1 cells were primed with IFN-γ and LPS, separately, followed by LPS and IFN-γ treatment, respectively, for 24h. Ccl2 mRNA and protein expression was quantified and statistically analyzed as described above. The data show that only the IFN-γ priming followed by LPS stimulation led to elevated CCL2 mRNA (F) and secreted protein (G) expression in monocytic cells compared to controls stimulated with IFN-γ or LPS alone. |
STAT1 Deficiency Diminishes the Synergy Between IFN-γ and LPS for CCL2 Expression
To evaluate whether the synergy between INF-γ and LPS, leading to amplified CCL2 expression in monocytes was dependent on STAT1, we transfected cells with STAT1 siRNA to silence STAT1 expression, which resulted in a more than 40% reduction of STAT1 mRNA levels compared to scrambled siRNA control (STAT1 mRNA: p = 0.0182) (Figure 2A). Accordingly, the expression of CCL2 mRNA and protein was significantly reduced in STAT1 siRNA-transfected monocytic cells in response to IFN-γ/LPS co-stimulation, compared to scrambled siRNA-transfected controls (Figure 2B and C). Moreover, we confirm that IFN-γ mediates stat1 phosphorylation in monocytic cells (Figure 2D).
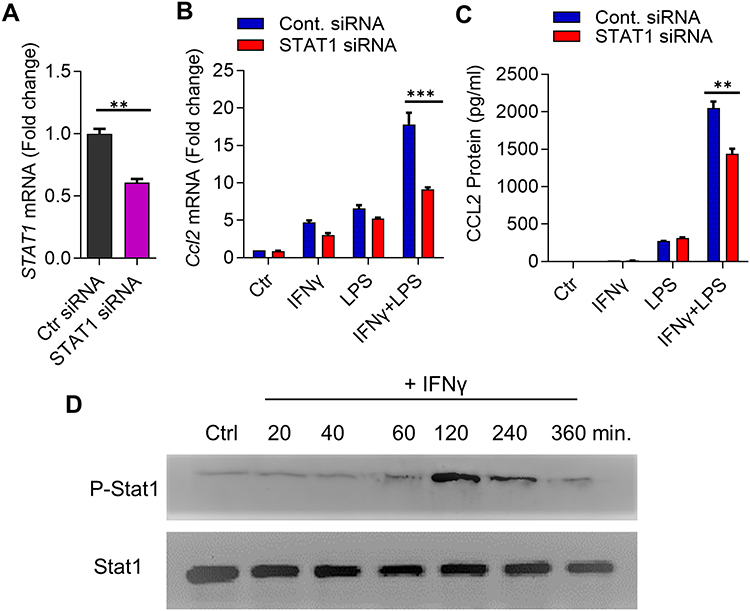 |
Figure 2 Synergistic expression of CCL2 is dependent on STAT1. (A) THP-1 monocytic cells were transfected with control/scrambled siRNA or STAT1 siRNA and incubated for 40h. Total RNA was extracted and real-time RT-PCR was performed to measure STAT1 mRNA expression. Target mRNA levels were normalized against GAPDH mRNA and gene expression relative to control was calculated using 2−ΔΔCT method. Relative STAT1 mRNA expression was expressed as fold expression over average of control (scrambled siRNA) gene expression. All data are expressed as mean ± SEM (n ≥ 3) and group means between two data sets were compared using Student’s t-test. All p-values < 0.05 were considered significant. The data show significant suppression of STAT1 mRNA expression in cells transfected with STAT1 siRNA compared to control siRNA transfected cells (**p< 0.01). (B and C) STAT1-deficient cells were treated for 24h with IFN-γ (10 ng/mL) and/or LPS (10 ng/mL) and Ccl2 mRNA (B) and protein (C) expression was determined using real-time RT-PCR and ELISA, respectively. Target mRNA levels were normalized against GAPDH mRNA and gene expression relative to control was calculated using 2−ΔΔCT method. Relative CCL2 mRNA expression was expressed as fold change over average of control (vehicle treatment) gene expression. All data are expressed as mean ± SEM (n ≥ 3) and group means between two data sets were compared using Student’s t-test. The data show significant suppression of (B) CCL2 mRNA (***p< 0.001) and (C) CCL2 secreted protein (**p< 0.01) in cells co-stimulated with IFN-γ and LPS as compared to those stimulated with IFN-γ or LPS alone. (D) Western blot showing phosphorylation of STAT1 after IFN-γ (10 ng/mL) treatment over time indicates the optimal STAT1 phosphorylation at 120 min. |
IFN-γ-Mediated H3K27 Acetylation is Involved in Synergistic Expression of CCL2
Given that IFN-γ priming induces H3K27 acetylation, a histone mark for active enhancers and promoters of several genes,34 we asked whether the H3K27 acetylation was involved in this synergistic upregulation of CCL2 gene expression by IFN-γ. We incubated monocytic cells with vehicle, IFN-γ, LPS, or IFN-γ+LPS for 4 hrs. Western blots show that IFN-γ treatment enhances the H3K27 acetylation in monocytic cells, whereas LPS treatment does not induce H3K27 acetylation (Figure 3A and B).
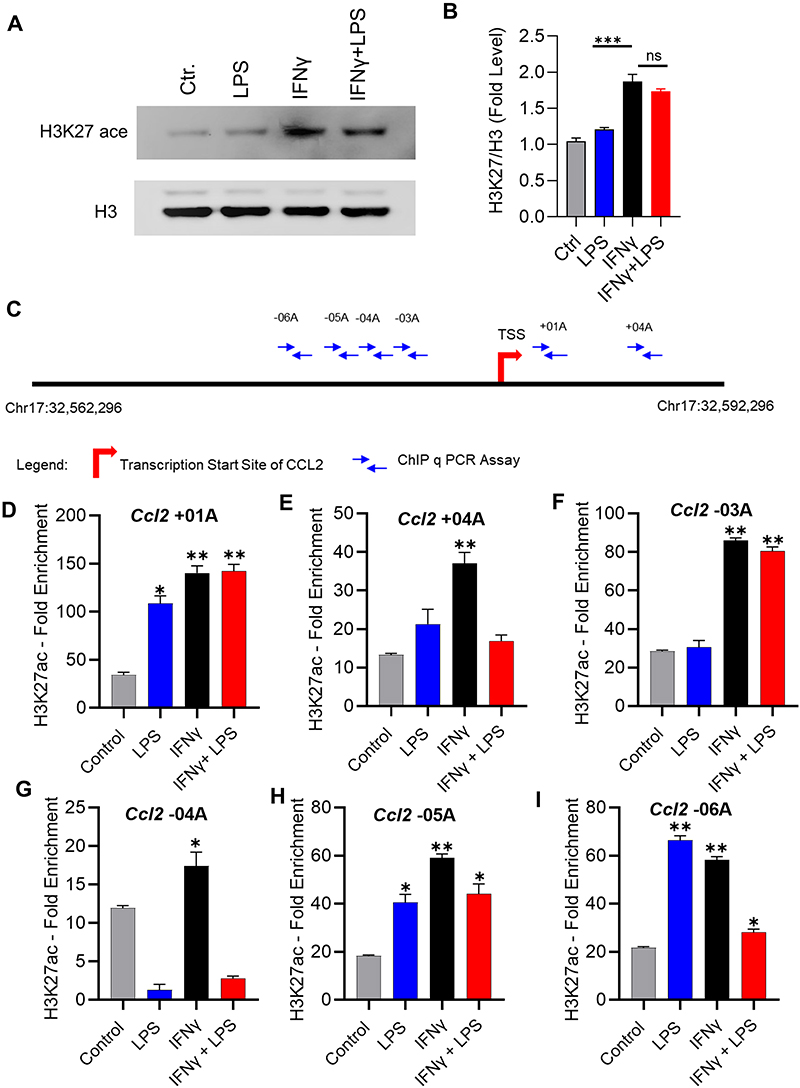 |
Figure 3 H3K27 acetylation levels at different sites of CCL2 promotor region. (A) THP-1 monocytic cells were treated with IFN-γ (10 ng/mL) and/or LPS (10 ng/mL) for 4 h and the treatment with vehicle alone served as control. Cell lysates were used for determination of H3K27 acetylation by Western blotting. Briefly, cell lysates were resolved using 12% SDS-PAGE and blots were probed with rabbit anti-human H3K27 antibody (1:1000 dilution) at 4°C overnight. Blots were washed, incubated for 2h with HRP-conjugated secondary antibody (1:2500 dilution), and immunoreactive bands were developed and visualized using ChemiDoc™ MP Imaging Systems. (B) Western blot band densities were quantified and data were expressed as mean ± SEM (n = 3) values which were compared for various treatments using one-way ANOVA and post-hoc Tukey’s test. All p-values < 0.05 were considered significant (ns, non-significant, *p< 0.05, **p< 0.01, and ***p< 0.001). The data show increased H3K27 acetylation (H3K27 ac) in the cells stimulated with IFN-γ or IFN-γ+LPS compared to cells stimulated with LPS only (***p< 0.001). (C) The schematic diagram of CCL2 gene promotor region is shown. (D–I) THP1 cells were stimulated with IFN-γ (10 ng/mL) and/or LPS (10 ng/mL) by incubation for 24h at 37°C. Chromatin immunoprecipitation was done on cell lysate as described in methodology using antibodies specific to H3K27, Histone H3, and normal rabbit IgG for overnight at 4°C. H3K27 acetylation levels induced by treatments compared to control (vehicle) were detected by qPCR using primers specific to the closest regions of transcription start site at the CCL2 promotor. Data (mean ± SEM, n = 3) were expressed as fold enrichment levels and were compared for different treatments against control using one-way ANOVA with post-hoc Tukey’s test. All p-values < 0.05 were considered significant (*p< 0.05 and **p< 0.01). |
To further identify acetylation levels on the CCL2 promoter regions, monocytic cells were treated with IFN-γ, LPS, or IFN-γ+LPS for 24 hrs and cell lysates were prepared. Chromatin immunoprecipitation was done on cell lysates using H3K27ac antibody. Acetylation level was detected by qPCR using primers specific to the closest regions of transcription start site of CCL2 promotor (Figure 3C). ChIP-qPCR analysis reveals that IFN-γ treatment promotes H3K27 acetylation on all CCL2 promoter regions (Figure 3D and I). Overall, these data show that IFN-γ treatment induces the H3K27 acetylation, which enhances the accessibility of the CCL2 promoter.
Inhibition or Activation of Acetylation by Pharmacological Agents Affects the Synergy Between IFN-γ and LPS
To confirm the role of histone acetylation, we examined whether the inhibition of histone acetyl transferases (HATs) impacted the IFN-γ/LPS synergy for CCL2 gene expression and protein secretion. Given that pharmacologic inhibitor of HATs, anacardic acid interrupts the histone acetylation,38 monocytic cells were pre-treated with anacardic acid, and then co-stimulated with IFN-γ and LPS. Notably, CCL2 gene and protein expression and was significantly diminished in cells treated with anacardic acid before IFN-γ/LPS co-stimulation, compared to likewise stimulated controls without pre-treatment with anacardic acid (Figure 4A and B). On the contrary, given that histone deacetylase (HDAC) inhibitor trichostatin A (TSA) induces the histone acetylation and increases gene expression,39 we asked whether TSA could promote CCL2 expression by mimicking the effect of IFN-γ and substituting it in the synergistic response with LPS. Our data show that pretreatment of monocytic cells with TSA, followed by exposure to LPS promoted the CCL2 gene and protein expression compared to non-TSA treated controls, confirming the key role of histone acetylation in this synergy (Figure 4C and D).
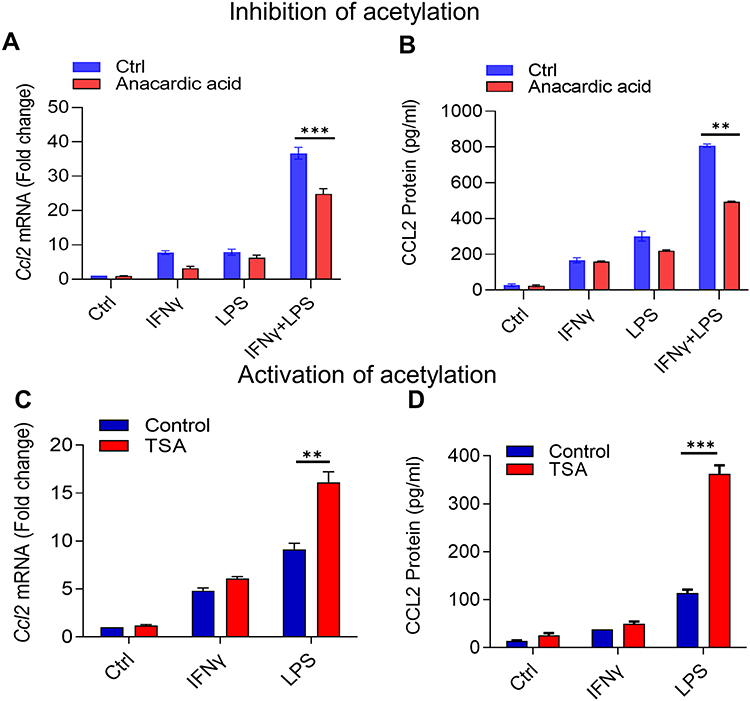 |
Figure 4 Histone acetyltransferases (HATs) and histone deacetylases (HDACs) regulate synergy between IFN-γ and LPS for the CCL2 production. THP-1 monocytic cells were treated with anacardic acid (HATs inhibitor; 50 μM) overnight or with TSA (HDACs inhibitor; 25 nM) for 6 h, followed by treatments with IFN-γ (10 ng/mL) and/or LPS (10 ng/mL) for 24h, and the treatment with vehicle alone served as control. Ccl2 mRNA expression was determined by real-time RT-PCR and target gene expression were normalized to GAPDH expression. Relative changes in Ccl2 gene expression were calculated using 2−ΔΔCT method and expressed as fold change over its expression in control (vehicle treatment). CCL2 secreted protein expression was detected by ELISA as described in materials and methods. All data were expressed as mean ± SEM values (n = 3) and group means between two data sets were compared using Student’s t-test. All p-values < 0.05 were considered significant (**p<0.01, ***p<0.001). The data show the reduced expression of CCL2 (A) mRNA (***p<0.001) and (B) secreted protein (**p<0.01) in the cells that were treated with HAT-inhibitor anacardic acid before co-stimulation with IFN-γ and LPS as compared to similarly stimulated cells that were not pre-treated with anacardic acid. Interestingly, increased expression of CCL2 (C) mRNA (**p<0.01) and (D) secreted protein (***p<0.001) were observed in the cells that were treated with HDAC-inhibitor TSA before stimulation with LPS only as compared to similarly stimulated cells that were not pre-treated with TSA, suggesting that TSA priming could mimic effect of and substitute for IFN-γ in cooperativity with LPS. |
Discussion
CCL2 is a key chemokine involved in monocytic migration to the site of inflammation. Herein, we show that IFN-γ and LPS, the two inflammatory initiators of inflammation, may interact synergistically to enhance CCL2 expression in monocytes/macrophages. Proinflammatory M1-like polarization of macrophages requires a pro-oxidant Th1 microenvironment, marked by two initiation signals, such as IFN-γ and LPS or TNF-α. IFN-γ and TNF-α are known to induce expression of several proinflammatory genes in macrophages.40 Our data show that stimulation of monocytes/macrophages with IFN-γ and/or LPS induces CCL2 expression. In partial agreement with this, a previous study showed that IFN-γ stimulation induced CCL2 expression in human astrocytoma cells.41 LPS stimulation of monocytes/macrophages,42 PBMCs,43 and renal tubular cells44 also induces CCL2 expression. Synergistic amplification of CCL2 expression by co-stimulation was a plausible outcome of this study. This is because macrophages are known transducers of IFNG signalling and are also first-responders to LPS via its target receptors TLR4/CD14.45 Another contributory factor in this synergy may be the strong stimulatory signaling co-induced by LPS and IFN-γ via the NF-κB pathway.46,47
Next, we found that IFN-γ-priming followed by LPS stimulation, but not LPS-priming followed by IFN-γ stimulation, was a more potent inducer of CCL2 in monocytic cells. Our findings concur with the previous reports, indicating a strong priming effect of IFN-γ toward enhancing LPS stimulation of cells.28,48 Overall, the mechanisms underlying the IFN-γ priming effect appear to be complex, such as involving CD14 (LPS receptor) upregulation,49 altered mRNA turnover,50 inflammatory autocrine signaling,28 and the role of CR3/CR4 complement receptors.51 In addition, it was also suggested that IFN-γ per se may have direct transcriptional effects.52 Similarly, another study showed that IFN-γ priming could overcome the LPS-unresponsiveness of macrophages that were isolated from LPS-resistant (C3H/HeJ) mice.53 Overall, increasing evidence supports that IFN-γ primes cells and synergizes with LPS to activate inflammatory programs via diverse molecular mechanisms, such as chromatin remodeling and metabolic reprogramming.34,54
Among chemokines, CCL2 and CXCL10 (IP-10) are known as IFN-regulated chemokines that function as potent attractors of monocytes, macrophages, T cells, natural killer (NK) cells, and antigen presenting dendritic cells (DCs) to the sites of inflammation, infection, or tissue damage.55,56 We further show that the IFNγ-LPS synergy for CCL2 expression in monocytic cells was STAT1-dependent as the genetic knockdown of STAT1 led to a significant CCL2 suppression at the transcriptional and translational levels. Of note, STATs are recognized as part of the interferon system. The major STAT protein activated by IFN-γ is STAT1, and many IFN-γ functions are mediated through direct activation of immune effector processes by STAT1. For example, phagocytic and microbicidal activities, as well as expression of cytokines, chemokines, and antigen presenting molecules.57 Like IFN-γ, LPS stimulation of macrophages also induces STAT1 phosphorylation which is required for promoting optimal expression of LPS-inducible genes.58 Whether sequentially or simultaneously treated with IFN-γ and LPS, STAT1 appears to be a convergence point for proinflammatory immune responses in monocytes or macrophages,59 which is in agreement with the synergy between these two proinflammatory stimuli for CCL2 expression.
Our results further provide a critical mechanism of IFN-γ-dependent epigenetic regulation, in which H3K27 acetylation instructs the synergic crosstalk between IFN-γ and LPS to drive expression of CCL2 in monocytic cells, suggesting a new target for treating metabolic inflammation. Of note, H3K27 modification plays a key role in regulating gene expression, where acetylation (H3K27Ac) and methylation (H3K27me3) promote gene expression and repression/silencing, respectively.60 We found that H3K27 acetylation was significantly higher at Ccl2+01A and Ccl2-03A transcription start sites in CCL2 promoter. In contrast to this inflammatory gene (CCL2) induction by H3K27 acetylation, H3K27 trimethylation (H3K27m3) induced repression of the anti-inflammatory pathway genes (MERTK, PPARG, and RANK).61 As opposed to the stimulatory effect of IFN-γ priming on LPS-induced H3K27 acetylation and CCL2 expression that we observed, a suppressive effect of IFN-γ priming was observed on LPS-induced H3K27 acetylation and IL10 expression which, taken together, supports a broader regulatory role of IFN-γ priming in monocytes/macrophages.62 Furthermore, we found that inhibition of acetyltransferases (HATs) by anacardic acid, which promote acetylation, resulted in suppression of the additive effect of IFN-γ and LPS on CCL2 production. However, inhibition of HDACs further enhanced the synergistic expression and production of CCL2 in response to IFN-γ/LPS. These findings clearly highlight the importance of acetylation in this cooperativity. Another study by Yan et al showed that HDAC9 deficiency led to reduced inflammation.63 It could be possibly a cell-type dependent mechanism that differentially regulates an epigenetic switch in monocytes vs effector T lymphocytes.
Conclusion
Taken together, our work highlights the significance of IFN-γ-LPS synergy, leading to CCL2 expression in monocytic cells via a mechanism involving H3K27 acetylation. Future studies will be needed to identify the additional mechanisms of induction of inflammatory and repression of anti-inflammatory pathways by IFN-γ/LPS co-stimulation and to find out how they relate to monocyte/macrophage functions in the context of metabolic inflammation.
Author Contributions
All authors made substantial contributions to conception and design, acquisition of data, or analysis and interpretation of data; took part in drafting the article or revising it critically for important intellectual content; agreed on the journal to which the article will be submitted; gave final approval for the version to be published; and agreed to be accountable for all aspects of the work.
Funding
This research was funded by Kuwait Foundation for the Advancement of Sciences, grant number RA AM 2016-007.
Disclosure
The authors declare that they have no conflicts of interest.
References
1. Abe T, Barber GN. Cytosolic-DNA-mediated, STING-dependent proinflammatory gene induction necessitates canonical NF-κB activation through TBK1. J Virol. 2014;88(10):5328–5341. doi:10.1128/JVI.00037-14
2. Reilly MP, Rader DJ. The metabolic syndrome: more than the sum of its parts? Circulation. 2003;108(13):1546–1551. doi:10.1161/01.CIR.0000088846.10655.E0
3. Fabbrini E, Sullivan S, Klein S. Obesity and nonalcoholic fatty liver disease: biochemical, metabolic, and clinical implications. Hepatology. 2010;51(2):679–689. doi:10.1002/hep.23280
4. Kochumon S, Al Madhoun A, Al-Rashed F, et al. Elevated adipose tissue associated IL-2 expression in obesity correlates with metabolic inflammation and insulin resistance. Sci Rep. 2020;10(1):16364. doi:10.1038/s41598-020-73347-y
5. Kochumon S, Madhoun AA, Al-Rashed F, et al. Adipose tissue gene expression of CXCL10 and CXCL11 modulates inflammatory markers in obesity: implications for metabolic inflammation and insulin resistance. Ther Adv Endocrinol Metab. 2020;11:2042018820930902. doi:10.1177/2042018820930902
6. Sindhu S, Kochumon S, Thomas R, Bennakhi A, Al-Mulla F, Ahmad R. Enhanced adipose expression of Interferon Regulatory Factor (IRF)-5 associates with the signatures of metabolic inflammation in diabetic obese patients. Cells. 2020;9:3. doi:10.3390/cells9030730
7. Sindhu S, Thomas R, Kochumon S, et al. Increased adipose tissue expression of Interferon Regulatory Factor (IRF)-5 in obesity: association with metabolic inflammation. Cells. 2019;8(11):11. doi:10.3390/cells8111418
8. Brestoff JR, Artis D. Immune regulation of metabolic homeostasis in health and disease. Cell. 2015;161(1):146–160. doi:10.1016/j.cell.2015.02.022
9. Kochumon S, Al-Rashed F, Abu-Farha M, Devarajan S, Tuomilehto J, Ahmad R. Adipose tissue expression of CCL19 chemokine is positively associated with insulin resistance. Diabetes Metab Res Rev. 2019;35(2):e3087. doi:10.1002/dmrr.3087
10. Hasan A, Kochumon S, Al-Ozairi E, Tuomilehto J, Ahmad R. Association between adipose tissue interleukin-33 and immunometabolic markers in individuals with varying Degrees of Glycemia. Dis Markers. 2019;2019:7901062. doi:10.1155/2019/7901062
11. Ahmad R, Al-Roub A, Kochumon S, et al. The synergy between palmitate and TNF-α for CCL2 production is dependent on the TRIF/IRF3 pathway: implications for metabolic inflammation. J Immunol. 2018;200(10):3599–3611. doi:10.4049/jimmunol.1701552
12. Kumari M, Wang X, Lantier L, et al. IRF3 promotes adipose inflammation and insulin resistance and represses browning. J Clin Invest. 2016;126(8):2839–2854. doi:10.1172/JCI86080
13. Weisberg SP, McCann D, Desai M, Rosenbaum M, Leibel RL, Ferrante AW
14. Ruytinx P, Proost P, Van Damme J, Struyf S. Chemokine-induced macrophage polarization in inflammatory conditions. Front Immunol. 2018;9:1930. doi:10.3389/fimmu.2018.01930
15. Tucureanu MM, Rebleanu D, Constantinescu CA, et al. Lipopolysaccharide-induced inflammation in monocytes/macrophages is blocked by liposomal delivery of G(i)-protein inhibitor. Int J Nanomedicine. 2018;13:63–76. doi:10.2147/IJN.S150918
16. Kojta I, Chacińska M, Błachnio-Zabielska A. Obesity, bioactive lipids, and adipose tissue inflammation in insulin resistance. Nutrients. 2020;12(5):1305. doi:10.3390/nu12051305
17. Kwaifa IK, Bahari H, Yong YK, Noor SM. Endothelial dysfunction in obesity-induced inflammation: molecular mechanisms and clinical implications. Biomolecules. 2020;10:291. doi:10.3390/biom10020291
18. Inouye KE, Shi H, Howard JK, et al. Absence of CC chemokine ligand 2 does not limit obesity-associated infiltration of macrophages into adipose tissue. Diabetes. 2007;56(9):2242–2250. doi:10.2337/db07-0425
19. Kanda H, Tateya S, Tamori Y, et al. MCP-1 contributes to macrophage infiltration into adipose tissue, insulin resistance, and hepatic steatosis in obesity. J Clin Invest. 2006;116(6):1494–1505. doi:10.1172/JCI26498
20. Sartipy P, Loskutoff DJ. Monocyte chemoattractant protein 1 in obesity and insulin resistance. Proc Natl Acad Sci U S A. 2003;100(12):7265–7270. doi:10.1073/pnas.1133870100
21. Bruun JM, Helge JW, Richelsen B, Stallknecht B. Diet and exercise reduce low-grade inflammation and macrophage infiltration in adipose tissue but not in skeletal muscle in severely obese subjects. Am J Physiol Endocrinol Metab. 2006;290(5):E961–967. doi:10.1152/ajpendo.00506.2005
22. Cifarelli V, Beeman SC, Smith GI, et al. Decreased adipose tissue oxygenation associates with insulin resistance in individuals with obesity. J Clin Invest. 2020;130(12):6688–6699. doi:10.1172/JCI141828
23. Fuchs A, Samovski D, Smith GI, et al. Associations among adipose tissue immunology, inflammation, exosomes and insulin sensitivity in people with obesity and nonalcoholic fatty liver disease. Gastroenterology. 2021;161(3):968–981.e912. doi:10.1053/j.gastro.2021.05.008
24. Vyas V, Blythe H, Wood EG, et al. Obesity and diabetes are major risk factors for epicardial adipose tissue inflammation. JCI Insight. 2021;6. doi:10.1172/jci.insight.145495
25. Wensveen FM, Valentić S, Šestan M, Turk Wensveen T, Polić B. The “Big Bang” in obese fat: events initiating obesity-induced adipose tissue inflammation. Eur J Immunol. 2015;45(9):2446–2456. doi:10.1002/eji.201545502
26. Moreira AP, Alves RD, Teixeira TF, et al. Higher plasma lipopolysaccharide concentrations are associated with less favorable phenotype in overweight/obese men. Eur J Nutr. 2015;54(8):1363–1370. doi:10.1007/s00394-014-0817-6
27. Everard A, Geurts L, Van Roye M, Delzenne NM, Cani PD. Tetrahydro iso-alpha acids from hops improve glucose homeostasis and reduce body weight gain and metabolic endotoxemia in high-fat diet-fed mice. PLoS One. 2012;7(3):e33858. doi:10.1371/journal.pone.0033858
28. Held TK, Weihua X, Yuan L, Kalvakolanu DV, Cross AS. Gamma interferon augments macrophage activation by lipopolysaccharide by two distinct mechanisms, at the signal transduction level and via an autocrine mechanism involving tumor necrosis factor alpha and interleukin-1. Infect Immun. 1999;67(1):206–212. doi:10.1128/IAI.67.1.206-212.1999
29. Decker T, Kovarik P, Meinke A. GAS elements: a few nucleotides with a major impact on cytokine-induced gene expression. J Interferon Cytokine Res. 1997;17(3):121–134. doi:10.1089/jir.1997.17.121
30. Darnell JE
31. Aung HT, Schroder K, Himes SR, et al. LPS regulates proinflammatory gene expression in macrophages by altering histone deacetylase expression. FASEB J. 2006;20(9):1315–1327. doi:10.1096/fj.05-5360com
32. Teferedegne B, Green MR, Guo Z, Boss JM. Mechanism of action of a distal NF-kappaB-dependent enhancer. Mol Cell Biol. 2006;26(15):5759–5770. doi:10.1128/MCB.00271-06
33. Eom S, Kim Y, Park D, et al. Histone deacetylase-3 mediates positive feedback relationship between anaphylaxis and tumor metastasis. J Biol Chem. 2014;289(17):12126–12144. doi:10.1074/jbc.M113.521245
34. Qiao Y, Giannopoulou EG, Chan CH, et al. Synergistic activation of inflammatory cytokine genes by interferon-γ-induced chromatin remodeling and toll-like receptor signaling. Immunity. 2013;39(3):454–469. doi:10.1016/j.immuni.2013.08.009
35. Ahmad R, El Bassam S, Cordeiro P, Menezes J. Requirement of TLR2-mediated signaling for the induction of IL-15 gene expression in human monocytic cells by HSV-1. Blood. 2008;112(6):2360–2368.
36. Al-Rashed F, Ahmad Z, Thomas R, et al. Neutral sphingomyelinase 2 regulates inflammatory responses in monocytes/macrophages induced by TNF-α. Sci Rep. 2020;10(1):16802.
37. Gatto F, Cagliani R, Catelani T, et al. PMA-induced THP-1 macrophage differentiation is not impaired by citrate-coated platinum nanoparticles. Nanomaterials. 2017;7:10.
38. Peng C, Luo X, Li S, Sun H. Phenylephrine-induced cardiac hypertrophy is attenuated by a histone acetylase inhibitor anacardic acid in mice. Mol Biosyst. 2017;13(4):714–724. doi:10.1039/C6MB00692B
39. Evans LW, Bender A, Burnett L, et al. Emodin and emodin-rich rhubarb inhibits histone deacetylase (HDAC) activity and cardiac myocyte hypertrophy. J Nutr Biochem. 2020;79:108339. doi:10.1016/j.jnutbio.2019.108339
40. Boehm U, Klamp T, Groot M, Howard JC. Cellular responses to interferon-gamma. Annu Rev Immunol. 1997;15:749–795. doi:10.1146/annurev.immunol.15.1.749
41. Zhou ZH, Han Y, Wei T, et al. Regulation of monocyte chemoattractant protein (MCP)-1 transcription by interferon-gamma (IFN-gamma) in human astrocytoma cells: postinduction refractory state of the gene, governed by its upstream elements. FASEB J. 2001;15(2):383–392. doi:10.1096/fj.00-0373com
42. Akhter N, Hasan A, Shenouda S, et al. TLR4/MyD88 -mediated CCL2 production by lipopolysaccharide (endotoxin): implications for metabolic inflammation. J Diabetes Metab Disord. 2018;17(1):77–84. doi:10.1007/s40200-018-0341-y
43. Miotto D, Boschetto P, Bononi I, et al. CC ligand 2 levels are increased in LPS-stimulated peripheral monocytes of patients with non-small cell lung cancer. Respir Med. 2007;101(8):1738–1743. doi:10.1016/j.rmed.2007.02.021
44. Jung YJ, Lee AS, Nguyen-Thanh T, et al. SIRT2 regulates LPS-induced renal tubular CXCL2 and CCL2 expression. J Am Soc Nephrol. 2015;26(7):1549–1560. doi:10.1681/ASN.2014030226
45. Fultz MJ, Barber SA, Dieffenbach CW, Vogel SN. Induction of IFN-γ in macrophages by lipopolysaccharide. Int Immunol. 1993;5(11):1383–1392. doi:10.1093/intimm/5.11.1383
46. Rimbach G, Valacchi G, Canali R, Virgili F. Macrophages stimulated with IFN-gamma activate NF-kappa B and induce MCP-1 gene expression in primary human endothelial cells. Mol Biol Res Commun. 2000;3(4):238–242. doi:10.1006/mcbr.2000.0219
47. Sharif O, Bolshakov VN, Raines S, Newham P, Perkins ND. Transcriptional profiling of the LPS induced NF-κB response in macrophages. BMC Immunol. 2007;8(1):1–7. doi:10.1186/1471-2172-8-1
48. Hayes MP, Freeman SL, Donnelly RP. IFN-gamma priming of monocytes enhances LPS-induced TNF production by augmenting both transcription and MRNA stability. Cytokine. 1995;7(5):427–435. doi:10.1006/cyto.1995.0058
49. Takeshita S, Nakatani K, Takata Y, Kawase H, Sekine I, Yoshioka S. Interferon-gamma (IFN-gamma) and tumor necrosis factor-alpha (TNF-alpha) enhance lipopolysaccharide binding to neutrophils via CD14. Inflamm Res. 1998;47(3):101–103. doi:10.1007/s000110050290
50. Suk K, Erickson KL. Differential regulation of tumour necrosis factor-alpha mRNA degradation in macrophages by interleukin-4 and interferon-gamma. Immunology. 1996;87(4):551–558. doi:10.1046/j.1365-2567.1996.500561.x
51. Medvedev AE, Flo T, Ingalls RR, et al. Involvement of CD14 and complement receptors CR3 and CR4 in nuclear factor-kappaB activation and TNF production induced by lipopolysaccharide and group B streptococcal cell walls. J Immunol. 1998;160(9):4535–4542.
52. Koerner TJ, Adams DO, Hamilton TA. Regulation of tumor necrosis factor (TNF) expression: interferon-gamma enhances the accumulation of mRNA for TNF induced by lipopolysaccharide in murine peritoneal macrophages. Cell Immunol. 1987;109(2):437–443. doi:10.1016/0008-8749(87)90326-1
53. Beutler B, Tkacenko V, Milsark I, Krochin N, Cerami A. Effect of gamma interferon on cachectin expression by mononuclear phagocytes. Reversal of the lpsd (endotoxin resistance) phenotype. J Exp Med. 1986;164(5):1791–1796. doi:10.1084/jem.164.5.1791
54. Su X, Yu Y, Zhong Y, et al. Interferon-gamma regulates cellular metabolism and mRNA translation to potentiate macrophage activation. Nat Immunol. 2015;16(8):838–849. doi:10.1038/ni.3205
55. Bauer JW, Petri M, Batliwalla FM, et al. Interferon-regulated chemokines as biomarkers of systemic lupus erythematosus disease activity: a validation study. Arthritis Rheum. 2009;60(10):3098–3107. doi:10.1002/art.24803
56. Dufour JH, Dziejman M, Liu MT, Leung JH, Lane TE, Luster AD. IFN-gamma-inducible protein 10 (IP-10; CXCL10)-deficient mice reveal a role for IP-10 in effector T cell generation and trafficking. J Immunol. 2002;168(7):3195–3204. doi:10.4049/jimmunol.168.7.3195
57. Hu X, Ivashkiv LB. Cross-regulation of signaling pathways by interferon-gamma: implications for immune responses and autoimmune diseases. Immunity. 2009;31(4):539–550. doi:10.1016/j.immuni.2009.09.002
58. Ohmori Y, Hamilton TA. Requirement for STAT1 in LPS-induced gene expression in macrophages. J Leukoc Biol. 2001;69(4):598–604.
59. Kovarik P, Stoiber D, Novy M, Decker T. Stat1 combines signals derived from IFN-gamma and LPS receptors during macrophage activation. EMBO J. 1998;17(13):3660–3668. doi:10.1093/emboj/17.13.3660
60. Chen T, Dent SY. Chromatin modifiers and remodellers: regulators of cellular differentiation. Nat Rev Genet. 2014;15(2):93–106. doi:10.1038/nrg3607
61. Qiao Y, Kang K, Giannopoulou E, Fang C, Ivashkiv LB. IFN-gamma induces histone 3 lysine 27 trimethylation in a small subset of promoters to stably silence gene expression in human macrophages. Cell Rep. 2016;16(12):3121–3129. doi:10.1016/j.celrep.2016.08.051
62. Kang K, Bachu M, Park SH, et al. IFN-γ selectively suppresses a subset of TLR4-activated genes and enhancers to potentiate macrophage activation. Nat Commun. 2019;10(1):3320. doi:10.1038/s41467-019-11147-3
63. Yan K, Cao Q, Reilly CM, Young NL, Garcia BA, Mishra N. Histone deacetylase 9 deficiency protects against effector T cell-mediated systemic autoimmunity. J Biol Chem. 2011;286(33):28833–28843. doi:10.1074/jbc.M111.233932
 © 2022 The Author(s). This work is published and licensed by Dove Medical Press Limited. The full terms of this license are available at https://www.dovepress.com/terms.php and incorporate the Creative Commons Attribution - Non Commercial (unported, v3.0) License.
By accessing the work you hereby accept the Terms. Non-commercial uses of the work are permitted without any further permission from Dove Medical Press Limited, provided the work is properly attributed. For permission for commercial use of this work, please see paragraphs 4.2 and 5 of our Terms.
© 2022 The Author(s). This work is published and licensed by Dove Medical Press Limited. The full terms of this license are available at https://www.dovepress.com/terms.php and incorporate the Creative Commons Attribution - Non Commercial (unported, v3.0) License.
By accessing the work you hereby accept the Terms. Non-commercial uses of the work are permitted without any further permission from Dove Medical Press Limited, provided the work is properly attributed. For permission for commercial use of this work, please see paragraphs 4.2 and 5 of our Terms.