Back to Journals » Diabetes, Metabolic Syndrome and Obesity » Volume 16
Identifying Metabolic Syndrome Easily and Cost Effectively Using Non-Invasive Methods with Machine Learning Models
Authors Xu W, Zhang Z, Hu K, Fang P, Li R ![]() , Kong D, Xuan M, Yue Y, She D, Xue Y
, Kong D, Xuan M, Yue Y, She D, Xue Y ![]()
Received 3 April 2023
Accepted for publication 11 July 2023
Published 17 July 2023 Volume 2023:16 Pages 2141—2151
DOI https://doi.org/10.2147/DMSO.S413829
Checked for plagiarism Yes
Review by Single anonymous peer review
Peer reviewer comments 2
Editor who approved publication: Dr Konstantinos Tziomalos
Wei Xu,1,* Zikai Zhang,2,* Kerong Hu,1,* Ping Fang,1 Ran Li,1 Dehong Kong,1 Miao Xuan,1 Yang Yue,3 Dunmin She,4,5 Ying Xue1
1Department of Endocrinology and Metabolism, Tongji Hospital, School of Medicine, Tongji University, Shanghai, People’s Republic of China; 2Department of Oncology, Tongji Hospital, School of Medicine, Tongji University, Shanghai, People’s Republic of China; 3School of Mathematics and Statistics, University of Melbourne, Melbourne, Australia; 4Clinical Medical College, Yangzhou University, Yangzhou, Jiangsu, People’s Republic of China; 5Department of Endocrinology, Northern Jiangsu People’s Hospital Affiliated to Yangzhou University, Yangzhou, Jiangsu, People’s Republic of China
*These authors contributed equally to this work
Correspondence: Ying Xue, Department of Endocrinology and Metabolism, Tongji Hospital, School of Medicine, Tongji University, No. 389, Xincun Road, Shanghai, People’s Republic of China, Tel +86-21-66111061, Email [email protected] Dunmin She, Clinical Medical College, Yangzhou University, No. 98, Nantong West Road, Yangzhou, Jiangsu, People’s Republic of China, Email [email protected]
Purpose: The objective of this study was to employ machine learning (ML) models utilizing non-invasive factors to achieve early and low-cost identification of MetS in a large physical examination population.
Patients and Methods: The study enrolled 9171 participants who underwent physical examinations at Northern Jiangsu People’s Hospital in 2009 and 2019, to determine MetS based on criteria established by the Chinese Diabetes Society. Non-invasive characteristics such as gender, age, body mass index (BMI), systolic blood pressure (SBP), and diastolic blood pressure (DBP) were collected and used as input variables to train and evaluate ML models for MetS identification. Several ML models were used for MetS identification, including logistic regression (LR), k-nearest neighbors algorithm (k-NN), naive bayesian (NB), decision tree (DT), random forest (RF), artificial neural network (ANN), and support vector machine (SVM).
Results: Our ML models all showed good performance in the 10-fold cross-validation except for the SVM model. In the external validation, the NB model exhibited the best performance with an AUC of 0.976, accuracy of 0.923, sensitivity of 98.32%, and specificity of 91.32%.
Conclusion: This study proposed a new non-invasive method for early and low-cost identification of MetS by using ML models. This approach has the potential to serve as a highly sensitive, convenient, and cost-effective tool for large-scale MetS screening.
Keywords: metabolic syndrome, machine learning methods, non-invasive method, naive Bayesian
Introduction
Metabolic syndrome (MetS) refers to a set of combined metabolic disorders, including obesity, hypertension (HBP), hyperglycemia, and dyslipidemia such as elevated triglycerides (TG), and reduced high-density lipoprotein cholesterol (HDL-C),1 which is one of the vital risk factors for accelerating progression of cardiovascular disease (CVD),2 chronic kidney disease (CKD)3 and type 2 diabetes (T2DM).4–6 Several criteria defining MetS in adults have been established by expert panels from organizations such as the National Cholesterol Education Program’s Adult Treatment Panel III (NCEP: ATP III),4 the World Health Organization (WHO),7 the European Group for the Study of Insulin Resistance,8 the International Diabetes Federation (IDF)1 and the Chinese Diabetes Society.9 However, there is still no globally accepted definition of MetS.
MetS is a growing global health concern,10 with an estimated number of affected individuals exceeding one billion and continuing to rise.11 In a study conducted in the United States, a weighted prevalence of MetS was found to be 34.7% among 17,048 adults, increasing to 48.6% among those aged 60 years or older.12 In another survey of 8814 individuals in the United States, the prevalence of MetS was over 40% among those aged 60–69 years.13 The prevalence of MetS in the Chinese population is relatively lower compared to populations in developed countries. In a survey of 2975 subjects in China, the prevalence of MetS was found to be 12.6%.14 A cross-sectional survey conducted in 2001 in 31 Chinese provinces and cities found the standardized prevalence of MetS was 13.7% (9.8% for men and 17.8% for women).15 It is crucial to find ways to early diagnose patients at high risk for MetS, allowing earlier intervention and treatment of MetS to decrease their comorbidity and improve their quality of life.
Artificial intelligence (AI) is transforming the way healthcare is being delivered. Due to recent advances in machine learning (ML), digital data collecting and natural language processing, AI is being extensively applied in fields previously considered to be the domain of human experts, such as disease diagnosis.16,17 ML is an application of AI and computer science that looks for patterns in data and can learn from prior experience to improve the accuracy of algorithms and make inferences from the examples provided. Due to the flexibility in handling enormous amounts of data and multiple variables, various ML models have been used to predict disease risk using real-world data and health outcomes. Predictive models are typically constructed by training datasets with known outcomes and then applying the trained models to new data to evaluate their performance.18 Recently, ML models such as artificial neural network (ANN), decision tree (DT), support vector machine (SVM), and random forest (RF) have been successfully applied to identify MetS.19–22
To date, the vast majority of previous studies still collected biochemical or biophysical parameters for MS diagnosis through invasive procedures.23–25 Large-scale screening for MetS in all patients might be expensive and time-consuming. In addition, blood drawing may be a painful and inconvenient procedure for those without MetS. Therefore, it has become essential to develop a rapid, simple, non-invasive and cost-effective method to screen for MetS in high-risk populations. Consequently, this study aimed to develop a new non-invasive method with ML models for easy and low-cost identification of MetS.
Methods
Study Population
A total of 9171 participants who received physical examinations in Northern Jiangsu People’s Hospital affiliated with Yangzhou University in 2009 and 2019 (n = 4847 in the 2009 group and n = 4324 in the 2019 group) were enrolled. Individuals aged 20 years or older were included in the study. In contrast, individuals under 20 years of age or underweight (BMI < 18.5 kg/m2) were excluded from the study. Ethical approval was already provided for the study by the Ethical Committee of Northern Jiangsu People’s Hospital affiliated with Yangzhou University. And the study was carried out in accordance with recommendations of the Declaration of Helsinki.
Data Source and Collection
The following data were collected: age, sex, body height (BH, m), body weight (BW, kg), systolic blood pressure (SBP, mmHg), diastolic blood pressure (DBP, mmHg) and blood biochemical tests. BH and BW were measured with subjects wearing light clothes and barefoot. BP was measured three times by trained nurses according to standardized protocols. Body mass index (BMI) was calculated by using the following formula:  .
.
Blood samples were obtained from an antecubital vein after 8h of fasting. The samples were immediately transported to the clinical laboratory of Northern Jiangsu People’s Hospital affiliated with Yangzhou University (Yangzhou, Jiangsu, China) for processing. Blood biochemical parameters, including serum uric acid [UA reference range, 143–339 μmol/L (2.4–5.7 mg/dL)], fasting blood glucose [FBG, 3.9–6.1 mmol/L (2.4–5.7 mg/dL)], triglyceride [TG, < 1.7 mmol/L (<150.5 mg/dL)], total cholesterol [TC < 5.17 mmol/L (200 mg/dL)], HDL-C [1.29–1.55 mmol/L (50–60 mg/dL)] and low-density lipoprotein cholesterol [LDL-C < 3.37 mmol/L (128 mg/dL)], were measured using an automatic biochemical analyzer (Cobas 8000; Roche, Switzerland). Table 1 and Table 2 present the non-invasive factors for 20 subjects randomly selected from the training dataset and the external validation dataset, respectively.
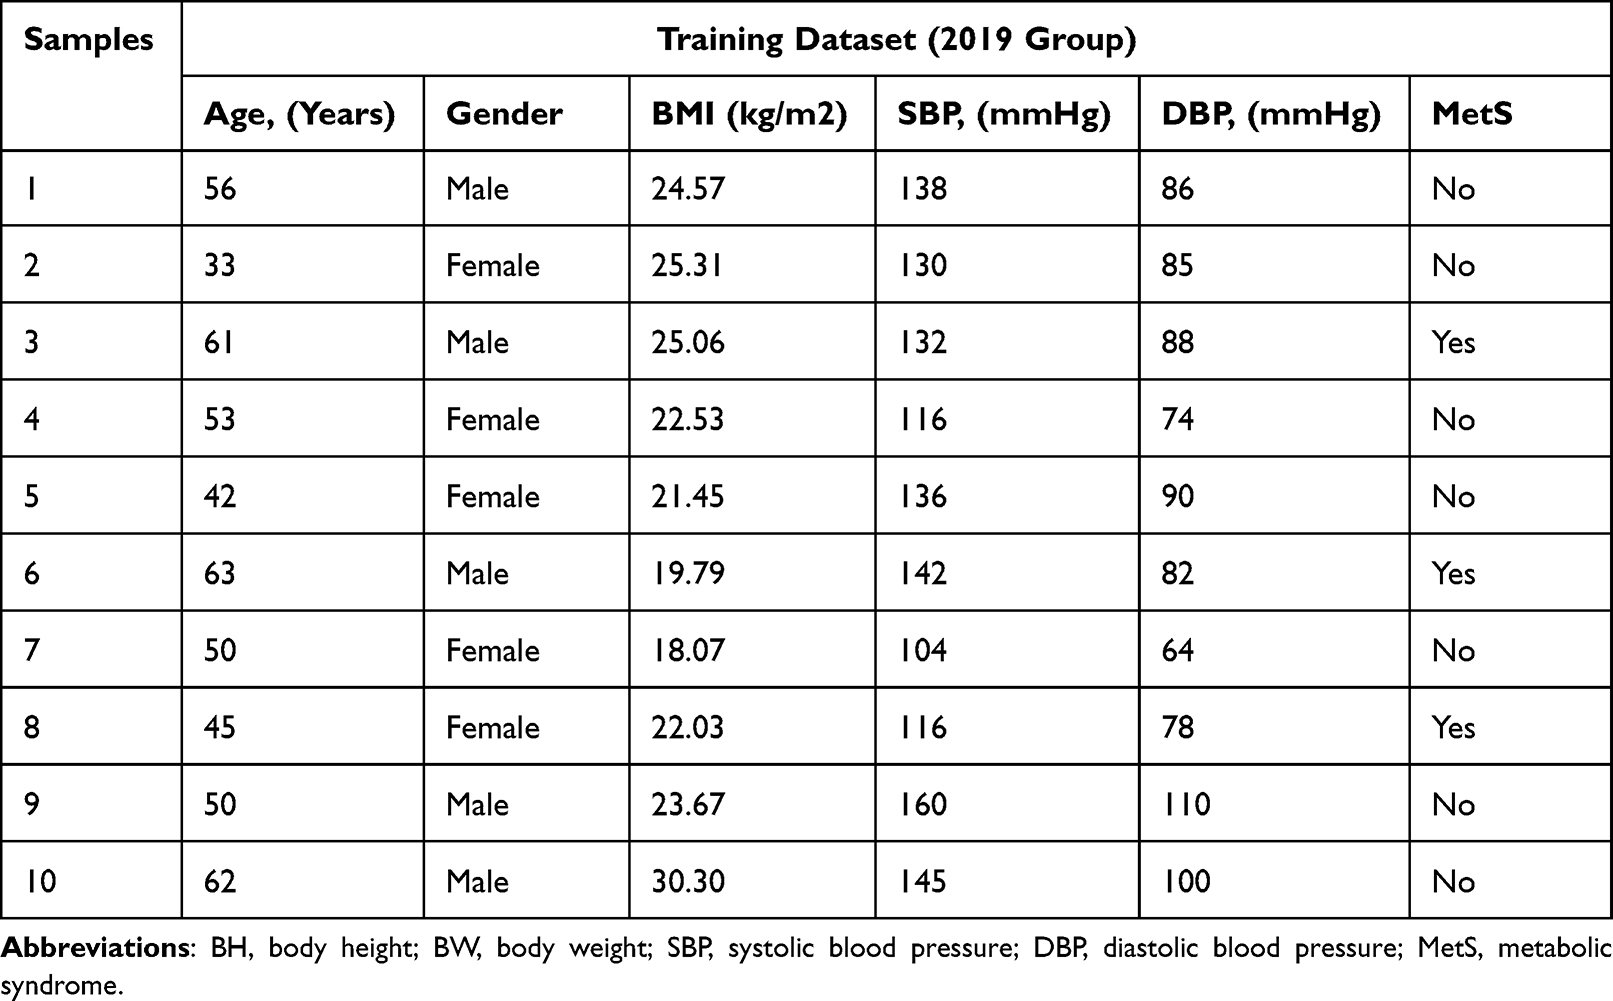 |
Table 1 Non-Invasive Factors of 10 Randomly Selected Subjects from Training Dataset |
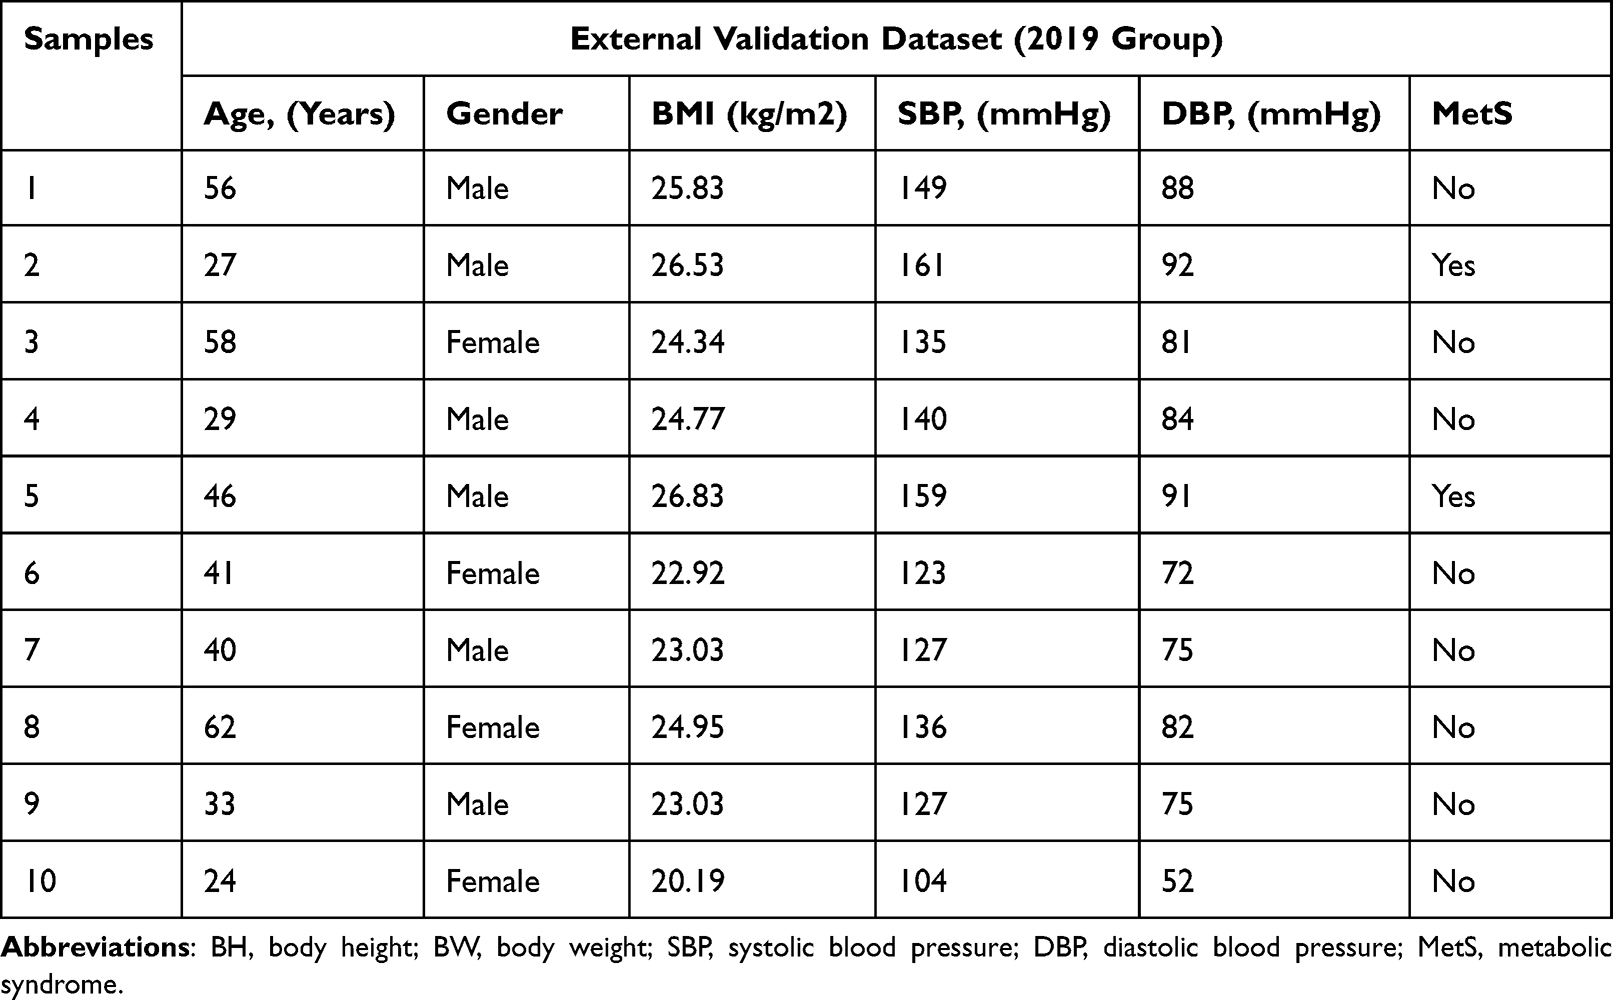 |
Table 2 Non-Invasive Factors of 10 Randomly Selected Subjects from External Validation Dataset |
Definition of MetS
MetS was defined according to the Chinese guideline for MetS from Chinese Diabetes Society.9 The subjects were diagnosed with MetS if they fulfilled three or more of the following criteria: Overweight and/or obesity (BMl ≥ 25kg/m2); hyperglycemia [FPG ≥ 6.1 mmol/L (110 mg/dL) and/or 2h PG ≥ 7.8 mmol/L (140 mg/dl)]; HBP (SBP ≥ 140 mmHg or DBP ≥ 90 mmHg); dyslipidemia: [fasting plasma TG ≥ 1.7 mmol/L (150 mg/dL), and/or fasting HDL-C<0.9 mmol/L (35 mg/dl) (male) or <1.0 mmol/L (39 mg/dl) (female)].
ML Technique
Overview
In this study, we used ML methods including logistic regression (LR), k-nearest neighbors algorithm (k-NN), Naive Bayesian (NB), DT, RF, ANN, and SVM for the reason that these methods are common ML methods and have been successfully used for medical disease diagnosis. In our study, we set 2009 health examination data as our training dataset and 2019 medical examination data as our external validation dataset.
LR
LR algorithm is a widely used supervised ML technique. LR model uses independent variables to predict the occurrence of binary outcomes following the distribution of the general linear model (GLM). LR model linearizes the relationship between the dependent and independent variables using the log-transformation function. As an evolution of linear regression, LR is widely used to estimate parameters in a model by maximum likelihood estimation (MLE). MLE is a popular method for determining the parameters that maximize the likelihood of observing the data given the model and its parameters. In this study, LR models were performed on the training dataset. The LR model assumed that the probability of the dependent variable (y, presence of MetS) taking a value of 1 (MetS occurrence) was related to the independent variables (x1, x2,…, xn) through the logistic function: 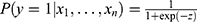 . Where
  was a linear combination of the independent variables. The values of b0, b1, b2 and bn were the coefficients of the model, which represented the effect of each independent variable. x1, x2 and xn in our model represented age, gender, BMI, SBP, and DBP.
k-NN
K-NN is a non-parametric ML method developed by Evelyn Fix and Joseph Hodges in 1951. The k-NN algorithm is a passive learning method based on partial classification. K-NN is a simple and intuitive method that is often used as a baseline model for comparing more complex models. When the Euclidean distance between a data and its neighbors is d, then it has a weight of 1/d, so the closer the distance, the greater the influence. The input data is classified based on its proximity to other data points in the feature space. The K-NN algorithm in our ML models was summarized in the following steps:
- We chose the value of K equal to 5 and selected the Euclidean distance.
- For each new data point, calculate the distances to all other data points in the training set.
- The nearest K data points were selected based on the Euclidean distance.
- The output label was determined by the majority vote of the K-nearest neighbors.
NB
NB is a probabilistic ML algorithm based on Bayes’ theorem. Bayes probability comes from two parts: the prior probability and the posterior probability. NB is well-suited to handle uncertain or incomplete data. It can also model complex relationships between variables and can deal with both discrete and continuous variables. Therefore, applications of NB include diagnosis and risk management in healthcare. When we use our experience to predict the likelihood of future events, we get the prior probability P(H), where H represents a hypothesis. And when the new evidence is updated, we get the posterior probability P(H|D), where D represents the observed data. Thus, we generated the following formula to compute the posterior probability based on the prior probability P(H) and the likelihood of the data. The formula was: 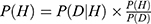 . The NB algorithm in our ML models involved three steps:
- Model specification: Input variables in our model and assign the prior probabilities between them.
- Parameter estimation: estimate the probabilities that define the relationships between them.
- Causal inference: use the model to answer queries about the posterior probabilities as well as to make predictions.
DT
DT is a type of ML model that uses a tree structure to make predictions or to classify data. DT consists of nodes and branches. Nodes represent data features, while branches represent possible values of these features. With the parent database as the root node, the types of data in the database are discriminated by the branches of the tree structure, and the overall probability obtained using the recursive approach is the conditional probability of the tree structure. It works by recursively partitioning the data into sub-datasets. At each step, the model selects the feature that provides the maximum information gain. The formula for the information gain is:  . Where Entropy (root) is the entropy of the root node and Entropy (children) is the entropy of the children node. The weighted average is based on the proportion of data points belonging to each children node. There are several algorithms for split criterion and missing value imputation methods. In our model, we chose the ID4.5 algorithm. The main weakness of DT is over-fitting, particularly if the tree is too deep or there is too much noise in the training dataset. To overcome this problem in ML models, it is necessary to prune and remove some nodes or branches.26
RF
RF uses several DTs and discriminates samples by the ensemble of these DTs, which increases the robustness of the model. For a single DT model, the performance is highly sensitive to noise. By using bagging techniques in the RF model, noise decreases its impact on the average performance of many trees as far as these trees are not strongly correlated.
ANN
ANN is a nonlinear ML method based on the human brain.27 ANN consists of a multi-layer neuronal network, each layer of which has one input and one output. Each layer of neurons takes the output of the corresponding neuron of the previous layer as its input and sends information messages to the corresponding neuron of the next layer as its output. The mathematical formula for a single neuron was:  . Where y was the output of the neuron, x1, x2, xn were the features of our model, w1, w2, wn were the weights associated with each feature, b was the bias term and f( ) was the activation function which transforms the weighted sum of the inputs into the output of the neuron. The weights and bias terms are learned during the training and the activation function can be chosen based on the problem being solved. The ANN process is performed by comparing partial cases with each other and correcting the weights of each layer.
SVM
SVM is based on mapping data vectors into a high-dimensional feature space and then dividing the two classes with maximum geometric separation on a hyperplane. By maximum geometric separation, it is necessary to separate the two classes and to ensure that the two classes can produce the maximum distance in the hyperplane. The hyperplane can be represented by the equation: w × x+b=0, where w is a vector perpendicular to the hyperplane and b is the bias of the hyperplane. If w × x+b>0, then it belongs to one category, and if w × x+b<0, then it belongs to the other class. Thus, the distance can be calculated as  , where
  is the Euclidean norm of w. The maximum geometric separation can be understood as maximizing
  , subject to
  for all i=1,2,…,n where xi is the i-th data point and yi is the class label (+1 or −1), and n is the number of data points. Additionally, nonlinear SVM models can be used to handle nonlinearly separable datasets. By using the kernel trick, these models can map the original feature space to a higher-dimensional space, where the data may become linearly separable.
Statistical Analysis
Statistical analysis was performed using Stata 15.0SE (Texas, USA). ML analysis was conducted using Orange 3.27.1 (Ljubljana, Slovenia). Continuous variables were represented as mean ± standard deviation (normally distributed). Categorical variables were expressed as numbers (percentages). To compare basic demographic characteristics between the two groups, we used independent t-tests for continuously normally distributed variables and chi-square tests for categorical variables. The features used in our ML models were age, gender, BMI, SBP, and DBP. We used a 10-fold cross-validation approach to internally validate the performance of our ML method. Receiver operating characteristics (ROC) curves were designed to illustrate the diagnostic capabilities of the ML algorithms in our study. The area under the curve (AUC), classification accuracy (CA), positive predictive value (precision), true positive rate (recall), and sensitivity and specificity were used to assess the applicability of the ML models.
Result
Clinical Characteristics of Participants in the Training and Validation Datasets
The health examination data from the 2009 group were set as the training dataset, while the medical examination data from the 2019 group were used as the external validation dataset. The participants in the training dataset and external validation dataset are shown in Table 3. We collected 4847 participants from the 2009 group and 4324 participants from the 2019 group. The prevalence of MetS was 7.1% in the 2009 group and 13.8% in the 2019 group. A higher percentage of subjects with MetS than those without MetS were male in both the 2009 and 2019 groups. In the 2009 and 2019 groups, patients with MetS had significantly higher age, BMI, SBP, DBP, FBG, TG, TC, LDL-C, and SUA compared to those without MetS.
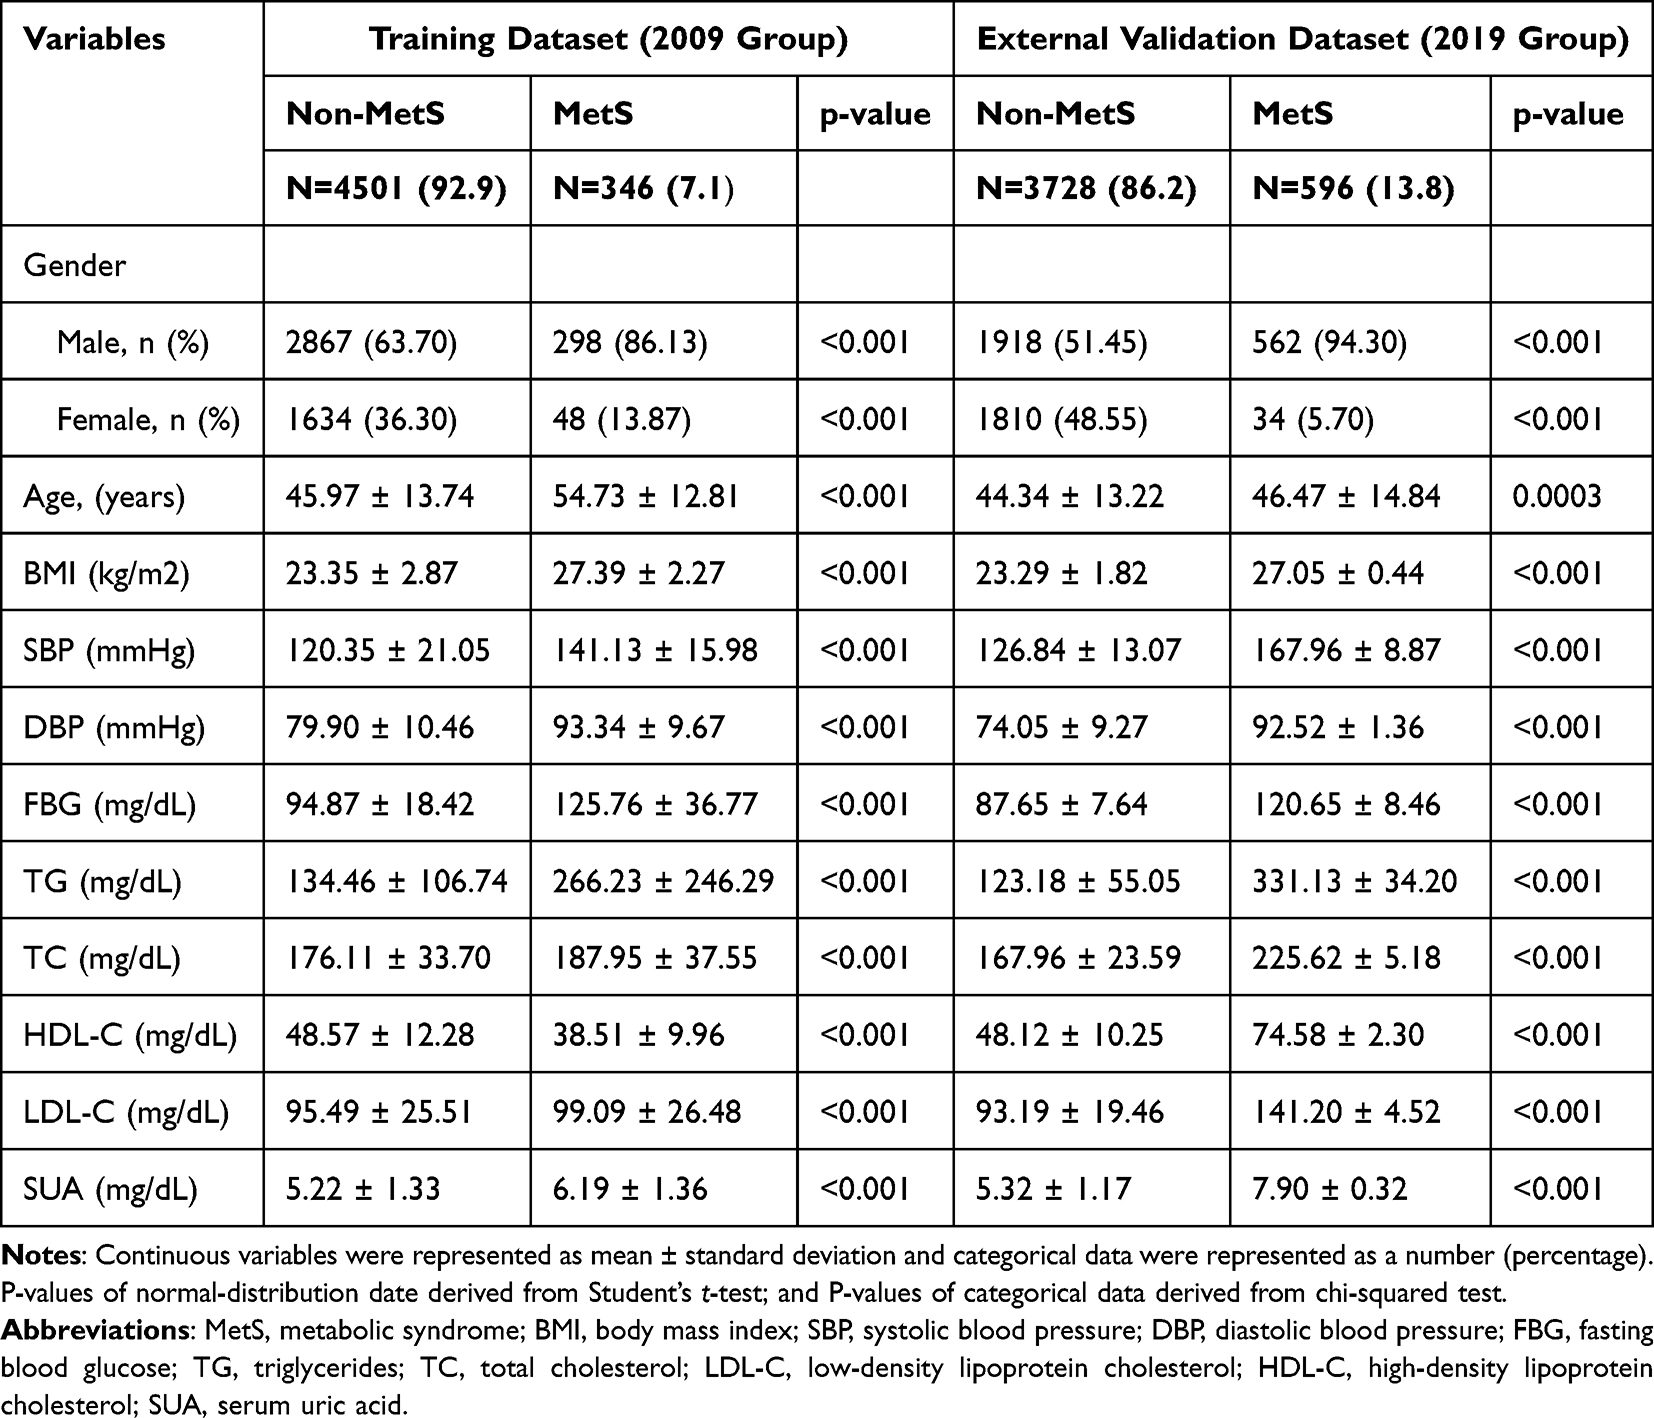 |
Table 3 General Characteristics of Subjects in the Training and Validation Datasets According to the Development of Metabolic Syndrome |
The 10-Fold Cross-Validation Performance of the ML Models in the Training Dataset
Table 4 presented the results of 10-fold cross validation of ML models including ANN, LR, NB, RF, k-NN, SVM, and DT on the training dataset. According to Table 4, the specificity of all models except SVM model was above 90%. The sensitivity of both the NB model and the SVM model was above 50%, while the sensitivity of all other models was around 20%. Among the six ML models, ANN, LR and NB had the highest AUC (0.926 vs 0.916 vs 0.904). Thus, we chose these three models for external validation.
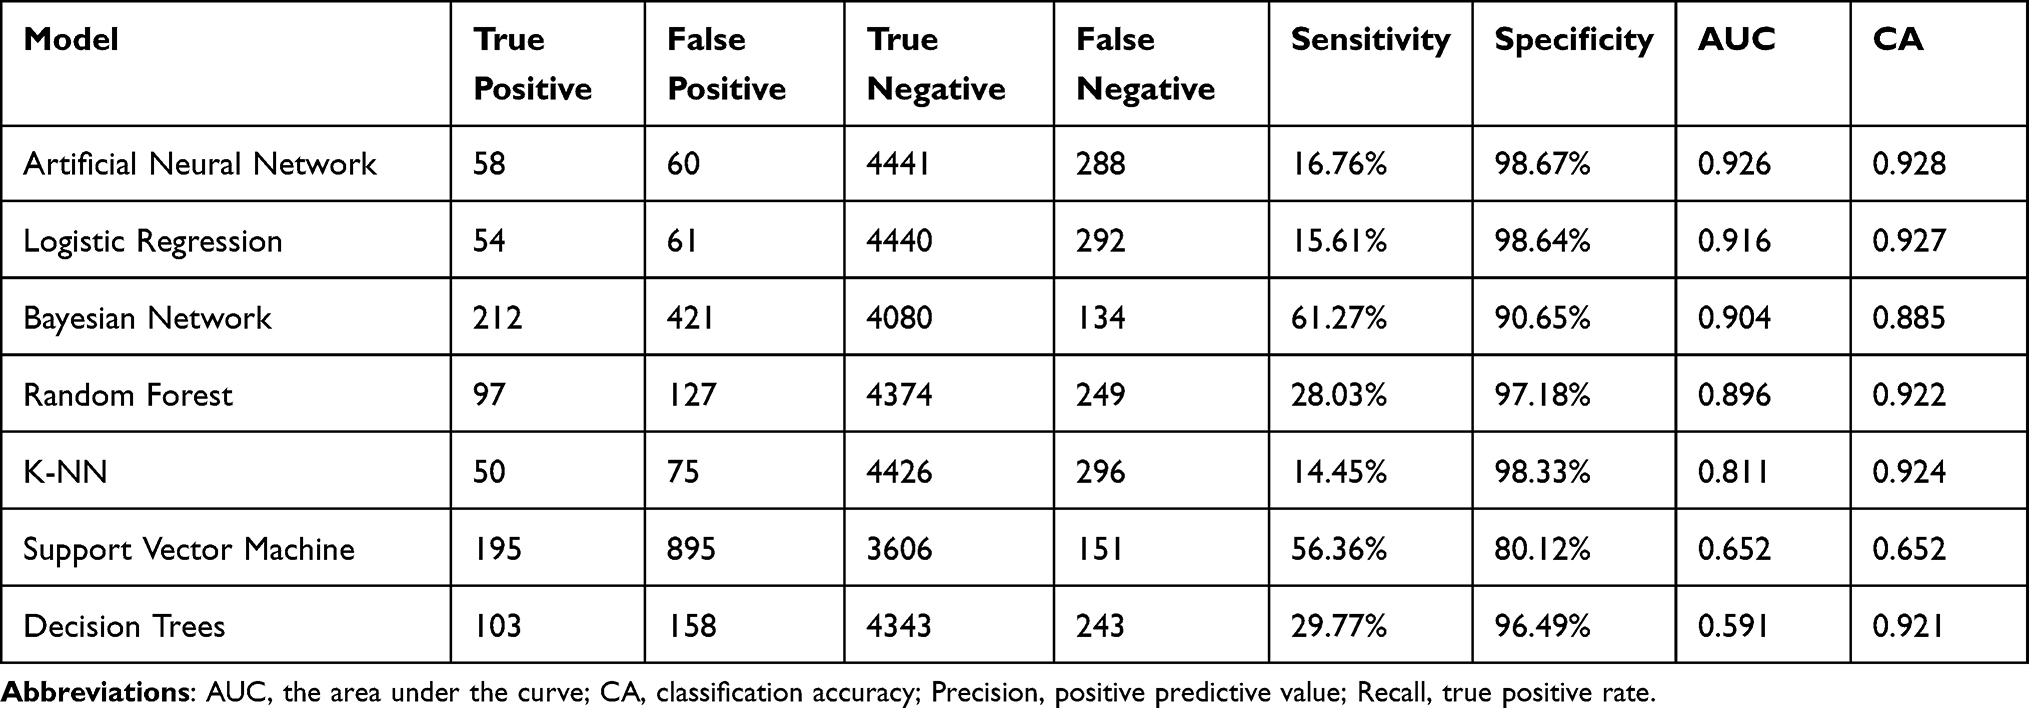 |
Table 4 The 10-Fold Cross-Validation Performance of the Machine Learning Models in the Training Dataset |
The External Validation Performance of the ML Models
The external validation results of ANN, LR, and NB are shown in Table 5. The ROC curves of these three ML models are displayed in Figure 1. Both ANN and NB models had good performance in the external validation, and their AUCs and accuracies were close to each other and relatively high. The sensitivity of ANN model was lower than that of NB model (71.98% vs 98.32%), and the specificity of NB model was lower than that of ANN model (91.32% vs 99.38%). LR did not perform well in the external test dataset, as the sensitivity of the model was only 3.02%. Since this is a model for screening tests, high sensitivity is more important because high sensitivity minimizes the possibility of missed diagnoses and ensures the potential patients can receive further testing and treatment early. Therefore, we believed that the NB model had the best performance in our study.
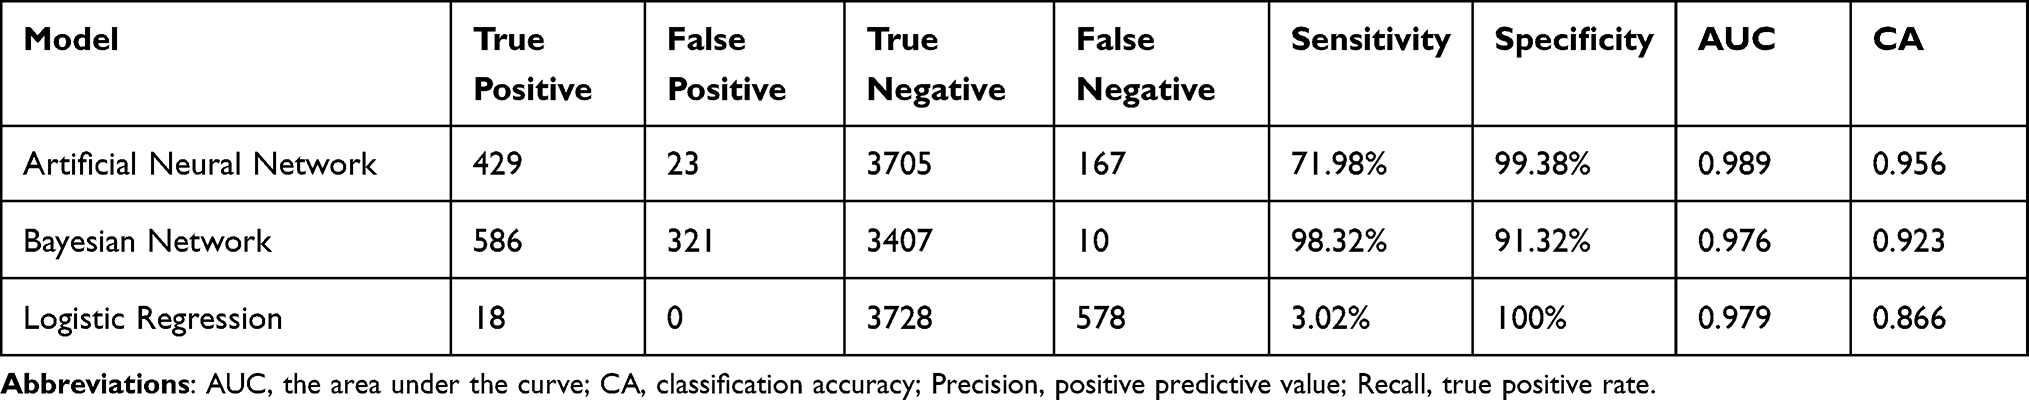 |
Table 5 The External Validation Performance of the Machine Learning Models |
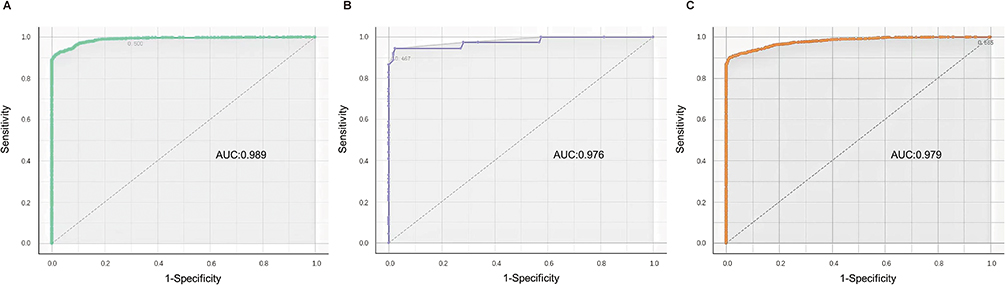 |
Figure 1 Area under the receiver-operating characteristic curves of three machine learning algorithms on the external validation set. (A) Artificial Neural Network; (B) Naive Bayesian; (C) Logistic Regression. |
Discussion
The purpose of this study is to develop simple methods for early and low-cost identification of MetS using ML models based on feature information obtained by noninvasive means. In this study, non-invasive and easy-to-obtain features including gender, age, BMI, SBP, and DBP were considered as input variables for easy and low-cost identification, and were used to train and test various ML models. And these parameters have been reported to be closely related to the occurrence and development of Mets.28 Our study attempted to detect MetS using various ML models, including LR, k-NN, NB, DT, RF, ANN, and SVM. Our results of 10-fold cross-validation showed that ANN, LR, and NB were the three best-performing ML models in terms of AUC, accuracy, sensitivity, and specificity among all evaluated models. Of these, NB performed the best in external validation with an AUC of 0.976, accuracy of 0.923, sensitivity of 98.32%, and specificity of 91.32%, indicating that the NB model had the ability to detect 98.32% of participants with MetS and 91.32% of participants with non-MetS. The high sensitivity means that the test can accurately detect as many true positives as possible and reduce the likelihood of false negatives. On the other hand, specificity is also an important consideration, as high specificity reduces the occurrence of false-positive results, avoiding unnecessary follow-up testing and anxiety. As a screening test model, the focus of this study is on early detecting of potential cases or disease risks for take preventing measures or further intervention steps. Therefore, high sensitivity is more important in this scenario.
NB and ANN are algorithms that can be used for nonlinear statistical modeling.29,30 In contrast, LR is a simple technique that uses linear combinations of variables, which means that the model is ineffective for modeling complex interactions with severe nonlinearity. NB and ANN have theoretical advantage over LR for effectively capturing nonlinearities between factors and outcomes. Therefore, NB and ANN may be a better choice than LR-based models when the relationships between the variables are nonlinear, complex, and multidimensional, such as in the biological process and development of disease.30 One advantage of NB over alternative ML approaches such as ANN and SVM is that we are allowed to understand the decision process of the NB model, whereas alternative ML methods are “black box” algorithms.29–31 In our study, the sensitivity and specificity of the NB model exceeded 90%, which was superior to the ANN model with a sensitivity of 71.98% for its screening test model, suggesting a more pronounced advantage of NB in ML models for diagnosing MetS based on non-invasive data from a physically examined population.
Previous studies have utilized ML models to diagnose MetS, but the results vary widely. Vrbaski et al used four ML methods (linear regression, ANN, DT, and RF) to predict MetS in the Serbian population, and found that RF had the best performance.32 Worachartcheewan et al reported that DT correctly classified MetS and non-MetS in the Thai population by more than 99% and was the best ML method, surpassing ANN and SVM.21,33,34 Lin et al developed ANN and LR models to detect MetS using data from psychiatric patients treated with SGA in Taiwan, China. They found that, compared to LR model, ANN could better identify MetS with higher accuracy, sensitivity, and specificity.35 We believe that the differences in results in the previous literature mentioned above may be due to differences in population (including race, disease, etc.). Therefore, it is particularly important to develop ML models for the diagnosis of MetS based on data from the mainland Chinese population.
Although similar studies have been conducted in the past, our study still has strong advantages. First, our study is more representative of the prevalence characteristics of MetS in the Chinese population. There are significant regional and population variations in the epidemiology of MetS due to differences in lifestyle, demographic composition (age, sex, race), and definition of MetS. Majority of the previous studies were conducted in non-Chinese populations, and only two studies were focused on populations in Taiwan, China,35,36 but one of them enrolled patients with psychiatric disorders35 rather than a physically examined population as study subjects. Therefore, the above findings were not generalizable. Our study was conducted in the physical examination population from the eastern part of mainland China, better reflecting the characteristics of MetS prevalence in the Chinese population. Second, our study is simpler and more efficient by using information obtained by non-invasive means. Our study required input of only demographic and anthropometric characteristics, including sex, age, BMI, SBP, and DBP, whereas most other studies required the use of invasive procedures to collect blood samples to measure biochemical or biophysical parameters (eg, TG, HDL-C, FBG).20,37–40 Kakudi et al employed genetically optimised Bayesian ARTMAP model to diagnose MetS using biochemical and biophysical parameters and found that the model had AUCs of 86.42%, 87.04%, 91.08%, and 89.24% for the young female, middle-aged female, young male, and middle-aged male individuals, respectively.41 None of the above models in that study performed as well as NB model in our study. Worachartcheewan et al reported that their DT model could correctly classify more than 99% of MetS and non-MetS in the Thai population using 15 blood chemical parameters.34 In our study, approximately 98% of MetS cases and 91% of non-MetS were successfully predicted by the NB model, which was sufficient to screen for MetS and ensure that potential patients can receive further testing and treatment as early as possible. Thus, our study provided a faster, simpler, and more cost-effective method for the early diagnosis of MetS than previous studies. Third, our study considered the temporal dimension and analyzed data from two time points, 2009 as well as 2019. Using the 2009 data as the training set and the 2019 data as the external validation set, it was found that NB achieved the best results in both datasets, with no time constraint in diagnosing MetS. Compared to traditional cross-sectional studies limited to one time point (eg, Lin et al),35 our study is more generalizable.
Our study also has several limitations. First, all data were obtained from clients who underwent health screening at the one center. Further analysis of population data from other regions of China is needed to better ensure the generalizability of our model. Second, our study is a cross-sectional study, which prevents us from making causal inferences and requires further follow-up studies to assess. Third, due to the limited information in our physical examination database, we were unable to analyze other important MetS parameters such as educational status, history of alcohol consumption, smoking history, medication use, and past medical history.
Conclusion
In this study, we developed seven ML methods, including LR, k-NN, NB, DT, RF, ANN, and SVM, for easy and low-cost identification of MetS using non-invasive factors (gender, age, BMI, SBP, and DBP). Our performance evaluation of these models showed that NB was the most effective model for diagnosing MetS. The greatest advantage of this ML model is its ability to predict MetS using non-invasive, easily accessible metrics. Our ML model has a number of potential practical applications, such as developing a formula based on a trained model, creating a mobile or web-based application, or integrating the model into an existing clinical decision support system. Moreover, we will further improve and validate our model by using an external longitudinal cohort study dataset.
Data Sharing Statement
The raw data supporting the conclusions of this article will be made available by the authors, without undue reservation.
Ethics Statement
All procedures performed in studies were in accordance with the 1964 Helsinki Declaration and its later amendments or comparable ethical standards. Ethical approval for this study was approved by the Ethics Committee of Northern Jiangsu People’s Hospital Affiliated with Yangzhou University.
Acknowledgments
We are grateful to all interviewers, nurses, and physicians who participated in the study.
Author Contributions
All authors made a significant contribution to the work reported, whether that is in the conception, study design, execution, acquisition of data, analysis, and interpretation, or in all these areas; took part in drafting, revising, or critically reviewing the article; gave final approval of the version to be published; have agreed on the journal to which the article has been submitted; and agree to be accountable for all aspects of the work.
Funding
This study was supported by the Fundamental Research Funds for the Central Universities (22120220625), National Natural Science Foundation of China (81974105), Cultivation project for the National Natural Science Foundation of Shanghai Tongji Hospital.
Disclosure
The authors declare that the research was conducted in the absence of any commercial or financial relationships that could be construed as a potential conflict of interest.
References
1. Alberti K, Zimmet P, Shaw J. The metabolic syndrome - a new worldwide definition. Lancet. 2005;366(9491):1059–1062. doi:10.1016/S0140-6736(05)67402-8
2. Mottillo S, Filion KB, Genest J, et al. The metabolic syndrome and cardiovascular risk: a systematic review and meta-analysis. J Am Coll Cardiol. 2010;56(14):1113–1132. doi:10.1016/j.jacc.2010.05.034
3. Kitiyakara C, Yamwong S, Cheepudomwit S, et al. The metabolic syndrome and chronic kidney disease in a Southeast Asian cohort. Kidney Int. 2007;71(7):693–700. doi:10.1038/sj.ki.5002128
4. Cleeman J, Grundy S, Becker D, et al. Executive summary of the Third Report of the National Cholesterol Education Program (NCEP) expert panel on detection, evaluation, and treatment of high blood cholesterol in adults (Adult Treatment Panel III). JAMA. 2001;285(19):2486–2497. doi:10.1001/jama.285.19.2486
5. Ibrahim MS, Pang D, Randhawa G, Pappas Y. Risk models and scores for metabolic syndrome: systematic review protocol. BMJ Open. 2019;9(9):e027326. doi:10.1136/bmjopen-2018-027326
6. Grundy S, Cleeman J, Daniels S, et al. Diagnosis and management of the metabolic syndrome - an American Heart Association/National Heart, Lung, and Blood Institute Scientific Statement. Circulation. 2005;112(17):2735–2752. doi:10.1161/CIRCULATIONAHA.105.169404
7. Alberti K, Zimmet P; WHO Consultation. Definition, diagnosis and classification of diabetes mellitus and its complications part 1: diagnosis and classification of diabetes mellitus - Provisional report of a WHO consultation. Diabetic Med. 1998;15(7):539–553. doi:10.1002/(SICI)1096-9136(199807)15:7<539::AID-DIA668>3.0.CO;2-S
8. Balkau B, Charles M. Comment on the provisional report from the WHO consultation. Diabetic Med. 1999;16(5):442–443.
9. Pang C, Jia L, Hou X, et al. The significance of screening for microvascular diseases in Chinese community-based subjects with various metabolic abnormalities. PLoS One. 2014;9(5):e97928. doi:10.1371/journal.pone.0097928
10. Cefalu WT, Rodgers GP. COVID-19 and metabolic diseases: a heightened awareness of health inequities and a renewed focus for research priorities. Cell Metab. 2021;33(3):473–478. doi:10.1016/j.cmet.2021.02.006
11. Saklayen MG. The global epidemic of the metabolic syndrome. Curr Hypertens Rep. 2018;20(2). doi:10.1007/s11906-018-0812-z
12. Hirode G, Wong R. Trends in the prevalence of metabolic syndrome in the United States, 2011–2016. JAMA. 2020;323(24):2526–2528. doi:10.1001/jama.2020.4501
13. Ford ES, Giles WH, Dietz WH. Prevalence of the metabolic syndrome among US adults - findings from the Third National Health and Nutrition Examination Survey. JAMA. 2002;287(3):356–359. doi:10.1001/jama.287.3.356
14. Chen B, Yang D, Chen Y, Xu W, Ye B, Ni Z. The prevalence of microalbuminuria and its relationships with the components of metabolic syndrome in the general population of China. Clinica Chimica Acta. 2010;411(9–10):705–709. doi:10.1016/j.cca.2010.01.038
15. Gu D, Reynolds K, Wu X, et al. Prevalence of the metabolic syndrome and overweight among adults in China. Lancet. 2005;365(9468):1398–1405. doi:10.1016/S0140-6736(05)66375-1
16. Lakhani P, Sundaram B. Deep learning at chest radiography: automated classification of pulmonary tuberculosis by using convolutional neural networks. Radiology. 2017;284(2):574–582. doi:10.1148/radiol.2017162326
17. Esteva A, Kuprel B, Novoa RA, et al. Dermatologist-level classification of skin cancer with deep neural networks. Nature. 2017;542(7639):
18. Worachartcheewan A, Schaduangrat N, Prachayasittikul V, Nantasenamat C. Data mining for the identification of metabolic syndrome status. EXCLI J. 2018;17:72–88. doi:10.17179/excli2017-911
19. Hsu NW, Chou KC, Wang YTT, Hung CL, Kuo CF, Tsai SY. Building a model for predicting metabolic syndrome using artificial intelligence based on an investigation of whole-genome sequencing. J Transl Med. 2022;20(1). doi:10.1186/s12967-022-03379-7
20. Karimi-Alavijeh F, Jalili S, Sadeghi M. Predicting metabolic syndrome using decision tree and support vector machine methods. ARYA Atheroscler. 2016;12(3):146–152.
21. Worachartcheewan A, Nantasenamat C, Isarankura-Na-Ayudhya C, Prachayasittikul V. Quantitative Population-Health Relationship (QPHR) for assessing metabolic syndrome. EXCLI J. 2013;12:569–583. doi:10.2478/s11696-013-0398-5.
22. Lin Z, Vicente Goncalves CM, Dai L, et al. Exploring metabolic syndrome serum profiling based on gas chromatography mass spectrometry and random forest models. Anal Chim Acta. 2014;827:22–27. doi:10.1016/j.aca.2014.04.008
23. Hirose H, Takayama T, Hozawa S, Hibi T, Saito I. Prediction of metabolic syndrome using artificial neural network system based on clinical data including insulin resistance index and serum adiponectin. Comp Biol Med. 2011;41(11):1051–1056. doi:10.1016/j.compbiomed.2011.09.005
24. Ushida Y, Kato R, Niwa K, et al. Combinational risk factors of metabolic syndrome identified by fuzzy neural network analysis of health-check data. BMC Med Inform Decis Mak. 2012;12:80. doi:10.1186/1472-6947-12-80
25. Wang H, Wang Y, Li X, et al. Machine learning of plasma metabolome identifies biomarker panels for metabolic syndrome: findings from the China Suboptimal Health Cohort. Cardiovasc Diabetol. 2022;21(1):288. doi:10.1186/s12933-022-01716-0
26. Shamrat FM, Chakraborty S, Billah MM, Das P, Ranjan R. A comprehensive study on pre-pruning and post- pruning methods of decision tree classification algorithm. In:
27. Mcculloch W, Pitts W. A logical calculus of the ideas immanent in nervous activity (reprinted from bulletin of mathematical biophysics, Vol 5, 115–133, 1943). Bull Math Biol. 1990;52(1–2):99–115. doi:10.1016/S0092-8240(05)80006-0
28. Cornier MA, Dabelea D, Hernandez TL, et al. The metabolic syndrome. Endocr Rev. 2008;29(7):777–822. doi:10.1210/er.2008-0024
29. Terrin N, Schmid CH, Griffith JL, D’Agostino RB, Selker HP. External validity of predictive models: a comparison of logistic regression, classification trees, and neural networks. J Clin Epidemiol. 2003;56(8):721–729. doi:10.1016/S0895-4356(03)00120-3
30. Tu JV. Advantages and disadvantages of using artificial neural networks versus logistic regression for predicting medical outcomes. J Clin Epidemiol. 1996;49(11):1225–1231. doi:10.1016/S0895-4356(96)00002-9
31. Do BH, Langlotz C, Beaulieu CF. Bone tumor diagnosis using a naïve bayesian model of demographic and radiographic features. J Digit Imaging. 2017;30(5):640–647. doi:10.1007/s10278-017-0001-7
32. Vrbaski D, Vrbaski M, Kupusinac A, et al. Methods for algorithmic diagnosis of metabolic syndrome. Artif Intell Med. 2019;101. doi:10.1016/j.artmed.2019.101708
33. Worachartcheewan A, Shoombuatong W, Pidetcha P, Nopnithipat W, Prachayasittikul V, Nantasenamat C. Predicting metabolic syndrome using the random forest method. Scientificworldjournal. 2015;2015:581501. doi:10.1155/2015/581501
34. Worachartcheewan A, Nantasenamat C, Isarankura-Na-Ayudhya C, Pidetcha P, Prachayasittikul V. Identification of metabolic syndrome using decision tree analysis. Diabetes Res Clin Pract. 2010;90(1):e15–8. doi:10.1016/j.diabres.2010.06.009
35. Lin C, Bai Y, Chen J, et al. Easy and low-cost identification of metabolic syndrome in patients treated with second-generation antipsychotics: artificial neural network and logistic regression models. J Clin Psychiatry. 2010;71(3):225–234. doi:10.4088/JCP.08m04628yel
36. Wang FH, Lin CM. The utility of artificial neural networks for the non-invasive prediction of metabolic syndrome based on personal characteristics. Int J Environ Res Public Health. 2020;17(24):9288. doi:10.3390/ijerph17249288
37. de Edelenyi F, Goumidi L, Bertrais S, et al. Prediction of the metabolic syndrome status based on dietary and genetic parameters, using random forest. Genes Nutr. 2008;3(3–4):173–176. doi:10.1007/s12263-008-0097-y
38. Kim T, Kim J, Won J, et al. A decision tree-based approach for identifying urban-rural differences in metabolic syndrome risk factors in the adult Korean population. J Endocrinol Invest. 2012;35(9):847–852. doi:10.3275/8235
39. Chan CL, Chen CW, Liu BJ. Discovery of association rules in metabolic syndrome related diseases. In:
40. Huang Y. The application of data mining to explore association rules between metabolic syndrome and lifestyles. Health Inform Manage J. 2013;42(3):29–36. doi:10.1177/183335831304200304
41. Kakudi HA, Loo CK, Moy FM, Masuyama N, Pasupa K. Diagnosing metabolic syndrome using genetically optimised Bayesian ARTMAP. IEEE Access. 2019;7:8437–8453. doi:10.1109/ACCESS.2018.2880224
 © 2023 The Author(s). This work is published and licensed by Dove Medical Press Limited. The
full terms of this license are available at https://www.dovepress.com/terms
and incorporate the Creative Commons Attribution
- Non Commercial (unported, 3.0) License.
By accessing the work you hereby accept the Terms. Non-commercial uses of the work are permitted
without any further permission from Dove Medical Press Limited, provided the work is properly
attributed. For permission for commercial use of this work, please see paragraphs 4.2 and 5 of our Terms.
© 2023 The Author(s). This work is published and licensed by Dove Medical Press Limited. The
full terms of this license are available at https://www.dovepress.com/terms
and incorporate the Creative Commons Attribution
- Non Commercial (unported, 3.0) License.
By accessing the work you hereby accept the Terms. Non-commercial uses of the work are permitted
without any further permission from Dove Medical Press Limited, provided the work is properly
attributed. For permission for commercial use of this work, please see paragraphs 4.2 and 5 of our Terms.