Back to Journals » OncoTargets and Therapy » Volume 14
Identification of Susceptible Genes for Chronic Obstructive Pulmonary Disease with Lung Adenocarcinoma by Weighted Gene Co-Expression Network Analysis
Authors Li P ![]() , Wang Y
, Wang Y ![]() , Wang X, Liu L, Chen L
, Wang X, Liu L, Chen L ![]()
Received 28 January 2021
Accepted for publication 13 May 2021
Published 4 June 2021 Volume 2021:14 Pages 3625—3634
DOI https://doi.org/10.2147/OTT.S303544
Checked for plagiarism Yes
Review by Single anonymous peer review
Peer reviewer comments 3
Editor who approved publication: Dr William C. Cho
Ping Li,1,* Youyu Wang,2,* Xiaoli Wang,3,* Lin Liu,4 Lei Chen1
1Department of Respiratory and Critical Care Medicine, West China Hospital, West China School of Medicine, Sichuan University, Chengdu, Sichuan, 610041, People’s Republic of China; 2Department of Thoracic Surgery, Sichuan Provincial People’s Hospital, Sichuan Academy of Medical Sicences, Chengdu, Sichuan, 610072, People’s Republic of China; 3Department of Gynecology and Obstetrics, Key Laboratory of Birth Defects and Related Diseases of Women and Children, Ministry of Education, West China Second Hospital, Sichuan University, Chengdu, Sichuan, 610041, People’s Republic of China; 4Department of Respiratory and Critical Care Medicine, 363 Hospital, Chengdu, Sichuan, 610041, People’s Republic of China
*These authors contributed equally to this work
Correspondence: Lei Chen
Department of Respiratory and Critical Care Medicine, West China Hospital, West China School of Medicine, Sichuan University, Chengdu, Sichuan, 610041, People’s Republic of China
Email [email protected]
Lin Liu
Department of Respiratory and Critical Care Medicine, 363 Hospital, Chengdu, Sichuan, 610041, People’s Republic of China
Email [email protected]
Purpose: Chronic obstructive pulmonary disease (COPD) and lung adenocarcinoma (LUAD) are common disorders and usually co-exists. However, genetic mechanisms between COPD and LUAD are rarely reported. This study aims to identify susceptible genes of COPD with LUAD.
Methods: Using the published data of GSE106899, co-expression modules were constructed by weighted gene co-expression network analysis (WGCNA). Subsequently, top 50 genes in the most tumor-related module were identified, among which hub genes were selected and validated.
Results: Twenty co-expression modules were constructed on 13,865 genes from 62 lung tissues of COPD patients with or without LUAD, in which one module (blue) was most related to tumorigenesis. Functional enrichment analyses showed that the genes in the blue module were mainly enriched in cell cycle, DNA transcription/replication and cancer pathways, etc. Combined with protein–protein interaction network, MTA1, PKMYT1 and FZR1 genes had the most intramodular connectivity, which were regarded as the hub genes. However, only FZR1 was validated to be overexpressed in lung tissues of COPD with LUAD and cigarette smoke extract-stimulated A549 cells, a human LUAD cell line.
Conclusion: This study suggests overexpression of FZR1 may play a key role in the tumorigenesis of LUAD in patients with COPD.
Keywords: chronic obstructive pulmonary disease, COPD, lung adenocarcinoma, weighted gene co-expression network analysis, WGCNA
Plain Language Summary
What is Already Known on the Subject?
COPD and LUAD are common disorders and usually co-exists, and genetic mechanisms play potentially important roles in co-existing of COPD and LUAD.
What is the Current Concern?
The genetic-coexisting mechanisms of COPD and LUAD have not been fully elucidated, and no genetic biomarkers in screening high risk for tumorigenesis of LUAD in COPD patients have been investigated.
What is Added to This Topic?
Three susceptible genes, including MTA1, PKMYT1 and FZR1, for COPD and LUAD were identified by WGCNA. However, FZR1, but not MTA1 and PKMYT1, was validated to be overexpressed in lung tissues from COPD with LUAD and cigarette smoke extract treated A549 cells.
Introduction
Chronic obstructive pulmonary disease (COPD) and lung cancer are common causes of death worldwide.1 Previous studies reported COPD was more likely to develop lung cancer than those with normal lung function,2–5 indicating COPD is an independent risk factor for lung cancer,3,6–8 which may result in co-existing of COPD and lung cancer. In this process, genetic susceptibility is one of the well-described mechanisms for co-existing of COPD and lung cancer.9–11 However, there are limited reports on genetic mechanisms between COPD and lung adenocarcinoma (LUAD), the most common pathologic type of lung cancer.12
Weighted gene co-expression network analysis (WGCNA) is an efficient systematic biological method to analyze the relationship between genes and diseases.13 WGCNA is characterized by clustering modules based on genes with similar expression profiles, which can analyze the relationship between modules and specific phenotypes, and further explore the signal pathways related to phenotypic features.14 Therefore, in this study, we constructed a co-expression network by WGCNA using available databases to identify susceptible genes in COPD with LUAD. Lung tissues from COPD patients with LUAD and a human LUAD cell line (A549) were used to validate the findings.
Materials and Methods
Microarray Data and Processing
Raw RNA sequence data of GSE106899 were downloaded from Gene Expression Omnibus (GEO, http://www.ncbi.nlm.nih.gov/geo/), including 66 lung tissues from COPD patients with or without LUAD. Raw data (raw reads) of FastQC format were firstly processed through in-house perl scripts. Next, clean data (clean reads) were obtained by removing reads containing adapter, reads containing ploy-N and low-quality reads. All the downstream analyses were based on clean reads with high quality. Clean reads were aligned to the reference genome (ftp://ftp.ensembl.org/pub/release-89/fasta/homo_sapiens/dna/Homo_sapiens.GRCh38.dna.toplevel.fa.gz) using HISAT2 version 2.1.0. Then, HTSeq version 0.6.1 was used to count the reads mapped to each gene (Gene annotation file: ftp://ftp.ebi.ac.uk/pub/databases/gencode/Gencode_human/release_29/gencode.v29. annotation.gtf.gz). Fragments per Kilobase per Million (FPKM) is commonly used to estimate gene expression levels, and the FPKM of each gene was then calculated based on the length of the gene and reads count mapped to this gene. Subsequently, four samples (GSM2857291, GSM2857323, GSM2857324, GSM2857325) were removed during FPKM valuation, since the gene expression was found to be discrete in the subsequent analyses. Afterwards, we selected the genes with FPKM value greater than 1 in 62 samples of the construction by the co-expression network.
Weighted Gene Co-Expression Network Analysis (WGCNA)
To find clusters (modules) of highly correlated genes, WGCNA was carried out on the selected 13,865 genes by the R language (version 3.5.3) with WGCNA package (version 1.67).13,15 The scale-free co-expression network was established using the WGCNA algorithm.13 Firstly, after removing the outlier samples, the correlation matrix between two genes was constructed using the main connecting rod and the Pearson’s correlation matrix. Secondly, the hierarchical clustering analysis was performed with the hclust R function, and the soft-threshold power was determined by analysis of network topology. The adjacency was transformed into a topological overlap matrix.16 Then, network construction and module detection were performed. We merged modules whose size less than minModuleSize (=30) into one module. The calculation process was performed by the blockwiseConsensusModules function in WGCNA package. According to the gene expression level, flashClust toolkit in R language was used for cluster analysis of samples.
Correlation Analysis of Modules and Traits
To assess the potential correlation between modules and traits, the module eigengene (ME) is utilized. MEs were regarded as the major component in the principal component analysis for each gene module and the expression patterns of all genes could be summarized into a single characteristic expression profile within a given module. Besides, we evaluated the correlation between MEs and tumor progression by Pearson’s correlation test to identify the tumor-related module. Then, the correlation between MEs and individual genes were assessed using signed module membership (MM). The module highly related to phenotype was selected as a tumor-related module for further analyses. When recording the tissue types, “1” stands for normal tissues in COPD, “2” stands for adjacent non-malignant tissue in COPD, “3” stands for lung tumor in COPD. All work was done using the R language with WGCNA package.13
Functional Enrichment Analyses
To investigate the potential mechanisms on module genes regulating tumor progressions, GO and KEGG enrichment analyses were performed utilizing the Database for Annotation, Visualization and Integrated Discovery (DAVID, version 6.8) by uploaded all correlated genes in tumor-related module, and KEGG orthology-based annotation system (KOBAS, version 3.0), respectively.17 Adjusted P-value < 0.05 was set as the threshold.
Screening for Hub Genes
To identify the hub genes, we selected the module most relevant to the trait, and then, protein–protein interactions (PPI) network was developed by using the online database STRING18 in the most relevant module. A protein interaction relationship network table was downloaded and visualized using Cytoscape software.19 The positively intramodular connectivities within the top 50 genes and PPI network were calculated according to the visualization results, and then sorted by the total amount of intramodular connectivity. The top three genes were regarded as “real” hub genes for further analyses.
Immunohistochemistry
Immunohistochemical analysis for “real” hub genes was performed on paraffin sections of resected lung tissues from patients with COPD and matched COPD with LUAD (Table 1). As described previously, the immuno-stained areas for hub genes were regarded as area of interest (AOI) to measure independently, followed by quantitative analyses with Image-Pro Plus 6.0 (Media Cybernetics Inc., Bethesda, MD, USA)20. The immunohistochemical study was approved by the Ethics Committee of Sichuan Provincial People’s Hospital and all patients provided written informed consents for participation in the study.
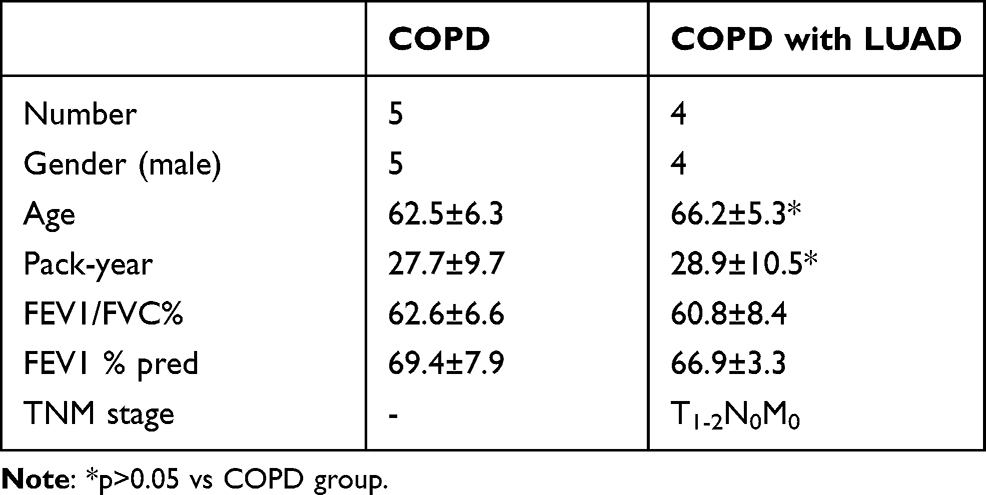 |
Table 1 Clinical Data of Subjects |
Cell Culture and Real-Time PCR
Human LUAD cell line (A549), purchased from the American Type Culture Collection (ATCC, Manassas, VA, USA), was cultured in RPMI 1640 media supplemented with 10% fetal bovine serum, 1% antibiotics (penicillin and streptomycin sulfate) under the condition with 5% CO2 at 37 °C. Cigarette smoke extract (CSE) was prepared according to a previous article.21 Briefly, the smoke was generated from commercial cigarettes with 1.0 mg nicotine and 14 mg tar per cigarette, and each cigarette was yielded five draws by a 50mL syringe with almost 10 seconds for each draw, which was dissolved into 5mL of serum-free RPMI 1640 culture medium, then adjusted to 7.4 of pH value and finally sterilized with a 0.22-mm syringe filter. The prepared CSE was termed 100% of concentration and used in this study with dilutions between 2% and 16%. Besides, the cell viability was determined with a Cell Counting Kit-8 (CCK-8, Dojindo Laboratories, Tokyo, Japan) according to the protocol of manufacturers. Briefly, A549 cells were seeded into 96-well plates with at the density of 5000 per well and cultured in RPMI 1640 media containing serum for 24h, which were followed by treatment with different concentrations of CSE (0, 2%, 4%, 8%, 10%, 12% and 16%) for 24, 48, 72 hours, respectively. Thereafter, 10μL of CCK8 solution was added to each well for another 1-hour incubation, and the absorbance at 450 nm was finally measured.
The total RNA was isolated from A549 cells using the Total RNA Kit I (Omega Bio-Tek, USA), and cDNA was then synthesized from total RNA using PrimeiScript RT reagent Kit (TaKaRa), according to the manufacturer’s protocol. Next, the PCR reaction was performed in triplicates with FastStart Essential DNA Green Master (Roche), using the specific primers (Table S1). The relative PCR amplification was conducted using the LightCycler® 96 PCR system (Roche Molecular Systems, USA). Briefly, preincubation (95°C for 10 minutes for 1 cycle) was firstly performed, and a 3‐step amplification was then followed as 95°C for 10 seconds, Tm for 15 seconds and 72°C for 15 seconds for 40 cycles, and in final step, it is melting, including 95°C for 10 seconds, 65°C for 60 seconds and 97°C for 1 seconds for 1 cycle. All data were normalized to GAPDH gene expression, and relative expression levels were determined using the 2-ΔΔCt method.
Statistical Analyses
All the original data were presented as mean ± SD using the SPSS 21 for Windows. Comparisons between the two groups were performed with the t-test. The original data, which did not coincided with a normal distribution, were performed using Kruskal–Wallis test. P<0.05 was considered statistically significant.
Results
Construction of Weighted Gene Co-Expression Network
The analysis process of this study is shown in Figure 1. A total of 13,865 genes were considered as the candidate genes in 62 samples, which were used for the construction of weighted gene co-expression networks by WGCNA package based on R language. Cluster analysis was performed on these samples using the flashclust toolkit, and the results are shown in Figure 2. The threshold power of β is an important parameter for constructing co-expression modules, which mainly reflects the size independence and average connectivity of modules. As shown in Figure 3, when β=4, the scale independence reached 0.9 (Figure 3A) and the mean connectivity was high (Figure 3B). Therefore, β=4 was used to construct the co-expression module, and the results of WGCNA showed that a total of 20 modules were identified with different colors (Figure 3C). Furthermore, the gray module was utilized for housing genes that were not co-expressed with other genes, and these genes could not be assigned to any of other modules and would be ignored in the following study. The number of genes in each module was shown in Table S2.
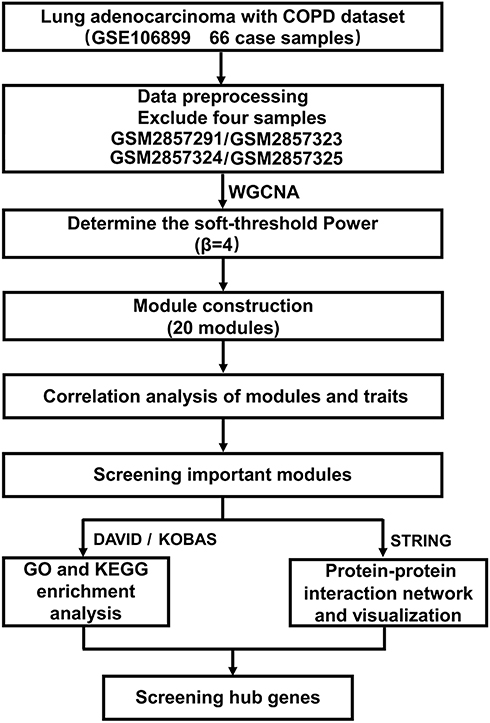 |
Figure 1 The analysis process of this study. |
 |
Figure 2 Sample clustering to detect outliers. |
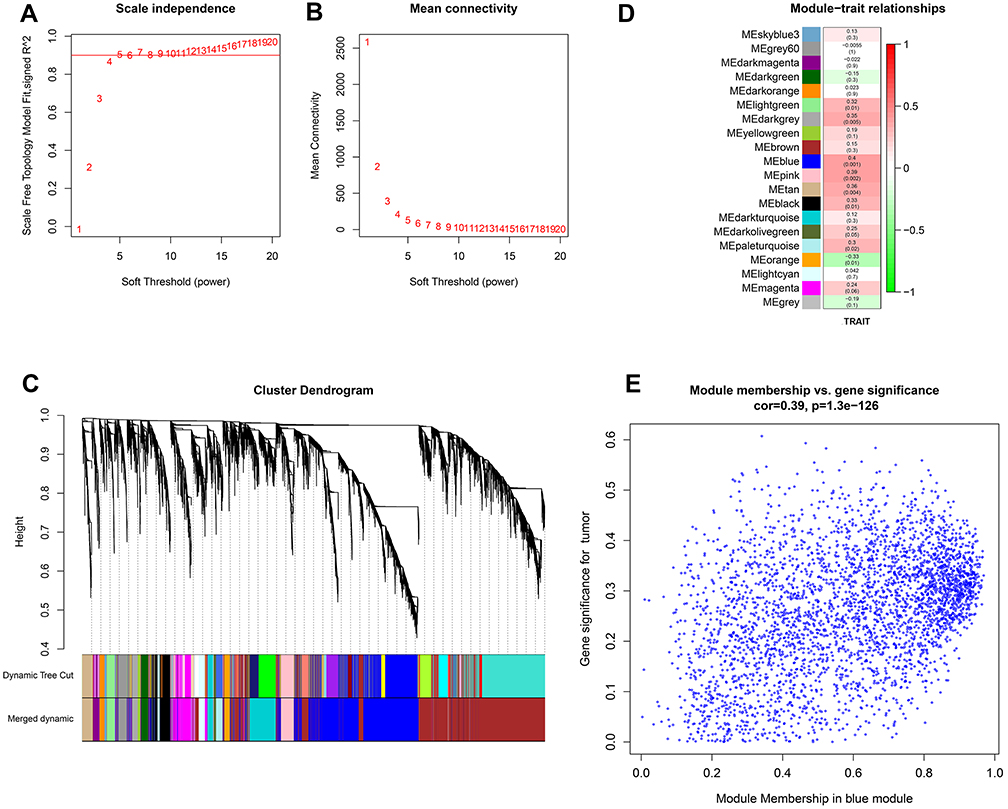 |
Figure 3 Weighted gene co-expression network analysis (WGCNA). (A) Analysis of scale independence of co-expressed module genes under different soft-threshold powers. (B) Analysis of average connectivity of co-expression module genes under different soft-threshold powers. (C) Construction of genes coexpression modules by WGCNA. (D) Heatmap of module–trait relationships between module eigengenes and clinical traits. (E) Scatterplots of gene significance (GS) for COPD profile traits and module membership (MM) in the blue module. |
Correlation Between Co-Expression Modules and Traits
WGCNA was used to correlate each module with all clinical traits. The blue module (3475 genes) had the most highly positive correlation with the clinical phenotype (Figure 3D). A P-value was then calculated for each module‐trait correlation. Consequently, the blue module (cor=0.4, P=0.001), mostly related to tumor progressions in COPD with LUAD, was selected as the target module. Gene significance (GS), defined as the correlation between gene expression and COPD traits, was put in relation to MM, defined as the correlation between the ME and gene expression profile. The scatter plot of GS vs MM for the blue module was also performed (Figure 3E).
Functional Enrichment Analyses on the Blue Module
GO and KEGG enrichment analyses were performed on the blue module, which was mostly correlated with tumor progression of COPD with LUAD. GO enrichment analysis showed that the genes in the blue module were significantly enriched in multiple biological processes related to cell division, regulation of transcription, DNA replication, etc. (Figure 4A and Table S3). Moreover, KEGG enrichment analysis indicated the genes mainly participated in pathways involving cancer, cell cycles, AMPK signaling pathway, etc. (Figure 4B and Table S4).
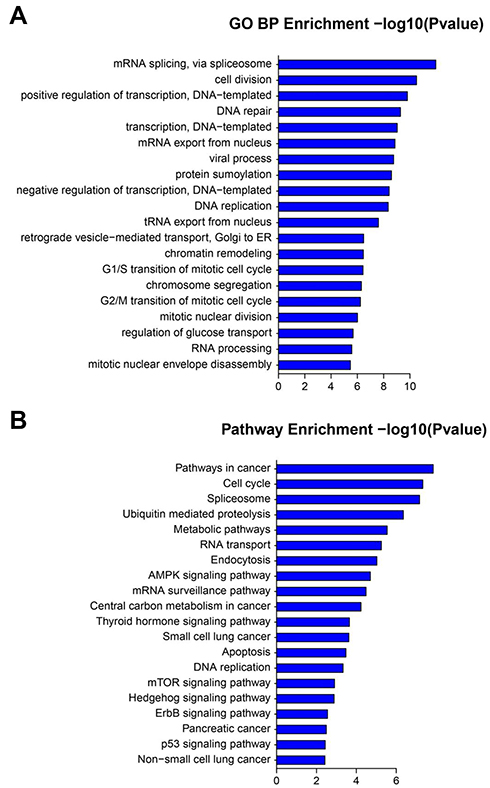 |
Figure 4 (A) GO biological process analysis and (B) KEGG analysis of genes in the blue module. |
Visualization for the Hub Genes
In addition, we selected the top 50 genes in the blue module, which strongly correlated with tumor progressions in COPD with LUAD, and then imported into Cytoscape for visualization (Figure 5A). PPI network in the tumor-related module was also visualized with the STRING (Figure 5B). According to the total number of intramodular connectivity in gene–gene interactions and PPI network in the blue module, the top 3 genes (MTA1, PKMYT1 and FZR1) were selected as hub genes (Table 2 and S5) for further analyses.
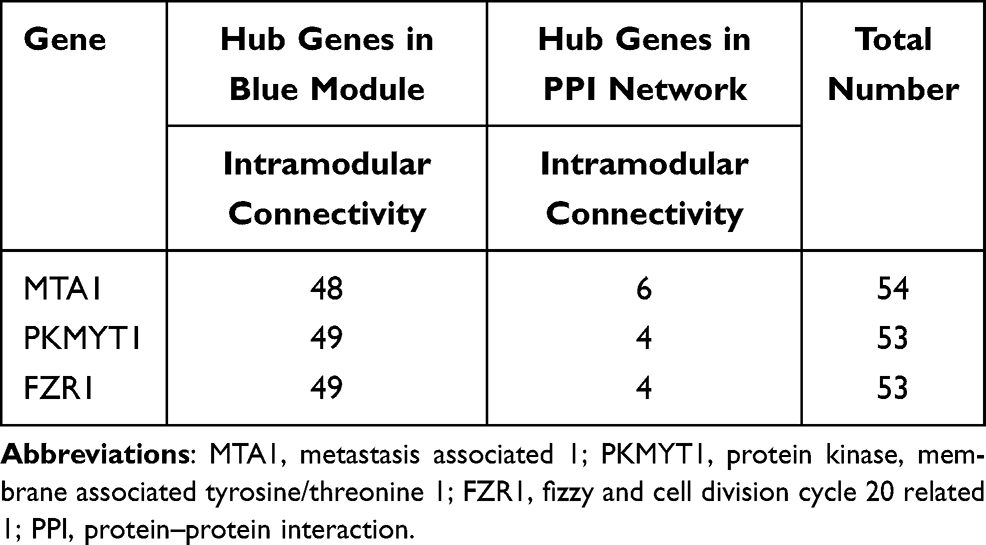 |
Table 2 Hub Genes Selected by Total Number of Intramodular Connectivity |
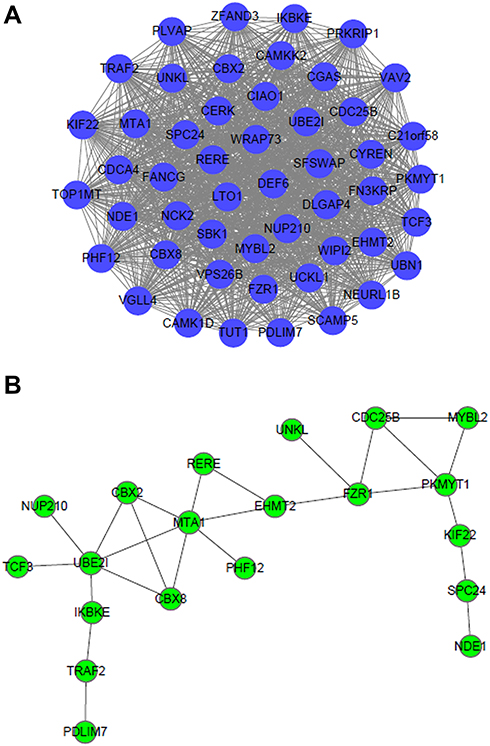 |
Figure 5 Visualization for (A) gene–gene interactions and (B) PPI network of the top 50 genes in the blue module. |
Expression of MTA1, PKMYT1 and FZR1 in Lung Tissues
Lung tissues from COPD and COPD with LUAD patients were used to immunostain with MTA1, PKMYT1 and FZR1 antibodies (Figure 6A). Immunohistochemical analysis revealed that only FZR1 was significantly overexpressed in lung tissues of COPD with LUAD compared with COPD (Figure 6B).
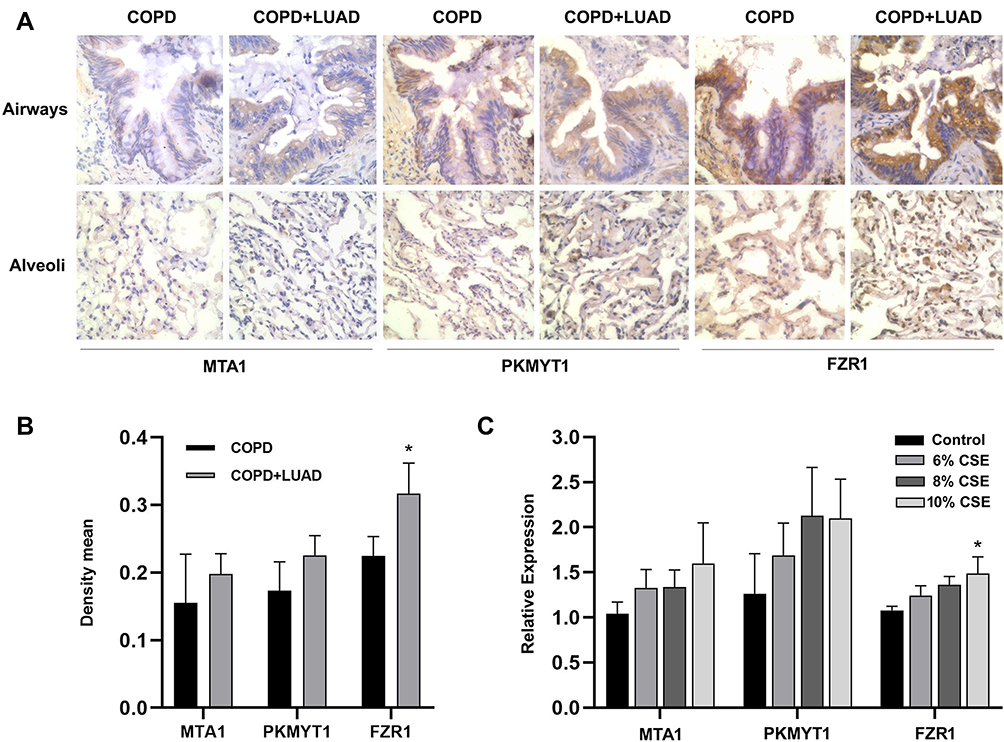 |
Figure 6 (A) The immunostaining of MTA1, PKMYT1 and FZR1 in lung tissues of COPD patients with or without lung adenocarcinoma. ×600 magnification. (B) The mean density of the immunohistochemical images of MTA1, PKMYT1 and FZR1. *P<0.05 vs COPD group. (C) The expression of MTA1, PKMYT1 and FZR1 gene in CSE-exposed A549 cells. *P<0.05 vs control group. |
Expression of MTA1, PKMYT1 and FZR1 Genes in A549 Cells After CSE Stimulation
A549 cells were exposed to CSE at different concentrations (0–16%) and incubated for up to 72h. Cell growth was assessed by CCK8 assay (Supplementary Figure S1). According to the cell growth assessment, we treated A549 cells with 6%, 8% and 10% for 48h. The results of real-time PCR showed that only FZR1 gene expression was increased than controls in a dose-dependent manner after 48h CSE exposure (Figure 6C).
Discussion
In this study, we used a RNA sequence data of 62 lung tissue samples from the patients of COPD with LUAD to construct co-expression modules by WGCNA. As a result, a co-expression module (blue) was identified to be mostly associated with tumor progression in COPD with LUAD. Functional enrichment analyses further indicated these genes in the blue module were mainly enriched in biological processes and pathways related to tumorigenesis. According to the visualization of intramodular connectivity, three genes (MTA1, PKMYT1 and FZR1) in the blue module were finally selected as hub genes.
Overexpression of MTA1 and PKMYT1 has been reported in a variety of carcinomas, including lung cancer (adenocarcinoma), which widely contributes to tumorigenesis, invasion, metastasis, recurrence and poor prognosis,22–25 mainly via regulation of p53 stability and function, and G2/M transformation of cell cycle, respectively.26,27 However, the overexpression of MTA1 and PKMYT1 was not validated in the present study.
Differently, FZR1 plays a crucial, but controversial role in tumorigenesis, by regulates cell proliferation via targeting multiple cell cycle regulators for dependent degradation.28,29 Some studies suggested that genomic stability was associated with FZR1,30,31 and FZR1 might be a tumor suppressor gene in tumor development.30,32 However, others reported FZR1 was overexpressed in malignant tumors,33,34 and might contribute to over-replication of the genome and lead to genomic instability,29 which may promote tumor development in specific tumors.33 In this study, the overexpression of FZR1 gene was firstly validated in lung tissues from COPD with LUAD and also A549 cells exposed to CSE, a common risk factor for COPD and lung cancer. Noticeably, FZR1 gene expression was statistically enhanced in both airways and alveoli in COPD patients with LUAD. These data indicated FZR1 might play a key role in tumorigenesis of LUAD in patients with COPD.
Overall, among the three hub genes (MTA1, PKMYT1 and FZR1) identified in the present study, only FZR1 but not MTA1 and PKMYT1, was validated to be associated with tumor progression in COPD with LUAD, which may provide a novel genetic target for detecting coexisting mechanisms of COPD and LUAD, and a new genetic biomarker in screening high risk for tumorigenesis of LUAD in COPD patients.
Data Sharing Statement
All data used to support the findings of the current study are available from Gene Expression Omnibus (https://www.ncbi.nlm.nih.gov/geo/query/acc.cgi?acc= GSE106899).
Author Contributions
All authors made a significant contribution to the work reported, whether that is in the conception, study design, execution, acquisition of data, analysis and interpretation, or in all these areas; took part in drafting, revising or critically reviewing the article; gave final approval of the version to be published; have agreed on the journal to which the article has been submitted; and agree to be accountable for all aspects of the work.
Disclosure
The abstract of this paper was presented at the European Respiratory Society Conference, name Co-expression modules construction by WGCNA and identification of susceptible genes of chronic obstructive pulmonary disease with lung adenocarcinomas as a poster presentation. The poster’s abstract was published in Poster Abstracts in European Respiratory Journal, name Co-expression modules construction by WGCNA and identification of susceptible genes of chronic obstructive pulmonary disease with lung adenocarcinomas: https://erj.ersjournals.com/content/56/suppl_64/331. And all authors declare no conflict of interests in this work.
References
1. Ferkol T, Schraufnagel D. The global burden of respiratory disease. Ann Am Thorac Soc. 2014;11(3):404–406. doi:10.1513/AnnalsATS.201311-405PS
2. Wang W, Xie M, Dou S, et al. The link between chronic obstructive pulmonary disease phenotypes and histological subtypes of lung cancer: a case-control study. Int J Chron Obstruct Pulmon Dis. 2018;13:1167–1175. doi:10.2147/COPD.S158818
3. Zamarron E, Prats E, Tejero E, et al. Static lung hyperinflation is an independent risk factor for lung cancer in patients with chronic obstructive pulmonary disease. Lung Cancer. 2019;128:40–46. doi:10.1016/j.lungcan.2018.12.012
4. Husebo GR, Nielsen R, Hardie J, et al. Risk factors for lung cancer in COPD - results from the Bergen COPD cohort study. Respir Med. 2019;152:81–88. doi:10.1016/j.rmed.2019.04.019
5. Young RP, Duan F, Chiles C, et al. Airflow limitation and histology shift in the national lung screening Trial. The NLST-ACRIN Cohort Substudy. Am J Respir Crit Care Med. 2015;192(9):1060–1067. doi:10.1164/rccm.201505-0894OC
6. Carr LL, Jacobson S, Lynch DA, et al. Features of COPD as predictors of lung cancer. Chest. 2018;153(6):1326–1335. doi:10.1016/j.chest.2018.01.049
7. Young RP, Hopkins RJ, Christmas T, et al. COPD prevalence is increased in lung cancer, independent of age, sex and smoking history. Eur Respir J. 2009;34(2):380–386. doi:10.1183/09031936.00144208
8. Wilson DO, Weissfeld JL, Balkan A, et al. Association of radiographic emphysema and airflow obstruction with lung cancer. Am J Respir Crit Care Med. 2008;178(7):738–744. doi:10.1164/rccm.200803-435OC
9. Durham AL, Adcock IM. The relationship between COPD and lung cancer. Lung Cancer. 2015;90(2):121–127. doi:10.1016/j.lungcan.2015.08.017
10. Houghton AM. Mechanistic links between COPD and lung cancer. Nat Rev Cancer. 2013;13(4):233–245. doi:10.1038/nrc3477
11. Caramori G, Ruggeri P, Mumby S, et al. Molecular links between COPD and lung cancer: new targets for drug discovery? Expert Opin Ther Targets. 2019;23(6):539–553. doi:10.1080/14728222.2019.1615884
12. Yang H, Zhang H, Pan T, Wang H, Wang Y. Benzo(a)pyrene promotes migration, invasion and metastasis of lung adenocarcinoma cells by upregulating TGIF. Toxicol Lett. 2018;294:11–19. doi:10.1016/j.toxlet.2018.05.005
13. Langfelder P, Horvath S. WGCNA: an R package for weighted correlation network analysis. BMC Bioinform. 2008;9(1):559. doi:10.1186/1471-2105-9-559
14. Radulescu E, Jaffe AE, Straub RE, et al. Identification and prioritization of gene sets associated with schizophrenia risk by co-expression network analysis in human brain. Mol Psychiatry. 2018;25(4):791–804. doi:10.1038/s41380-018-0304-1
15. Langfelder P, Horvath S. Fast R functions for robust correlations and hierarchical clustering. J Stat Softw. 2012;46(11):11. doi:10.18637/jss.v046.i11
16. Botia JA, Vandrovcova J, Forabosco P, et al. An additional k-means clustering step improves the biological features of WGCNA gene co-expression networks. BMC Syst Biol. 2017;11(1):47. doi:10.1186/s12918-017-0420-6
17. Huang da W, Sherman BT, Lempicki RA. Systematic and integrative analysis of large gene lists using DAVID bioinformatics resources. Nat Protoc. 2009;4(1):44–57. doi:10.1038/nprot.2008.211
18. Szklarczyk D, Morris JH, Cook H, et al. The STRING database in 2017: quality-controlled protein-protein association networks, made broadly accessible. Nucleic Acids Res. 2017;45(D1):D362–d368. doi:10.1093/nar/gkw937
19. Shannon P, Markiel A, Ozier O, et al. Cytoscape: a software environment for integrated models of biomolecular interaction networks. Genome Res. 2003;13(11):2498–2504. doi:10.1101/gr.1239303
20. Zhao S, Wang X, Li N, et al. Effects of strontium ranelate on bone formation in the mid-palatal suture after rapid maxillary expansion. Drug Des Devel Ther. 2015;9:2725–2734. doi:10.2147/DDDT.S82892
21. Guo L, Wang T, Wu Y, et al. WNT/beta-catenin signaling regulates cigarette smoke-induced airway inflammation via the PPARdelta/p38 pathway. Lab Invest. 2016;96(2):218–229. doi:10.1038/labinvest.2015.101
22. Liu Y, Chen D, Qiu X, et al. Relationship between MTA1 and spread through air space and their joint influence on prognosis of patients with stage I-III lung adenocarcinoma. Lung Cancer. 2018;124:211–218. doi:10.1016/j.lungcan.2018.07.040
23. Sen N, Gui B, Kumar R. Role of MTA1 in cancer progression and metastasis. Cancer Metastasis Rev. 2014;33(4):879–889. doi:10.1007/s10555-014-9515-3
24. Liu L, Wu J, Wang S, et al. PKMYT1 promoted the growth and motility of hepatocellular carcinoma cells by activating beta-catenin/TCF signaling. Exp Cell Res. 2017;358(2):209–216. doi:10.1016/j.yexcr.2017.06.014
25. Sun QS, Luo M, Zhao HM, Sun H. Overexpression of PKMYT1 indicates the poor prognosis and enhances proliferation and tumorigenesis in non-small cell lung cancer via activation of Notch signal pathway. Eur Rev Med Pharmacol Sci. 2019;23(10):4210–4219. doi:10.26355/eurrev_201905_17925
26. Li DQ, Divijendra Natha Reddy S, Pakala SB, et al. MTA1 coregulator regulates p53 stability and function. J Biol Chem. 2009;284(50):34545–34552. doi:10.1074/jbc.M109.056499
27. Rohe A, Erdmann F, Bassler C, et al. In vitro and in silico studies on substrate recognition and acceptance of human PKMYT1, a Cdk1 inhibitory kinase. Bioorg Med Chem Lett. 2012;22(2):1219–1223. doi:10.1016/j.bmcl.2011.11.064
28. Eguren M, Manchado E, Malumbres M. Non-mitotic functions of the Anaphase-Promoting Complex. Semin Cell Dev Biol. 2011;22(6):572–578. doi:10.1016/j.semcdb.2011.03.010
29. Sorensen CS, Lukas C, Kramer ER, et al. Nonperiodic activity of the human anaphase-promoting complex-Cdh1 ubiquitin ligase results in continuous DNA synthesis uncoupled from mitosis. Mol Cell Biol. 2000;20(20):7613–7623. doi:10.1128/MCB.20.20.7613-7623.2000
30. Garcia-Higuera I, Manchado E, Dubus P, et al. Genomic stability and tumour suppression by the APC/C cofactor Cdh1. Nat Cell Biol. 2008;10(7):802–811. doi:10.1038/ncb1742
31. Lafranchi L, De Boer HR, De Vries EGE, et al. APC/CCdh1 controls CtIP stability during the cell cycle and in response to DNA damage. EMBO J. 2014;33(23):2860–2879. doi:10.15252/embj.201489017
32. Wan L, Chen M, Cao J, et al. The APC/C E3 ligase complex activator FZR1 restricts BRAF oncogenic function. Cancer Discov. 2017;7(4):424–441. doi:10.1158/2159-8290.CD-16-0647
33. Lehman NL, Tibshirani R, Hsu JY, et al. Oncogenic regulators and substrates of the anaphase promoting complex/cyclosome are frequently overexpressed in malignant tumors. Am J Pathol. 2007;170(5):1793–1805. doi:10.2353/ajpath.2007.060767
34. Crawford LJ, Anderson G, Johnston CK, Irvine AE. Identification of the APC/C co-factor FZR1 as a novel therapeutic target for multiple myeloma. Oncotarget. 2016;7(43):70481–70493. doi:10.18632/oncotarget.12026
 © 2021 The Author(s). This work is published and licensed by Dove Medical Press Limited. The
full terms of this license are available at https://www.dovepress.com/terms
and incorporate the Creative Commons Attribution
- Non Commercial (unported, 3.0) License.
By accessing the work you hereby accept the Terms. Non-commercial uses of the work are permitted
without any further permission from Dove Medical Press Limited, provided the work is properly
attributed. For permission for commercial use of this work, please see paragraphs 4.2 and 5 of our Terms.
© 2021 The Author(s). This work is published and licensed by Dove Medical Press Limited. The
full terms of this license are available at https://www.dovepress.com/terms
and incorporate the Creative Commons Attribution
- Non Commercial (unported, 3.0) License.
By accessing the work you hereby accept the Terms. Non-commercial uses of the work are permitted
without any further permission from Dove Medical Press Limited, provided the work is properly
attributed. For permission for commercial use of this work, please see paragraphs 4.2 and 5 of our Terms.